Baltimore city, MD
Baltimore city Map
Baltimore city Overview
584,548
TOTAL POPULATION
273,088
MALE POPULATION
311,460
FEMALE POPULATION
87.68
MALES / 100 FEMALES
114.05
FEMALES / 100 MALES
36.0
MEDIAN AGE
3.2
AVG FAMILY SIZE
2.3
AVG HOUSEHOLD SIZE
$37,845
PER CAPITA INCOME
$72,972
AVG FAMILY INCOME
$58,349
AVG HOUSEHOLD INCOME
11.6%
WAGE / INCOME GAP [ % ]
88.4¢/ $1
WAGE / INCOME GAP [ $ ]
$11,956
FAMILY INCOME DEFICIT
0.52
INEQUALITY / GINI INDEX
296,534
LABOR FORCE [ PEOPLE ]
62.1%
PERCENT IN LABOR FORCE
6.9%
UNEMPLOYMENT RATE
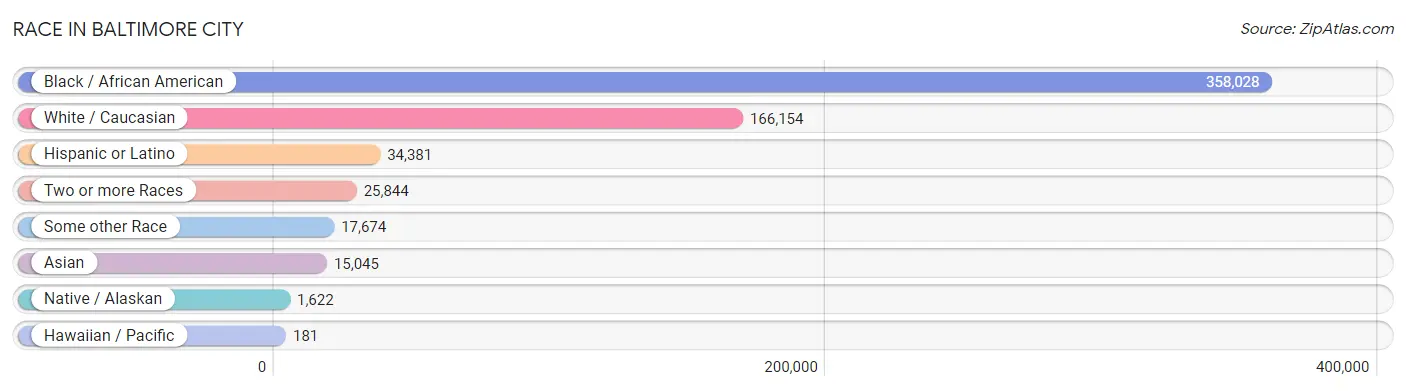
Race in Baltimore city
The most populous races in Baltimore city are Black / African American (358,028 | 61.3%), White / Caucasian (166,154 | 28.4%), and Hispanic or Latino (34,381 | 5.9%).
| Race | # Population | % Population |
| Asian | 15,045 | 2.6% |
| Black / African American | 358,028 | 61.3% |
| Hawaiian / Pacific | 181 | 0.0% |
| Hispanic or Latino | 34,381 | 5.9% |
| Native / Alaskan | 1,622 | 0.3% |
| White / Caucasian | 166,154 | 28.4% |
| Two or more Races | 25,844 | 4.4% |
| Some other Race | 17,674 | 3.0% |
| Total | 584,548 | 100.0% |
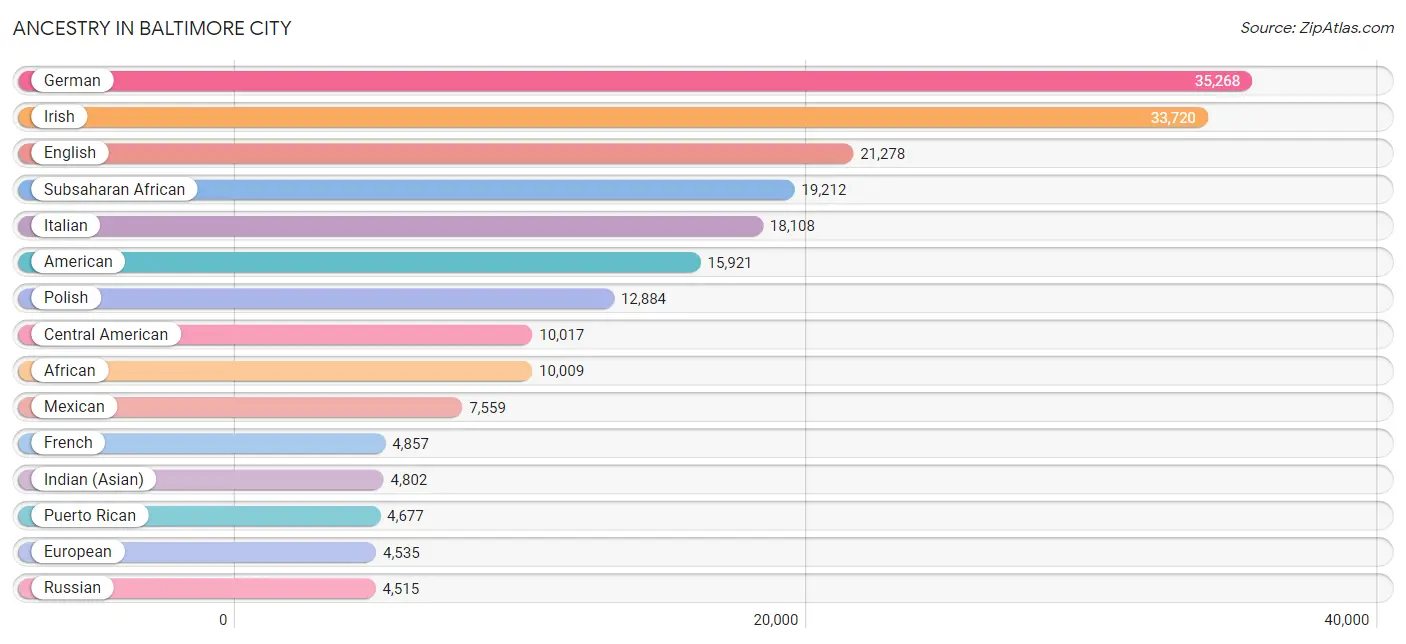
Ancestry in Baltimore city
The most populous ancestries reported in Baltimore city are German (35,268 | 6.0%), Irish (33,720 | 5.8%), English (21,278 | 3.6%), Subsaharan African (19,212 | 3.3%), and Italian (18,108 | 3.1%), together accounting for 21.8% of all Baltimore city residents.
| Ancestry | # Population | % Population |
| Afghan | 45 | 0.0% |
| African | 10,009 | 1.7% |
| Alaska Native | 43 | 0.0% |
| Albanian | 10 | 0.0% |
| Alsatian | 15 | 0.0% |
| American | 15,921 | 2.7% |
| Apache | 39 | 0.0% |
| Arab | 3,482 | 0.6% |
| Argentinean | 401 | 0.1% |
| Armenian | 274 | 0.1% |
| Australian | 90 | 0.0% |
| Austrian | 634 | 0.1% |
| Bahamian | 32 | 0.0% |
| Bangladeshi | 6 | 0.0% |
| Barbadian | 395 | 0.1% |
| Basque | 21 | 0.0% |
| Belgian | 193 | 0.0% |
| Belizean | 21 | 0.0% |
| Bermudan | 29 | 0.0% |
| Bhutanese | 914 | 0.2% |
| Blackfeet | 616 | 0.1% |
| Bolivian | 141 | 0.0% |
| Brazilian | 749 | 0.1% |
| British | 2,556 | 0.4% |
| British West Indian | 213 | 0.0% |
| Bulgarian | 41 | 0.0% |
| Burmese | 2,480 | 0.4% |
| Cajun | 151 | 0.0% |
| Cambodian | 7 | 0.0% |
| Canadian | 437 | 0.1% |
| Cape Verdean | 63 | 0.0% |
| Celtic | 14 | 0.0% |
| Central American | 10,017 | 1.7% |
| Central American Indian | 347 | 0.1% |
| Cherokee | 1,250 | 0.2% |
| Chickasaw | 28 | 0.0% |
| Chilean | 166 | 0.0% |
| Chinese | 12 | 0.0% |
| Chippewa | 69 | 0.0% |
| Choctaw | 92 | 0.0% |
| Colombian | 446 | 0.1% |
| Costa Rican | 105 | 0.0% |
| Cree | 17 | 0.0% |
| Creek | 49 | 0.0% |
| Croatian | 202 | 0.0% |
| Cuban | 1,863 | 0.3% |
| Cypriot | 12 | 0.0% |
| Czech | 1,480 | 0.3% |
| Czechoslovakian | 308 | 0.1% |
| Danish | 527 | 0.1% |
| Delaware | 12 | 0.0% |
| Dominican | 2,231 | 0.4% |
| Dutch | 1,831 | 0.3% |
| Dutch West Indian | 59 | 0.0% |
| Eastern European | 2,324 | 0.4% |
| Ecuadorian | 974 | 0.2% |
| Egyptian | 330 | 0.1% |
| English | 21,278 | 3.6% |
| Estonian | 58 | 0.0% |
| Ethiopian | 1,286 | 0.2% |
| European | 4,535 | 0.8% |
| Fijian | 15 | 0.0% |
| Filipino | 473 | 0.1% |
| Finnish | 349 | 0.1% |
| French | 4,857 | 0.8% |
| French American Indian | 31 | 0.0% |
| French Canadian | 1,187 | 0.2% |
| German | 35,268 | 6.0% |
| Ghanaian | 733 | 0.1% |
| Greek | 2,256 | 0.4% |
| Guamanian / Chamorro | 100 | 0.0% |
| Guatemalan | 2,107 | 0.4% |
| Guyanese | 691 | 0.1% |
| Haitian | 759 | 0.1% |
| Honduran | 2,679 | 0.5% |
| Hopi | 8 | 0.0% |
| Hungarian | 1,757 | 0.3% |
| Icelander | 144 | 0.0% |
| Indian (Asian) | 4,802 | 0.8% |
| Indonesian | 71 | 0.0% |
| Inupiat | 13 | 0.0% |
| Iranian | 1,245 | 0.2% |
| Iraqi | 195 | 0.0% |
| Irish | 33,720 | 5.8% |
| Iroquois | 70 | 0.0% |
| Israeli | 320 | 0.1% |
| Italian | 18,108 | 3.1% |
| Jamaican | 3,564 | 0.6% |
| Japanese | 19 | 0.0% |
| Jordanian | 68 | 0.0% |
| Kenyan | 398 | 0.1% |
| Korean | 3,031 | 0.5% |
| Laotian | 432 | 0.1% |
| Latvian | 271 | 0.1% |
| Lebanese | 497 | 0.1% |
| Liberian | 296 | 0.1% |
| Lithuanian | 1,078 | 0.2% |
| Lumbee | 251 | 0.0% |
| Luxembourger | 8 | 0.0% |
| Malaysian | 54 | 0.0% |
| Maltese | 38 | 0.0% |
| Mexican | 7,559 | 1.3% |
| Mexican American Indian | 243 | 0.0% |
| Mongolian | 8 | 0.0% |
| Moroccan | 252 | 0.0% |
| Native Hawaiian | 339 | 0.1% |
| Navajo | 110 | 0.0% |
| New Zealander | 8 | 0.0% |
| Nicaraguan | 329 | 0.1% |
| Nigerian | 4,512 | 0.8% |
| Northern European | 361 | 0.1% |
| Norwegian | 1,388 | 0.2% |
| Okinawan | 58 | 0.0% |
| Pakistani | 240 | 0.0% |
| Palestinian | 69 | 0.0% |
| Panamanian | 462 | 0.1% |
| Paraguayan | 54 | 0.0% |
| Pennsylvania German | 69 | 0.0% |
| Peruvian | 970 | 0.2% |
| Polish | 12,884 | 2.2% |
| Portuguese | 844 | 0.1% |
| Puerto Rican | 4,677 | 0.8% |
| Romanian | 451 | 0.1% |
| Russian | 4,515 | 0.8% |
| Salvadoran | 4,318 | 0.7% |
| Samoan | 85 | 0.0% |
| Scandinavian | 649 | 0.1% |
| Scotch-Irish | 2,100 | 0.4% |
| Scottish | 4,108 | 0.7% |
| Seminole | 26 | 0.0% |
| Senegalese | 55 | 0.0% |
| Serbian | 163 | 0.0% |
| Sierra Leonean | 113 | 0.0% |
| Sioux | 178 | 0.0% |
| Slavic | 163 | 0.0% |
| Slovak | 546 | 0.1% |
| Slovene | 124 | 0.0% |
| South African | 79 | 0.0% |
| South American | 3,514 | 0.6% |
| South American Indian | 342 | 0.1% |
| Spaniard | 766 | 0.1% |
| Spanish | 1,759 | 0.3% |
| Sri Lankan | 858 | 0.2% |
| Subsaharan African | 19,212 | 3.3% |
| Sudanese | 535 | 0.1% |
| Swedish | 1,660 | 0.3% |
| Swiss | 735 | 0.1% |
| Syrian | 946 | 0.2% |
| Thai | 4,334 | 0.7% |
| Tlingit-Haida | 5 | 0.0% |
| Tongan | 8 | 0.0% |
| Trinidadian and Tobagonian | 2,464 | 0.4% |
| Turkish | 229 | 0.0% |
| U.S. Virgin Islander | 50 | 0.0% |
| Ugandan | 37 | 0.0% |
| Ukrainian | 1,106 | 0.2% |
| Venezuelan | 362 | 0.1% |
| Vietnamese | 115 | 0.0% |
| Welsh | 1,655 | 0.3% |
| West Indian | 1,391 | 0.2% |
| Yugoslavian | 158 | 0.0% |
| Zimbabwean | 35 | 0.0% | View All 162 Rows |
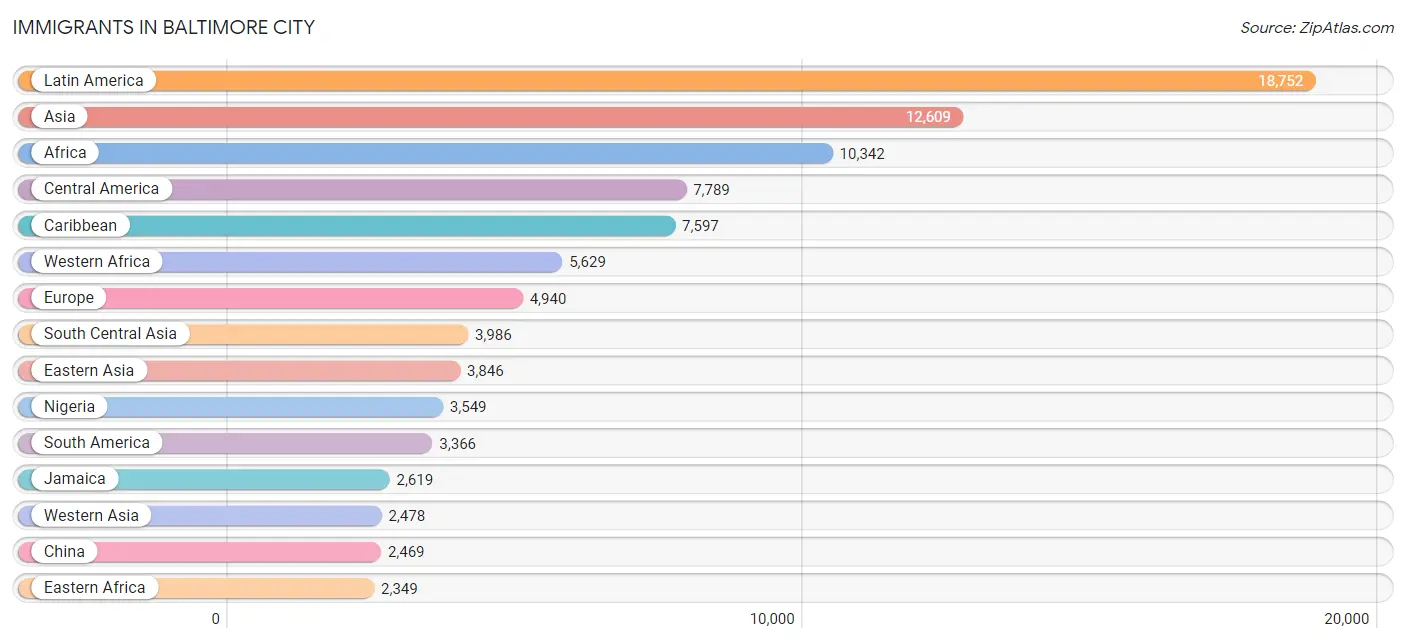
Immigrants in Baltimore city
The most numerous immigrant groups reported in Baltimore city came from Latin America (18,752 | 3.2%), Asia (12,609 | 2.2%), Africa (10,342 | 1.8%), Central America (7,789 | 1.3%), and Caribbean (7,597 | 1.3%), together accounting for 9.8% of all Baltimore city residents.
| Immigration Origin | # Population | % Population |
| Afghanistan | 45 | 0.0% |
| Africa | 10,342 | 1.8% |
| Argentina | 244 | 0.0% |
| Armenia | 24 | 0.0% |
| Asia | 12,609 | 2.2% |
| Australia | 188 | 0.0% |
| Austria | 41 | 0.0% |
| Azores | 58 | 0.0% |
| Bahamas | 23 | 0.0% |
| Bangladesh | 111 | 0.0% |
| Barbados | 294 | 0.1% |
| Belarus | 109 | 0.0% |
| Belgium | 123 | 0.0% |
| Belize | 8 | 0.0% |
| Bolivia | 48 | 0.0% |
| Bosnia and Herzegovina | 48 | 0.0% |
| Brazil | 464 | 0.1% |
| Bulgaria | 73 | 0.0% |
| Cameroon | 306 | 0.1% |
| Canada | 624 | 0.1% |
| Caribbean | 7,597 | 1.3% |
| Central America | 7,789 | 1.3% |
| Chile | 58 | 0.0% |
| China | 2,469 | 0.4% |
| Colombia | 394 | 0.1% |
| Congo | 48 | 0.0% |
| Costa Rica | 50 | 0.0% |
| Croatia | 6 | 0.0% |
| Cuba | 418 | 0.1% |
| Czechoslovakia | 91 | 0.0% |
| Denmark | 73 | 0.0% |
| Dominica | 39 | 0.0% |
| Dominican Republic | 1,282 | 0.2% |
| Eastern Africa | 2,349 | 0.4% |
| Eastern Asia | 3,846 | 0.7% |
| Eastern Europe | 1,485 | 0.3% |
| Ecuador | 988 | 0.2% |
| Egypt | 329 | 0.1% |
| El Salvador | 2,294 | 0.4% |
| England | 367 | 0.1% |
| Eritrea | 140 | 0.0% |
| Ethiopia | 876 | 0.2% |
| Europe | 4,940 | 0.9% |
| France | 211 | 0.0% |
| Germany | 876 | 0.2% |
| Ghana | 392 | 0.1% |
| Greece | 317 | 0.1% |
| Grenada | 77 | 0.0% |
| Guatemala | 1,730 | 0.3% |
| Guyana | 465 | 0.1% |
| Haiti | 358 | 0.1% |
| Honduras | 1,628 | 0.3% |
| Hong Kong | 131 | 0.0% |
| Hungary | 119 | 0.0% |
| India | 1,747 | 0.3% |
| Indonesia | 305 | 0.1% |
| Iran | 671 | 0.1% |
| Iraq | 256 | 0.0% |
| Ireland | 98 | 0.0% |
| Israel | 293 | 0.1% |
| Italy | 264 | 0.1% |
| Jamaica | 2,619 | 0.4% |
| Japan | 276 | 0.1% |
| Jordan | 47 | 0.0% |
| Kenya | 868 | 0.2% |
| Korea | 1,101 | 0.2% |
| Kuwait | 25 | 0.0% |
| Laos | 54 | 0.0% |
| Latin America | 18,752 | 3.2% |
| Latvia | 17 | 0.0% |
| Lebanon | 69 | 0.0% |
| Liberia | 322 | 0.1% |
| Malaysia | 22 | 0.0% |
| Mexico | 1,761 | 0.3% |
| Middle Africa | 585 | 0.1% |
| Morocco | 71 | 0.0% |
| Nepal | 665 | 0.1% |
| Netherlands | 66 | 0.0% |
| Nicaragua | 173 | 0.0% |
| Nigeria | 3,549 | 0.6% |
| Northern Africa | 642 | 0.1% |
| Northern Europe | 1,145 | 0.2% |
| Oceania | 264 | 0.1% |
| Pakistan | 433 | 0.1% |
| Panama | 145 | 0.0% |
| Peru | 568 | 0.1% |
| Philippines | 1,181 | 0.2% |
| Poland | 296 | 0.1% |
| Portugal | 87 | 0.0% |
| Romania | 98 | 0.0% |
| Russia | 324 | 0.1% |
| Saudi Arabia | 189 | 0.0% |
| Scotland | 43 | 0.0% |
| Senegal | 421 | 0.1% |
| Serbia | 28 | 0.0% |
| Sierra Leone | 139 | 0.0% |
| Singapore | 36 | 0.0% |
| South Africa | 283 | 0.1% |
| South America | 3,366 | 0.6% |
| South Central Asia | 3,986 | 0.7% |
| South Eastern Asia | 2,271 | 0.4% |
| Southern Europe | 787 | 0.1% |
| Spain | 96 | 0.0% |
| Sri Lanka | 314 | 0.1% |
| St. Vincent and the Grenadines | 16 | 0.0% |
| Sudan | 218 | 0.0% |
| Sweden | 12 | 0.0% |
| Switzerland | 107 | 0.0% |
| Syria | 838 | 0.1% |
| Taiwan | 454 | 0.1% |
| Thailand | 236 | 0.0% |
| Trinidad and Tobago | 1,941 | 0.3% |
| Turkey | 211 | 0.0% |
| Uganda | 137 | 0.0% |
| Ukraine | 228 | 0.0% |
| Venezuela | 105 | 0.0% |
| Vietnam | 400 | 0.1% |
| West Indies | 384 | 0.1% |
| Western Africa | 5,629 | 1.0% |
| Western Asia | 2,478 | 0.4% |
| Western Europe | 1,523 | 0.3% |
| Yemen | 283 | 0.1% |
| Zaire | 210 | 0.0% |
| Zimbabwe | 107 | 0.0% | View All 124 Rows |
Sex and Age in Baltimore city
Sex and Age in Baltimore city
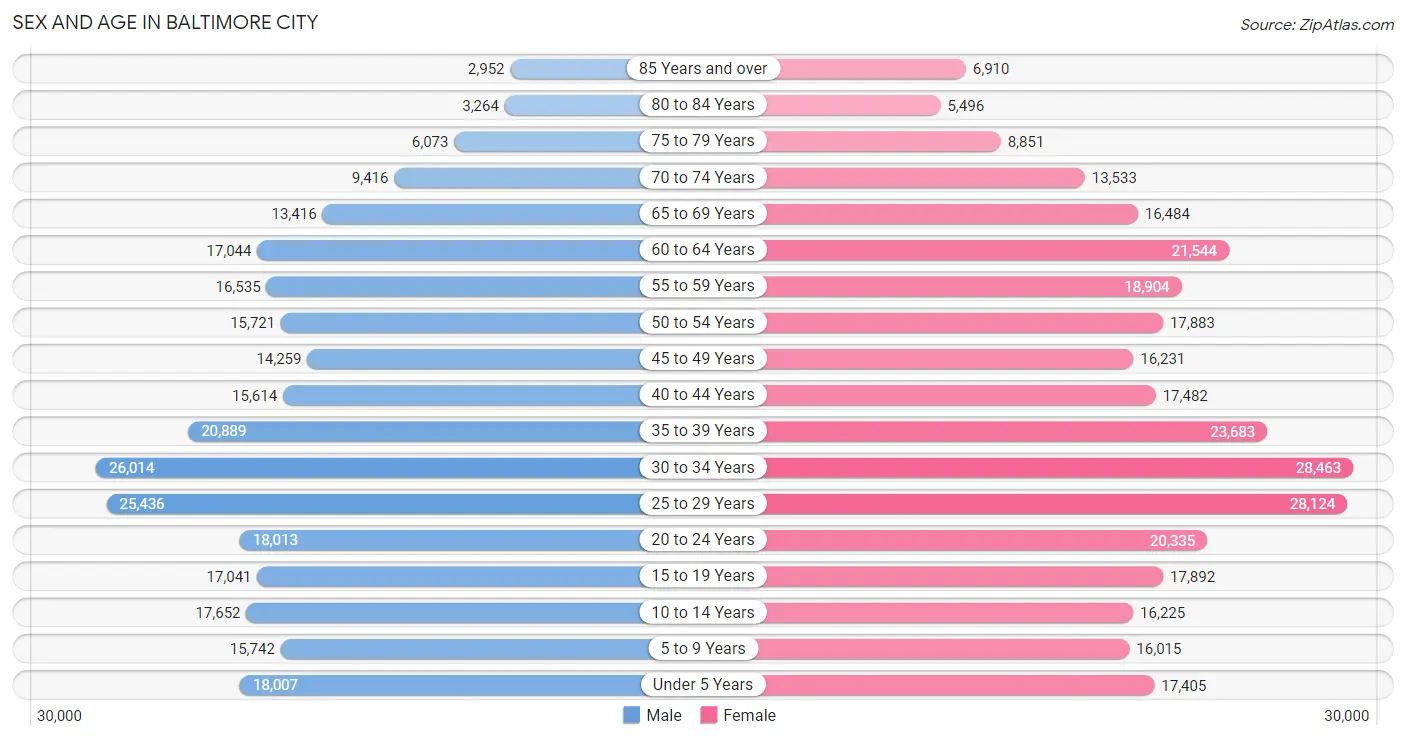
The most populous age groups in Baltimore city are 30 to 34 Years (26,014 | 9.5%) for men and 30 to 34 Years (28,463 | 9.1%) for women.
| Age Bracket | Male | Female |
| Under 5 Years | 18,007 (6.6%) | 17,405 (5.6%) |
| 5 to 9 Years | 15,742 (5.8%) | 16,015 (5.1%) |
| 10 to 14 Years | 17,652 (6.5%) | 16,225 (5.2%) |
| 15 to 19 Years | 17,041 (6.2%) | 17,892 (5.7%) |
| 20 to 24 Years | 18,013 (6.6%) | 20,335 (6.5%) |
| 25 to 29 Years | 25,436 (9.3%) | 28,124 (9.0%) |
| 30 to 34 Years | 26,014 (9.5%) | 28,463 (9.1%) |
| 35 to 39 Years | 20,889 (7.6%) | 23,683 (7.6%) |
| 40 to 44 Years | 15,614 (5.7%) | 17,482 (5.6%) |
| 45 to 49 Years | 14,259 (5.2%) | 16,231 (5.2%) |
| 50 to 54 Years | 15,721 (5.8%) | 17,883 (5.7%) |
| 55 to 59 Years | 16,535 (6.0%) | 18,904 (6.1%) |
| 60 to 64 Years | 17,044 (6.2%) | 21,544 (6.9%) |
| 65 to 69 Years | 13,416 (4.9%) | 16,484 (5.3%) |
| 70 to 74 Years | 9,416 (3.5%) | 13,533 (4.3%) |
| 75 to 79 Years | 6,073 (2.2%) | 8,851 (2.8%) |
| 80 to 84 Years | 3,264 (1.2%) | 5,496 (1.8%) |
| 85 Years and over | 2,952 (1.1%) | 6,910 (2.2%) |
| Total | 273,088 (100.0%) | 311,460 (100.0%) |
Families and Households in Baltimore city
Median Family Size in Baltimore city
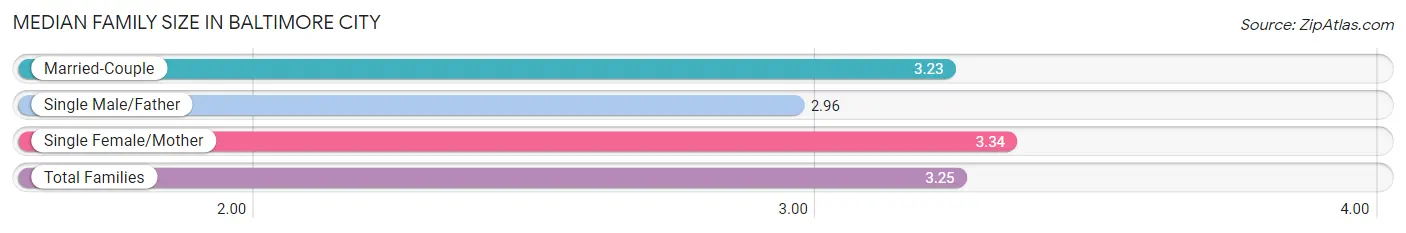
The median family size in Baltimore city is 3.25 persons per family, with single female/mother families (48,988 | 41.0%) accounting for the largest median family size of 3.34 persons per family. On the other hand, single male/father families (11,450 | 9.6%) represent the smallest median family size with 2.96 persons per family.
| Family Type | # Families | Family Size |
| Married-Couple | 58,996 (49.4%) | 3.23 |
| Single Male/Father | 11,450 (9.6%) | 2.96 |
| Single Female/Mother | 48,988 (41.0%) | 3.34 |
| Total Families | 119,434 (100.0%) | 3.25 |
Median Household Size in Baltimore city
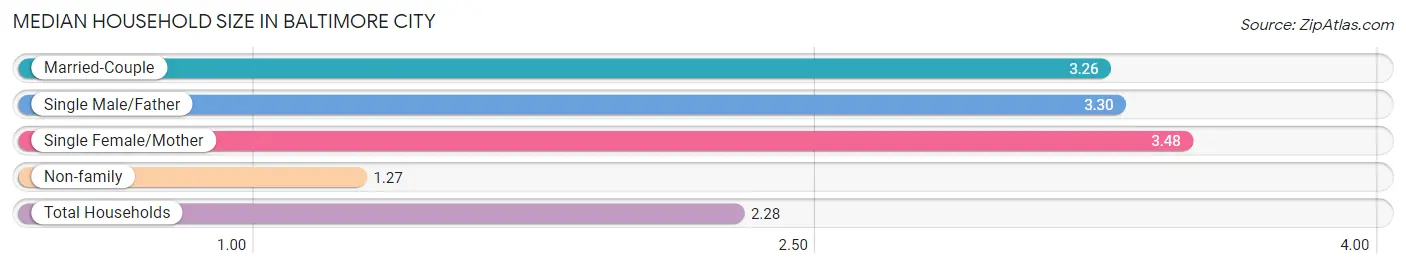
The median household size in Baltimore city is 2.28 persons per household, with single female/mother households (48,988 | 19.8%) accounting for the largest median household size of 3.48 persons per household. non-family households (127,798 | 51.7%) represent the smallest median household size with 1.27 persons per household.
| Household Type | # Households | Household Size |
| Married-Couple | 58,996 (23.9%) | 3.26 |
| Single Male/Father | 11,450 (4.6%) | 3.30 |
| Single Female/Mother | 48,988 (19.8%) | 3.48 |
| Non-family | 127,798 (51.7%) | 1.27 |
| Total Households | 247,232 (100.0%) | 2.28 |
Household Size by Marriage Status in Baltimore city
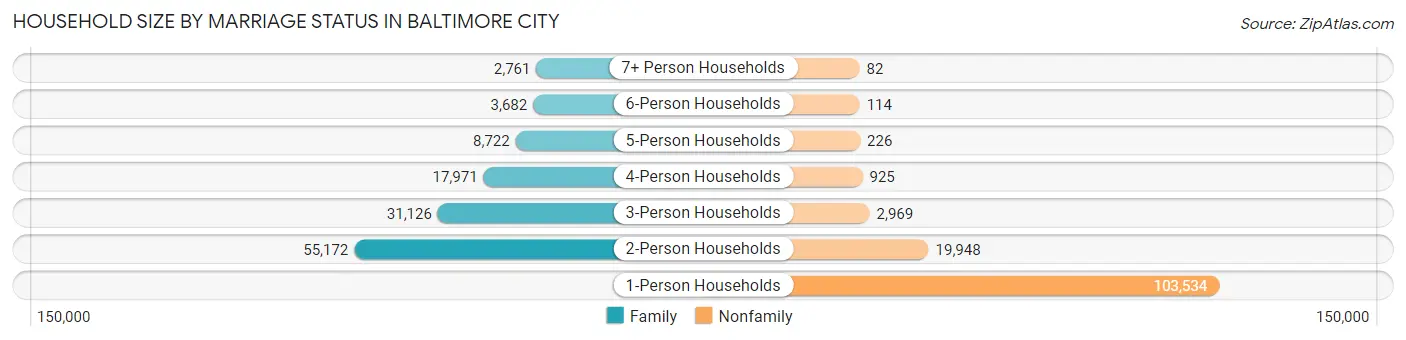
Out of a total of 247,232 households in Baltimore city, 119,434 (48.3%) are family households, while 127,798 (51.7%) are nonfamily households. The most numerous type of family households are 2-person households, comprising 55,172, and the most common type of nonfamily households are 1-person households, comprising 103,534.
| Household Size | Family Households | Nonfamily Households |
| 1-Person Households | - | 103,534 (41.9%) |
| 2-Person Households | 55,172 (22.3%) | 19,948 (8.1%) |
| 3-Person Households | 31,126 (12.6%) | 2,969 (1.2%) |
| 4-Person Households | 17,971 (7.3%) | 925 (0.4%) |
| 5-Person Households | 8,722 (3.5%) | 226 (0.1%) |
| 6-Person Households | 3,682 (1.5%) | 114 (0.1%) |
| 7+ Person Households | 2,761 (1.1%) | 82 (0.0%) |
| Total | 119,434 (48.3%) | 127,798 (51.7%) |
Female Fertility in Baltimore city
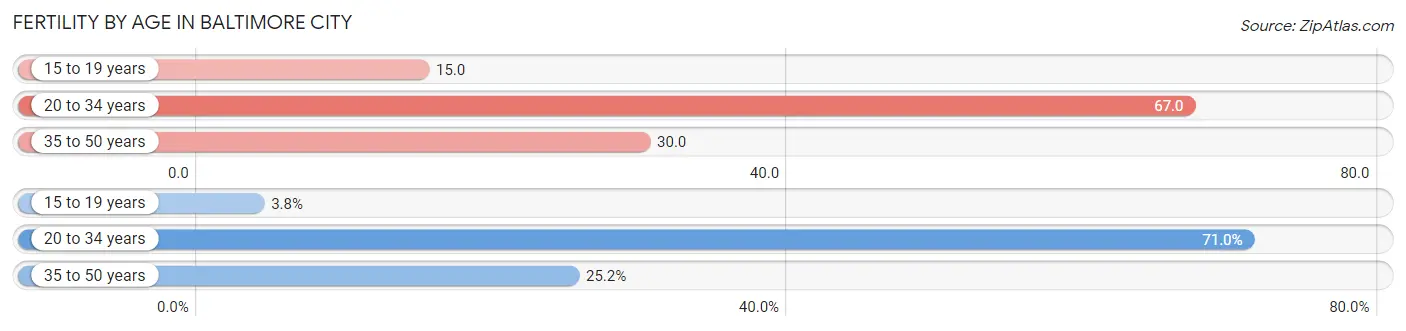
Fertility by Age in Baltimore city
Average fertility rate in Baltimore city is 47.0 births per 1,000 women. Women in the age bracket of 20 to 34 years have the highest fertility rate with 67.0 births per 1,000 women. Women in the age bracket of 20 to 34 years acount for 71.0% of all women with births.
| Age Bracket | Women with Births | Births / 1,000 Women |
| 15 to 19 years | 277 (3.8%) | 15.0 |
| 20 to 34 years | 5,166 (71.0%) | 67.0 |
| 35 to 50 years | 1,832 (25.2%) | 30.0 |
| Total | 7,275 (100.0%) | 47.0 |
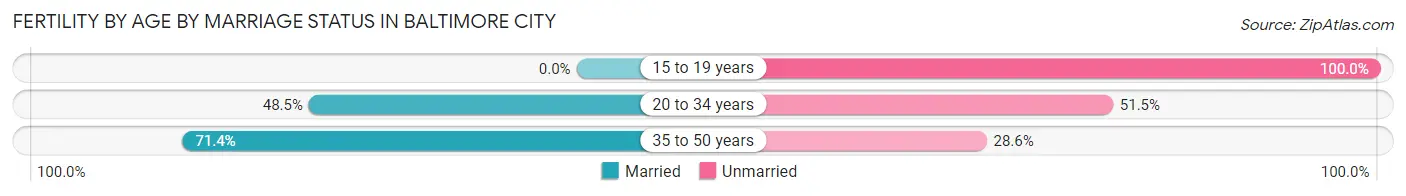
Fertility by Age by Marriage Status in Baltimore city
52.4% of women with births (7,275) in Baltimore city are married. The highest percentage of unmarried women with births falls into 15 to 19 years age bracket with 100.0% of them unmarried at the time of birth, while the lowest percentage of unmarried women with births belong to 35 to 50 years age bracket with 28.6% of them unmarried.
| Age Bracket | Married | Unmarried |
| 15 to 19 years | 0 (0.0%) | 277 (100.0%) |
| 20 to 34 years | 2,506 (48.5%) | 2,660 (51.5%) |
| 35 to 50 years | 1,308 (71.4%) | 524 (28.6%) |
| Total | 3,812 (52.4%) | 3,463 (47.6%) |
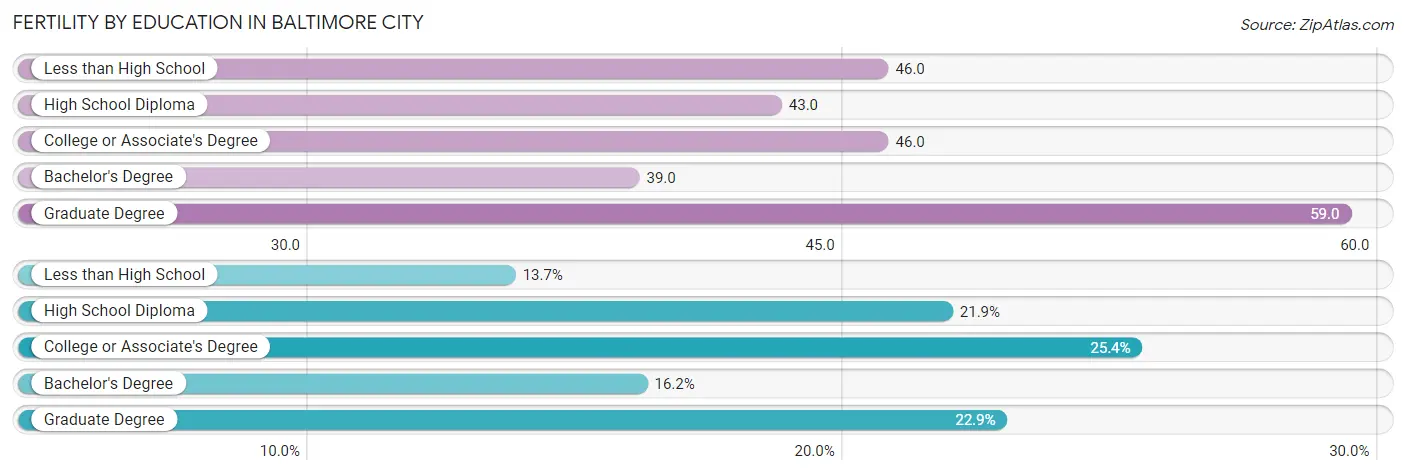
Fertility by Education in Baltimore city
Average fertility rate in Baltimore city is 47.0 births per 1,000 women. Women with the education attainment of graduate degree have the highest fertility rate of 59.0 births per 1,000 women, while women with the education attainment of bachelor's degree have the lowest fertility at 39.0 births per 1,000 women. Women with the education attainment of college or associate's degree represent 25.4% of all women with births.
| Educational Attainment | Women with Births | Births / 1,000 Women |
| Less than High School | 995 (13.7%) | 46.0 |
| High School Diploma | 1,591 (21.9%) | 43.0 |
| College or Associate's Degree | 1,849 (25.4%) | 46.0 |
| Bachelor's Degree | 1,175 (16.2%) | 39.0 |
| Graduate Degree | 1,665 (22.9%) | 59.0 |
| Total | 7,275 (100.0%) | 47.0 |
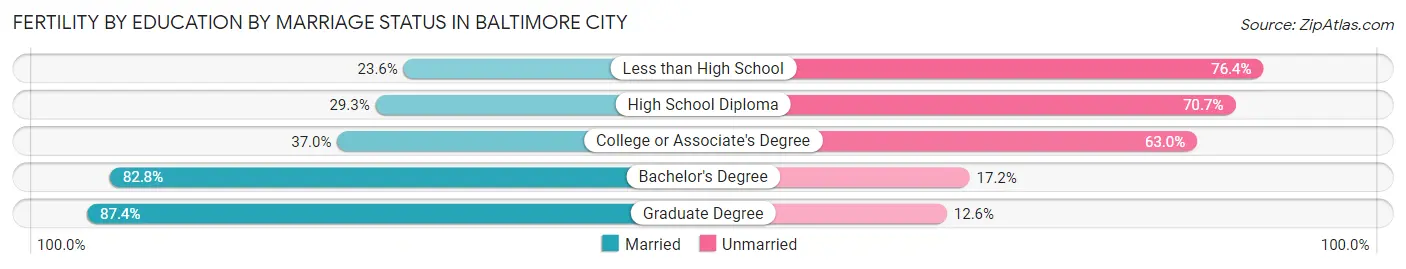
Fertility by Education by Marriage Status in Baltimore city
47.6% of women with births in Baltimore city are unmarried. Women with the educational attainment of graduate degree are most likely to be married with 87.4% of them married at childbirth, while women with the educational attainment of less than high school are least likely to be married with 76.4% of them unmarried at childbirth.
| Educational Attainment | Married | Unmarried |
| Less than High School | 235 (23.6%) | 760 (76.4%) |
| High School Diploma | 466 (29.3%) | 1,125 (70.7%) |
| College or Associate's Degree | 684 (37.0%) | 1,165 (63.0%) |
| Bachelor's Degree | 973 (82.8%) | 202 (17.2%) |
| Graduate Degree | 1,455 (87.4%) | 210 (12.6%) |
| Total | 3,812 (52.4%) | 3,463 (47.6%) |
Income in Baltimore city
Income Overview in Baltimore city
Per Capita Income in Baltimore city is $37,845, while median incomes of families and households are $72,972 and $58,349 respectively.
| Characteristic | Number | Measure |
| Per Capita Income | 584,548 | $37,845 |
| Median Family Income | 119,434 | $72,972 |
| Mean Family Income | 119,434 | $105,893 |
| Median Household Income | 247,232 | $58,349 |
| Mean Household Income | 247,232 | $85,857 |
| Income Deficit | 119,434 | $11,956 |
| Wage / Income Gap (%) | 584,548 | 11.60% |
| Wage / Income Gap ($) | 584,548 | 88.40¢ per $1 |
| Gini / Inequality Index | 584,548 | 0.52 |
Earnings by Sex in Baltimore city
Average Earnings in Baltimore city are $44,833, $47,142 for men and $41,675 for women, a difference of 11.6%.
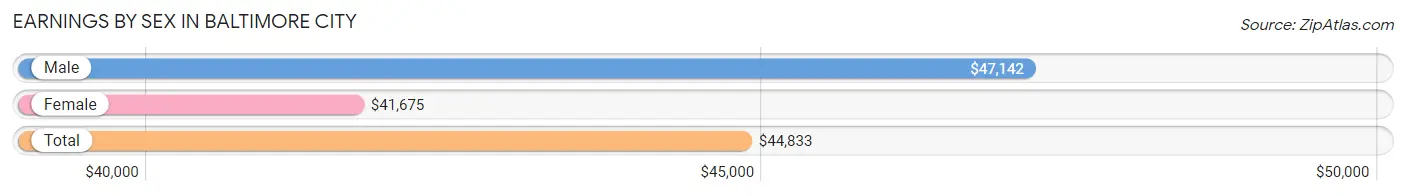
| Sex | Number | Average Earnings |
| Male | 143,922 (47.2%) | $47,142 |
| Female | 161,204 (52.8%) | $41,675 |
| Total | 305,126 (100.0%) | $44,833 |
Earnings by Sex by Income Bracket in Baltimore city
The most common earnings brackets in Baltimore city are $100,000+ for men (25,133 | 17.5%) and $100,000+ for women (19,431 | 12.0%).
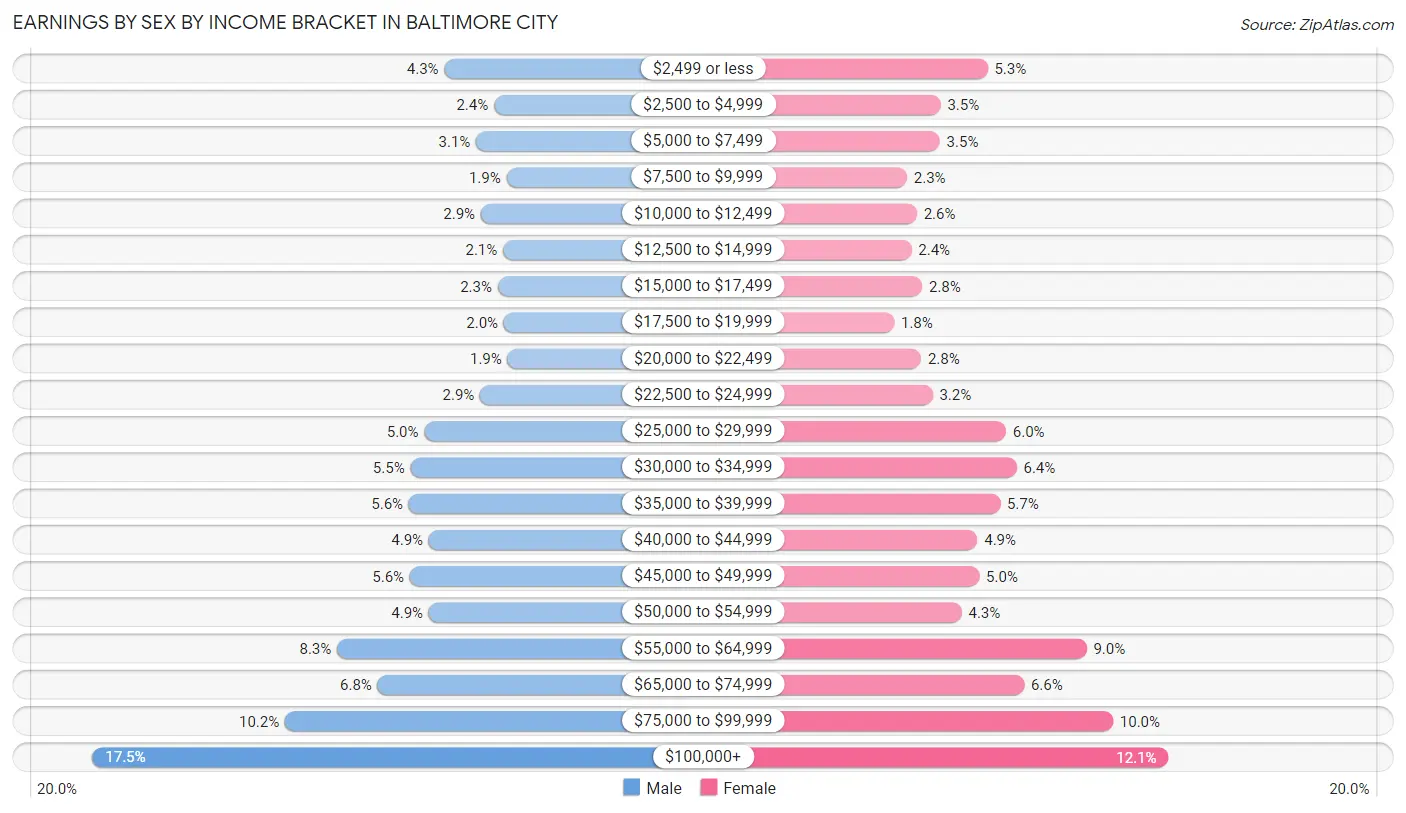
| Income | Male | Female |
| $2,499 or less | 6,144 (4.3%) | 8,494 (5.3%) |
| $2,500 to $4,999 | 3,472 (2.4%) | 5,665 (3.5%) |
| $5,000 to $7,499 | 4,426 (3.1%) | 5,617 (3.5%) |
| $7,500 to $9,999 | 2,798 (1.9%) | 3,621 (2.2%) |
| $10,000 to $12,499 | 4,167 (2.9%) | 4,230 (2.6%) |
| $12,500 to $14,999 | 2,986 (2.1%) | 3,901 (2.4%) |
| $15,000 to $17,499 | 3,268 (2.3%) | 4,552 (2.8%) |
| $17,500 to $19,999 | 2,942 (2.0%) | 2,857 (1.8%) |
| $20,000 to $22,499 | 2,732 (1.9%) | 4,479 (2.8%) |
| $22,500 to $24,999 | 4,215 (2.9%) | 5,169 (3.2%) |
| $25,000 to $29,999 | 7,226 (5.0%) | 9,612 (6.0%) |
| $30,000 to $34,999 | 7,978 (5.5%) | 10,246 (6.4%) |
| $35,000 to $39,999 | 8,055 (5.6%) | 9,257 (5.7%) |
| $40,000 to $44,999 | 6,984 (4.9%) | 7,889 (4.9%) |
| $45,000 to $49,999 | 8,002 (5.6%) | 7,992 (5.0%) |
| $50,000 to $54,999 | 6,976 (4.9%) | 6,927 (4.3%) |
| $55,000 to $64,999 | 11,937 (8.3%) | 14,484 (9.0%) |
| $65,000 to $74,999 | 9,739 (6.8%) | 10,711 (6.6%) |
| $75,000 to $99,999 | 14,742 (10.2%) | 16,070 (10.0%) |
| $100,000+ | 25,133 (17.5%) | 19,431 (12.0%) |
| Total | 143,922 (100.0%) | 161,204 (100.0%) |
Earnings by Sex by Educational Attainment in Baltimore city
Average earnings in Baltimore city are $52,677 for men and $47,304 for women, a difference of 10.2%. Men with an educational attainment of graduate degree enjoy the highest average annual earnings of $86,665, while those with less than high school education earn the least with $32,528. Women with an educational attainment of graduate degree earn the most with the average annual earnings of $76,393, while those with less than high school education have the smallest earnings of $23,998.
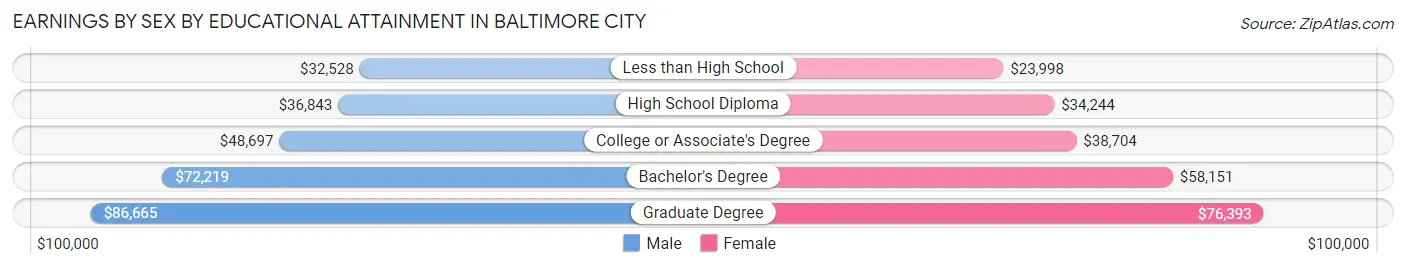
| Educational Attainment | Male Income | Female Income |
| Less than High School | $32,528 | $23,998 |
| High School Diploma | $36,843 | $34,244 |
| College or Associate's Degree | $48,697 | $38,704 |
| Bachelor's Degree | $72,219 | $58,151 |
| Graduate Degree | $86,665 | $76,393 |
| Total | $52,677 | $47,304 |
Family Income in Baltimore city
Family Income Brackets in Baltimore city
According to the Baltimore city family income data, there are 19,826 families falling into the $50,000 to $74,999 income range, which is the most common income bracket and makes up 16.6% of all families. Conversely, the $10,000 to $14,999 income bracket is the least frequent group with only 3,941 families (3.3%) belonging to this category.
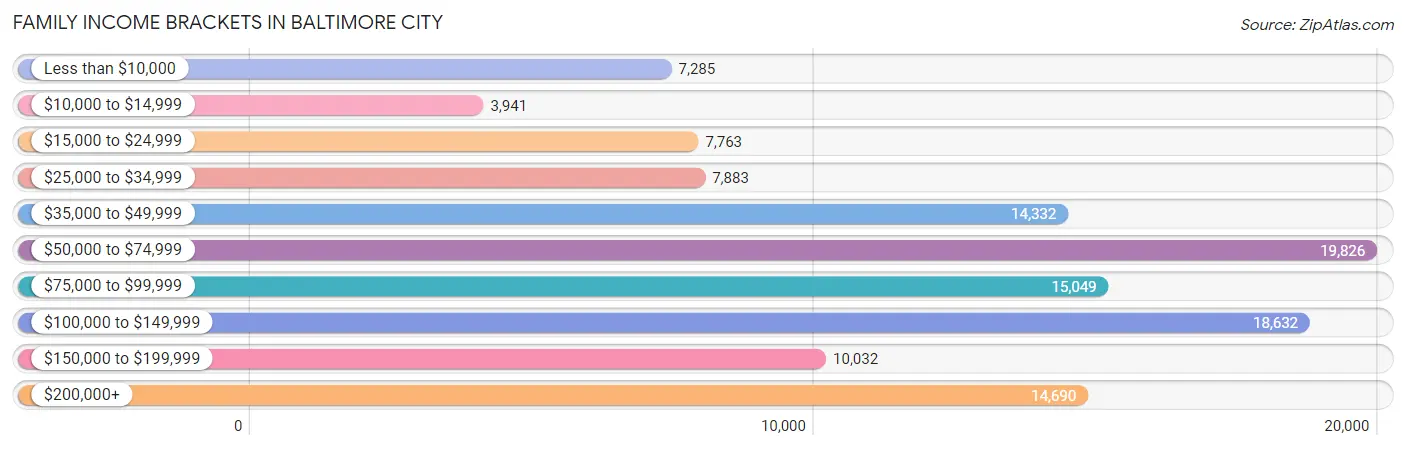
| Income Bracket | # Families | % Families |
| Less than $10,000 | 7,285 | 6.1% |
| $10,000 to $14,999 | 3,941 | 3.3% |
| $15,000 to $24,999 | 7,763 | 6.5% |
| $25,000 to $34,999 | 7,883 | 6.6% |
| $35,000 to $49,999 | 14,332 | 12.0% |
| $50,000 to $74,999 | 19,826 | 16.6% |
| $75,000 to $99,999 | 15,049 | 12.6% |
| $100,000 to $149,999 | 18,632 | 15.6% |
| $150,000 to $199,999 | 10,032 | 8.4% |
| $200,000+ | 14,690 | 12.3% |
Family Income by Famaliy Size in Baltimore city
4-person families (16,276 | 13.6%) account for the highest median family income in Baltimore city with $93,436 per family, while 2-person families (59,554 | 49.9%) have the highest median income of $34,361 per family member.
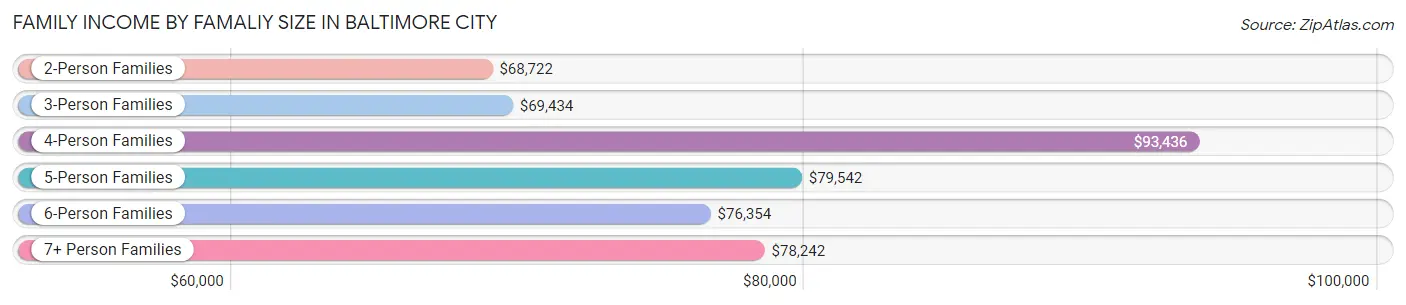
| Income Bracket | # Families | Median Income |
| 2-Person Families | 59,554 (49.9%) | $68,722 |
| 3-Person Families | 30,445 (25.5%) | $69,434 |
| 4-Person Families | 16,276 (13.6%) | $93,436 |
| 5-Person Families | 7,423 (6.2%) | $79,542 |
| 6-Person Families | 3,241 (2.7%) | $76,354 |
| 7+ Person Families | 2,495 (2.1%) | $78,242 |
| Total | 119,434 (100.0%) | $72,972 |
Family Income by Number of Earners in Baltimore city
The median family income in Baltimore city is $72,972, with families comprising 3+ earners (9,982) having the highest median family income of $142,500, while families with no earners (18,283) have the lowest median family income of $24,910, accounting for 8.4% and 15.3% of families, respectively.
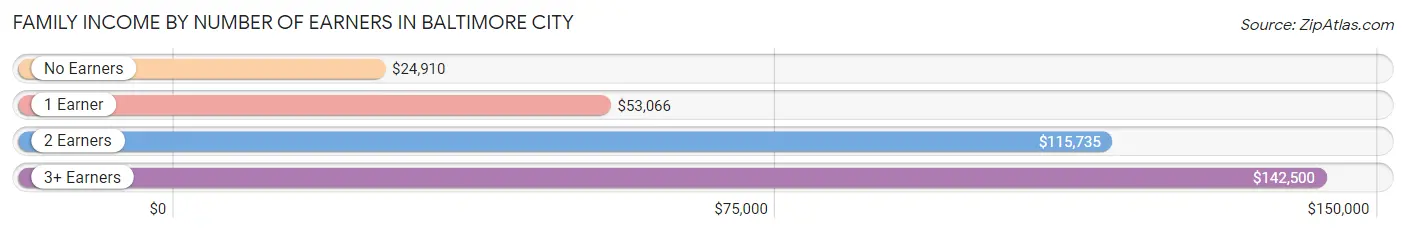
| Number of Earners | # Families | Median Income |
| No Earners | 18,283 (15.3%) | $24,910 |
| 1 Earner | 46,353 (38.8%) | $53,066 |
| 2 Earners | 44,816 (37.5%) | $115,735 |
| 3+ Earners | 9,982 (8.4%) | $142,500 |
| Total | 119,434 (100.0%) | $72,972 |
Household Income in Baltimore city
Household Income Brackets in Baltimore city
With 40,546 households falling in the category, the $50,000 to $74,999 income range is the most frequent in Baltimore city, accounting for 16.4% of all households. In contrast, only 15,823 households (6.4%) fall into the $150,000 to $199,999 income bracket, making it the least populous group.
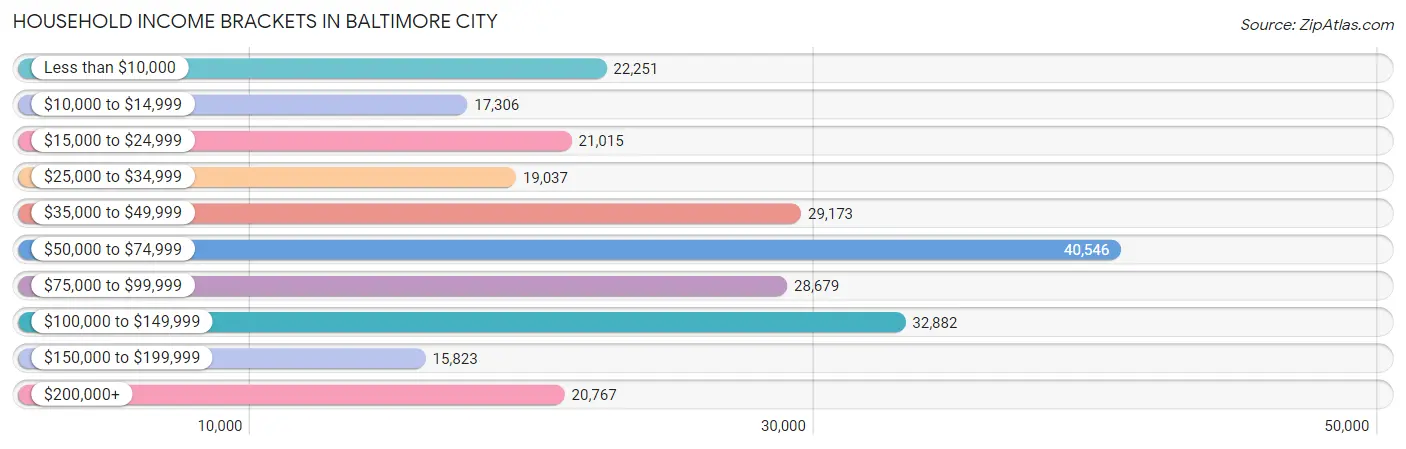
| Income Bracket | # Households | % Households |
| Less than $10,000 | 22,251 | 9.0% |
| $10,000 to $14,999 | 17,306 | 7.0% |
| $15,000 to $24,999 | 21,015 | 8.5% |
| $25,000 to $34,999 | 19,037 | 7.7% |
| $35,000 to $49,999 | 29,173 | 11.8% |
| $50,000 to $74,999 | 40,546 | 16.4% |
| $75,000 to $99,999 | 28,679 | 11.6% |
| $100,000 to $149,999 | 32,882 | 13.3% |
| $150,000 to $199,999 | 15,823 | 6.4% |
| $200,000+ | 20,767 | 8.4% |
Household Income by Householder Age in Baltimore city
The median household income in Baltimore city is $58,349, with the highest median household income of $71,010 found in the 25 to 44 years age bracket for the primary householder. A total of 95,950 households (38.8%) fall into this category. Meanwhile, the 15 to 24 years age bracket for the primary householder has the lowest median household income of $33,680, with 8,406 households (3.4%) in this group.
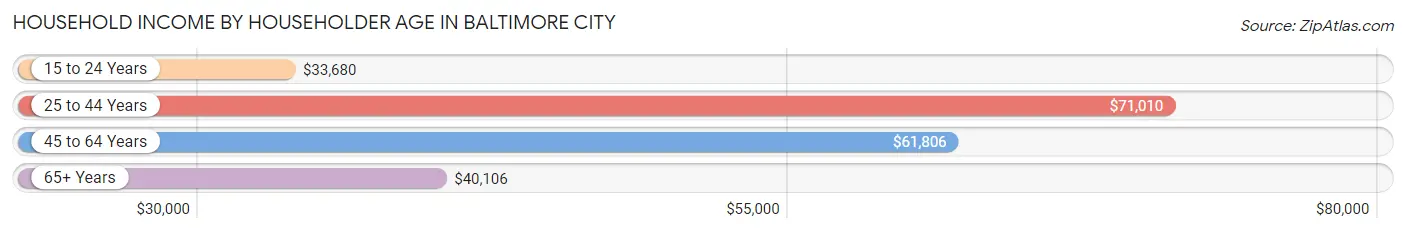
| Income Bracket | # Households | Median Income |
| 15 to 24 Years | 8,406 (3.4%) | $33,680 |
| 25 to 44 Years | 95,950 (38.8%) | $71,010 |
| 45 to 64 Years | 82,872 (33.5%) | $61,806 |
| 65+ Years | 60,004 (24.3%) | $40,106 |
| Total | 247,232 (100.0%) | $58,349 |
Poverty in Baltimore city
Income Below Poverty by Sex and Age in Baltimore city
With 18.5% poverty level for males and 20.5% for females among the residents of Baltimore city, 12 to 14 year old males and 5 year old females are the most vulnerable to poverty, with 2,965 males (28.7%) and 1,003 females (29.5%) in their respective age groups living below the poverty level.
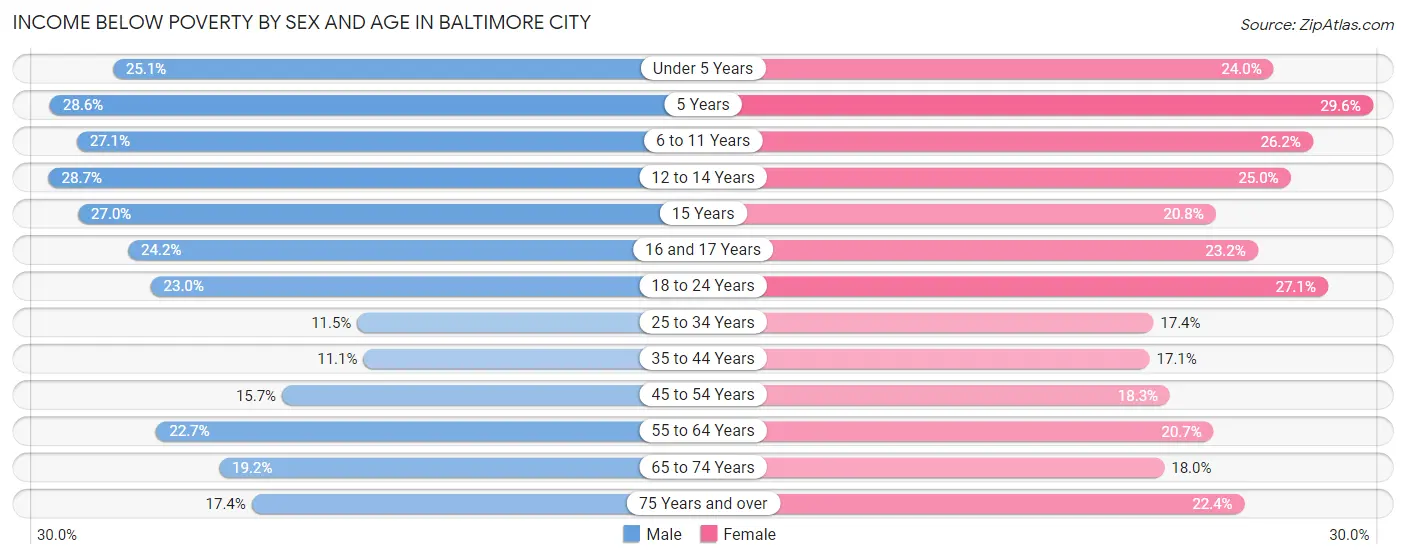
| Age Bracket | Male | Female |
| Under 5 Years | 4,447 (25.1%) | 4,164 (24.0%) |
| 5 Years | 1,070 (28.6%) | 1,003 (29.5%) |
| 6 to 11 Years | 5,078 (27.1%) | 4,900 (26.2%) |
| 12 to 14 Years | 2,965 (28.7%) | 2,394 (25.0%) |
| 15 Years | 814 (27.0%) | 618 (20.8%) |
| 16 and 17 Years | 1,460 (24.2%) | 1,411 (23.2%) |
| 18 to 24 Years | 4,763 (23.0%) | 6,067 (27.1%) |
| 25 to 34 Years | 5,746 (11.5%) | 9,765 (17.3%) |
| 35 to 44 Years | 3,984 (11.1%) | 7,039 (17.1%) |
| 45 to 54 Years | 4,622 (15.7%) | 6,208 (18.3%) |
| 55 to 64 Years | 7,464 (22.7%) | 8,319 (20.7%) |
| 65 to 74 Years | 4,264 (19.2%) | 5,301 (18.0%) |
| 75 Years and over | 2,068 (17.4%) | 4,575 (22.4%) |
| Total | 48,745 (18.5%) | 61,764 (20.5%) |
Income Above Poverty by Sex and Age in Baltimore city
According to the poverty statistics in Baltimore city, males aged 35 to 44 years and females aged 35 to 44 years are the age groups that are most secure financially, with 88.9% of males and 82.9% of females in these age groups living above the poverty line.
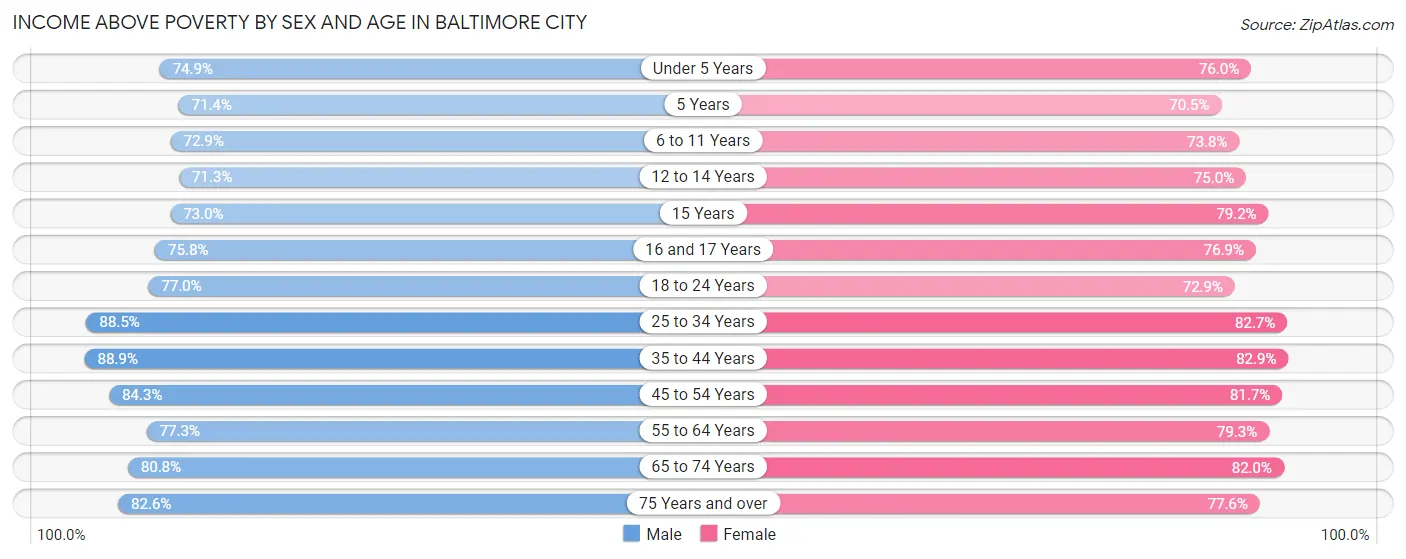
| Age Bracket | Male | Female |
| Under 5 Years | 13,283 (74.9%) | 13,156 (76.0%) |
| 5 Years | 2,672 (71.4%) | 2,391 (70.5%) |
| 6 to 11 Years | 13,664 (72.9%) | 13,791 (73.8%) |
| 12 to 14 Years | 7,380 (71.3%) | 7,189 (75.0%) |
| 15 Years | 2,197 (73.0%) | 2,352 (79.2%) |
| 16 and 17 Years | 4,564 (75.8%) | 4,683 (76.8%) |
| 18 to 24 Years | 15,965 (77.0%) | 16,351 (72.9%) |
| 25 to 34 Years | 44,312 (88.5%) | 46,507 (82.7%) |
| 35 to 44 Years | 31,789 (88.9%) | 34,027 (82.9%) |
| 45 to 54 Years | 24,881 (84.3%) | 27,769 (81.7%) |
| 55 to 64 Years | 25,476 (77.3%) | 31,862 (79.3%) |
| 65 to 74 Years | 17,982 (80.8%) | 24,210 (82.0%) |
| 75 Years and over | 9,843 (82.6%) | 15,829 (77.6%) |
| Total | 214,008 (81.5%) | 240,117 (79.5%) |
Income Below Poverty Among Married-Couple Families in Baltimore city
The poverty statistics for married-couple families in Baltimore city show that 6.1% or 3,617 of the total 58,996 families live below the poverty line. Families with 5 or more children have the highest poverty rate of 15.3%, comprising of 145 families. On the other hand, families with no children have the lowest poverty rate of 5.3%, which includes 1,936 families.
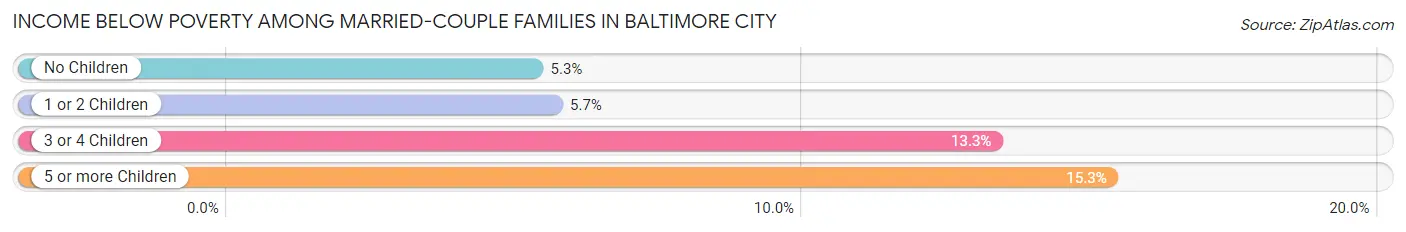
| Children | Above Poverty | Below Poverty |
| No Children | 34,429 (94.7%) | 1,936 (5.3%) |
| 1 or 2 Children | 16,661 (94.3%) | 1,000 (5.7%) |
| 3 or 4 Children | 3,488 (86.7%) | 536 (13.3%) |
| 5 or more Children | 801 (84.7%) | 145 (15.3%) |
| Total | 55,379 (93.9%) | 3,617 (6.1%) |
Income Below Poverty Among Single-Parent Households in Baltimore city
According to the poverty data in Baltimore city, 13.6% or 1,557 single-father households and 24.8% or 12,165 single-mother households are living below the poverty line. Among single-father households, those with 3 or 4 children have the highest poverty rate, with 128 households (24.8%) experiencing poverty. Likewise, among single-mother households, those with 5 or more children have the highest poverty rate, with 436 households (74.0%) falling below the poverty line.
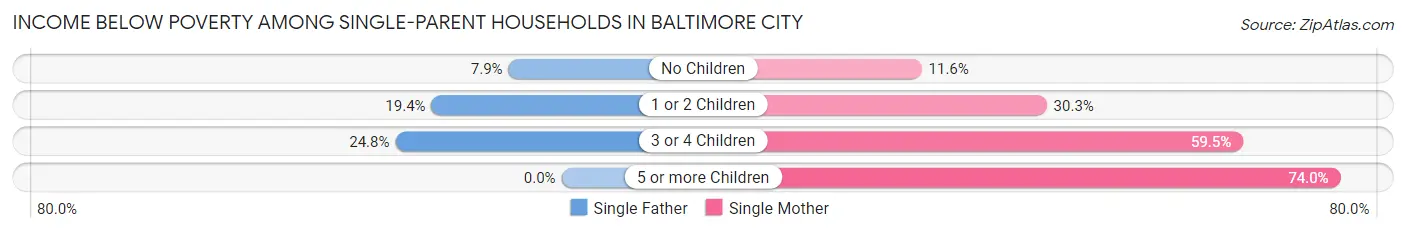
| Children | Single Father | Single Mother |
| No Children | 468 (7.9%) | 2,446 (11.6%) |
| 1 or 2 Children | 961 (19.4%) | 7,215 (30.2%) |
| 3 or 4 Children | 128 (24.8%) | 2,068 (59.5%) |
| 5 or more Children | 0 (0.0%) | 436 (74.0%) |
| Total | 1,557 (13.6%) | 12,165 (24.8%) |
Income Below Poverty Among Married-Couple vs Single-Parent Households in Baltimore city
The poverty data for Baltimore city shows that 3,617 of the married-couple family households (6.1%) and 13,722 of the single-parent households (22.7%) are living below the poverty level. Within the married-couple family households, those with 5 or more children have the highest poverty rate, with 145 households (15.3%) falling below the poverty line. Among the single-parent households, those with 5 or more children have the highest poverty rate, with 436 household (68.5%) living below poverty.
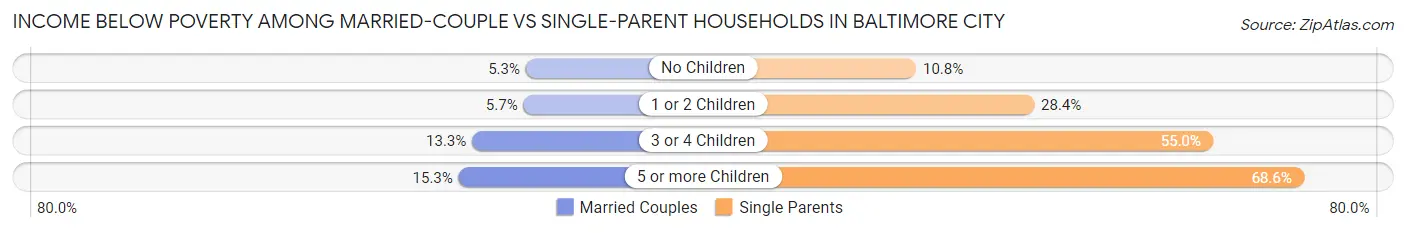
| Children | Married-Couple Families | Single-Parent Households |
| No Children | 1,936 (5.3%) | 2,914 (10.8%) |
| 1 or 2 Children | 1,000 (5.7%) | 8,176 (28.4%) |
| 3 or 4 Children | 536 (13.3%) | 2,196 (55.0%) |
| 5 or more Children | 145 (15.3%) | 436 (68.5%) |
| Total | 3,617 (6.1%) | 13,722 (22.7%) |
Employment Characteristics in Baltimore city
Employment by Class of Employer in Baltimore city
Among the 270,605 employed individuals in Baltimore city, private company employees (158,919 | 58.7%), not-for-profit organizations (40,634 | 15.0%), and local government employees (19,783 | 7.3%) make up the most common classes of employment.
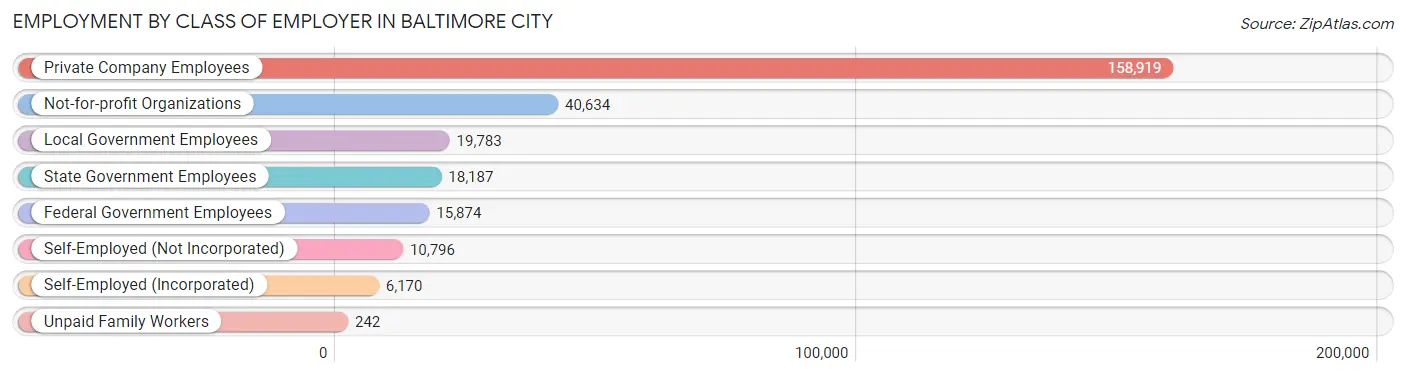
| Employer Class | # Employees | % Employees |
| Private Company Employees | 158,919 | 58.7% |
| Self-Employed (Incorporated) | 6,170 | 2.3% |
| Self-Employed (Not Incorporated) | 10,796 | 4.0% |
| Not-for-profit Organizations | 40,634 | 15.0% |
| Local Government Employees | 19,783 | 7.3% |
| State Government Employees | 18,187 | 6.7% |
| Federal Government Employees | 15,874 | 5.9% |
| Unpaid Family Workers | 242 | 0.1% |
| Total | 270,605 | 100.0% |
Employment Status by Age in Baltimore city
According to the labor force statistics for Baltimore city, out of the total population over 16 years of age (477,510), 62.1% or 296,534 individuals are in the labor force, with 6.9% or 20,461 of them unemployed. The age group with the highest labor force participation rate is 30 to 34 years, with 84.7% or 46,142 individuals in the labor force. Within the labor force, the 16 to 19 years age range has the highest percentage of unemployed individuals, with 25.7% or 2,090 of them being unemployed.
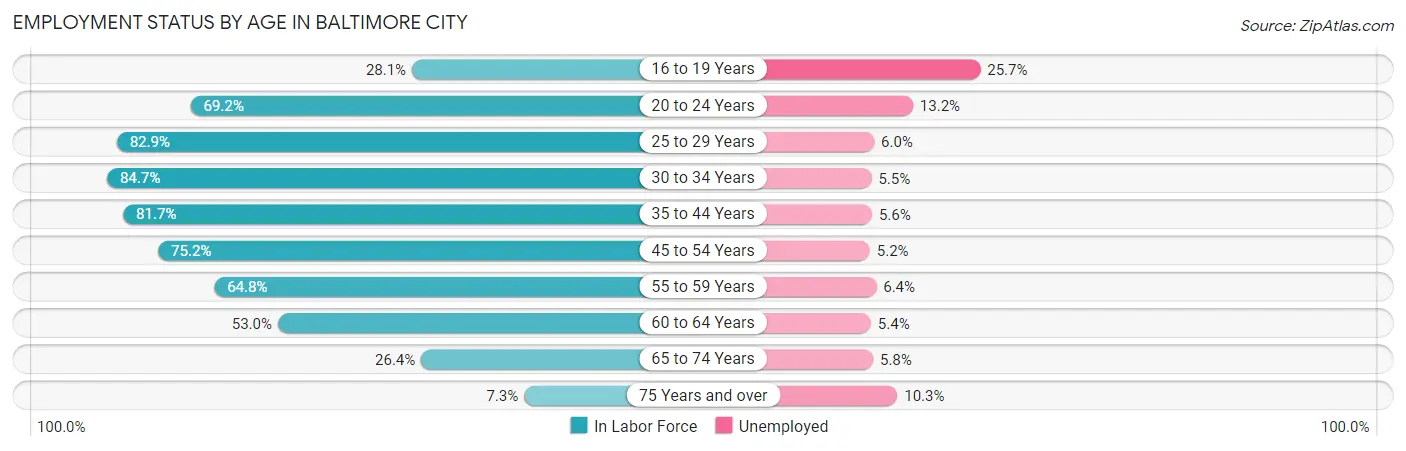
| Age Bracket | In Labor Force | Unemployed |
| 16 to 19 Years | 8,132 (28.1%) | 2,090 (25.7%) |
| 20 to 24 Years | 26,537 (69.2%) | 3,503 (13.2%) |
| 25 to 29 Years | 44,401 (82.9%) | 2,664 (6.0%) |
| 30 to 34 Years | 46,142 (84.7%) | 2,538 (5.5%) |
| 35 to 44 Years | 63,455 (81.7%) | 3,553 (5.6%) |
| 45 to 54 Years | 48,199 (75.2%) | 2,506 (5.2%) |
| 55 to 59 Years | 22,964 (64.8%) | 1,470 (6.4%) |
| 60 to 64 Years | 20,452 (53.0%) | 1,104 (5.4%) |
| 65 to 74 Years | 13,952 (26.4%) | 809 (5.8%) |
| 75 Years and over | 2,449 (7.3%) | 252 (10.3%) |
| Total | 296,534 (62.1%) | 20,461 (6.9%) |
Employment Status by Educational Attainment in Baltimore city
According to labor force statistics for Baltimore city, 75.8% of individuals (245,460) out of the total population between 25 and 64 years of age (323,826) are in the labor force, with 5.6% or 13,746 of them being unemployed. The group with the highest labor force participation rate are those with the educational attainment of bachelor's degree or higher, with 90.2% or 109,229 individuals in the labor force. Within the labor force, individuals with less than high school education have the highest percentage of unemployment, with 16.2% or 2,740 of them being unemployed.
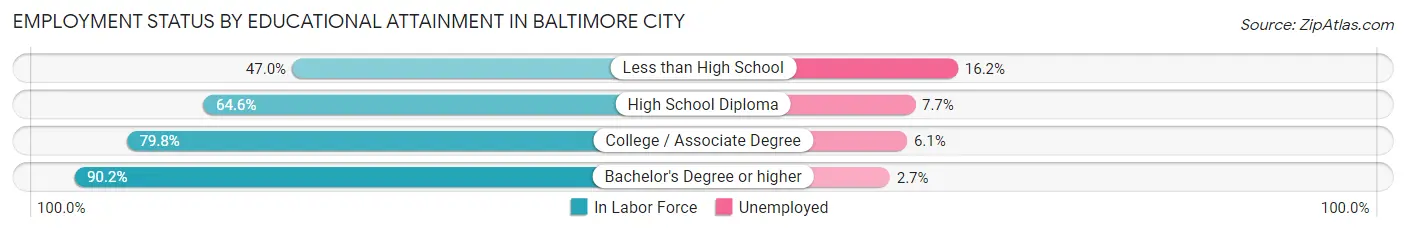
| Educational Attainment | In Labor Force | Unemployed |
| Less than High School | 16,914 (47.0%) | 5,830 (16.2%) |
| High School Diploma | 57,803 (64.6%) | 6,890 (7.7%) |
| College / Associate Degree | 61,657 (79.8%) | 4,713 (6.1%) |
| Bachelor's Degree or higher | 109,229 (90.2%) | 3,270 (2.7%) |
| Total | 245,460 (75.8%) | 18,134 (5.6%) |
Employment Occupations by Sex in Baltimore city
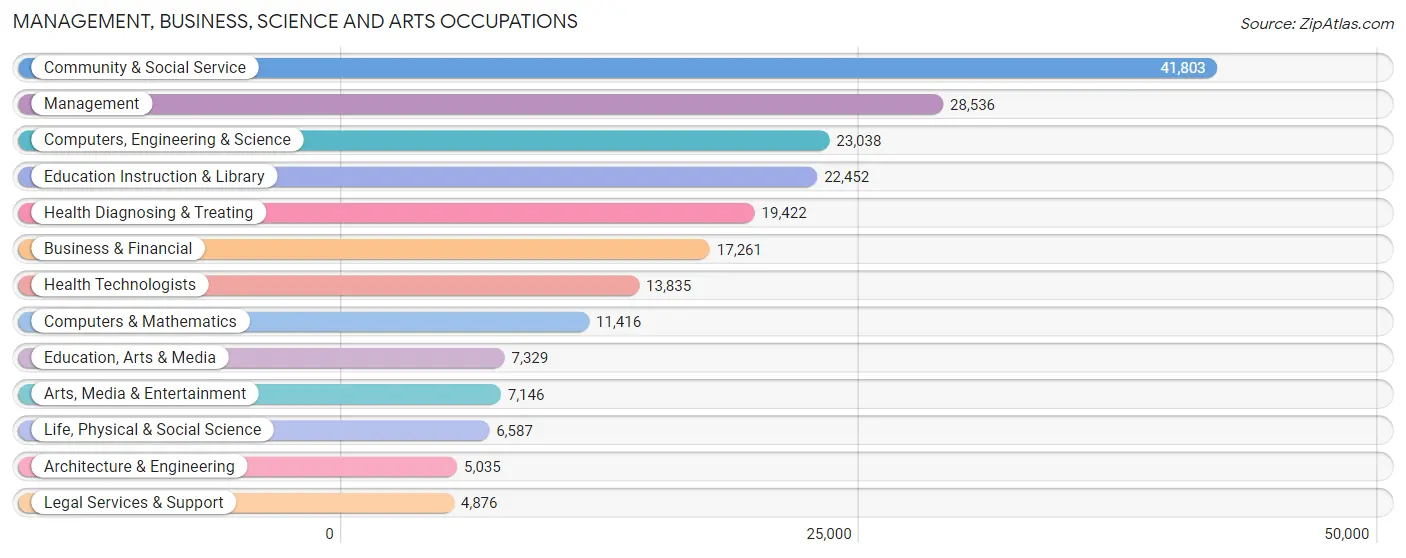
Management, Business, Science and Arts Occupations
The most common Management, Business, Science and Arts occupations in Baltimore city are Community & Social Service (41,803 | 15.2%), Management (28,536 | 10.4%), Computers, Engineering & Science (23,038 | 8.4%), Education Instruction & Library (22,452 | 8.2%), and Health Diagnosing & Treating (19,422 | 7.0%).
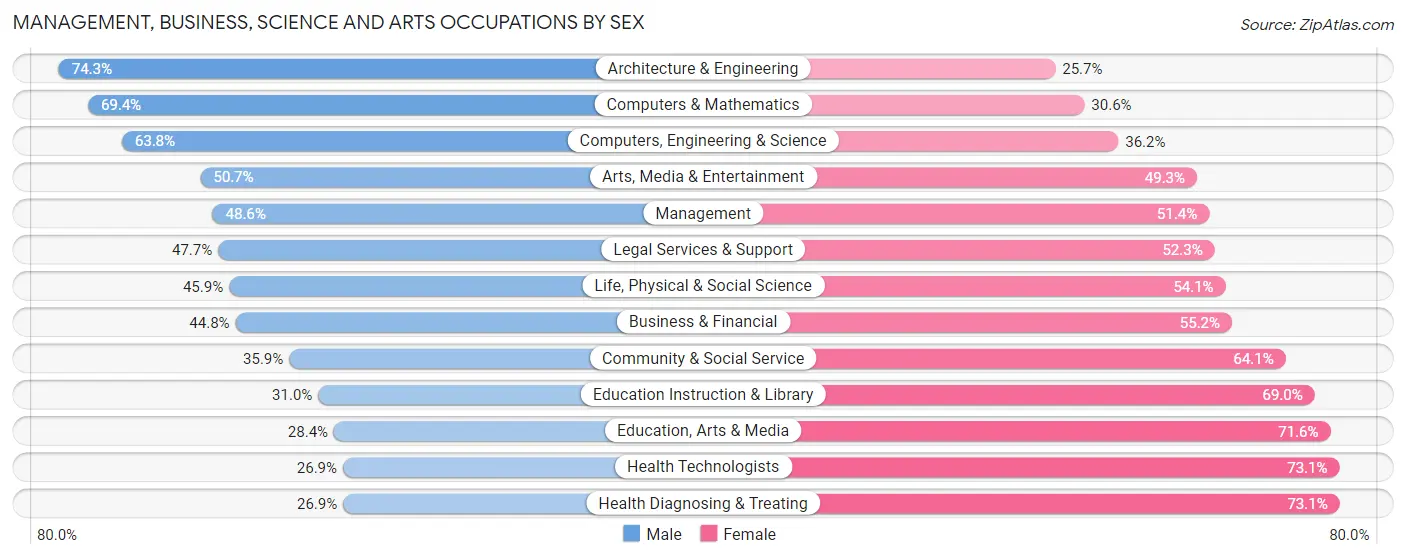
Management, Business, Science and Arts Occupations by Sex
Within the Management, Business, Science and Arts occupations in Baltimore city, the most male-oriented occupations are Architecture & Engineering (74.3%), Computers & Mathematics (69.4%), and Computers, Engineering & Science (63.8%), while the most female-oriented occupations are Health Diagnosing & Treating (73.1%), Health Technologists (73.1%), and Education, Arts & Media (71.6%).
| Occupation | Male | Female |
| Management | 13,873 (48.6%) | 14,663 (51.4%) |
| Business & Financial | 7,737 (44.8%) | 9,524 (55.2%) |
| Computers, Engineering & Science | 14,688 (63.8%) | 8,350 (36.2%) |
| Computers & Mathematics | 7,925 (69.4%) | 3,491 (30.6%) |
| Architecture & Engineering | 3,740 (74.3%) | 1,295 (25.7%) |
| Life, Physical & Social Science | 3,023 (45.9%) | 3,564 (54.1%) |
| Community & Social Service | 14,990 (35.9%) | 26,813 (64.1%) |
| Education, Arts & Media | 2,080 (28.4%) | 5,249 (71.6%) |
| Legal Services & Support | 2,327 (47.7%) | 2,549 (52.3%) |
| Education Instruction & Library | 6,963 (31.0%) | 15,489 (69.0%) |
| Arts, Media & Entertainment | 3,620 (50.7%) | 3,526 (49.3%) |
| Health Diagnosing & Treating | 5,217 (26.9%) | 14,205 (73.1%) |
| Health Technologists | 3,720 (26.9%) | 10,115 (73.1%) |
| Total (Category) | 56,505 (43.4%) | 73,555 (56.6%) |
| Total (Overall) | 130,124 (47.2%) | 145,246 (52.7%) |
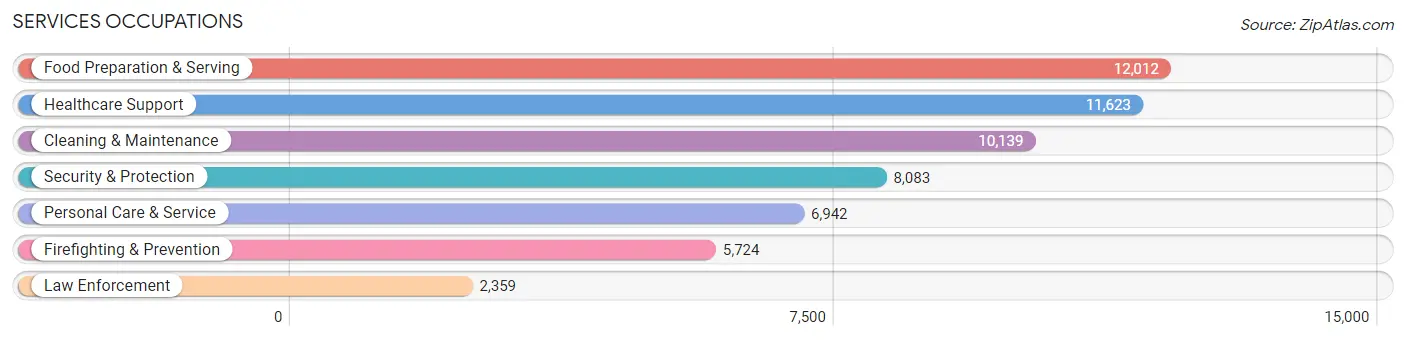
Services Occupations
The most common Services occupations in Baltimore city are Food Preparation & Serving (12,012 | 4.4%), Healthcare Support (11,623 | 4.2%), Cleaning & Maintenance (10,139 | 3.7%), Security & Protection (8,083 | 2.9%), and Personal Care & Service (6,942 | 2.5%).
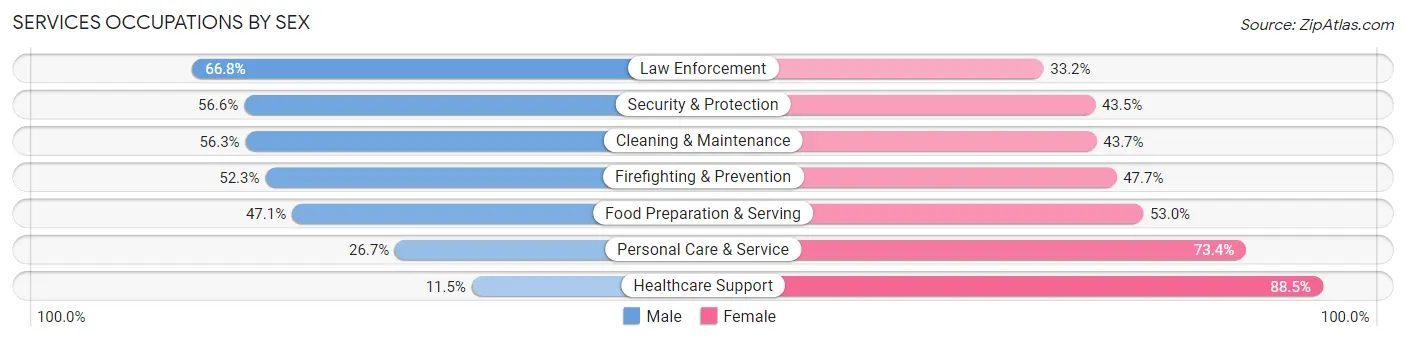
Services Occupations by Sex
Within the Services occupations in Baltimore city, the most male-oriented occupations are Law Enforcement (66.8%), Security & Protection (56.6%), and Cleaning & Maintenance (56.3%), while the most female-oriented occupations are Healthcare Support (88.5%), Personal Care & Service (73.4%), and Food Preparation & Serving (52.9%).
| Occupation | Male | Female |
| Healthcare Support | 1,333 (11.5%) | 10,290 (88.5%) |
| Security & Protection | 4,571 (56.6%) | 3,512 (43.4%) |
| Firefighting & Prevention | 2,996 (52.3%) | 2,728 (47.7%) |
| Law Enforcement | 1,575 (66.8%) | 784 (33.2%) |
| Food Preparation & Serving | 5,652 (47.0%) | 6,360 (52.9%) |
| Cleaning & Maintenance | 5,705 (56.3%) | 4,434 (43.7%) |
| Personal Care & Service | 1,850 (26.7%) | 5,092 (73.4%) |
| Total (Category) | 19,111 (39.2%) | 29,688 (60.8%) |
| Total (Overall) | 130,124 (47.2%) | 145,246 (52.7%) |
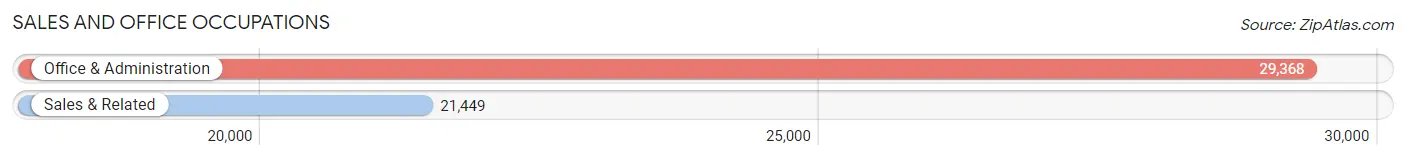
Sales and Office Occupations
The most common Sales and Office occupations in Baltimore city are Office & Administration (29,368 | 10.7%), and Sales & Related (21,449 | 7.8%).
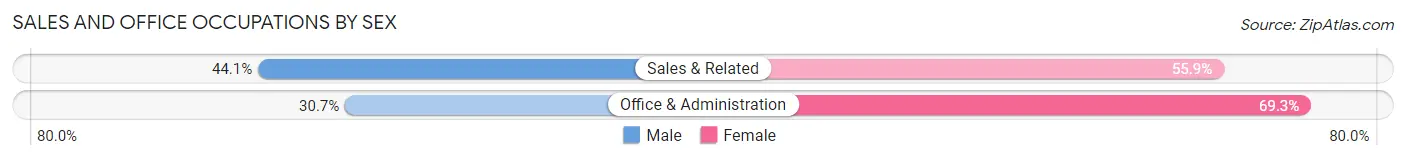
Sales and Office Occupations by Sex
| Occupation | Male | Female |
| Sales & Related | 9,456 (44.1%) | 11,993 (55.9%) |
| Office & Administration | 9,012 (30.7%) | 20,356 (69.3%) |
| Total (Category) | 18,468 (36.3%) | 32,349 (63.7%) |
| Total (Overall) | 130,124 (47.2%) | 145,246 (52.7%) |
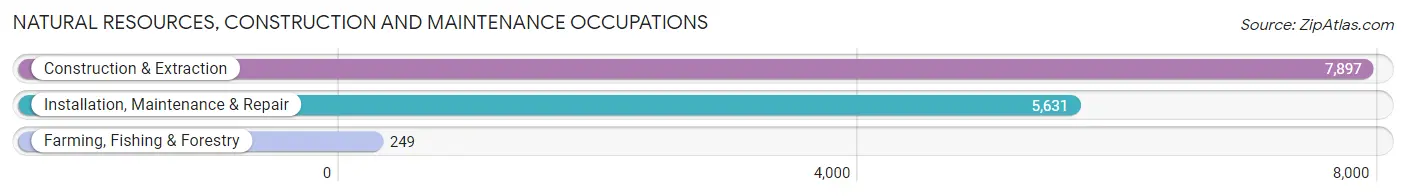
Natural Resources, Construction and Maintenance Occupations
The most common Natural Resources, Construction and Maintenance occupations in Baltimore city are Construction & Extraction (7,897 | 2.9%), Installation, Maintenance & Repair (5,631 | 2.0%), and Farming, Fishing & Forestry (249 | 0.1%).
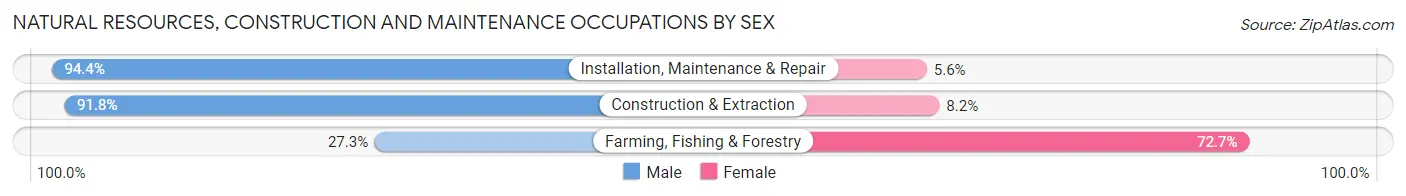
Natural Resources, Construction and Maintenance Occupations by Sex
| Occupation | Male | Female |
| Farming, Fishing & Forestry | 68 (27.3%) | 181 (72.7%) |
| Construction & Extraction | 7,248 (91.8%) | 649 (8.2%) |
| Installation, Maintenance & Repair | 5,315 (94.4%) | 316 (5.6%) |
| Total (Category) | 12,631 (91.7%) | 1,146 (8.3%) |
| Total (Overall) | 130,124 (47.2%) | 145,246 (52.7%) |
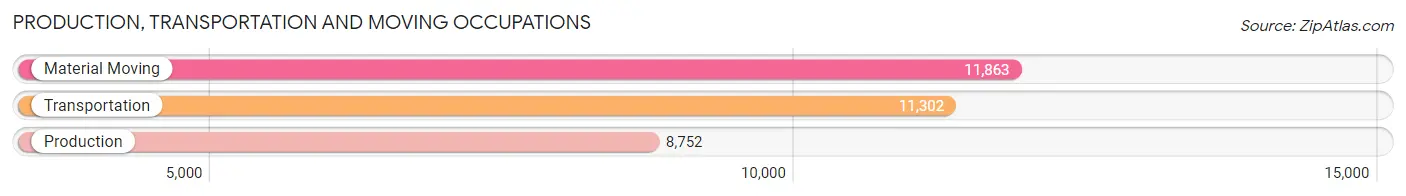
Production, Transportation and Moving Occupations
The most common Production, Transportation and Moving occupations in Baltimore city are Material Moving (11,863 | 4.3%), Transportation (11,302 | 4.1%), and Production (8,752 | 3.2%).
Production, Transportation and Moving Occupations by Sex
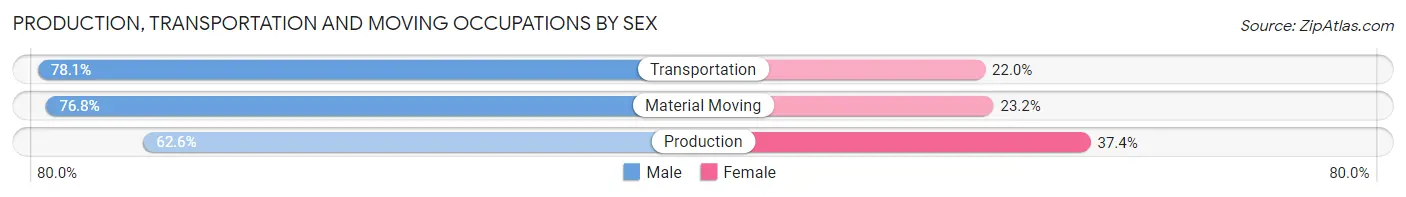
| Occupation | Male | Female |
| Production | 5,476 (62.6%) | 3,276 (37.4%) |
| Transportation | 8,821 (78.0%) | 2,481 (22.0%) |
| Material Moving | 9,112 (76.8%) | 2,751 (23.2%) |
| Total (Category) | 23,409 (73.3%) | 8,508 (26.7%) |
| Total (Overall) | 130,124 (47.2%) | 145,246 (52.7%) |
Employment Industries by Sex in Baltimore city
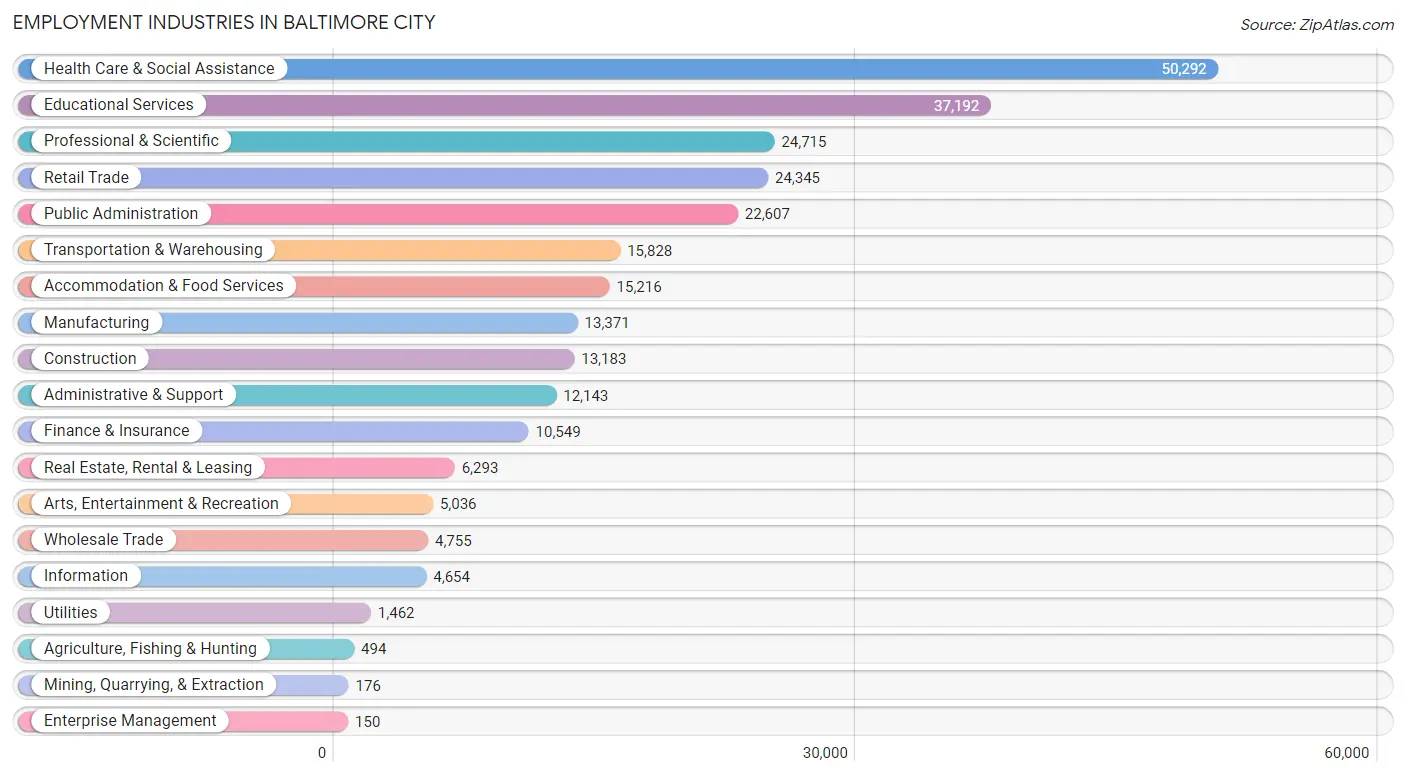
Employment Industries in Baltimore city
The major employment industries in Baltimore city include Health Care & Social Assistance (50,292 | 18.3%), Educational Services (37,192 | 13.5%), Professional & Scientific (24,715 | 9.0%), Retail Trade (24,345 | 8.8%), and Public Administration (22,607 | 8.2%).
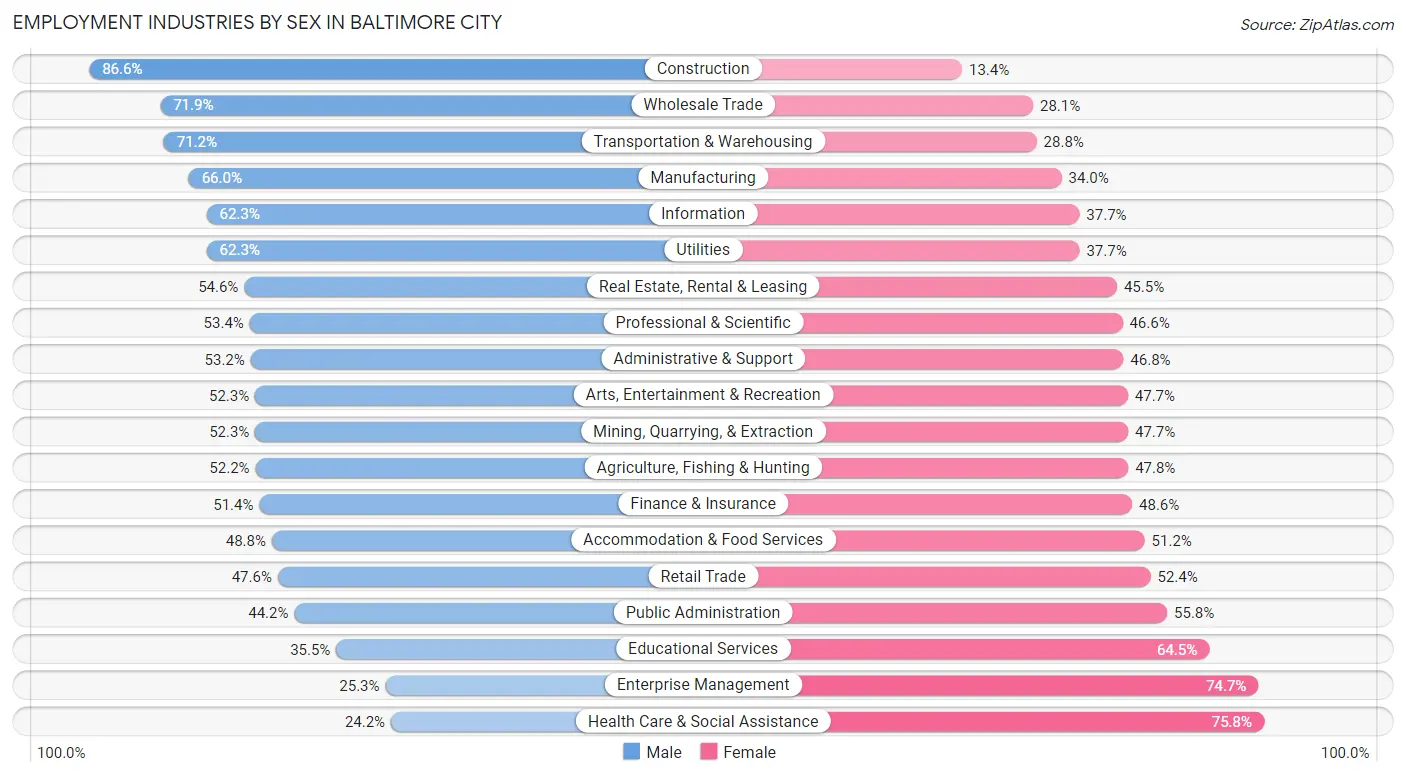
Employment Industries by Sex in Baltimore city
The Baltimore city industries that see more men than women are Construction (86.6%), Wholesale Trade (71.9%), and Transportation & Warehousing (71.2%), whereas the industries that tend to have a higher number of women are Health Care & Social Assistance (75.8%), Enterprise Management (74.7%), and Educational Services (64.5%).
| Industry | Male | Female |
| Agriculture, Fishing & Hunting | 258 (52.2%) | 236 (47.8%) |
| Mining, Quarrying, & Extraction | 92 (52.3%) | 84 (47.7%) |
| Construction | 11,419 (86.6%) | 1,764 (13.4%) |
| Manufacturing | 8,828 (66.0%) | 4,543 (34.0%) |
| Wholesale Trade | 3,420 (71.9%) | 1,335 (28.1%) |
| Retail Trade | 11,591 (47.6%) | 12,754 (52.4%) |
| Transportation & Warehousing | 11,266 (71.2%) | 4,562 (28.8%) |
| Utilities | 911 (62.3%) | 551 (37.7%) |
| Information | 2,901 (62.3%) | 1,753 (37.7%) |
| Finance & Insurance | 5,424 (51.4%) | 5,125 (48.6%) |
| Real Estate, Rental & Leasing | 3,433 (54.5%) | 2,860 (45.5%) |
| Professional & Scientific | 13,202 (53.4%) | 11,513 (46.6%) |
| Enterprise Management | 38 (25.3%) | 112 (74.7%) |
| Administrative & Support | 6,462 (53.2%) | 5,681 (46.8%) |
| Educational Services | 13,204 (35.5%) | 23,988 (64.5%) |
| Health Care & Social Assistance | 12,155 (24.2%) | 38,137 (75.8%) |
| Arts, Entertainment & Recreation | 2,634 (52.3%) | 2,402 (47.7%) |
| Accommodation & Food Services | 7,430 (48.8%) | 7,786 (51.2%) |
| Public Administration | 9,987 (44.2%) | 12,620 (55.8%) |
| Total | 130,124 (47.2%) | 145,246 (52.7%) |
Education in Baltimore city
School Enrollment in Baltimore city
The most common levels of schooling among the 141,438 students in Baltimore city are college / undergraduate (32,863 | 23.2%), middle school (27,728 | 19.6%), and high school (24,390 | 17.2%).
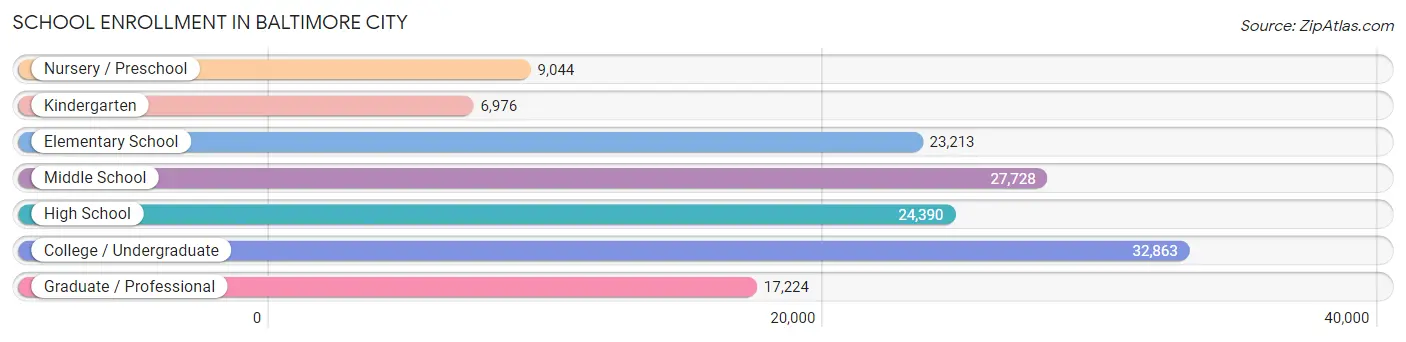
| School Level | # Students | % Students |
| Nursery / Preschool | 9,044 | 6.4% |
| Kindergarten | 6,976 | 4.9% |
| Elementary School | 23,213 | 16.4% |
| Middle School | 27,728 | 19.6% |
| High School | 24,390 | 17.2% |
| College / Undergraduate | 32,863 | 23.2% |
| Graduate / Professional | 17,224 | 12.2% |
| Total | 141,438 | 100.0% |
School Enrollment by Age by Funding Source in Baltimore city
Out of a total of 141,438 students who are enrolled in schools in Baltimore city, 36,350 (25.7%) attend a private institution, while the remaining 105,088 (74.3%) are enrolled in public schools. The age group of 18 to 19 year olds has the highest likelihood of being enrolled in private schools, with 5,684 (43.5% in the age bracket) enrolled. Conversely, the age group of 10 to 14 year olds has the lowest likelihood of being enrolled in a private school, with 27,442 (85.0% in the age bracket) attending a public institution.
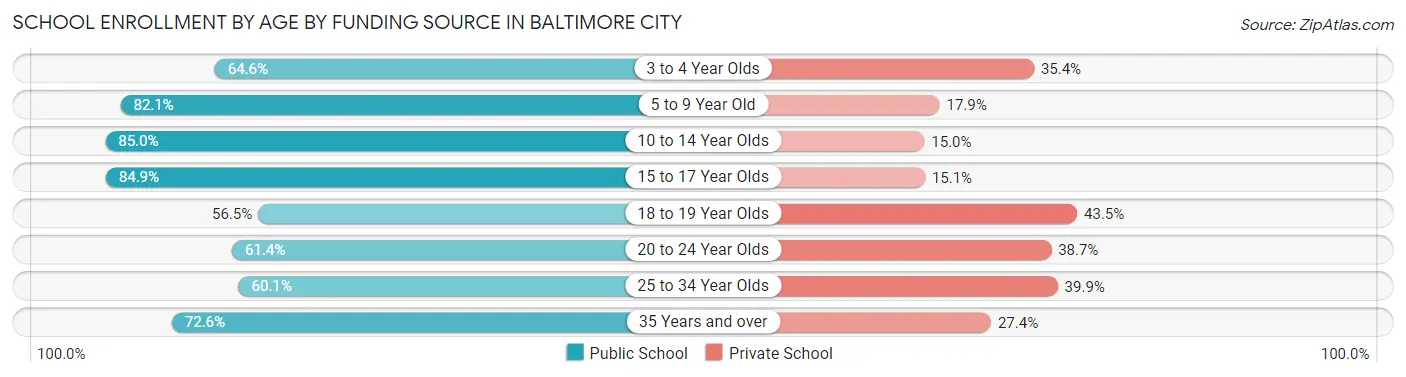
| Age Bracket | Public School | Private School |
| 3 to 4 Year Olds | 4,648 (64.6%) | 2,552 (35.4%) |
| 5 to 9 Year Old | 24,134 (82.1%) | 5,246 (17.9%) |
| 10 to 14 Year Olds | 27,442 (85.0%) | 4,853 (15.0%) |
| 15 to 17 Year Olds | 14,798 (84.9%) | 2,641 (15.1%) |
| 18 to 19 Year Olds | 7,390 (56.5%) | 5,684 (43.5%) |
| 20 to 24 Year Olds | 9,892 (61.4%) | 6,232 (38.7%) |
| 25 to 34 Year Olds | 9,597 (60.1%) | 6,360 (39.9%) |
| 35 Years and over | 7,234 (72.6%) | 2,735 (27.4%) |
| Total | 105,088 (74.3%) | 36,350 (25.7%) |
Educational Attainment by Field of Study in Baltimore city
Business (21,610 | 13.8%), social sciences (17,641 | 11.3%), science & technology (14,322 | 9.1%), bio, nature & agricultural (12,705 | 8.1%), and visual & performing arts (11,615 | 7.4%) are the most common fields of study among 156,850 individuals in Baltimore city who have obtained a bachelor's degree or higher.
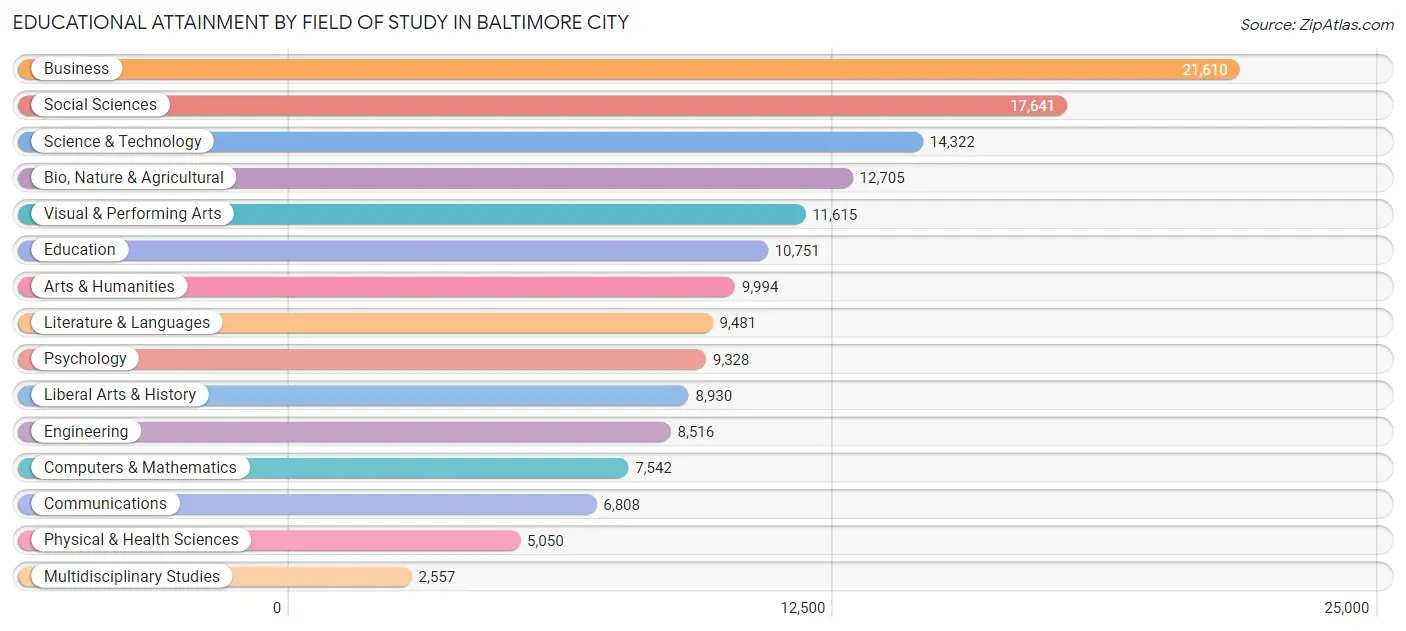
| Field of Study | # Graduates | % Graduates |
| Computers & Mathematics | 7,542 | 4.8% |
| Bio, Nature & Agricultural | 12,705 | 8.1% |
| Physical & Health Sciences | 5,050 | 3.2% |
| Psychology | 9,328 | 5.9% |
| Social Sciences | 17,641 | 11.3% |
| Engineering | 8,516 | 5.4% |
| Multidisciplinary Studies | 2,557 | 1.6% |
| Science & Technology | 14,322 | 9.1% |
| Business | 21,610 | 13.8% |
| Education | 10,751 | 6.9% |
| Literature & Languages | 9,481 | 6.0% |
| Liberal Arts & History | 8,930 | 5.7% |
| Visual & Performing Arts | 11,615 | 7.4% |
| Communications | 6,808 | 4.3% |
| Arts & Humanities | 9,994 | 6.4% |
| Total | 156,850 | 100.0% |
Transportation & Commute in Baltimore city
Vehicle Availability by Sex in Baltimore city
The most prevalent vehicle ownership categories in Baltimore city are males with 2 vehicles (47,038, accounting for 37.1%) and females with 2 vehicles (47,207, making up 33.7%).
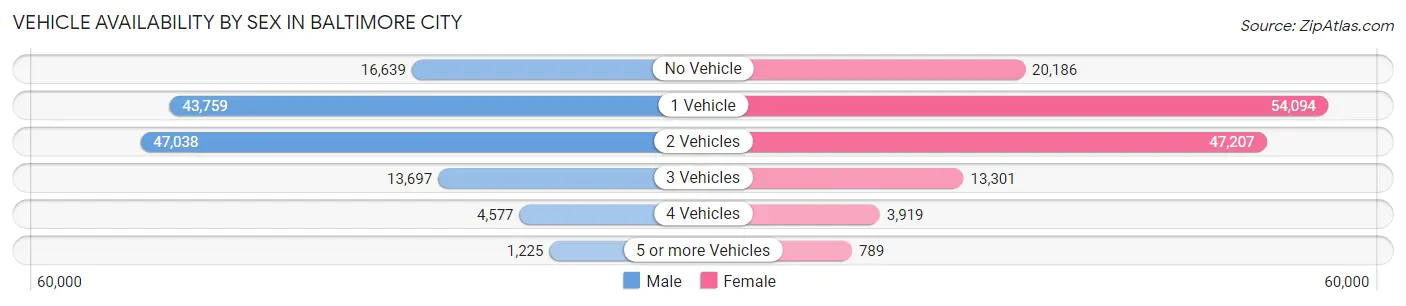
| Vehicles Available | Male | Female |
| No Vehicle | 16,639 (13.1%) | 20,186 (14.5%) |
| 1 Vehicle | 43,759 (34.5%) | 54,094 (38.8%) |
| 2 Vehicles | 47,038 (37.1%) | 47,207 (33.8%) |
| 3 Vehicles | 13,697 (10.8%) | 13,301 (9.5%) |
| 4 Vehicles | 4,577 (3.6%) | 3,919 (2.8%) |
| 5 or more Vehicles | 1,225 (1.0%) | 789 (0.6%) |
| Total | 126,935 (100.0%) | 139,496 (100.0%) |
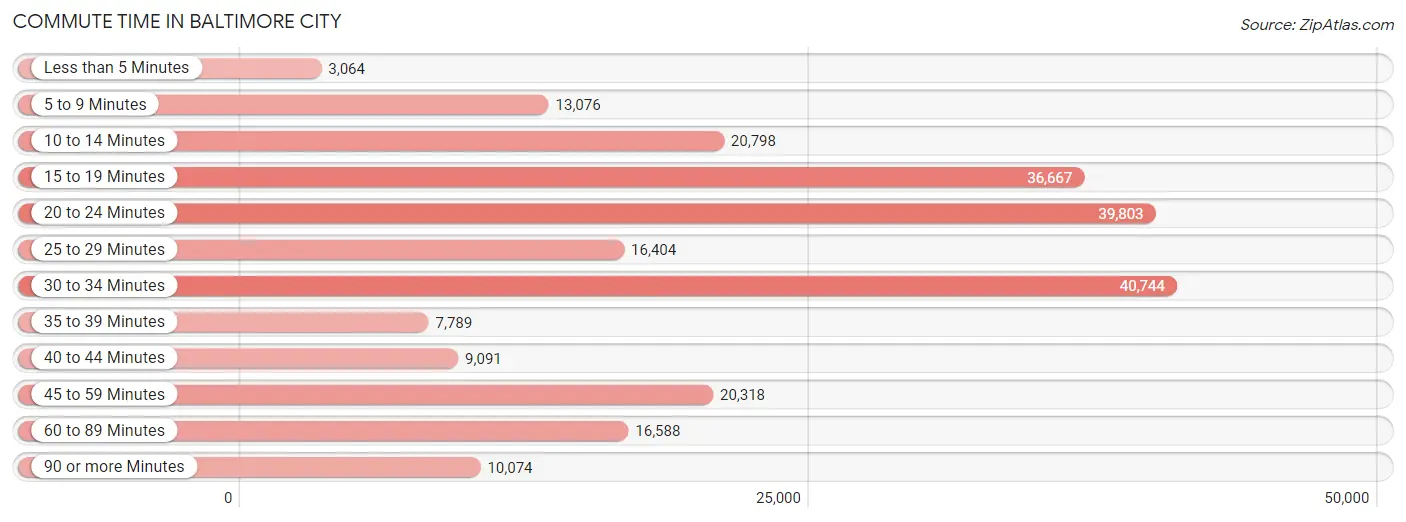
Commute Time in Baltimore city
The most frequently occuring commute durations in Baltimore city are 30 to 34 minutes (40,744 commuters, 17.4%), 20 to 24 minutes (39,803 commuters, 17.0%), and 15 to 19 minutes (36,667 commuters, 15.6%).
| Commute Time | # Commuters | % Commuters |
| Less than 5 Minutes | 3,064 | 1.3% |
| 5 to 9 Minutes | 13,076 | 5.6% |
| 10 to 14 Minutes | 20,798 | 8.9% |
| 15 to 19 Minutes | 36,667 | 15.6% |
| 20 to 24 Minutes | 39,803 | 17.0% |
| 25 to 29 Minutes | 16,404 | 7.0% |
| 30 to 34 Minutes | 40,744 | 17.4% |
| 35 to 39 Minutes | 7,789 | 3.3% |
| 40 to 44 Minutes | 9,091 | 3.9% |
| 45 to 59 Minutes | 20,318 | 8.7% |
| 60 to 89 Minutes | 16,588 | 7.1% |
| 90 or more Minutes | 10,074 | 4.3% |
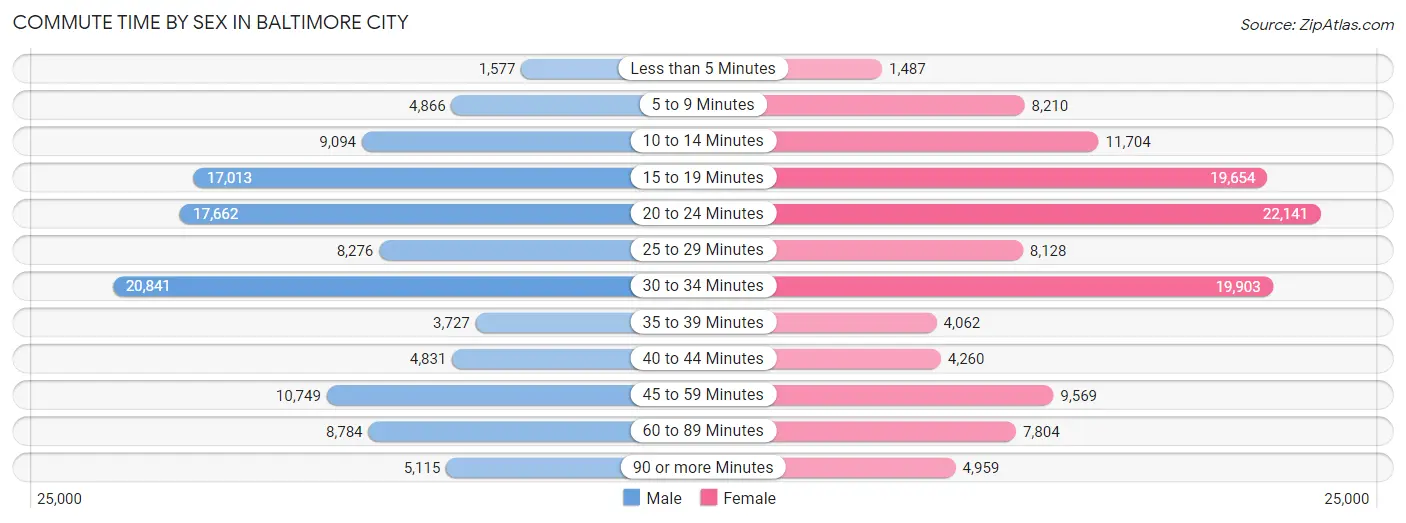
Commute Time by Sex in Baltimore city
The most common commute times in Baltimore city are 30 to 34 minutes (20,841 commuters, 18.5%) for males and 20 to 24 minutes (22,141 commuters, 18.2%) for females.
| Commute Time | Male | Female |
| Less than 5 Minutes | 1,577 (1.4%) | 1,487 (1.2%) |
| 5 to 9 Minutes | 4,866 (4.3%) | 8,210 (6.7%) |
| 10 to 14 Minutes | 9,094 (8.1%) | 11,704 (9.6%) |
| 15 to 19 Minutes | 17,013 (15.1%) | 19,654 (16.1%) |
| 20 to 24 Minutes | 17,662 (15.7%) | 22,141 (18.2%) |
| 25 to 29 Minutes | 8,276 (7.3%) | 8,128 (6.7%) |
| 30 to 34 Minutes | 20,841 (18.5%) | 19,903 (16.3%) |
| 35 to 39 Minutes | 3,727 (3.3%) | 4,062 (3.3%) |
| 40 to 44 Minutes | 4,831 (4.3%) | 4,260 (3.5%) |
| 45 to 59 Minutes | 10,749 (9.6%) | 9,569 (7.9%) |
| 60 to 89 Minutes | 8,784 (7.8%) | 7,804 (6.4%) |
| 90 or more Minutes | 5,115 (4.5%) | 4,959 (4.1%) |
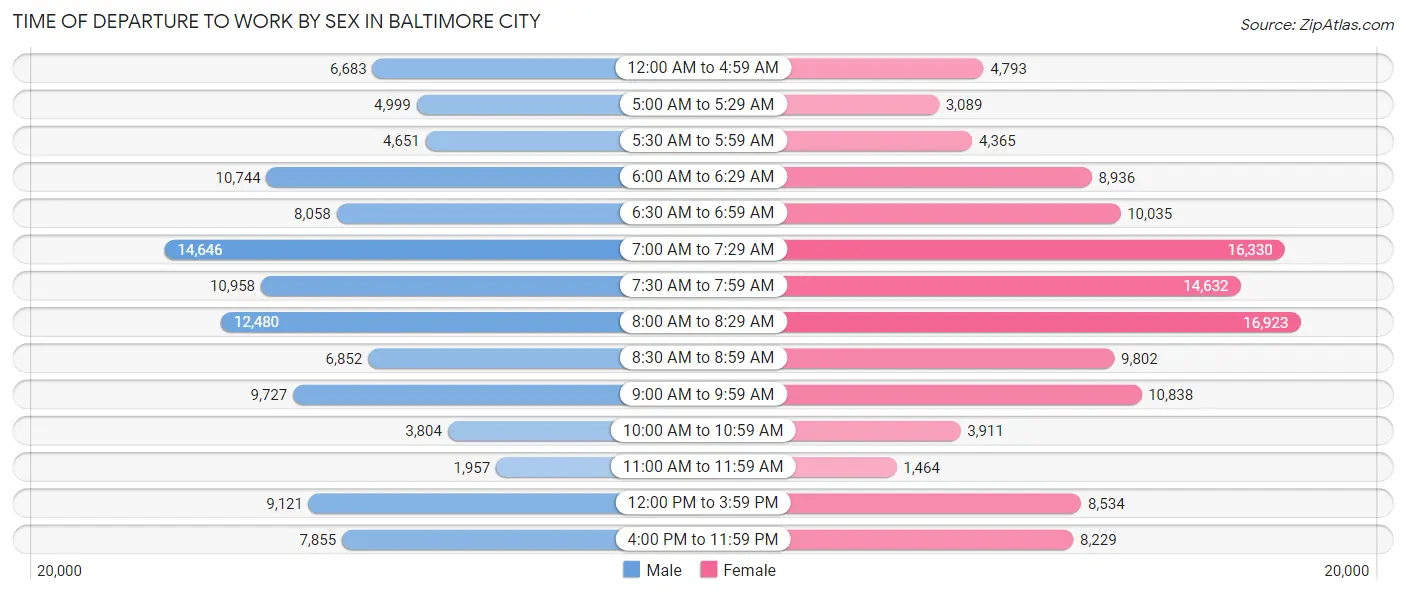
Time of Departure to Work by Sex in Baltimore city
The most frequent times of departure to work in Baltimore city are 7:00 AM to 7:29 AM (14,646, 13.0%) for males and 8:00 AM to 8:29 AM (16,923, 13.9%) for females.
| Time of Departure | Male | Female |
| 12:00 AM to 4:59 AM | 6,683 (5.9%) | 4,793 (3.9%) |
| 5:00 AM to 5:29 AM | 4,999 (4.4%) | 3,089 (2.5%) |
| 5:30 AM to 5:59 AM | 4,651 (4.1%) | 4,365 (3.6%) |
| 6:00 AM to 6:29 AM | 10,744 (9.6%) | 8,936 (7.3%) |
| 6:30 AM to 6:59 AM | 8,058 (7.2%) | 10,035 (8.2%) |
| 7:00 AM to 7:29 AM | 14,646 (13.0%) | 16,330 (13.4%) |
| 7:30 AM to 7:59 AM | 10,958 (9.7%) | 14,632 (12.0%) |
| 8:00 AM to 8:29 AM | 12,480 (11.1%) | 16,923 (13.9%) |
| 8:30 AM to 8:59 AM | 6,852 (6.1%) | 9,802 (8.0%) |
| 9:00 AM to 9:59 AM | 9,727 (8.6%) | 10,838 (8.9%) |
| 10:00 AM to 10:59 AM | 3,804 (3.4%) | 3,911 (3.2%) |
| 11:00 AM to 11:59 AM | 1,957 (1.7%) | 1,464 (1.2%) |
| 12:00 PM to 3:59 PM | 9,121 (8.1%) | 8,534 (7.0%) |
| 4:00 PM to 11:59 PM | 7,855 (7.0%) | 8,229 (6.8%) |
| Total | 112,535 (100.0%) | 121,881 (100.0%) |
Housing Occupancy in Baltimore city
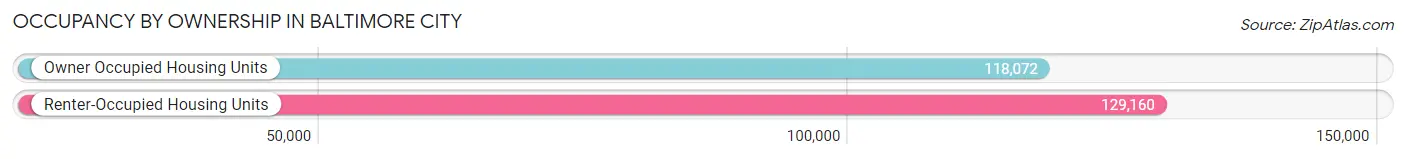
Occupancy by Ownership in Baltimore city
Of the total 247,232 dwellings in Baltimore city, owner-occupied units account for 118,072 (47.8%), while renter-occupied units make up 129,160 (52.2%).
| Occupancy | # Housing Units | % Housing Units |
| Owner Occupied Housing Units | 118,072 | 47.8% |
| Renter-Occupied Housing Units | 129,160 | 52.2% |
| Total Occupied Housing Units | 247,232 | 100.0% |
Occupancy by Household Size in Baltimore city
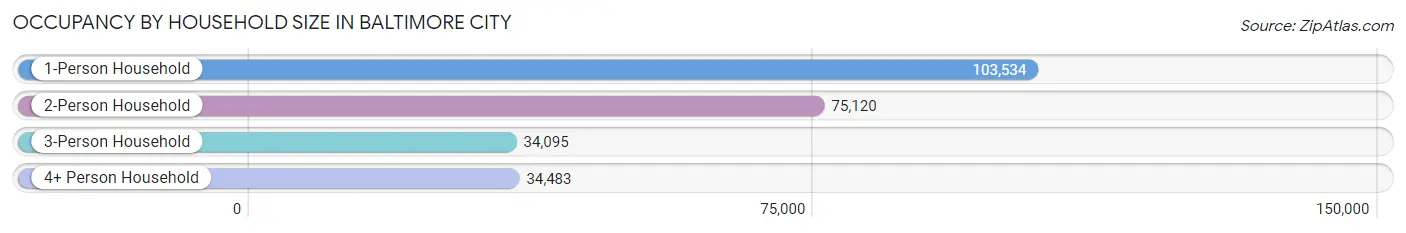
| Household Size | # Housing Units | % Housing Units |
| 1-Person Household | 103,534 | 41.9% |
| 2-Person Household | 75,120 | 30.4% |
| 3-Person Household | 34,095 | 13.8% |
| 4+ Person Household | 34,483 | 14.0% |
| Total Housing Units | 247,232 | 100.0% |
Occupancy by Ownership by Household Size in Baltimore city
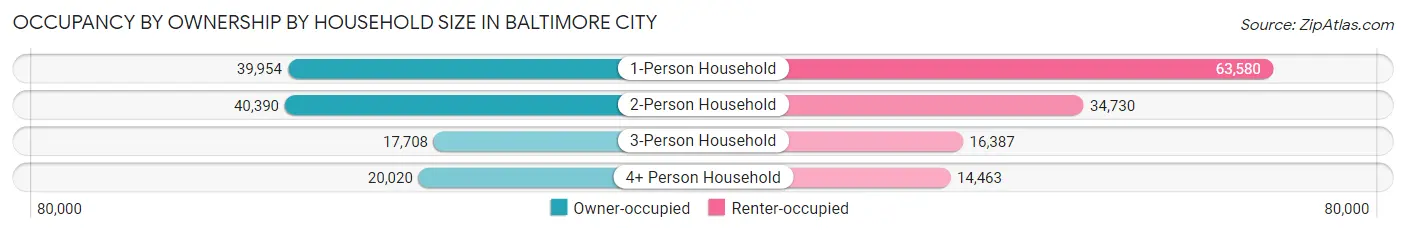
| Household Size | Owner-occupied | Renter-occupied |
| 1-Person Household | 39,954 (38.6%) | 63,580 (61.4%) |
| 2-Person Household | 40,390 (53.8%) | 34,730 (46.2%) |
| 3-Person Household | 17,708 (51.9%) | 16,387 (48.1%) |
| 4+ Person Household | 20,020 (58.1%) | 14,463 (41.9%) |
| Total Housing Units | 118,072 (47.8%) | 129,160 (52.2%) |
Occupancy by Educational Attainment in Baltimore city
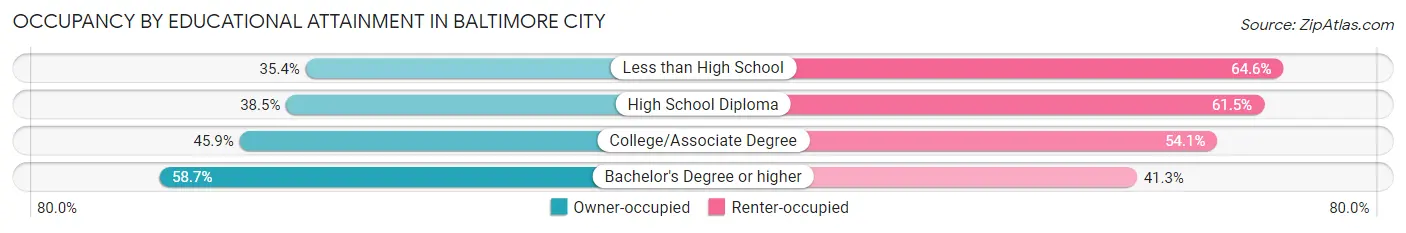
| Household Size | Owner-occupied | Renter-occupied |
| Less than High School | 10,077 (35.4%) | 18,371 (64.6%) |
| High School Diploma | 23,070 (38.5%) | 36,852 (61.5%) |
| College/Associate Degree | 29,839 (45.9%) | 35,155 (54.1%) |
| Bachelor's Degree or higher | 55,086 (58.7%) | 38,782 (41.3%) |
Occupancy by Age of Householder in Baltimore city
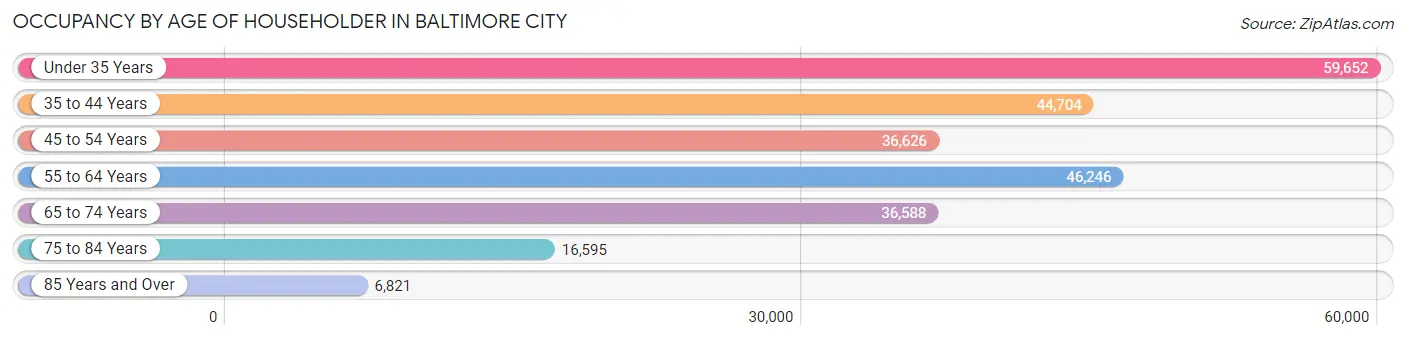
| Age Bracket | # Households | % Households |
| Under 35 Years | 59,652 | 24.1% |
| 35 to 44 Years | 44,704 | 18.1% |
| 45 to 54 Years | 36,626 | 14.8% |
| 55 to 64 Years | 46,246 | 18.7% |
| 65 to 74 Years | 36,588 | 14.8% |
| 75 to 84 Years | 16,595 | 6.7% |
| 85 Years and Over | 6,821 | 2.8% |
| Total | 247,232 | 100.0% |
Housing Finances in Baltimore city
Median Income by Occupancy in Baltimore city
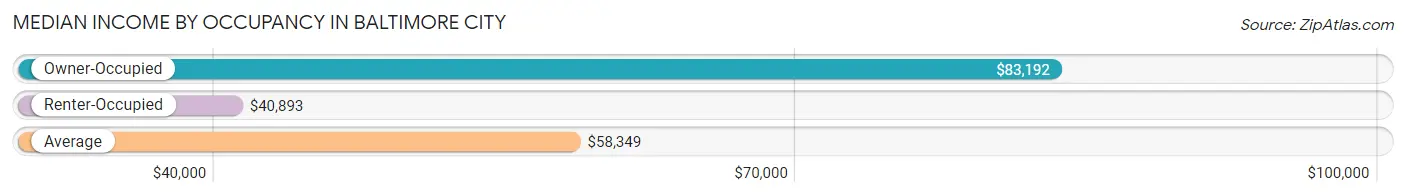
| Occupancy Type | # Households | Median Income |
| Owner-Occupied | 118,072 (47.8%) | $83,192 |
| Renter-Occupied | 129,160 (52.2%) | $40,893 |
| Average | 247,232 (100.0%) | $58,349 |
Occupancy by Householder Income Bracket in Baltimore city
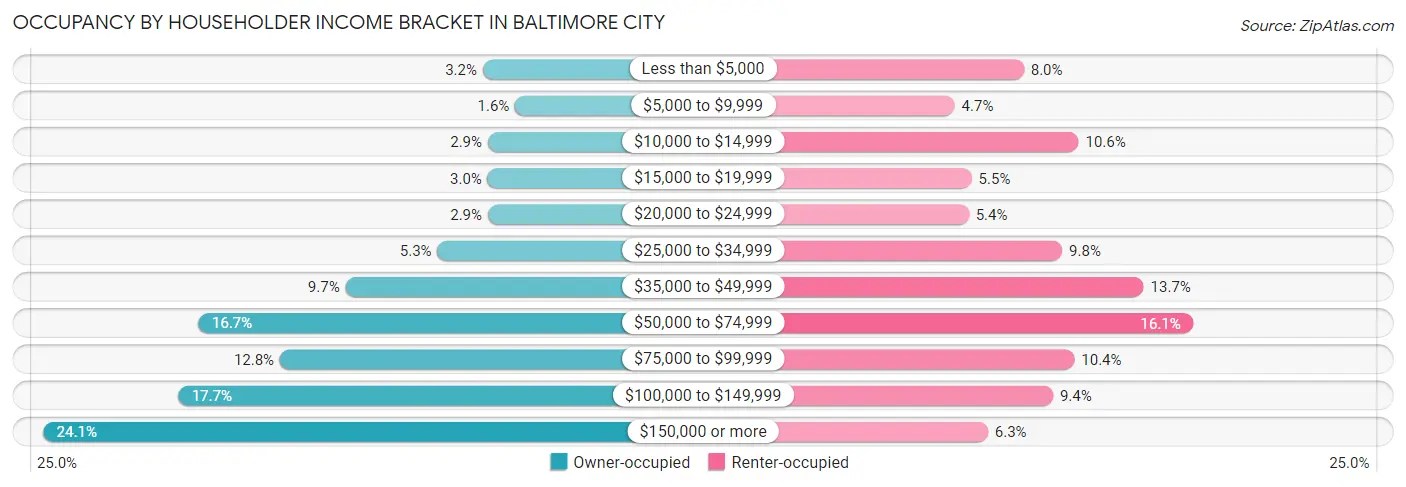
| Income Bracket | Owner-occupied | Renter-occupied |
| Less than $5,000 | 3,753 (3.2%) | 10,340 (8.0%) |
| $5,000 to $9,999 | 1,939 (1.6%) | 6,097 (4.7%) |
| $10,000 to $14,999 | 3,473 (2.9%) | 13,720 (10.6%) |
| $15,000 to $19,999 | 3,484 (2.9%) | 7,146 (5.5%) |
| $20,000 to $24,999 | 3,477 (2.9%) | 6,967 (5.4%) |
| $25,000 to $34,999 | 6,304 (5.3%) | 12,707 (9.8%) |
| $35,000 to $49,999 | 11,475 (9.7%) | 17,716 (13.7%) |
| $50,000 to $74,999 | 19,714 (16.7%) | 20,735 (16.1%) |
| $75,000 to $99,999 | 15,161 (12.8%) | 13,458 (10.4%) |
| $100,000 to $149,999 | 20,854 (17.7%) | 12,139 (9.4%) |
| $150,000 or more | 28,438 (24.1%) | 8,135 (6.3%) |
| Total | 118,072 (100.0%) | 129,160 (100.0%) |
Monthly Housing Cost Tiers in Baltimore city
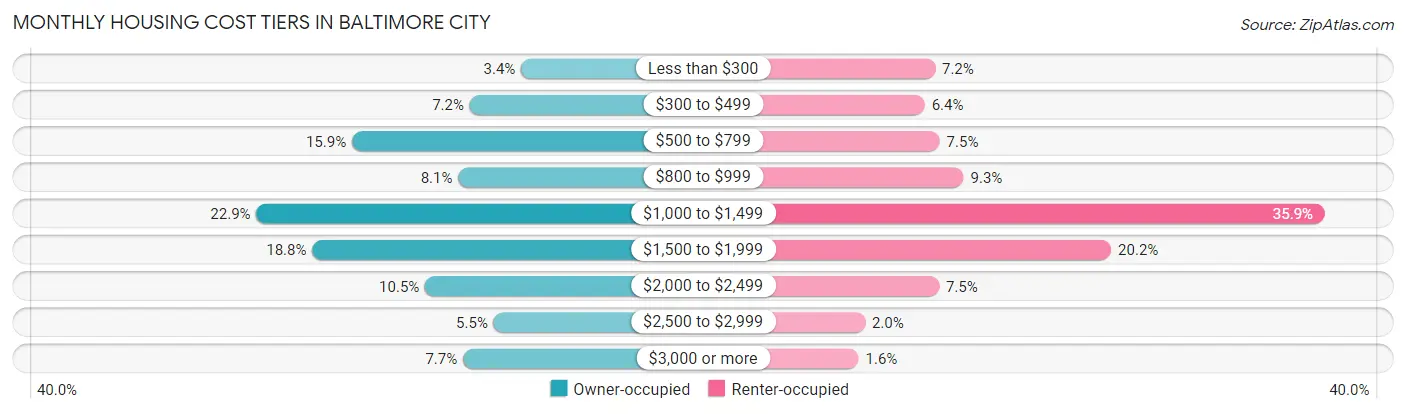
| Monthly Cost | Owner-occupied | Renter-occupied |
| Less than $300 | 4,044 (3.4%) | 9,289 (7.2%) |
| $300 to $499 | 8,517 (7.2%) | 8,308 (6.4%) |
| $500 to $799 | 18,758 (15.9%) | 9,727 (7.5%) |
| $800 to $999 | 9,514 (8.1%) | 12,001 (9.3%) |
| $1,000 to $1,499 | 27,078 (22.9%) | 46,363 (35.9%) |
| $1,500 to $1,999 | 22,215 (18.8%) | 26,044 (20.2%) |
| $2,000 to $2,499 | 12,400 (10.5%) | 9,659 (7.5%) |
| $2,500 to $2,999 | 6,438 (5.4%) | 2,623 (2.0%) |
| $3,000 or more | 9,108 (7.7%) | 2,012 (1.6%) |
| Total | 118,072 (100.0%) | 129,160 (100.0%) |
Physical Housing Characteristics in Baltimore city
Housing Structures in Baltimore city
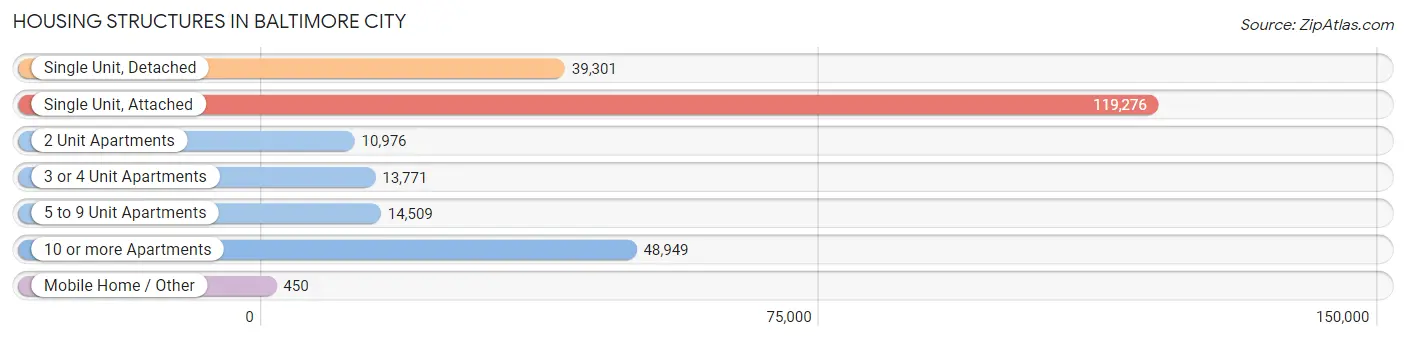
| Structure Type | # Housing Units | % Housing Units |
| Single Unit, Detached | 39,301 | 15.9% |
| Single Unit, Attached | 119,276 | 48.2% |
| 2 Unit Apartments | 10,976 | 4.4% |
| 3 or 4 Unit Apartments | 13,771 | 5.6% |
| 5 to 9 Unit Apartments | 14,509 | 5.9% |
| 10 or more Apartments | 48,949 | 19.8% |
| Mobile Home / Other | 450 | 0.2% |
| Total | 247,232 | 100.0% |
Housing Structures by Occupancy in Baltimore city
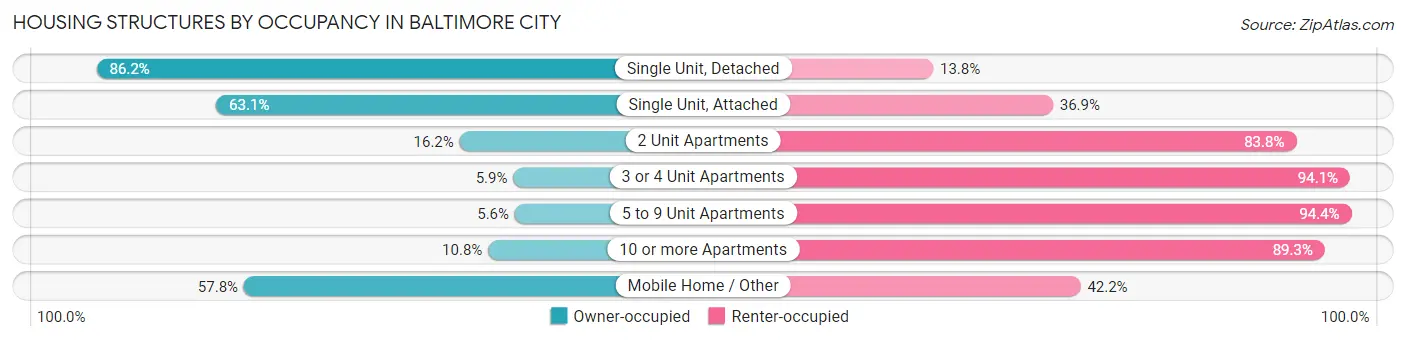
| Structure Type | Owner-occupied | Renter-occupied |
| Single Unit, Detached | 33,861 (86.2%) | 5,440 (13.8%) |
| Single Unit, Attached | 75,279 (63.1%) | 43,997 (36.9%) |
| 2 Unit Apartments | 1,782 (16.2%) | 9,194 (83.8%) |
| 3 or 4 Unit Apartments | 814 (5.9%) | 12,957 (94.1%) |
| 5 to 9 Unit Apartments | 814 (5.6%) | 13,695 (94.4%) |
| 10 or more Apartments | 5,262 (10.7%) | 43,687 (89.2%) |
| Mobile Home / Other | 260 (57.8%) | 190 (42.2%) |
| Total | 118,072 (47.8%) | 129,160 (52.2%) |
Housing Structures by Number of Rooms in Baltimore city
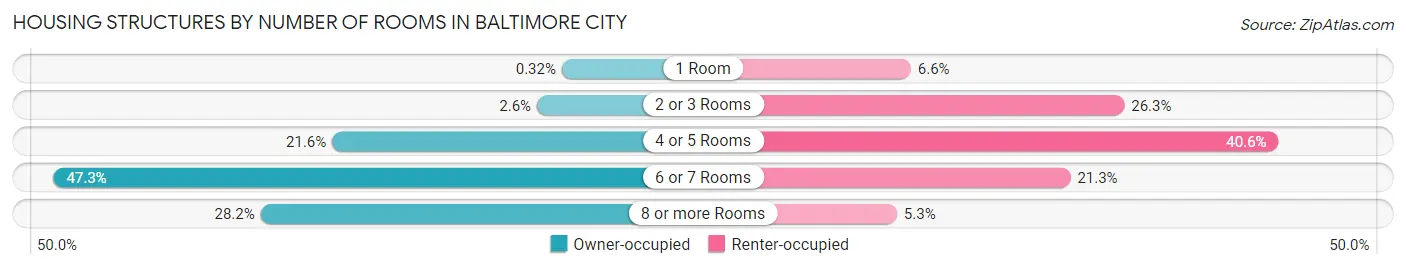
| Number of Rooms | Owner-occupied | Renter-occupied |
| 1 Room | 383 (0.3%) | 8,473 (6.6%) |
| 2 or 3 Rooms | 3,089 (2.6%) | 33,974 (26.3%) |
| 4 or 5 Rooms | 25,455 (21.6%) | 52,371 (40.6%) |
| 6 or 7 Rooms | 55,878 (47.3%) | 27,539 (21.3%) |
| 8 or more Rooms | 33,267 (28.2%) | 6,803 (5.3%) |
| Total | 118,072 (100.0%) | 129,160 (100.0%) |
Housing Structure by Heating Type in Baltimore city
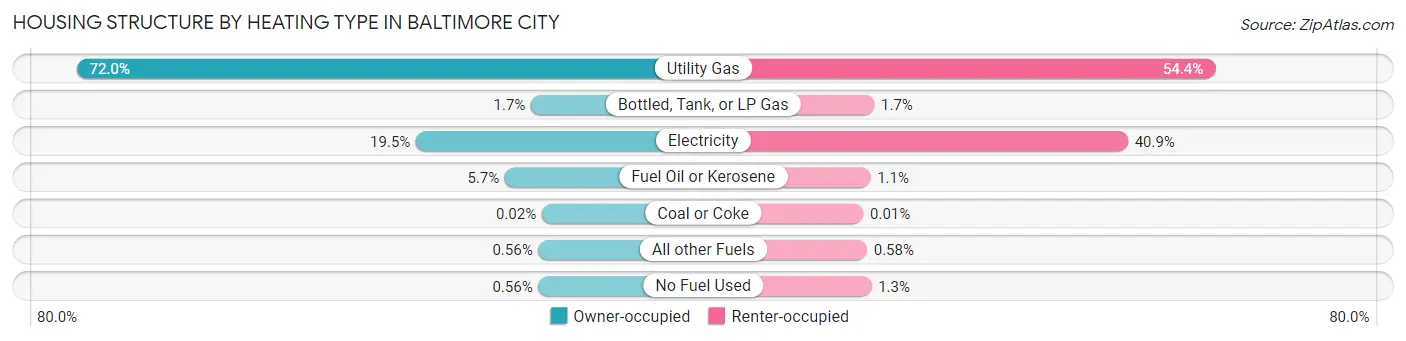
| Heating Type | Owner-occupied | Renter-occupied |
| Utility Gas | 84,980 (72.0%) | 70,290 (54.4%) |
| Bottled, Tank, or LP Gas | 2,001 (1.7%) | 2,206 (1.7%) |
| Electricity | 22,991 (19.5%) | 52,843 (40.9%) |
| Fuel Oil or Kerosene | 6,750 (5.7%) | 1,439 (1.1%) |
| Coal or Coke | 22 (0.0%) | 13 (0.0%) |
| All other Fuels | 662 (0.6%) | 745 (0.6%) |
| No Fuel Used | 666 (0.6%) | 1,624 (1.3%) |
| Total | 118,072 (100.0%) | 129,160 (100.0%) |
Household Vehicle Usage in Baltimore city
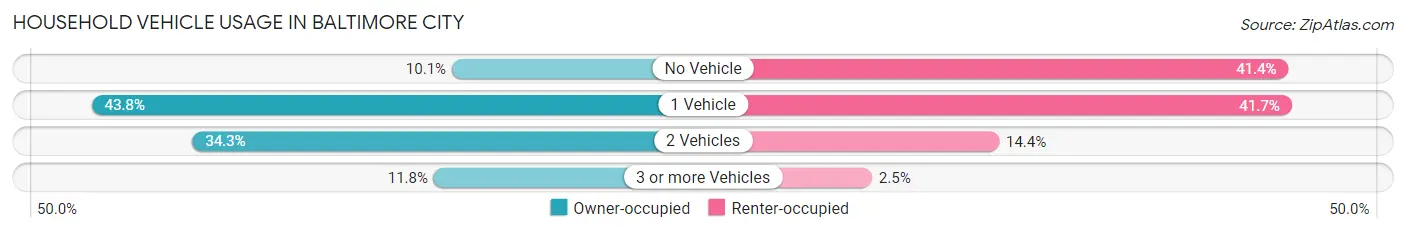
| Vehicles per Household | Owner-occupied | Renter-occupied |
| No Vehicle | 11,932 (10.1%) | 53,466 (41.4%) |
| 1 Vehicle | 51,655 (43.8%) | 53,857 (41.7%) |
| 2 Vehicles | 40,548 (34.3%) | 18,585 (14.4%) |
| 3 or more Vehicles | 13,937 (11.8%) | 3,252 (2.5%) |
| Total | 118,072 (100.0%) | 129,160 (100.0%) |
Real Estate & Mortgages in Baltimore city
Real Estate and Mortgage Overview in Baltimore city
| Characteristic | Without Mortgage | With Mortgage |
| Housing Units | 38,139 | 79,933 |
| Median Property Value | $160,300 | $222,200 |
| Median Household Income | $59,394 | $23,304 |
| Monthly Housing Costs | $619 | $8,759 |
| Real Estate Taxes | $2,568 | $2,416 |
Property Value by Mortgage Status in Baltimore city
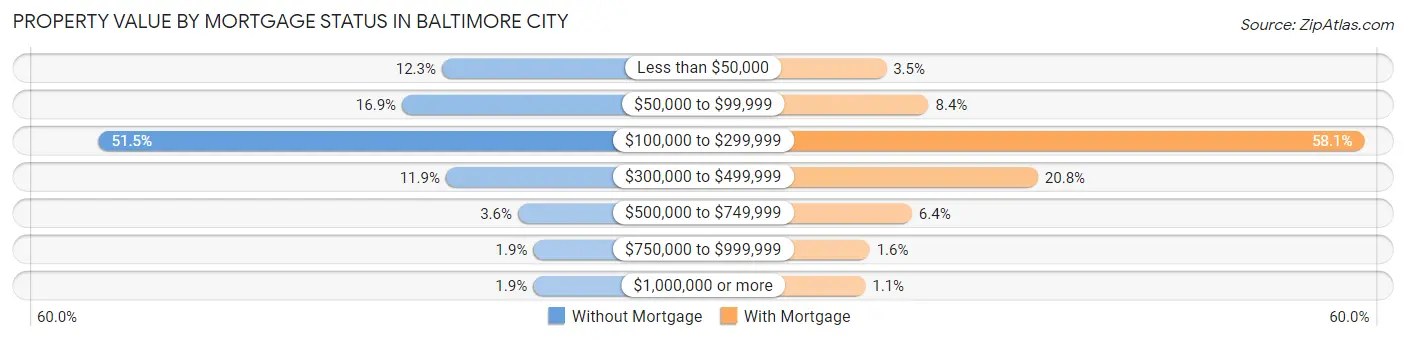
| Property Value | Without Mortgage | With Mortgage |
| Less than $50,000 | 4,698 (12.3%) | 2,800 (3.5%) |
| $50,000 to $99,999 | 6,437 (16.9%) | 6,673 (8.4%) |
| $100,000 to $299,999 | 19,656 (51.5%) | 46,463 (58.1%) |
| $300,000 to $499,999 | 4,528 (11.9%) | 16,662 (20.8%) |
| $500,000 to $749,999 | 1,383 (3.6%) | 5,146 (6.4%) |
| $750,000 to $999,999 | 714 (1.9%) | 1,293 (1.6%) |
| $1,000,000 or more | 723 (1.9%) | 896 (1.1%) |
| Total | 38,139 (100.0%) | 79,933 (100.0%) |
Household Income by Mortgage Status in Baltimore city
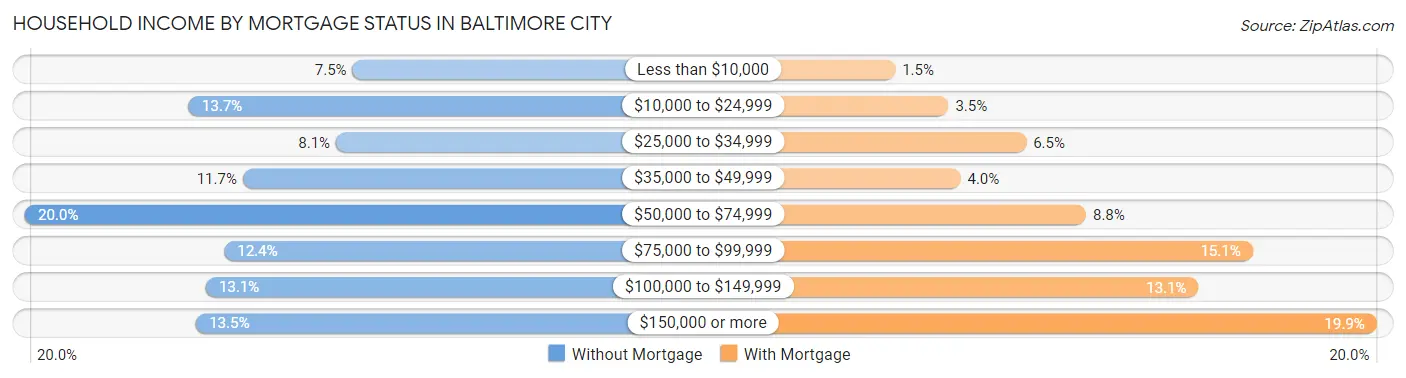
| Household Income | Without Mortgage | With Mortgage |
| Less than $10,000 | 2,865 (7.5%) | 1,203 (1.5%) |
| $10,000 to $24,999 | 5,239 (13.7%) | 2,827 (3.5%) |
| $25,000 to $34,999 | 3,105 (8.1%) | 5,195 (6.5%) |
| $35,000 to $49,999 | 4,460 (11.7%) | 3,199 (4.0%) |
| $50,000 to $74,999 | 7,621 (20.0%) | 7,015 (8.8%) |
| $75,000 to $99,999 | 4,724 (12.4%) | 12,093 (15.1%) |
| $100,000 to $149,999 | 4,991 (13.1%) | 10,437 (13.1%) |
| $150,000 or more | 5,134 (13.5%) | 15,863 (19.9%) |
| Total | 38,139 (100.0%) | 79,933 (100.0%) |
Property Value to Household Income Ratio in Baltimore city
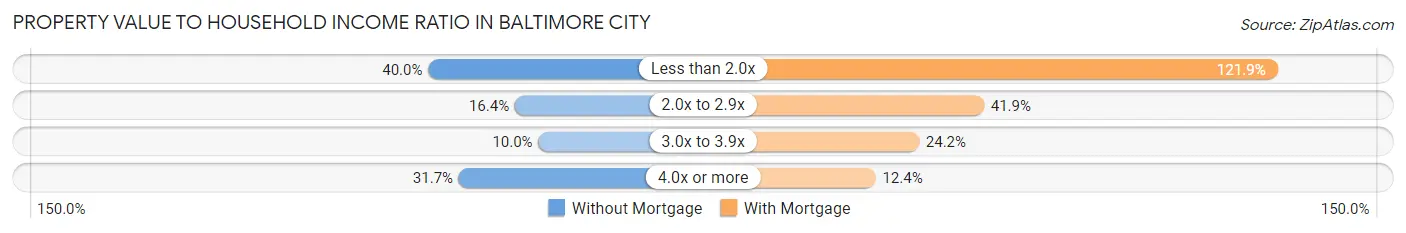
| Value-to-Income Ratio | Without Mortgage | With Mortgage |
| Less than 2.0x | 15,263 (40.0%) | 97,454 (121.9%) |
| 2.0x to 2.9x | 6,258 (16.4%) | 33,507 (41.9%) |
| 3.0x to 3.9x | 3,820 (10.0%) | 19,367 (24.2%) |
| 4.0x or more | 12,083 (31.7%) | 9,916 (12.4%) |
| Total | 38,139 (100.0%) | 79,933 (100.0%) |
Real Estate Taxes by Mortgage Status in Baltimore city
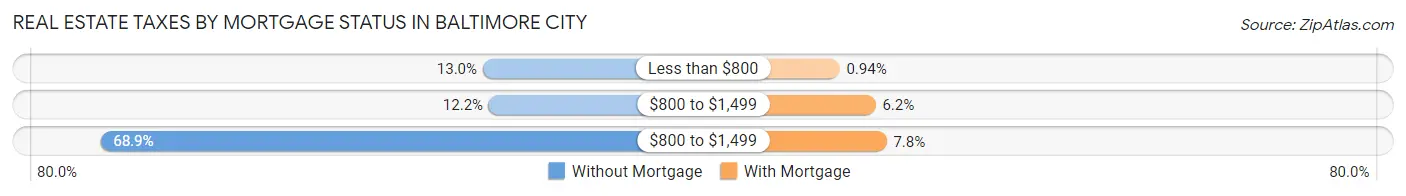
| Property Taxes | Without Mortgage | With Mortgage |
| Less than $800 | 4,973 (13.0%) | 750 (0.9%) |
| $800 to $1,499 | 4,638 (12.2%) | 4,956 (6.2%) |
| $800 to $1,499 | 26,293 (68.9%) | 6,245 (7.8%) |
| Total | 38,139 (100.0%) | 79,933 (100.0%) |
Health & Disability in Baltimore city
Health Insurance Coverage by Age in Baltimore city
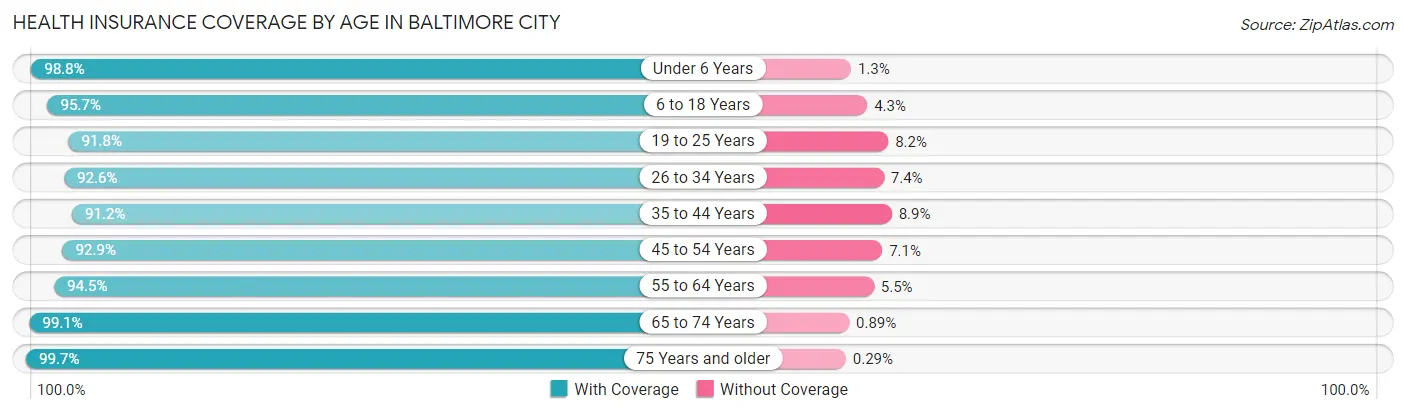
| Age Bracket | With Coverage | Without Coverage |
| Under 6 Years | 42,096 (98.8%) | 531 (1.3%) |
| 6 to 18 Years | 80,934 (95.7%) | 3,616 (4.3%) |
| 19 to 25 Years | 51,523 (91.8%) | 4,597 (8.2%) |
| 26 to 34 Years | 89,168 (92.6%) | 7,095 (7.4%) |
| 35 to 44 Years | 69,868 (91.1%) | 6,786 (8.8%) |
| 45 to 54 Years | 58,929 (92.9%) | 4,482 (7.1%) |
| 55 to 64 Years | 69,090 (94.5%) | 4,028 (5.5%) |
| 65 to 74 Years | 51,309 (99.1%) | 459 (0.9%) |
| 75 Years and older | 32,220 (99.7%) | 95 (0.3%) |
| Total | 545,137 (94.5%) | 31,689 (5.5%) |
Health Insurance Coverage by Citizenship Status in Baltimore city
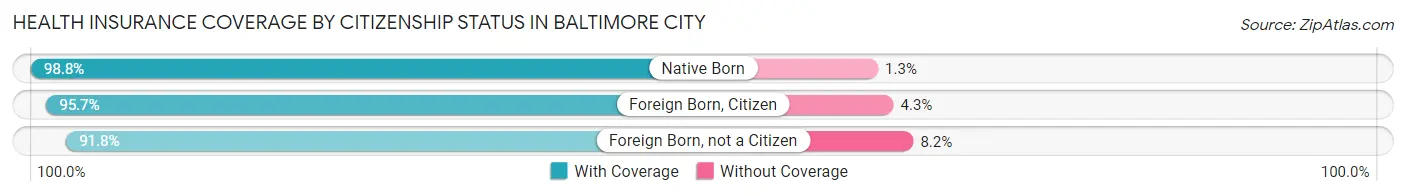
| Citizenship Status | With Coverage | Without Coverage |
| Native Born | 42,096 (98.8%) | 531 (1.3%) |
| Foreign Born, Citizen | 80,934 (95.7%) | 3,616 (4.3%) |
| Foreign Born, not a Citizen | 51,523 (91.8%) | 4,597 (8.2%) |
Health Insurance Coverage by Household Income in Baltimore city
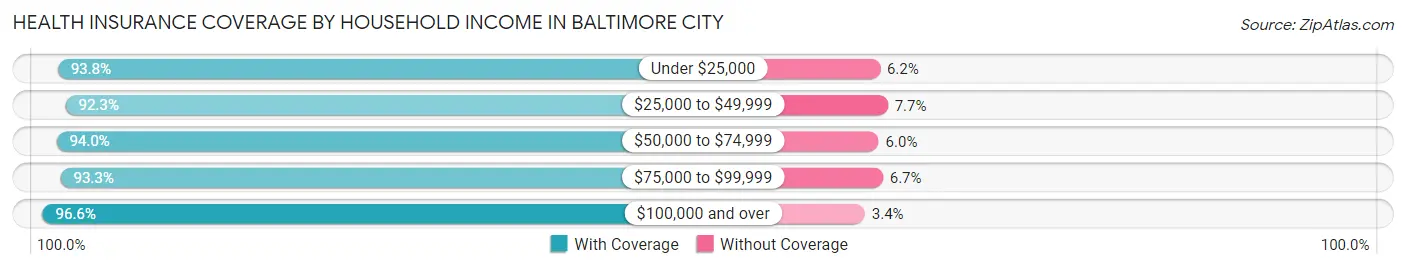
| Household Income | With Coverage | Without Coverage |
| Under $25,000 | 96,455 (93.8%) | 6,388 (6.2%) |
| $25,000 to $49,999 | 92,235 (92.3%) | 7,659 (7.7%) |
| $50,000 to $74,999 | 86,691 (94.0%) | 5,500 (6.0%) |
| $75,000 to $99,999 | 66,853 (93.3%) | 4,834 (6.7%) |
| $100,000 and over | 188,673 (96.6%) | 6,591 (3.4%) |
Public vs Private Health Insurance Coverage by Age in Baltimore city
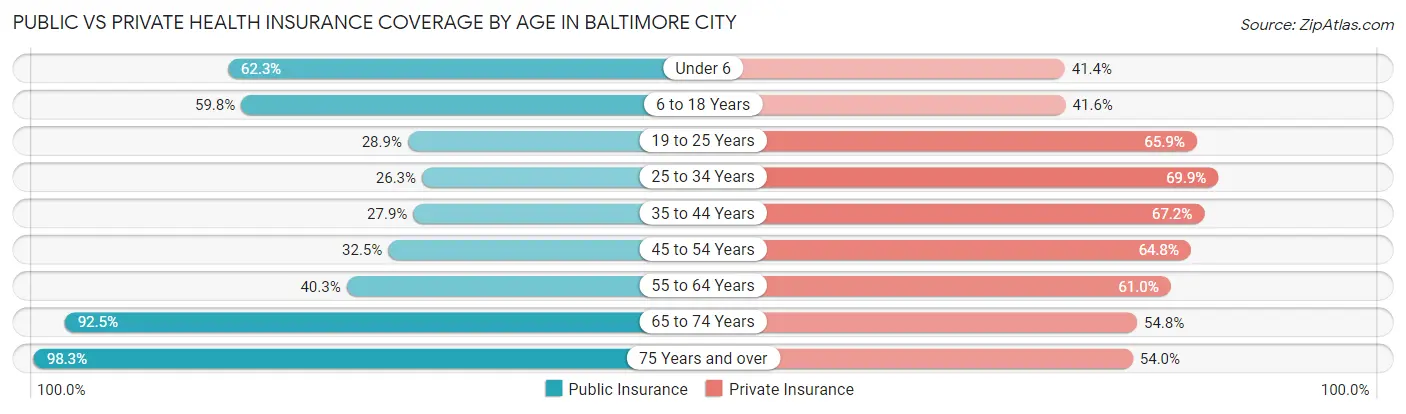
| Age Bracket | Public Insurance | Private Insurance |
| Under 6 | 26,538 (62.3%) | 17,643 (41.4%) |
| 6 to 18 Years | 50,580 (59.8%) | 35,132 (41.5%) |
| 19 to 25 Years | 16,207 (28.9%) | 36,960 (65.9%) |
| 25 to 34 Years | 25,275 (26.3%) | 67,249 (69.9%) |
| 35 to 44 Years | 21,368 (27.9%) | 51,537 (67.2%) |
| 45 to 54 Years | 20,628 (32.5%) | 41,064 (64.8%) |
| 55 to 64 Years | 29,431 (40.3%) | 44,600 (61.0%) |
| 65 to 74 Years | 47,905 (92.5%) | 28,372 (54.8%) |
| 75 Years and over | 31,758 (98.3%) | 17,461 (54.0%) |
| Total | 269,690 (46.8%) | 340,018 (59.0%) |
Disability Status by Sex by Age in Baltimore city
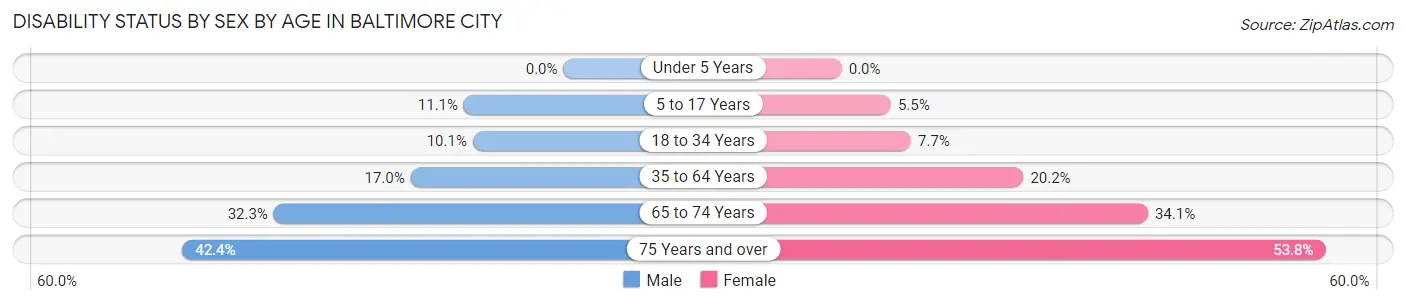
| Age Bracket | Male | Female |
| Under 5 Years | 0 (0.0%) | 0 (0.0%) |
| 5 to 17 Years | 4,712 (11.1%) | 2,268 (5.5%) |
| 18 to 34 Years | 7,571 (10.1%) | 6,573 (7.7%) |
| 35 to 64 Years | 16,681 (17.0%) | 23,296 (20.2%) |
| 65 to 74 Years | 7,177 (32.3%) | 10,067 (34.1%) |
| 75 Years and over | 5,054 (42.4%) | 10,985 (53.8%) |
Disability Class by Sex by Age in Baltimore city
Disability Class: Hearing Difficulty
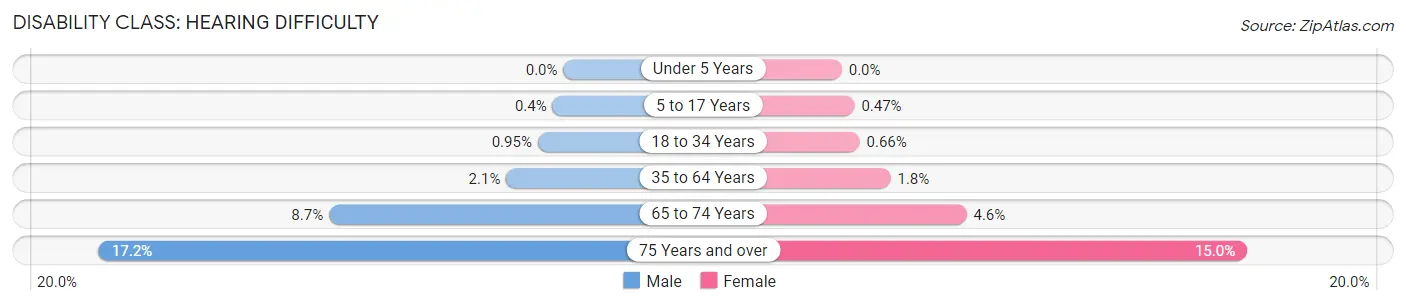
| Age Bracket | Male | Female |
| Under 5 Years | 0 (0.0%) | 0 (0.0%) |
| 5 to 17 Years | 171 (0.4%) | 196 (0.5%) |
| 18 to 34 Years | 710 (0.9%) | 561 (0.7%) |
| 35 to 64 Years | 2,080 (2.1%) | 2,085 (1.8%) |
| 65 to 74 Years | 1,935 (8.7%) | 1,368 (4.6%) |
| 75 Years and over | 2,053 (17.2%) | 3,068 (15.0%) |
Disability Class: Vision Difficulty
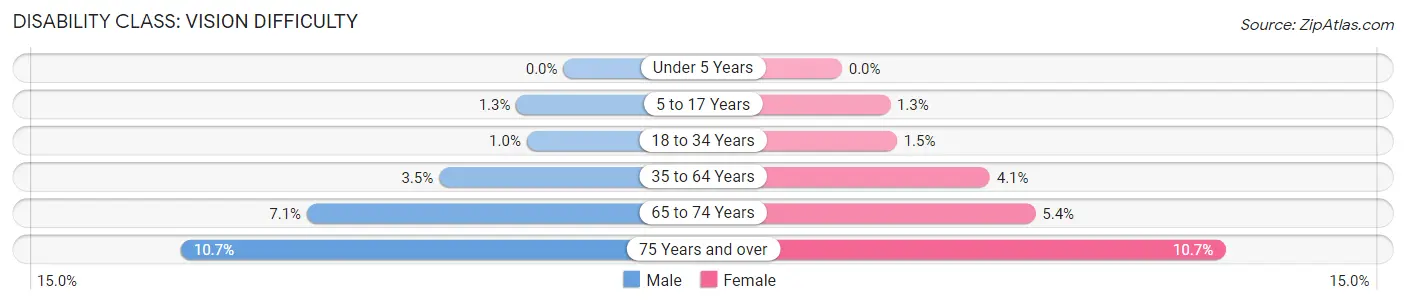
| Age Bracket | Male | Female |
| Under 5 Years | 0 (0.0%) | 0 (0.0%) |
| 5 to 17 Years | 558 (1.3%) | 553 (1.3%) |
| 18 to 34 Years | 769 (1.0%) | 1,301 (1.5%) |
| 35 to 64 Years | 3,391 (3.5%) | 4,749 (4.1%) |
| 65 to 74 Years | 1,588 (7.1%) | 1,591 (5.4%) |
| 75 Years and over | 1,268 (10.6%) | 2,178 (10.7%) |
Disability Class: Cognitive Difficulty
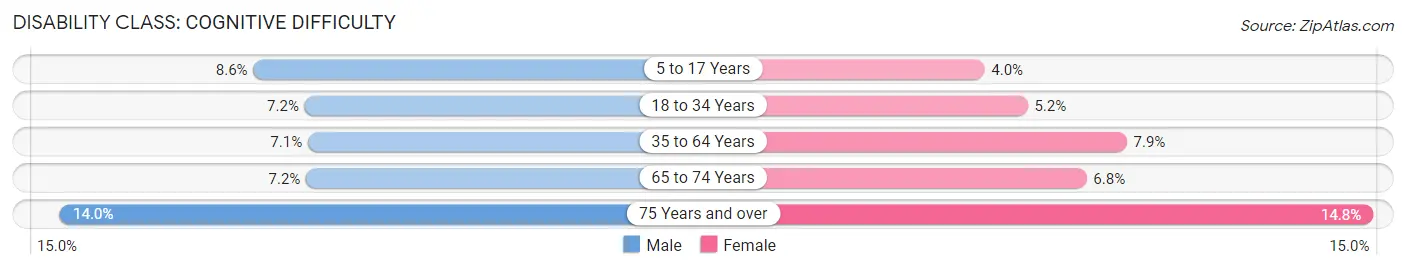
| Age Bracket | Male | Female |
| 5 to 17 Years | 3,672 (8.6%) | 1,644 (4.0%) |
| 18 to 34 Years | 5,403 (7.2%) | 4,402 (5.2%) |
| 35 to 64 Years | 6,969 (7.1%) | 9,137 (7.9%) |
| 65 to 74 Years | 1,593 (7.2%) | 2,011 (6.8%) |
| 75 Years and over | 1,669 (14.0%) | 3,018 (14.8%) |
Disability Class: Ambulatory Difficulty
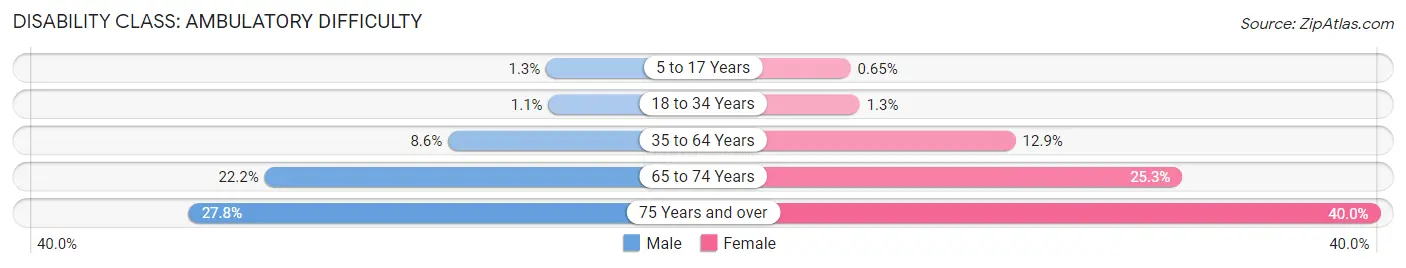
| Age Bracket | Male | Female |
| 5 to 17 Years | 543 (1.3%) | 267 (0.6%) |
| 18 to 34 Years | 836 (1.1%) | 1,133 (1.3%) |
| 35 to 64 Years | 8,389 (8.6%) | 14,871 (12.9%) |
| 65 to 74 Years | 4,937 (22.2%) | 7,459 (25.3%) |
| 75 Years and over | 3,313 (27.8%) | 8,160 (40.0%) |
Disability Class: Self-Care Difficulty
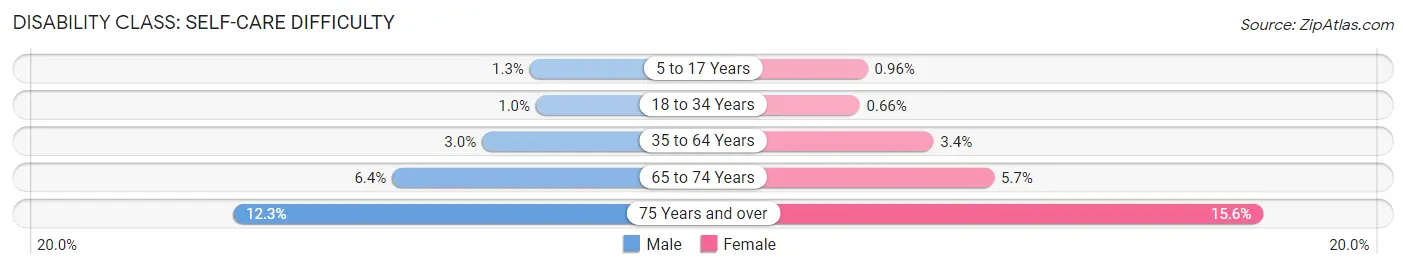
| Age Bracket | Male | Female |
| 5 to 17 Years | 531 (1.3%) | 397 (1.0%) |
| 18 to 34 Years | 763 (1.0%) | 565 (0.7%) |
| 35 to 64 Years | 2,962 (3.0%) | 3,921 (3.4%) |
| 65 to 74 Years | 1,415 (6.4%) | 1,669 (5.7%) |
| 75 Years and over | 1,460 (12.3%) | 3,192 (15.6%) |
Technology Access in Baltimore city
Computing Device Access in Baltimore city
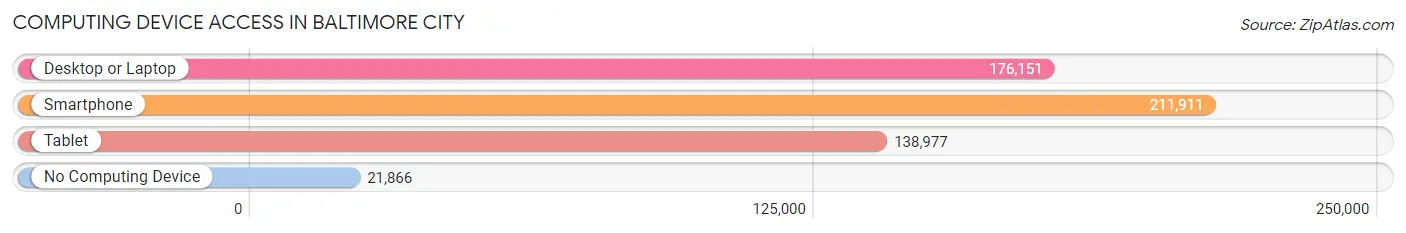
| Device Type | # Households | % Households |
| Desktop or Laptop | 176,151 | 71.3% |
| Smartphone | 211,911 | 85.7% |
| Tablet | 138,977 | 56.2% |
| No Computing Device | 21,866 | 8.8% |
| Total | 247,232 | 100.0% |
Internet Access in Baltimore city
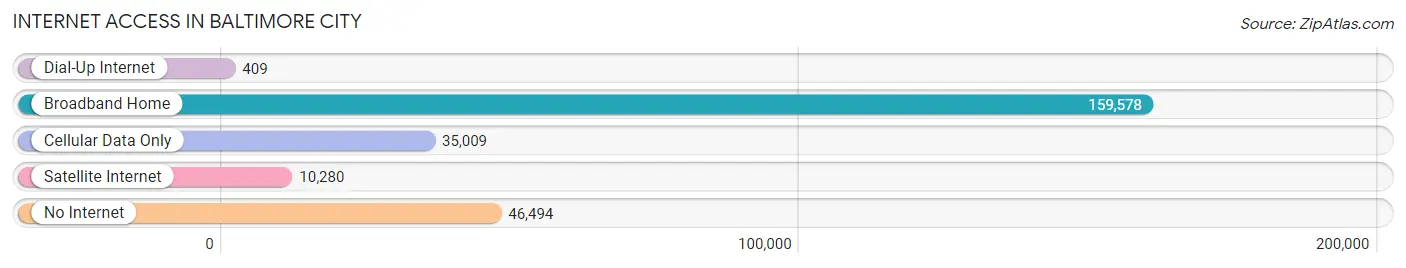
| Internet Type | # Households | % Households |
| Dial-Up Internet | 409 | 0.2% |
| Broadband Home | 159,578 | 64.5% |
| Cellular Data Only | 35,009 | 14.2% |
| Satellite Internet | 10,280 | 4.2% |
| No Internet | 46,494 | 18.8% |
| Total | 247,232 | 100.0% |
Baltimore city Summary
Baltimore City, MD is the largest city in the state of Maryland and the 30th most populous city in the United States. It is located in the central part of the state along the Patapsco River and the Chesapeake Bay. The city has a rich history, diverse geography, and a vibrant economy.
History
Baltimore City was founded in 1729 and named after Lord Baltimore, the first Proprietary Governor of the Province of Maryland. The city quickly grew to become an important port city and a major center of commerce and industry. During the Revolutionary War, Baltimore was the site of the Battle of Baltimore, which was a major victory for the American forces. In the 19th century, Baltimore became a major center of immigration, with many immigrants from Europe and the Caribbean settling in the city.
In the 20th century, Baltimore experienced a period of rapid growth and industrialization. The city was a major center of the steel industry and was home to several major shipbuilding companies. During World War II, Baltimore was a major center of war production, with many factories producing ships, tanks, and other military equipment.
In the late 20th century, Baltimore experienced a period of economic decline and population loss. The city has since experienced a resurgence, with a renewed focus on tourism, education, and technology.
Geography
Baltimore City is located in the central part of Maryland, along the Patapsco River and the Chesapeake Bay. The city is divided into nine districts, each with its own unique character and attractions. The Inner Harbor is the city’s main tourist attraction, with many museums, restaurants, and other attractions. The city is also home to several parks, including Druid Hill Park, Patterson Park, and Federal Hill Park.
The city is located in a humid subtropical climate zone, with hot, humid summers and mild winters. The average annual temperature is around 60°F (15°C).
Economy
Baltimore City has a diverse economy, with a mix of manufacturing, services, and government. The city is home to several major corporations, including Under Armour, T. Rowe Price, and Legg Mason. The city is also home to several major universities, including Johns Hopkins University, the University of Maryland, and Morgan State University.
The city is a major center of the healthcare industry, with several major hospitals and medical centers. The city is also home to several major ports, including the Port of Baltimore and the Port of Dundalk.
Demographics
As of the 2010 census, Baltimore City had a population of 621,342. The city is racially and ethnically diverse, with a majority of African Americans (63.7%), followed by Whites (30.1%), Hispanics (4.2%), and Asians (2.0%). The median household income is $41,385, and the median age is 34.
Baltimore City is home to a large number of immigrants, with the largest groups coming from El Salvador, Mexico, and Guatemala. The city is also home to a large number of refugees, with the largest groups coming from Iraq, Somalia, and the Democratic Republic of Congo.
Conclusion
Baltimore City is a vibrant and diverse city with a rich history, diverse geography, and a vibrant economy. The city is home to a diverse population, with a mix of African Americans, Whites, Hispanics, and Asians. The city is a major center of the healthcare industry, with several major hospitals and medical centers. The city is also home to several major universities, ports, and corporations. Baltimore City is a great place to live, work, and visit.
Common Questions
What is the Total Population of Baltimore city?
Total Population of Baltimore city is 584,548.
What is the Total Male Population of Baltimore city?
Total Male Population of Baltimore city is 273,088.
What is the Total Female Population of Baltimore city?
Total Female Population of Baltimore city is 311,460.
What is the Ratio of Males per 100 Females in Baltimore city?
There are 87.68 Males per 100 Females in Baltimore city.
What is the Ratio of Females per 100 Males in Baltimore city?
There are 114.05 Females per 100 Males in Baltimore city.
What is the Median Population Age in Baltimore city?
Median Population Age in Baltimore city is 36.0 Years.
What is the Average Family Size in Baltimore city
Average Family Size in Baltimore city is 3.2 People.
What is the Average Household Size in Baltimore city
Average Household Size in Baltimore city is 2.3 People.
What is Per Capita Income in Baltimore city?
Per Capita income in Baltimore city is $37,845.
What is the Median Family Income in Baltimore city?
Median Family Income in Baltimore city is $72,972.
What is the Median Household income in Baltimore city?
Median Household Income in Baltimore city is $58,349.
What is Income or Wage Gap in Baltimore city?
Income or Wage Gap in Baltimore city is 11.6%.
Women in Baltimore city earn 88.4 cents for every dollar earned by a man.
What is Family Income Deficit in Baltimore city?
Family Income Deficit in Baltimore city is $11,956.
Families that are below poverty line in Baltimore city earn $11,956 less on average than the poverty threshold level.
What is Inequality or Gini Index in Baltimore city?
Inequality or Gini Index in Baltimore city is 0.52.
How Large is the Labor Force in Baltimore city?
There are 296,534 People in the Labor Forcein in Baltimore city.
What is the Percentage of People in the Labor Force in Baltimore city?
62.1% of People are in the Labor Force in Baltimore city.
What is the Unemployment Rate in Baltimore city?
Unemployment Rate in Baltimore city is 6.9%.