Anne Arundel County, MD
Anne Arundel County Map
Anne Arundel County Overview
588,109
TOTAL POPULATION
291,860
MALE POPULATION
296,249
FEMALE POPULATION
98.52
MALES / 100 FEMALES
101.50
FEMALES / 100 MALES
38.8
MEDIAN AGE
3.1
AVG FAMILY SIZE
2.6
AVG HOUSEHOLD SIZE
$56,187
PER CAPITA INCOME
$136,266
AVG FAMILY INCOME
$116,009
AVG HOUSEHOLD INCOME
26.0%
WAGE / INCOME GAP [ % ]
74.0¢/ $1
WAGE / INCOME GAP [ $ ]
$12,914
FAMILY INCOME DEFICIT
0.42
INEQUALITY / GINI INDEX
324,701
LABOR FORCE [ PEOPLE ]
69.0%
PERCENT IN LABOR FORCE
4.2%
UNEMPLOYMENT RATE
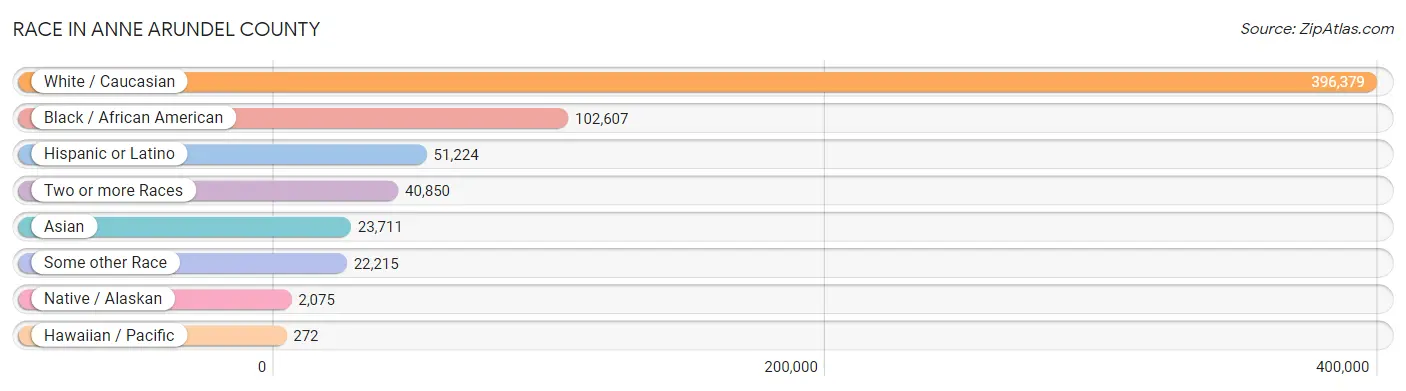
Race in Anne Arundel County
The most populous races in Anne Arundel County are White / Caucasian (396,379 | 67.4%), Black / African American (102,607 | 17.4%), and Hispanic or Latino (51,224 | 8.7%).
| Race | # Population | % Population |
| Asian | 23,711 | 4.0% |
| Black / African American | 102,607 | 17.4% |
| Hawaiian / Pacific | 272 | 0.1% |
| Hispanic or Latino | 51,224 | 8.7% |
| Native / Alaskan | 2,075 | 0.4% |
| White / Caucasian | 396,379 | 67.4% |
| Two or more Races | 40,850 | 7.0% |
| Some other Race | 22,215 | 3.8% |
| Total | 588,109 | 100.0% |
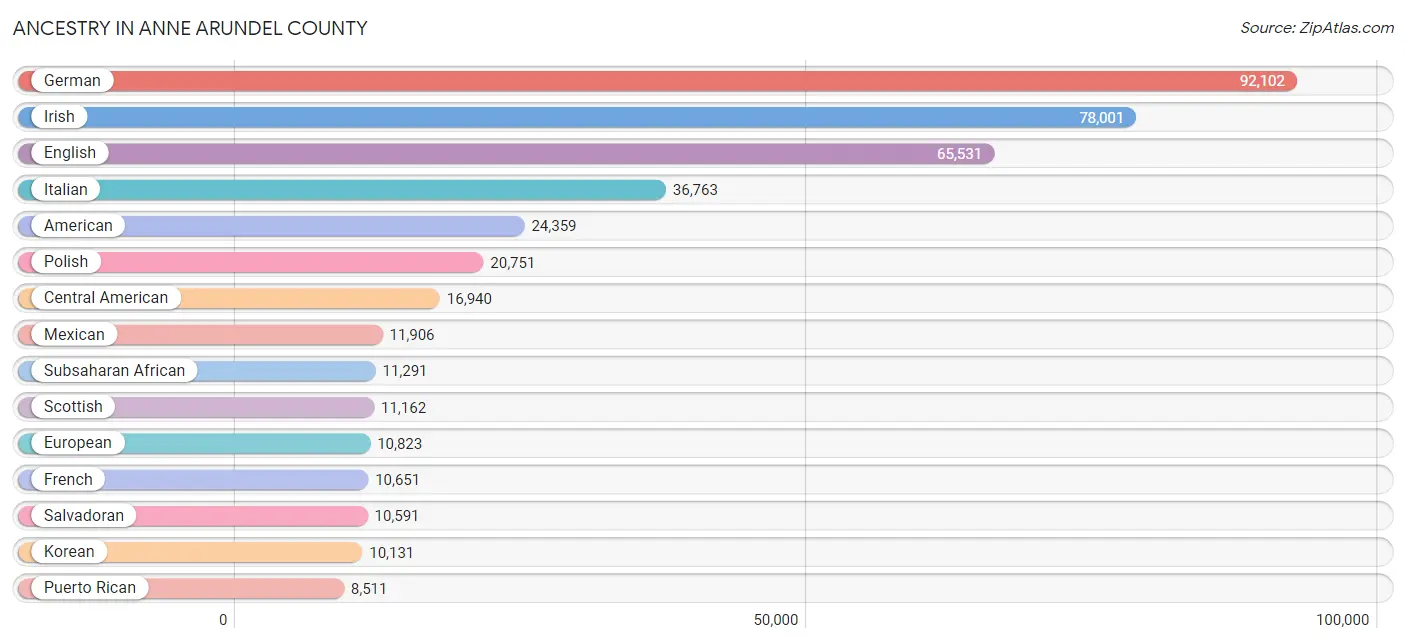
Ancestry in Anne Arundel County
The most populous ancestries reported in Anne Arundel County are German (92,102 | 15.7%), Irish (78,001 | 13.3%), English (65,531 | 11.1%), Italian (36,763 | 6.2%), and American (24,359 | 4.1%), together accounting for 50.5% of all Anne Arundel County residents.
| Ancestry | # Population | % Population |
| Afghan | 262 | 0.0% |
| African | 4,119 | 0.7% |
| Albanian | 242 | 0.0% |
| Alsatian | 35 | 0.0% |
| American | 24,359 | 4.1% |
| Apache | 247 | 0.0% |
| Arab | 2,345 | 0.4% |
| Arapaho | 15 | 0.0% |
| Argentinean | 542 | 0.1% |
| Armenian | 360 | 0.1% |
| Australian | 58 | 0.0% |
| Austrian | 1,617 | 0.3% |
| Bahamian | 33 | 0.0% |
| Bangladeshi | 32 | 0.0% |
| Barbadian | 132 | 0.0% |
| Basque | 132 | 0.0% |
| Belgian | 534 | 0.1% |
| Belizean | 18 | 0.0% |
| Bermudan | 81 | 0.0% |
| Bhutanese | 1,940 | 0.3% |
| Blackfeet | 173 | 0.0% |
| Bolivian | 356 | 0.1% |
| Brazilian | 507 | 0.1% |
| British | 4,472 | 0.8% |
| British West Indian | 301 | 0.1% |
| Bulgarian | 211 | 0.0% |
| Burmese | 4,803 | 0.8% |
| Cajun | 157 | 0.0% |
| Canadian | 656 | 0.1% |
| Cape Verdean | 178 | 0.0% |
| Carpatho Rusyn | 27 | 0.0% |
| Celtic | 141 | 0.0% |
| Central American | 16,940 | 2.9% |
| Central American Indian | 1,037 | 0.2% |
| Cherokee | 1,787 | 0.3% |
| Chickasaw | 2 | 0.0% |
| Chilean | 185 | 0.0% |
| Chinese | 13 | 0.0% |
| Chippewa | 47 | 0.0% |
| Choctaw | 159 | 0.0% |
| Colombian | 1,431 | 0.2% |
| Colville | 18 | 0.0% |
| Costa Rican | 296 | 0.1% |
| Creek | 45 | 0.0% |
| Croatian | 581 | 0.1% |
| Crow | 3 | 0.0% |
| Cuban | 1,397 | 0.2% |
| Cypriot | 51 | 0.0% |
| Czech | 1,908 | 0.3% |
| Czechoslovakian | 760 | 0.1% |
| Danish | 1,547 | 0.3% |
| Delaware | 33 | 0.0% |
| Dominican | 1,363 | 0.2% |
| Dutch | 4,069 | 0.7% |
| Eastern European | 3,012 | 0.5% |
| Ecuadorian | 924 | 0.2% |
| Egyptian | 670 | 0.1% |
| English | 65,531 | 11.1% |
| Estonian | 260 | 0.0% |
| Ethiopian | 419 | 0.1% |
| European | 10,823 | 1.8% |
| Filipino | 199 | 0.0% |
| Finnish | 947 | 0.2% |
| French | 10,651 | 1.8% |
| French American Indian | 6 | 0.0% |
| French Canadian | 2,139 | 0.4% |
| German | 92,102 | 15.7% |
| German Russian | 51 | 0.0% |
| Ghanaian | 1,470 | 0.3% |
| Greek | 3,534 | 0.6% |
| Guamanian / Chamorro | 368 | 0.1% |
| Guatemalan | 3,619 | 0.6% |
| Guyanese | 380 | 0.1% |
| Haitian | 800 | 0.1% |
| Honduran | 1,031 | 0.2% |
| Hungarian | 1,982 | 0.3% |
| Icelander | 119 | 0.0% |
| Indian (Asian) | 4,829 | 0.8% |
| Indonesian | 218 | 0.0% |
| Inupiat | 66 | 0.0% |
| Iranian | 797 | 0.1% |
| Iraqi | 95 | 0.0% |
| Irish | 78,001 | 13.3% |
| Iroquois | 60 | 0.0% |
| Israeli | 179 | 0.0% |
| Italian | 36,763 | 6.2% |
| Jamaican | 2,605 | 0.4% |
| Japanese | 150 | 0.0% |
| Jordanian | 48 | 0.0% |
| Kenyan | 79 | 0.0% |
| Korean | 10,131 | 1.7% |
| Laotian | 42 | 0.0% |
| Latvian | 198 | 0.0% |
| Lebanese | 654 | 0.1% |
| Liberian | 92 | 0.0% |
| Lithuanian | 2,349 | 0.4% |
| Lumbee | 223 | 0.0% |
| Luxembourger | 14 | 0.0% |
| Macedonian | 13 | 0.0% |
| Malaysian | 72 | 0.0% |
| Maltese | 16 | 0.0% |
| Mexican | 11,906 | 2.0% |
| Mexican American Indian | 234 | 0.0% |
| Mongolian | 55 | 0.0% |
| Moroccan | 263 | 0.0% |
| Native Hawaiian | 456 | 0.1% |
| Navajo | 144 | 0.0% |
| New Zealander | 68 | 0.0% |
| Nicaraguan | 424 | 0.1% |
| Nigerian | 3,276 | 0.6% |
| Northern European | 942 | 0.2% |
| Norwegian | 4,435 | 0.7% |
| Osage | 9 | 0.0% |
| Pakistani | 853 | 0.2% |
| Palestinian | 118 | 0.0% |
| Panamanian | 970 | 0.2% |
| Paraguayan | 37 | 0.0% |
| Pennsylvania German | 353 | 0.1% |
| Peruvian | 1,682 | 0.3% |
| Polish | 20,751 | 3.5% |
| Portuguese | 1,264 | 0.2% |
| Potawatomi | 7 | 0.0% |
| Pueblo | 87 | 0.0% |
| Puerto Rican | 8,511 | 1.5% |
| Puget Sound Salish | 6 | 0.0% |
| Romanian | 448 | 0.1% |
| Russian | 3,300 | 0.6% |
| Salvadoran | 10,591 | 1.8% |
| Samoan | 54 | 0.0% |
| Scandinavian | 1,684 | 0.3% |
| Scotch-Irish | 5,711 | 1.0% |
| Scottish | 11,162 | 1.9% |
| Seminole | 50 | 0.0% |
| Senegalese | 74 | 0.0% |
| Serbian | 247 | 0.0% |
| Shoshone | 17 | 0.0% |
| Sierra Leonean | 231 | 0.0% |
| Sioux | 166 | 0.0% |
| Slavic | 244 | 0.0% |
| Slovak | 1,817 | 0.3% |
| Slovene | 597 | 0.1% |
| South African | 357 | 0.1% |
| South American | 5,865 | 1.0% |
| South American Indian | 85 | 0.0% |
| Spaniard | 1,279 | 0.2% |
| Spanish | 1,522 | 0.3% |
| Spanish American | 56 | 0.0% |
| Sri Lankan | 2,093 | 0.4% |
| Subsaharan African | 11,291 | 1.9% |
| Sudanese | 10 | 0.0% |
| Swedish | 4,263 | 0.7% |
| Swiss | 1,275 | 0.2% |
| Syrian | 196 | 0.0% |
| Thai | 4,638 | 0.8% |
| Trinidadian and Tobagonian | 427 | 0.1% |
| Turkish | 1,040 | 0.2% |
| U.S. Virgin Islander | 15 | 0.0% |
| Ukrainian | 1,718 | 0.3% |
| Uruguayan | 109 | 0.0% |
| Venezuelan | 572 | 0.1% |
| Vietnamese | 623 | 0.1% |
| Welsh | 4,682 | 0.8% |
| West Indian | 588 | 0.1% |
| Yugoslavian | 219 | 0.0% |
| Yuman | 139 | 0.0% |
| Zimbabwean | 7 | 0.0% | View All 166 Rows |
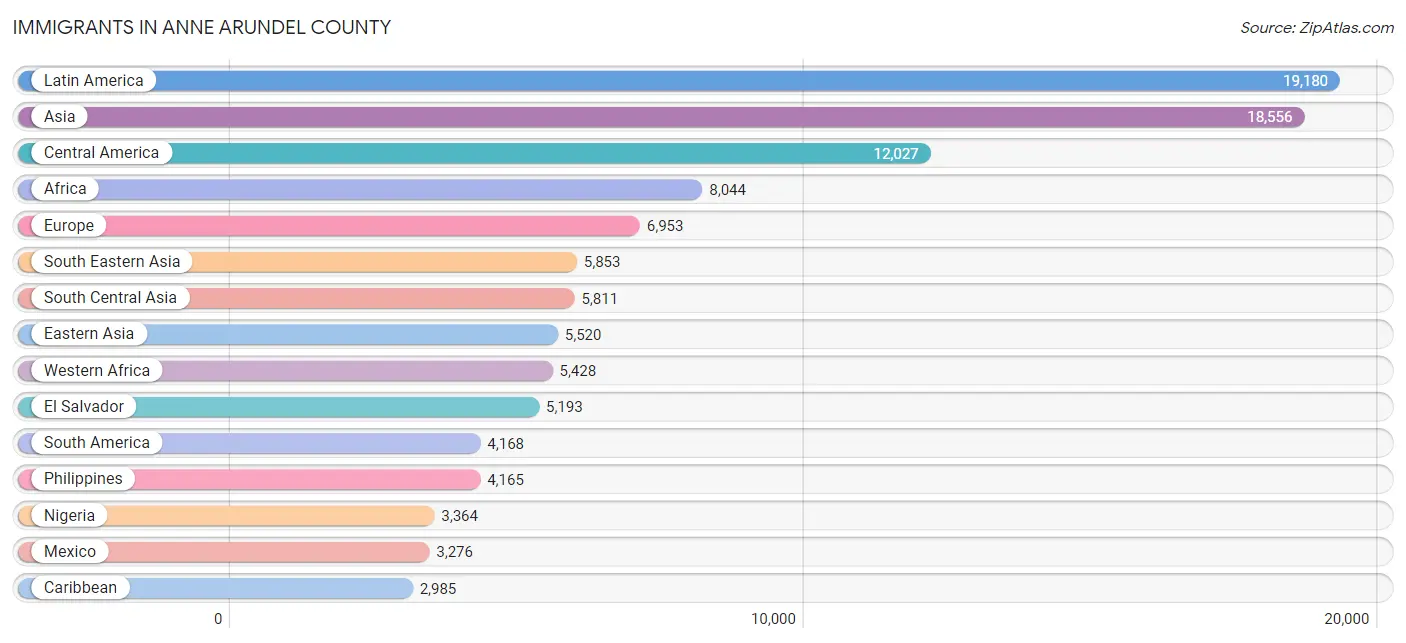
Immigrants in Anne Arundel County
The most numerous immigrant groups reported in Anne Arundel County came from Latin America (19,180 | 3.3%), Asia (18,556 | 3.2%), Central America (12,027 | 2.1%), Africa (8,044 | 1.4%), and Europe (6,953 | 1.2%), together accounting for 11.0% of all Anne Arundel County residents.
| Immigration Origin | # Population | % Population |
| Afghanistan | 187 | 0.0% |
| Africa | 8,044 | 1.4% |
| Albania | 119 | 0.0% |
| Argentina | 407 | 0.1% |
| Asia | 18,556 | 3.2% |
| Australia | 122 | 0.0% |
| Austria | 55 | 0.0% |
| Bahamas | 56 | 0.0% |
| Bangladesh | 495 | 0.1% |
| Barbados | 16 | 0.0% |
| Belarus | 77 | 0.0% |
| Belgium | 43 | 0.0% |
| Belize | 33 | 0.0% |
| Bolivia | 148 | 0.0% |
| Bosnia and Herzegovina | 31 | 0.0% |
| Brazil | 625 | 0.1% |
| Bulgaria | 148 | 0.0% |
| Cabo Verde | 29 | 0.0% |
| Cambodia | 74 | 0.0% |
| Cameroon | 680 | 0.1% |
| Canada | 914 | 0.2% |
| Caribbean | 2,985 | 0.5% |
| Central America | 12,027 | 2.1% |
| Chile | 52 | 0.0% |
| China | 2,739 | 0.5% |
| Colombia | 1,031 | 0.2% |
| Costa Rica | 73 | 0.0% |
| Croatia | 21 | 0.0% |
| Cuba | 303 | 0.1% |
| Czechoslovakia | 201 | 0.0% |
| Denmark | 16 | 0.0% |
| Dominican Republic | 818 | 0.1% |
| Eastern Africa | 750 | 0.1% |
| Eastern Asia | 5,520 | 0.9% |
| Eastern Europe | 1,966 | 0.3% |
| Ecuador | 466 | 0.1% |
| Egypt | 520 | 0.1% |
| El Salvador | 5,193 | 0.9% |
| England | 783 | 0.1% |
| Ethiopia | 413 | 0.1% |
| Europe | 6,953 | 1.2% |
| Fiji | 68 | 0.0% |
| France | 273 | 0.1% |
| Germany | 1,418 | 0.2% |
| Ghana | 1,453 | 0.3% |
| Greece | 290 | 0.1% |
| Grenada | 70 | 0.0% |
| Guatemala | 2,095 | 0.4% |
| Guyana | 510 | 0.1% |
| Haiti | 138 | 0.0% |
| Honduras | 416 | 0.1% |
| Hong Kong | 336 | 0.1% |
| Hungary | 53 | 0.0% |
| India | 2,384 | 0.4% |
| Indonesia | 50 | 0.0% |
| Iran | 598 | 0.1% |
| Iraq | 104 | 0.0% |
| Ireland | 162 | 0.0% |
| Israel | 148 | 0.0% |
| Italy | 364 | 0.1% |
| Jamaica | 1,089 | 0.2% |
| Japan | 370 | 0.1% |
| Jordan | 153 | 0.0% |
| Kazakhstan | 57 | 0.0% |
| Kenya | 124 | 0.0% |
| Korea | 2,411 | 0.4% |
| Kuwait | 59 | 0.0% |
| Laos | 13 | 0.0% |
| Latin America | 19,180 | 3.3% |
| Latvia | 21 | 0.0% |
| Lebanon | 34 | 0.0% |
| Liberia | 62 | 0.0% |
| Lithuania | 25 | 0.0% |
| Malaysia | 12 | 0.0% |
| Mexico | 3,276 | 0.6% |
| Middle Africa | 703 | 0.1% |
| Moldova | 14 | 0.0% |
| Morocco | 223 | 0.0% |
| Nepal | 810 | 0.1% |
| Netherlands | 130 | 0.0% |
| Nicaragua | 238 | 0.0% |
| Nigeria | 3,364 | 0.6% |
| North Macedonia | 5 | 0.0% |
| Northern Africa | 743 | 0.1% |
| Northern Europe | 1,979 | 0.3% |
| Norway | 65 | 0.0% |
| Oceania | 232 | 0.0% |
| Pakistan | 1,255 | 0.2% |
| Panama | 703 | 0.1% |
| Peru | 528 | 0.1% |
| Philippines | 4,165 | 0.7% |
| Poland | 240 | 0.0% |
| Portugal | 88 | 0.0% |
| Romania | 123 | 0.0% |
| Russia | 489 | 0.1% |
| Saudi Arabia | 102 | 0.0% |
| Scotland | 103 | 0.0% |
| Senegal | 89 | 0.0% |
| Serbia | 48 | 0.0% |
| Sierra Leone | 251 | 0.0% |
| Singapore | 41 | 0.0% |
| Somalia | 49 | 0.0% |
| South Africa | 401 | 0.1% |
| South America | 4,168 | 0.7% |
| South Central Asia | 5,811 | 1.0% |
| South Eastern Asia | 5,853 | 1.0% |
| Southern Europe | 1,051 | 0.2% |
| Spain | 309 | 0.1% |
| Sri Lanka | 14 | 0.0% |
| Sweden | 120 | 0.0% |
| Switzerland | 38 | 0.0% |
| Syria | 23 | 0.0% |
| Taiwan | 350 | 0.1% |
| Thailand | 514 | 0.1% |
| Trinidad and Tobago | 447 | 0.1% |
| Turkey | 529 | 0.1% |
| Uganda | 23 | 0.0% |
| Ukraine | 96 | 0.0% |
| Uruguay | 65 | 0.0% |
| Uzbekistan | 11 | 0.0% |
| Venezuela | 285 | 0.1% |
| Vietnam | 825 | 0.1% |
| Western Africa | 5,428 | 0.9% |
| Western Asia | 1,260 | 0.2% |
| Western Europe | 1,957 | 0.3% |
| Zimbabwe | 30 | 0.0% | View All 126 Rows |
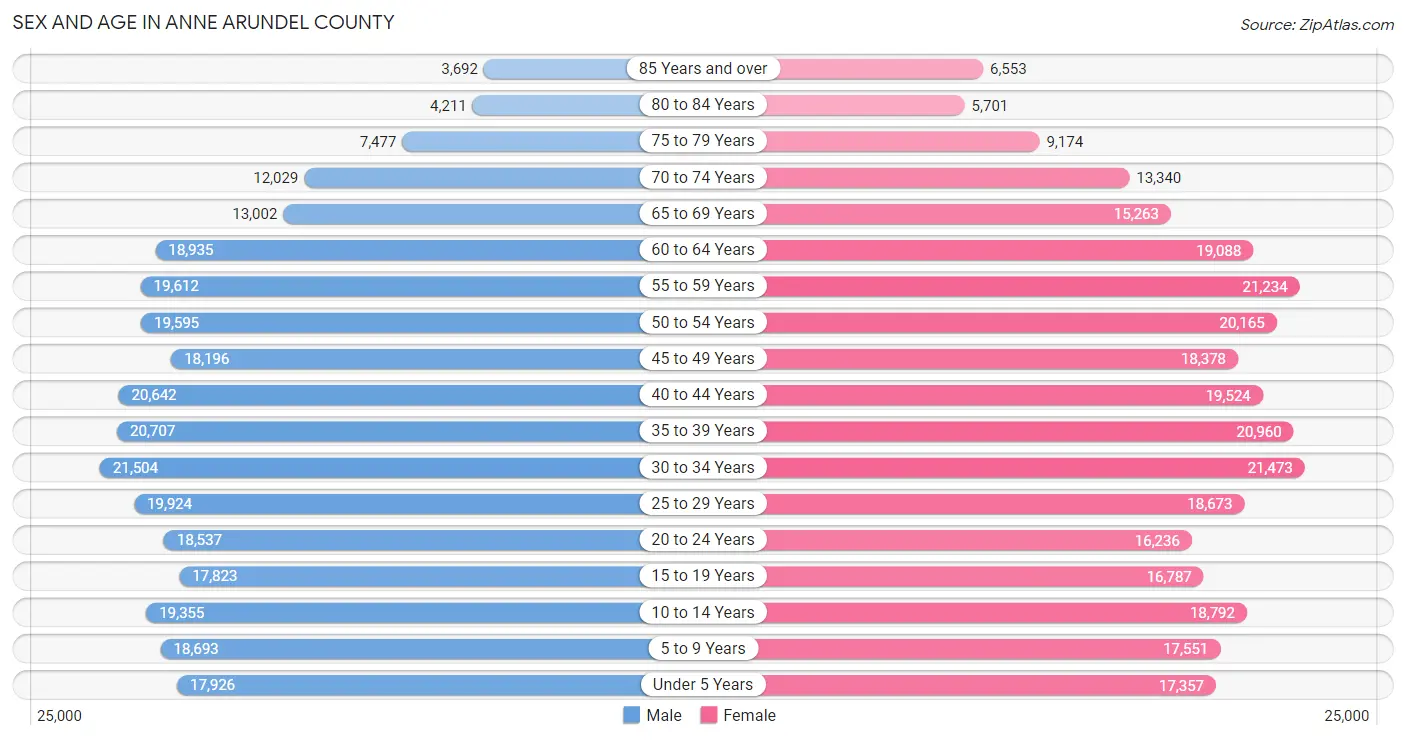
Sex and Age in Anne Arundel County
Sex and Age in Anne Arundel County
The most populous age groups in Anne Arundel County are 30 to 34 Years (21,504 | 7.4%) for men and 30 to 34 Years (21,473 | 7.2%) for women.
| Age Bracket | Male | Female |
| Under 5 Years | 17,926 (6.1%) | 17,357 (5.9%) |
| 5 to 9 Years | 18,693 (6.4%) | 17,551 (5.9%) |
| 10 to 14 Years | 19,355 (6.6%) | 18,792 (6.3%) |
| 15 to 19 Years | 17,823 (6.1%) | 16,787 (5.7%) |
| 20 to 24 Years | 18,537 (6.4%) | 16,236 (5.5%) |
| 25 to 29 Years | 19,924 (6.8%) | 18,673 (6.3%) |
| 30 to 34 Years | 21,504 (7.4%) | 21,473 (7.2%) |
| 35 to 39 Years | 20,707 (7.1%) | 20,960 (7.1%) |
| 40 to 44 Years | 20,642 (7.1%) | 19,524 (6.6%) |
| 45 to 49 Years | 18,196 (6.2%) | 18,378 (6.2%) |
| 50 to 54 Years | 19,595 (6.7%) | 20,165 (6.8%) |
| 55 to 59 Years | 19,612 (6.7%) | 21,234 (7.2%) |
| 60 to 64 Years | 18,935 (6.5%) | 19,088 (6.4%) |
| 65 to 69 Years | 13,002 (4.4%) | 15,263 (5.1%) |
| 70 to 74 Years | 12,029 (4.1%) | 13,340 (4.5%) |
| 75 to 79 Years | 7,477 (2.6%) | 9,174 (3.1%) |
| 80 to 84 Years | 4,211 (1.4%) | 5,701 (1.9%) |
| 85 Years and over | 3,692 (1.3%) | 6,553 (2.2%) |
| Total | 291,860 (100.0%) | 296,249 (100.0%) |
Families and Households in Anne Arundel County
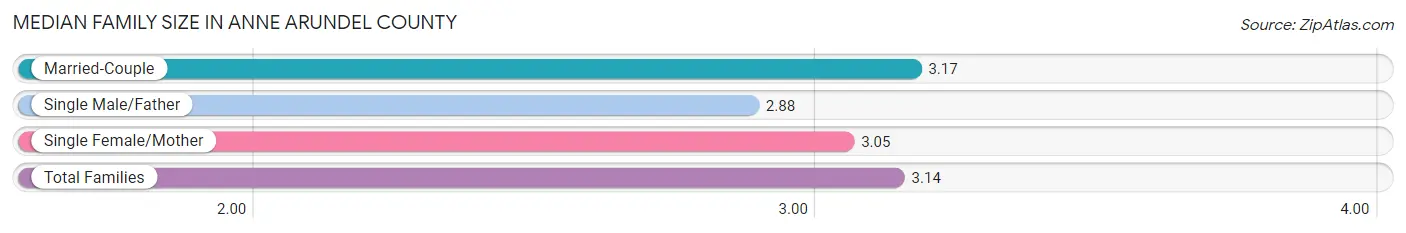
Median Family Size in Anne Arundel County
The median family size in Anne Arundel County is 3.14 persons per family, with married-couple families (118,295 | 77.5%) accounting for the largest median family size of 3.17 persons per family. On the other hand, single male/father families (8,957 | 5.9%) represent the smallest median family size with 2.88 persons per family.
| Family Type | # Families | Family Size |
| Married-Couple | 118,295 (77.5%) | 3.17 |
| Single Male/Father | 8,957 (5.9%) | 2.88 |
| Single Female/Mother | 25,378 (16.6%) | 3.05 |
| Total Families | 152,630 (100.0%) | 3.14 |
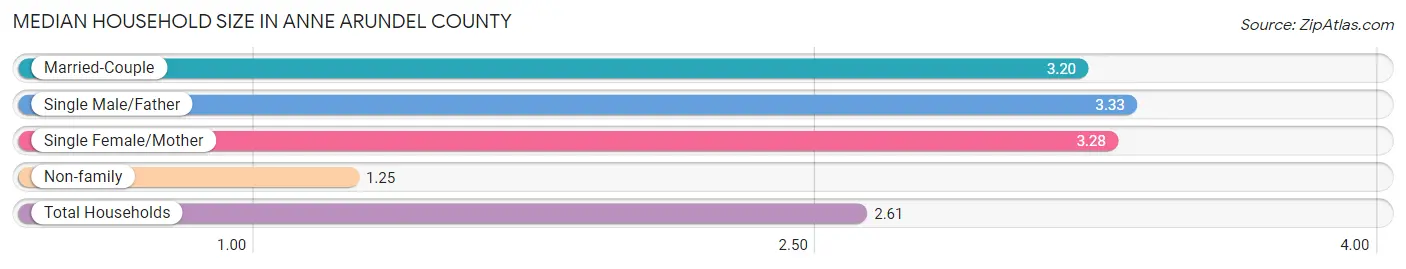
Median Household Size in Anne Arundel County
The median household size in Anne Arundel County is 2.61 persons per household, with single male/father households (8,957 | 4.0%) accounting for the largest median household size of 3.33 persons per household. non-family households (69,074 | 31.2%) represent the smallest median household size with 1.25 persons per household.
| Household Type | # Households | Household Size |
| Married-Couple | 118,295 (53.4%) | 3.20 |
| Single Male/Father | 8,957 (4.0%) | 3.33 |
| Single Female/Mother | 25,378 (11.5%) | 3.28 |
| Non-family | 69,074 (31.2%) | 1.25 |
| Total Households | 221,704 (100.0%) | 2.61 |
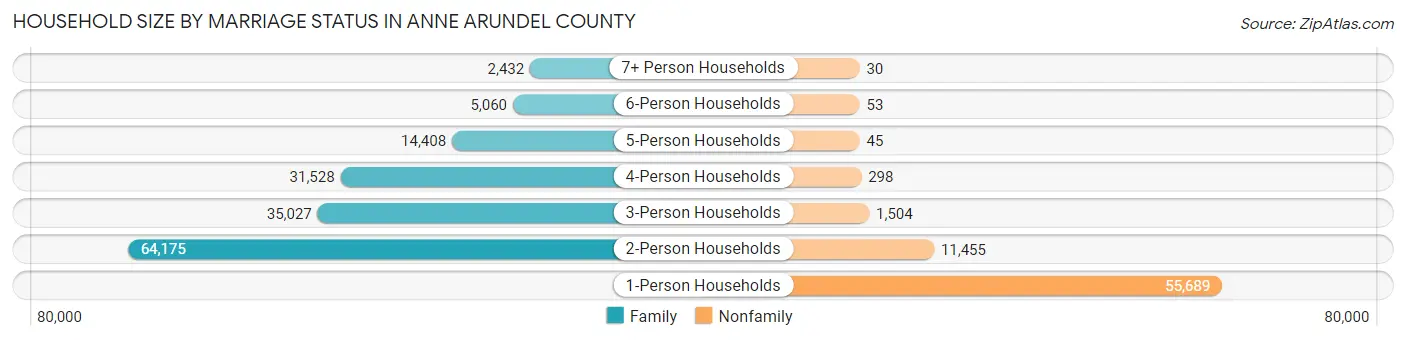
Household Size by Marriage Status in Anne Arundel County
Out of a total of 221,704 households in Anne Arundel County, 152,630 (68.8%) are family households, while 69,074 (31.2%) are nonfamily households. The most numerous type of family households are 2-person households, comprising 64,175, and the most common type of nonfamily households are 1-person households, comprising 55,689.
| Household Size | Family Households | Nonfamily Households |
| 1-Person Households | - | 55,689 (25.1%) |
| 2-Person Households | 64,175 (28.9%) | 11,455 (5.2%) |
| 3-Person Households | 35,027 (15.8%) | 1,504 (0.7%) |
| 4-Person Households | 31,528 (14.2%) | 298 (0.1%) |
| 5-Person Households | 14,408 (6.5%) | 45 (0.0%) |
| 6-Person Households | 5,060 (2.3%) | 53 (0.0%) |
| 7+ Person Households | 2,432 (1.1%) | 30 (0.0%) |
| Total | 152,630 (68.8%) | 69,074 (31.2%) |
Female Fertility in Anne Arundel County
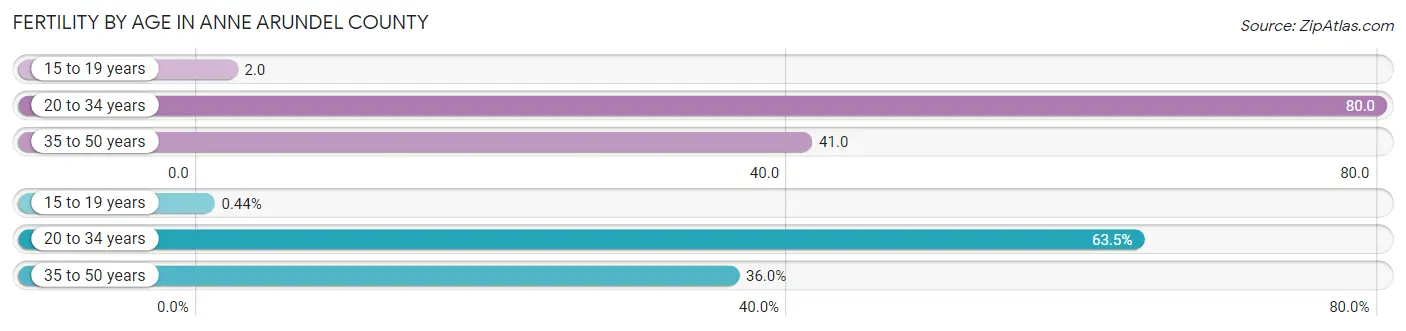
Fertility by Age in Anne Arundel County
Average fertility rate in Anne Arundel County is 52.0 births per 1,000 women. Women in the age bracket of 20 to 34 years have the highest fertility rate with 80.0 births per 1,000 women. Women in the age bracket of 20 to 34 years acount for 63.5% of all women with births.
| Age Bracket | Women with Births | Births / 1,000 Women |
| 15 to 19 years | 31 (0.4%) | 2.0 |
| 20 to 34 years | 4,485 (63.5%) | 80.0 |
| 35 to 50 years | 2,545 (36.0%) | 41.0 |
| Total | 7,061 (100.0%) | 52.0 |
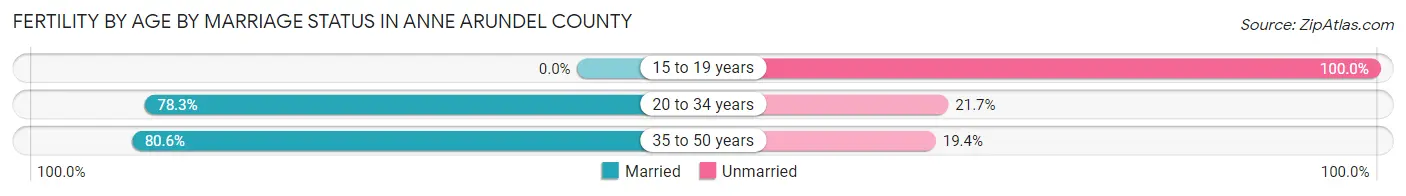
Fertility by Age by Marriage Status in Anne Arundel County
78.8% of women with births (7,061) in Anne Arundel County are married. The highest percentage of unmarried women with births falls into 15 to 19 years age bracket with 100.0% of them unmarried at the time of birth, while the lowest percentage of unmarried women with births belong to 35 to 50 years age bracket with 19.4% of them unmarried.
| Age Bracket | Married | Unmarried |
| 15 to 19 years | 0 (0.0%) | 31 (100.0%) |
| 20 to 34 years | 3,512 (78.3%) | 973 (21.7%) |
| 35 to 50 years | 2,051 (80.6%) | 494 (19.4%) |
| Total | 5,564 (78.8%) | 1,497 (21.2%) |
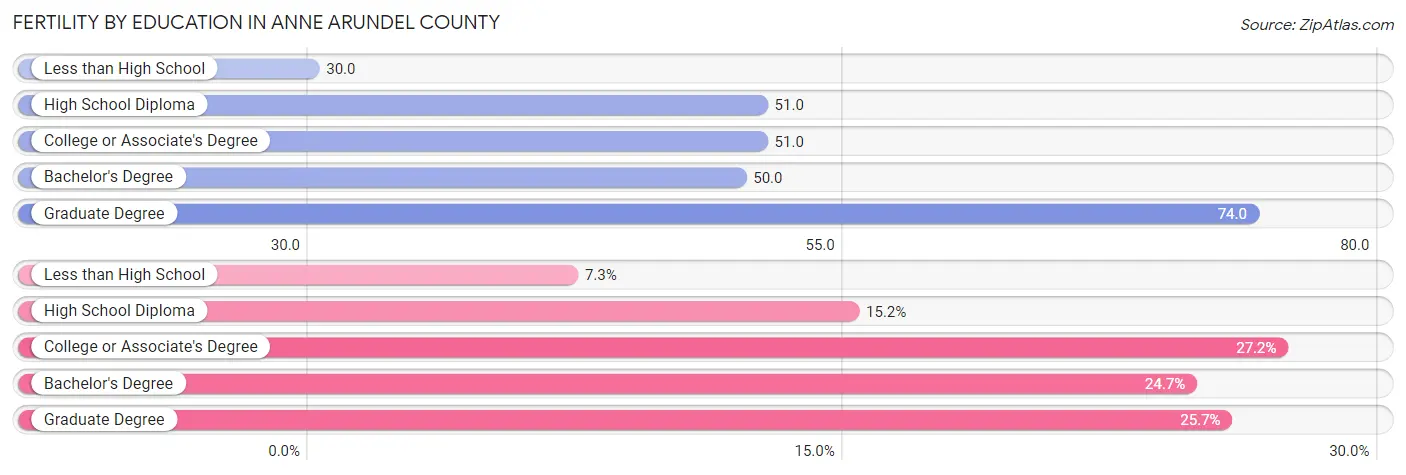
Fertility by Education in Anne Arundel County
Average fertility rate in Anne Arundel County is 52.0 births per 1,000 women. Women with the education attainment of graduate degree have the highest fertility rate of 74.0 births per 1,000 women, while women with the education attainment of less than high school have the lowest fertility at 30.0 births per 1,000 women. Women with the education attainment of college or associate's degree represent 27.2% of all women with births.
| Educational Attainment | Women with Births | Births / 1,000 Women |
| Less than High School | 513 (7.3%) | 30.0 |
| High School Diploma | 1,071 (15.2%) | 51.0 |
| College or Associate's Degree | 1,923 (27.2%) | 51.0 |
| Bachelor's Degree | 1,742 (24.7%) | 50.0 |
| Graduate Degree | 1,812 (25.7%) | 74.0 |
| Total | 7,061 (100.0%) | 52.0 |
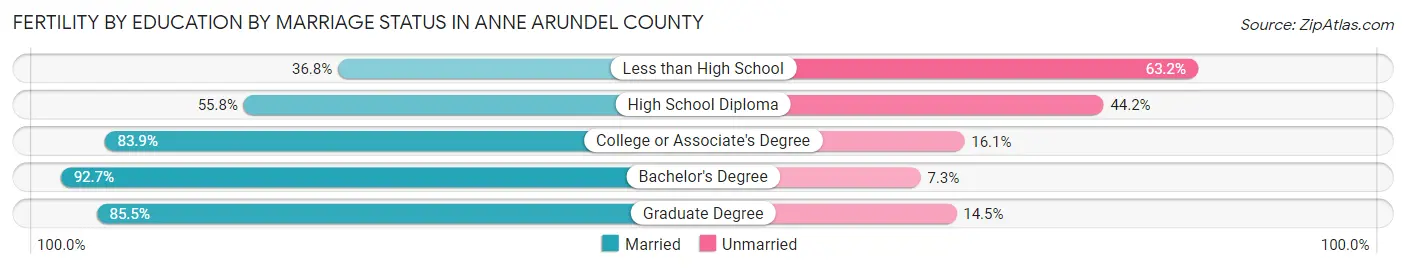
Fertility by Education by Marriage Status in Anne Arundel County
21.2% of women with births in Anne Arundel County are unmarried. Women with the educational attainment of bachelor's degree are most likely to be married with 92.7% of them married at childbirth, while women with the educational attainment of less than high school are least likely to be married with 63.2% of them unmarried at childbirth.
| Educational Attainment | Married | Unmarried |
| Less than High School | 189 (36.8%) | 324 (63.2%) |
| High School Diploma | 598 (55.8%) | 473 (44.2%) |
| College or Associate's Degree | 1,613 (83.9%) | 310 (16.1%) |
| Bachelor's Degree | 1,615 (92.7%) | 127 (7.3%) |
| Graduate Degree | 1,549 (85.5%) | 263 (14.5%) |
| Total | 5,564 (78.8%) | 1,497 (21.2%) |
Income in Anne Arundel County
Income Overview in Anne Arundel County
Per Capita Income in Anne Arundel County is $56,187, while median incomes of families and households are $136,266 and $116,009 respectively.
| Characteristic | Number | Measure |
| Per Capita Income | 588,109 | $56,187 |
| Median Family Income | 152,630 | $136,266 |
| Mean Family Income | 152,630 | $167,371 |
| Median Household Income | 221,704 | $116,009 |
| Mean Household Income | 221,704 | $147,102 |
| Income Deficit | 152,630 | $12,914 |
| Wage / Income Gap (%) | 588,109 | 25.95% |
| Wage / Income Gap ($) | 588,109 | 74.05¢ per $1 |
| Gini / Inequality Index | 588,109 | 0.42 |
Earnings by Sex in Anne Arundel County
Average Earnings in Anne Arundel County are $61,051, $70,776 for men and $52,408 for women, a difference of 26.0%.
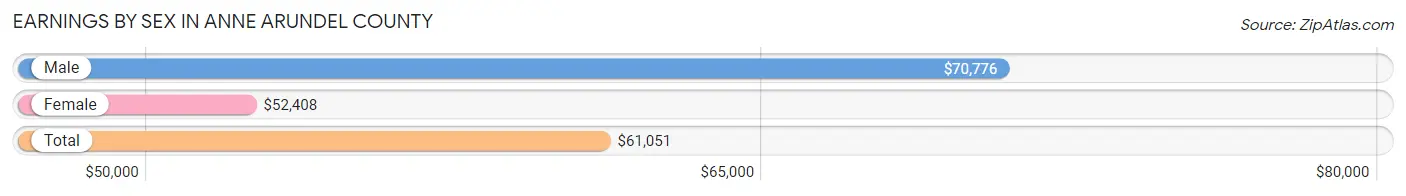
| Sex | Number | Average Earnings |
| Male | 177,002 (52.8%) | $70,776 |
| Female | 158,282 (47.2%) | $52,408 |
| Total | 335,284 (100.0%) | $61,051 |
Earnings by Sex by Income Bracket in Anne Arundel County
The most common earnings brackets in Anne Arundel County are $100,000+ for men (59,122 | 33.4%) and $100,000+ for women (31,517 | 19.9%).
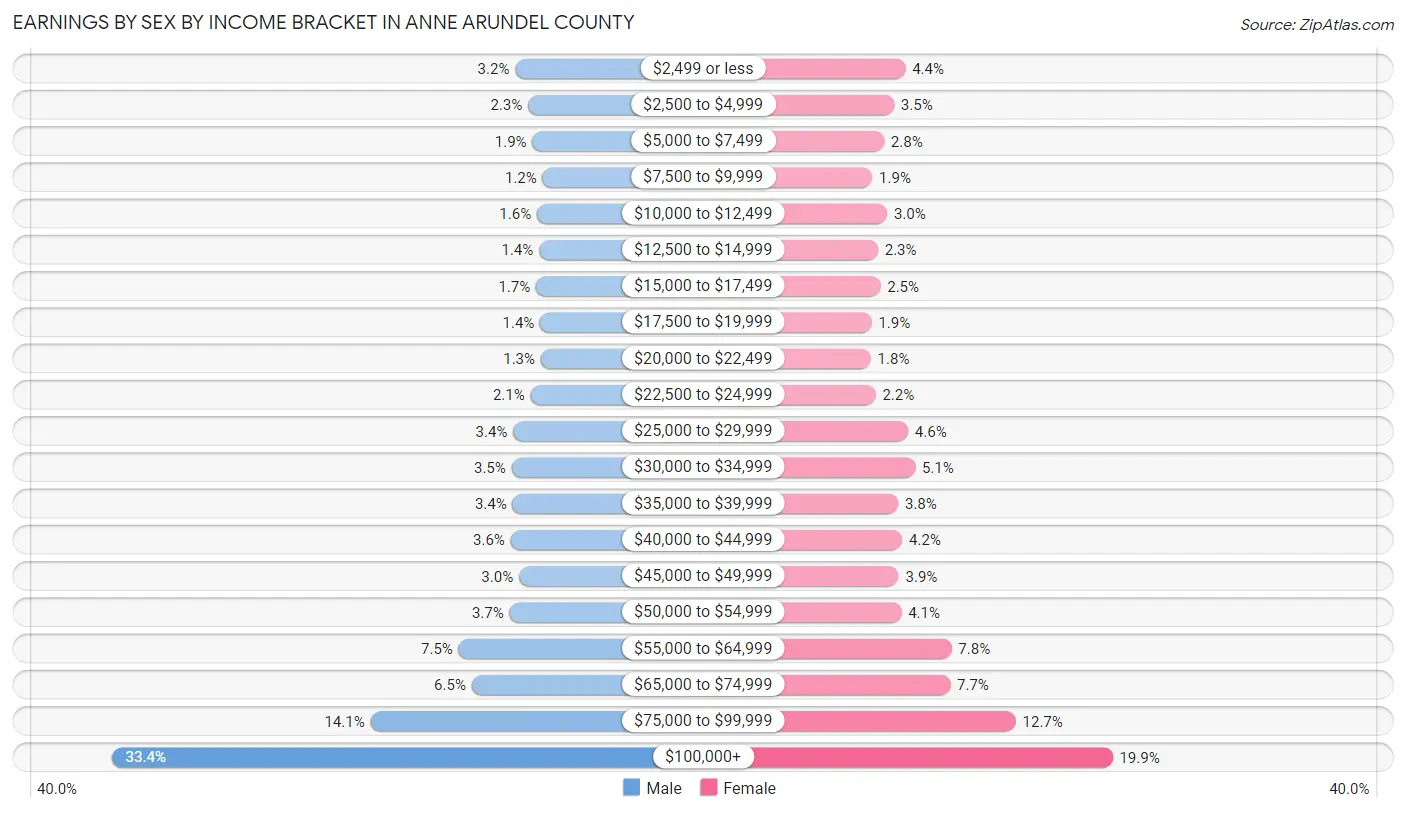
| Income | Male | Female |
| $2,499 or less | 5,714 (3.2%) | 6,931 (4.4%) |
| $2,500 to $4,999 | 4,017 (2.3%) | 5,592 (3.5%) |
| $5,000 to $7,499 | 3,431 (1.9%) | 4,393 (2.8%) |
| $7,500 to $9,999 | 2,094 (1.2%) | 3,012 (1.9%) |
| $10,000 to $12,499 | 2,832 (1.6%) | 4,758 (3.0%) |
| $12,500 to $14,999 | 2,540 (1.4%) | 3,679 (2.3%) |
| $15,000 to $17,499 | 2,958 (1.7%) | 3,978 (2.5%) |
| $17,500 to $19,999 | 2,413 (1.4%) | 2,932 (1.8%) |
| $20,000 to $22,499 | 2,320 (1.3%) | 2,832 (1.8%) |
| $22,500 to $24,999 | 3,678 (2.1%) | 3,398 (2.1%) |
| $25,000 to $29,999 | 5,976 (3.4%) | 7,253 (4.6%) |
| $30,000 to $34,999 | 6,194 (3.5%) | 8,090 (5.1%) |
| $35,000 to $39,999 | 6,073 (3.4%) | 6,074 (3.8%) |
| $40,000 to $44,999 | 6,313 (3.6%) | 6,565 (4.2%) |
| $45,000 to $49,999 | 5,222 (2.9%) | 6,140 (3.9%) |
| $50,000 to $54,999 | 6,477 (3.7%) | 6,455 (4.1%) |
| $55,000 to $64,999 | 13,221 (7.5%) | 12,405 (7.8%) |
| $65,000 to $74,999 | 11,481 (6.5%) | 12,252 (7.7%) |
| $75,000 to $99,999 | 24,926 (14.1%) | 20,026 (12.7%) |
| $100,000+ | 59,122 (33.4%) | 31,517 (19.9%) |
| Total | 177,002 (100.0%) | 158,282 (100.0%) |
Earnings by Sex by Educational Attainment in Anne Arundel County
Average earnings in Anne Arundel County are $80,668 for men and $59,418 for women, a difference of 26.3%. Men with an educational attainment of graduate degree enjoy the highest average annual earnings of $127,540, while those with less than high school education earn the least with $42,806. Women with an educational attainment of graduate degree earn the most with the average annual earnings of $86,220, while those with less than high school education have the smallest earnings of $19,358.
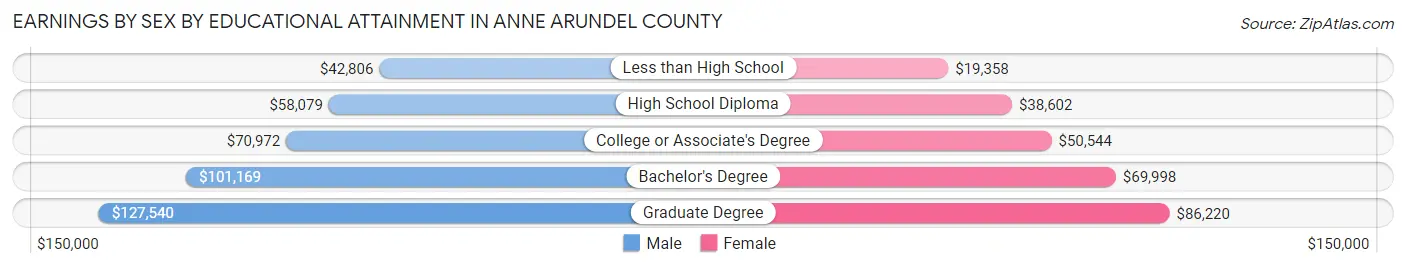
| Educational Attainment | Male Income | Female Income |
| Less than High School | $42,806 | $19,358 |
| High School Diploma | $58,079 | $38,602 |
| College or Associate's Degree | $70,972 | $50,544 |
| Bachelor's Degree | $101,169 | $69,998 |
| Graduate Degree | $127,540 | $86,220 |
| Total | $80,668 | $59,418 |
Family Income in Anne Arundel County
Family Income Brackets in Anne Arundel County
According to the Anne Arundel County family income data, there are 41,210 families falling into the $200,000+ income range, which is the most common income bracket and makes up 27.0% of all families. Conversely, the $10,000 to $14,999 income bracket is the least frequent group with only 1,068 families (0.7%) belonging to this category.
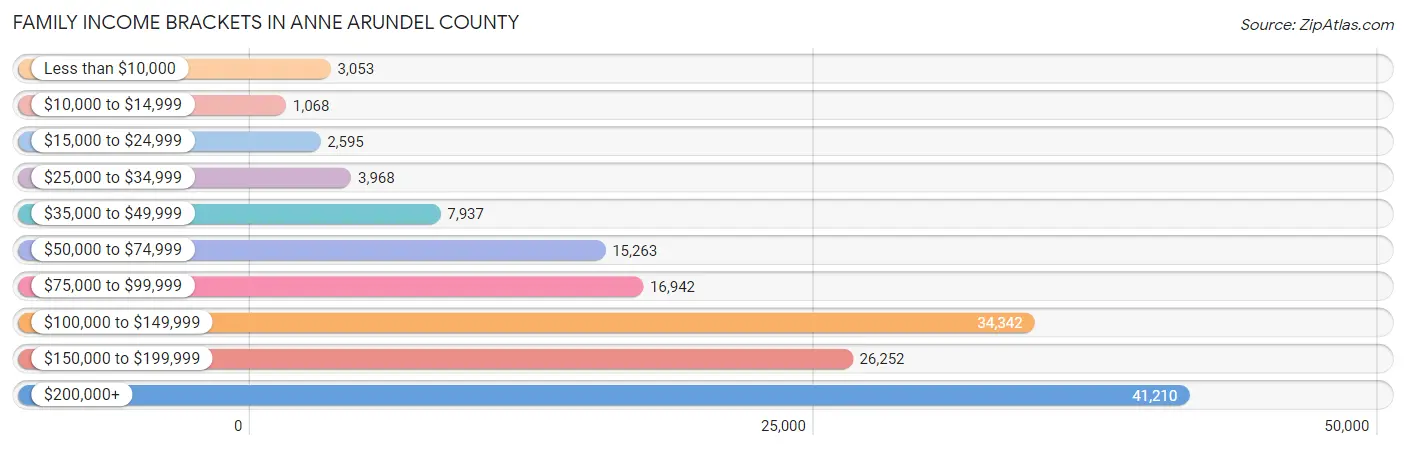
| Income Bracket | # Families | % Families |
| Less than $10,000 | 3,053 | 2.0% |
| $10,000 to $14,999 | 1,068 | 0.7% |
| $15,000 to $24,999 | 2,595 | 1.7% |
| $25,000 to $34,999 | 3,968 | 2.6% |
| $35,000 to $49,999 | 7,937 | 5.2% |
| $50,000 to $74,999 | 15,263 | 10.0% |
| $75,000 to $99,999 | 16,942 | 11.1% |
| $100,000 to $149,999 | 34,342 | 22.5% |
| $150,000 to $199,999 | 26,252 | 17.2% |
| $200,000+ | 41,210 | 27.0% |
Family Income by Famaliy Size in Anne Arundel County
7+ person families (2,112 | 1.4%) account for the highest median family income in Anne Arundel County with $193,933 per family, while 2-person families (67,694 | 44.4%) have the highest median income of $57,864 per family member.
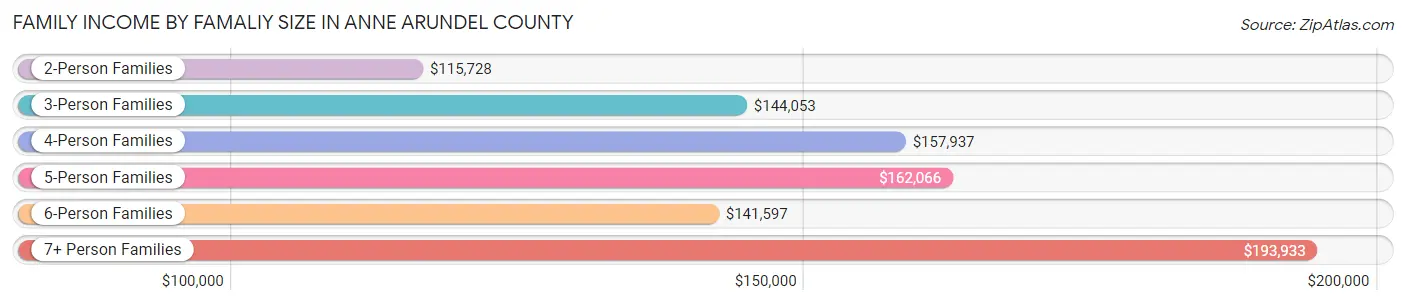
| Income Bracket | # Families | Median Income |
| 2-Person Families | 67,694 (44.4%) | $115,728 |
| 3-Person Families | 35,416 (23.2%) | $144,053 |
| 4-Person Families | 30,341 (19.9%) | $157,937 |
| 5-Person Families | 12,810 (8.4%) | $162,066 |
| 6-Person Families | 4,257 (2.8%) | $141,597 |
| 7+ Person Families | 2,112 (1.4%) | $193,933 |
| Total | 152,630 (100.0%) | $136,266 |
Family Income by Number of Earners in Anne Arundel County
The median family income in Anne Arundel County is $136,266, with families comprising 3+ earners (21,550) having the highest median family income of $198,715, while families with no earners (17,506) have the lowest median family income of $76,032, accounting for 14.1% and 11.5% of families, respectively.
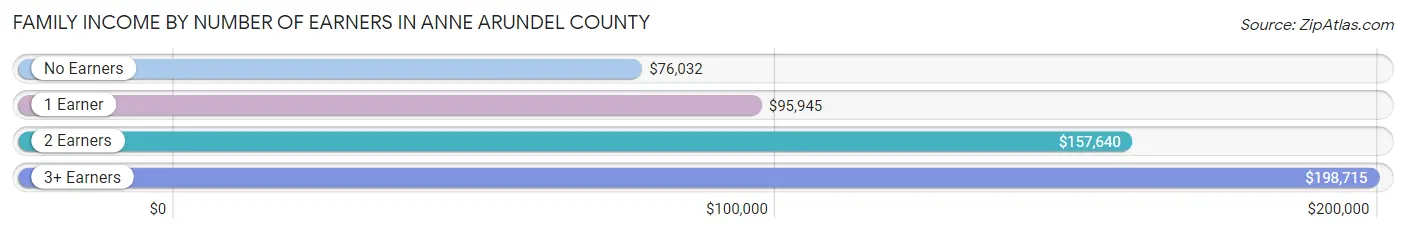
| Number of Earners | # Families | Median Income |
| No Earners | 17,506 (11.5%) | $76,032 |
| 1 Earner | 43,084 (28.2%) | $95,945 |
| 2 Earners | 70,490 (46.2%) | $157,640 |
| 3+ Earners | 21,550 (14.1%) | $198,715 |
| Total | 152,630 (100.0%) | $136,266 |
Household Income in Anne Arundel County
Household Income Brackets in Anne Arundel County
With 47,666 households falling in the category, the $100,000 to $149,999 income range is the most frequent in Anne Arundel County, accounting for 21.5% of all households. In contrast, only 2,660 households (1.2%) fall into the $10,000 to $14,999 income bracket, making it the least populous group.
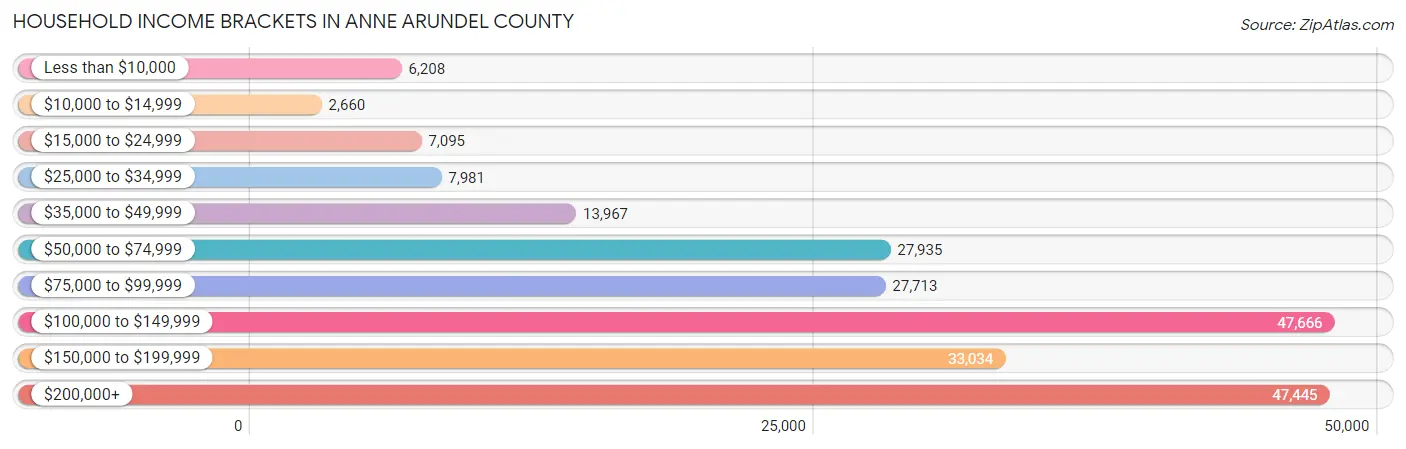
| Income Bracket | # Households | % Households |
| Less than $10,000 | 6,208 | 2.8% |
| $10,000 to $14,999 | 2,660 | 1.2% |
| $15,000 to $24,999 | 7,095 | 3.2% |
| $25,000 to $34,999 | 7,981 | 3.6% |
| $35,000 to $49,999 | 13,967 | 6.3% |
| $50,000 to $74,999 | 27,935 | 12.6% |
| $75,000 to $99,999 | 27,713 | 12.5% |
| $100,000 to $149,999 | 47,666 | 21.5% |
| $150,000 to $199,999 | 33,034 | 14.9% |
| $200,000+ | 47,445 | 21.4% |
Household Income by Householder Age in Anne Arundel County
The median household income in Anne Arundel County is $116,009, with the highest median household income of $144,547 found in the 45 to 64 years age bracket for the primary householder. A total of 84,756 households (38.2%) fall into this category. Meanwhile, the 15 to 24 years age bracket for the primary householder has the lowest median household income of $66,757, with 5,053 households (2.3%) in this group.
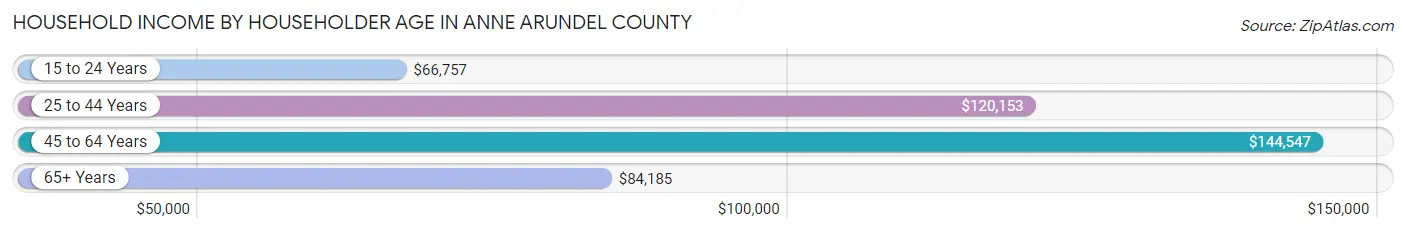
| Income Bracket | # Households | Median Income |
| 15 to 24 Years | 5,053 (2.3%) | $66,757 |
| 25 to 44 Years | 75,844 (34.2%) | $120,153 |
| 45 to 64 Years | 84,756 (38.2%) | $144,547 |
| 65+ Years | 56,051 (25.3%) | $84,185 |
| Total | 221,704 (100.0%) | $116,009 |
Poverty in Anne Arundel County
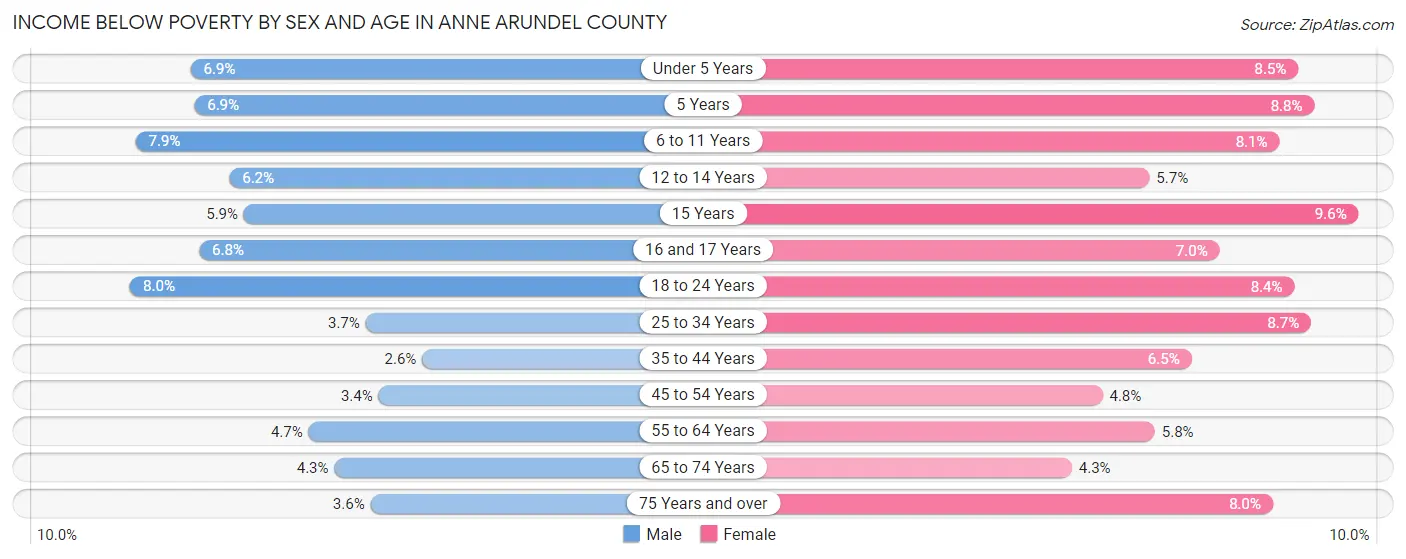
Income Below Poverty by Sex and Age in Anne Arundel County
With 4.8% poverty level for males and 6.8% for females among the residents of Anne Arundel County, 18 to 24 year old males and 15 year old females are the most vulnerable to poverty, with 1,880 males (8.0%) and 380 females (9.6%) in their respective age groups living below the poverty level.
| Age Bracket | Male | Female |
| Under 5 Years | 1,222 (6.9%) | 1,458 (8.5%) |
| 5 Years | 243 (6.9%) | 296 (8.8%) |
| 6 to 11 Years | 1,819 (7.9%) | 1,748 (8.1%) |
| 12 to 14 Years | 697 (6.2%) | 626 (5.7%) |
| 15 Years | 230 (5.9%) | 380 (9.6%) |
| 16 and 17 Years | 487 (6.8%) | 479 (7.0%) |
| 18 to 24 Years | 1,880 (8.0%) | 1,809 (8.4%) |
| 25 to 34 Years | 1,455 (3.7%) | 3,465 (8.7%) |
| 35 to 44 Years | 1,053 (2.6%) | 2,618 (6.5%) |
| 45 to 54 Years | 1,268 (3.4%) | 1,864 (4.8%) |
| 55 to 64 Years | 1,797 (4.7%) | 2,339 (5.8%) |
| 65 to 74 Years | 1,051 (4.3%) | 1,208 (4.3%) |
| 75 Years and over | 538 (3.6%) | 1,657 (8.0%) |
| Total | 13,740 (4.8%) | 19,947 (6.8%) |
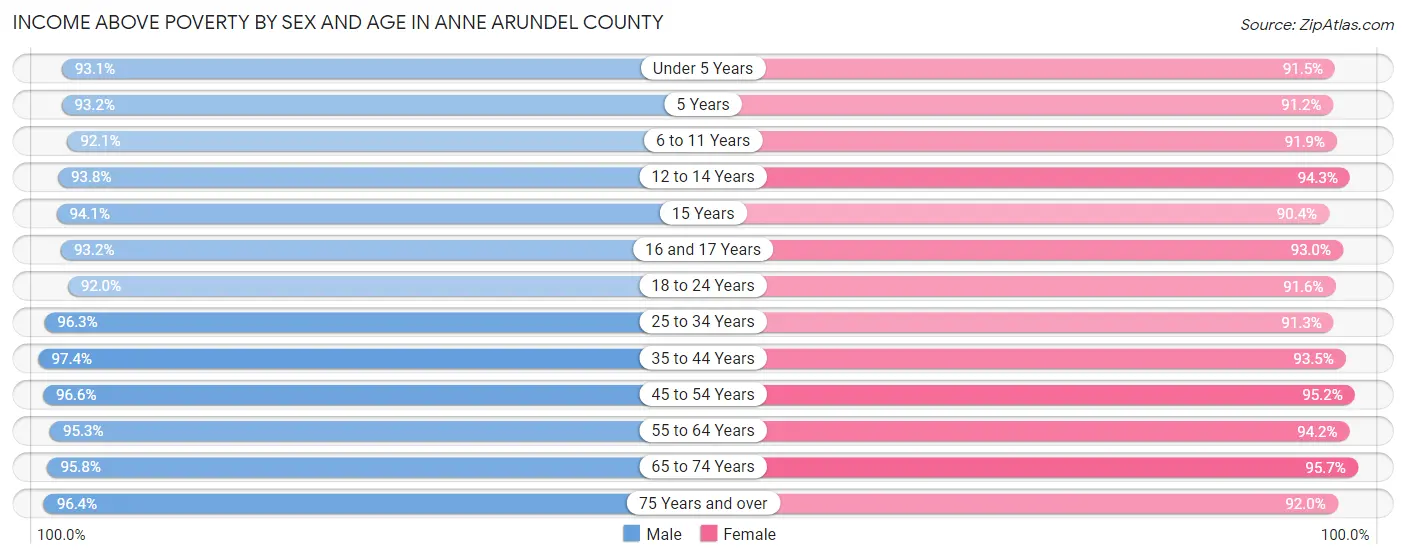
Income Above Poverty by Sex and Age in Anne Arundel County
According to the poverty statistics in Anne Arundel County, males aged 35 to 44 years and females aged 65 to 74 years are the age groups that are most secure financially, with 97.4% of males and 95.7% of females in these age groups living above the poverty line.
| Age Bracket | Male | Female |
| Under 5 Years | 16,439 (93.1%) | 15,750 (91.5%) |
| 5 Years | 3,304 (93.1%) | 3,078 (91.2%) |
| 6 to 11 Years | 21,097 (92.1%) | 19,791 (91.9%) |
| 12 to 14 Years | 10,546 (93.8%) | 10,330 (94.3%) |
| 15 Years | 3,646 (94.1%) | 3,584 (90.4%) |
| 16 and 17 Years | 6,719 (93.2%) | 6,354 (93.0%) |
| 18 to 24 Years | 21,501 (92.0%) | 19,729 (91.6%) |
| 25 to 34 Years | 38,173 (96.3%) | 36,309 (91.3%) |
| 35 to 44 Years | 39,073 (97.4%) | 37,750 (93.5%) |
| 45 to 54 Years | 35,719 (96.6%) | 36,615 (95.2%) |
| 55 to 64 Years | 36,175 (95.3%) | 37,887 (94.2%) |
| 65 to 74 Years | 23,666 (95.8%) | 27,094 (95.7%) |
| 75 Years and over | 14,486 (96.4%) | 19,045 (92.0%) |
| Total | 270,544 (95.2%) | 273,316 (93.2%) |
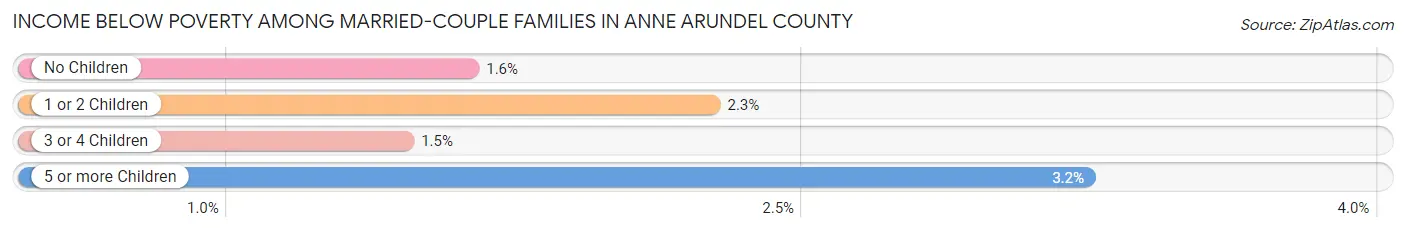
Income Below Poverty Among Married-Couple Families in Anne Arundel County
The poverty statistics for married-couple families in Anne Arundel County show that 1.8% or 2,179 of the total 118,295 families live below the poverty line. Families with 5 or more children have the highest poverty rate of 3.2%, comprising of 12 families. On the other hand, families with 3 or 4 children have the lowest poverty rate of 1.5%, which includes 144 families.
| Children | Above Poverty | Below Poverty |
| No Children | 66,015 (98.4%) | 1,096 (1.6%) |
| 1 or 2 Children | 40,055 (97.7%) | 927 (2.3%) |
| 3 or 4 Children | 9,688 (98.5%) | 144 (1.5%) |
| 5 or more Children | 358 (96.8%) | 12 (3.2%) |
| Total | 116,116 (98.2%) | 2,179 (1.8%) |
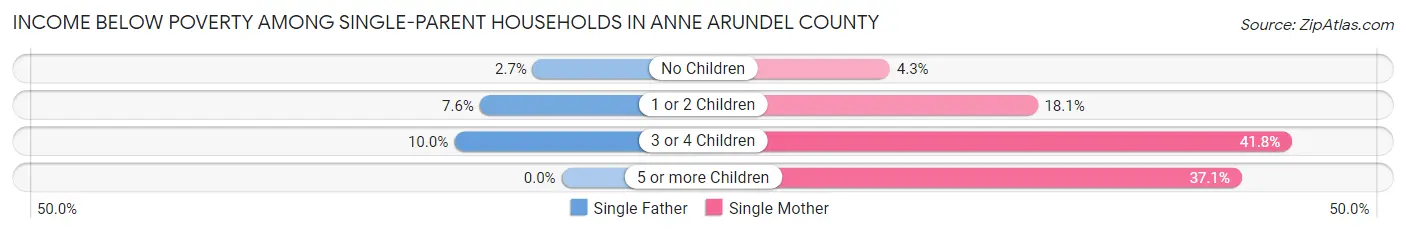
Income Below Poverty Among Single-Parent Households in Anne Arundel County
According to the poverty data in Anne Arundel County, 5.6% or 501 single-father households and 14.0% or 3,553 single-mother households are living below the poverty line. Among single-father households, those with 3 or 4 children have the highest poverty rate, with 81 households (10.0%) experiencing poverty. Likewise, among single-mother households, those with 3 or 4 children have the highest poverty rate, with 846 households (41.8%) falling below the poverty line.
| Children | Single Father | Single Mother |
| No Children | 105 (2.7%) | 479 (4.3%) |
| 1 or 2 Children | 315 (7.6%) | 2,185 (18.0%) |
| 3 or 4 Children | 81 (10.0%) | 846 (41.8%) |
| 5 or more Children | 0 (0.0%) | 43 (37.1%) |
| Total | 501 (5.6%) | 3,553 (14.0%) |
Income Below Poverty Among Married-Couple vs Single-Parent Households in Anne Arundel County
The poverty data for Anne Arundel County shows that 2,179 of the married-couple family households (1.8%) and 4,054 of the single-parent households (11.8%) are living below the poverty level. Within the married-couple family households, those with 5 or more children have the highest poverty rate, with 12 households (3.2%) falling below the poverty line. Among the single-parent households, those with 3 or 4 children have the highest poverty rate, with 927 household (32.7%) living below poverty.
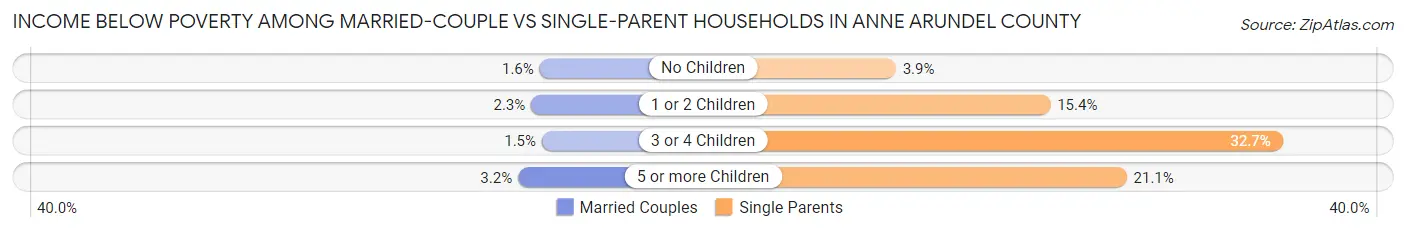
| Children | Married-Couple Families | Single-Parent Households |
| No Children | 1,096 (1.6%) | 584 (3.9%) |
| 1 or 2 Children | 927 (2.3%) | 2,500 (15.4%) |
| 3 or 4 Children | 144 (1.5%) | 927 (32.7%) |
| 5 or more Children | 12 (3.2%) | 43 (21.1%) |
| Total | 2,179 (1.8%) | 4,054 (11.8%) |
Employment Characteristics in Anne Arundel County
Employment by Class of Employer in Anne Arundel County
Among the 306,689 employed individuals in Anne Arundel County, private company employees (176,713 | 57.6%), federal government employees (46,928 | 15.3%), and not-for-profit organizations (22,597 | 7.4%) make up the most common classes of employment.
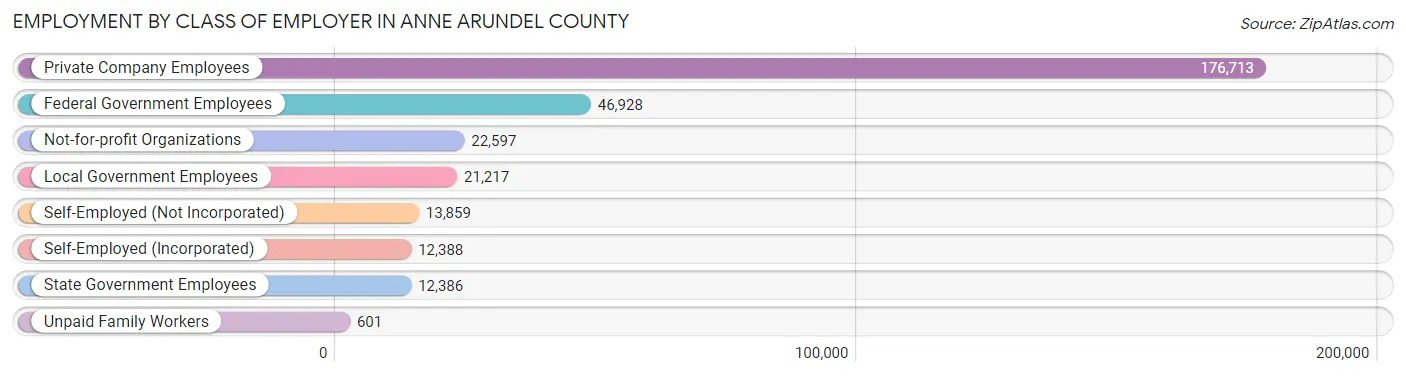
| Employer Class | # Employees | % Employees |
| Private Company Employees | 176,713 | 57.6% |
| Self-Employed (Incorporated) | 12,388 | 4.0% |
| Self-Employed (Not Incorporated) | 13,859 | 4.5% |
| Not-for-profit Organizations | 22,597 | 7.4% |
| Local Government Employees | 21,217 | 6.9% |
| State Government Employees | 12,386 | 4.0% |
| Federal Government Employees | 46,928 | 15.3% |
| Unpaid Family Workers | 601 | 0.2% |
| Total | 306,689 | 100.0% |
Employment Status by Age in Anne Arundel County
According to the labor force statistics for Anne Arundel County, out of the total population over 16 years of age (470,581), 69.0% or 324,701 individuals are in the labor force, with 4.2% or 13,637 of them unemployed. The age group with the highest labor force participation rate is 25 to 29 years, with 87.7% or 33,850 individuals in the labor force. Within the labor force, the 16 to 19 years age range has the highest percentage of unemployed individuals, with 11.0% or 1,266 of them being unemployed.
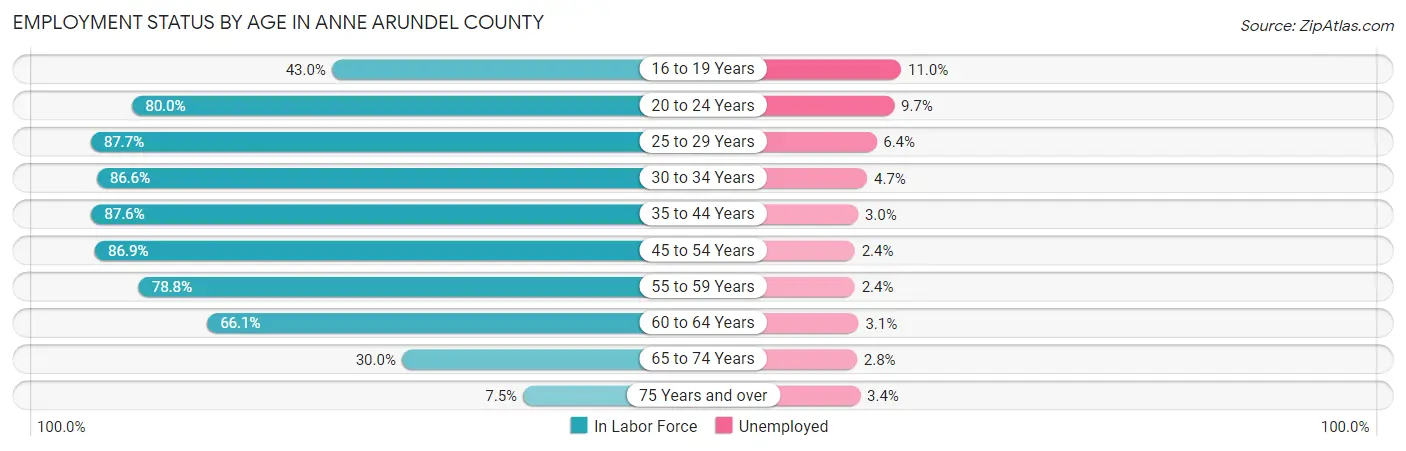
| Age Bracket | In Labor Force | Unemployed |
| 16 to 19 Years | 11,505 (43.0%) | 1,266 (11.0%) |
| 20 to 24 Years | 27,818 (80.0%) | 2,698 (9.7%) |
| 25 to 29 Years | 33,850 (87.7%) | 2,166 (6.4%) |
| 30 to 34 Years | 37,218 (86.6%) | 1,749 (4.7%) |
| 35 to 44 Years | 71,686 (87.6%) | 2,151 (3.0%) |
| 45 to 54 Years | 66,334 (86.9%) | 1,592 (2.4%) |
| 55 to 59 Years | 32,187 (78.8%) | 772 (2.4%) |
| 60 to 64 Years | 25,133 (66.1%) | 779 (3.1%) |
| 65 to 74 Years | 16,090 (30.0%) | 451 (2.8%) |
| 75 Years and over | 2,761 (7.5%) | 94 (3.4%) |
| Total | 324,701 (69.0%) | 13,637 (4.2%) |
Employment Status by Educational Attainment in Anne Arundel County
According to labor force statistics for Anne Arundel County, 83.6% of individuals (266,358) out of the total population between 25 and 64 years of age (318,610) are in the labor force, with 3.4% or 9,056 of them being unemployed. The group with the highest labor force participation rate are those with the educational attainment of bachelor's degree or higher, with 89.2% or 131,379 individuals in the labor force. Within the labor force, individuals with less than high school education have the highest percentage of unemployment, with 6.3% or 722 of them being unemployed.
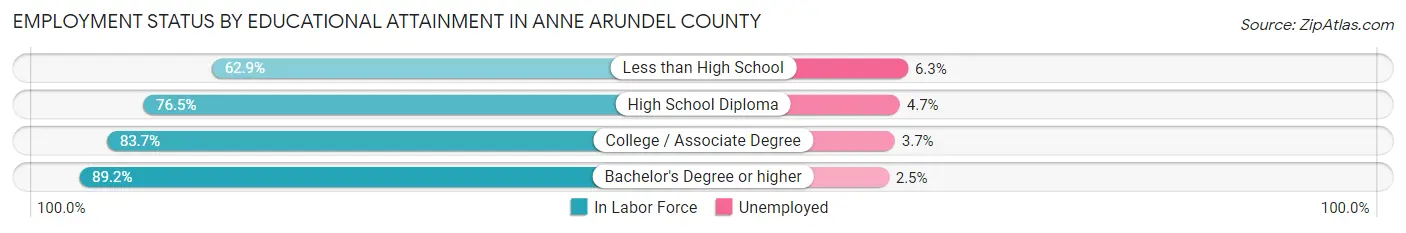
| Educational Attainment | In Labor Force | Unemployed |
| Less than High School | 11,467 (62.9%) | 1,148 (6.3%) |
| High School Diploma | 49,482 (76.5%) | 3,040 (4.7%) |
| College / Associate Degree | 74,000 (83.7%) | 3,271 (3.7%) |
| Bachelor's Degree or higher | 131,379 (89.2%) | 3,682 (2.5%) |
| Total | 266,358 (83.6%) | 10,833 (3.4%) |
Employment Occupations by Sex in Anne Arundel County
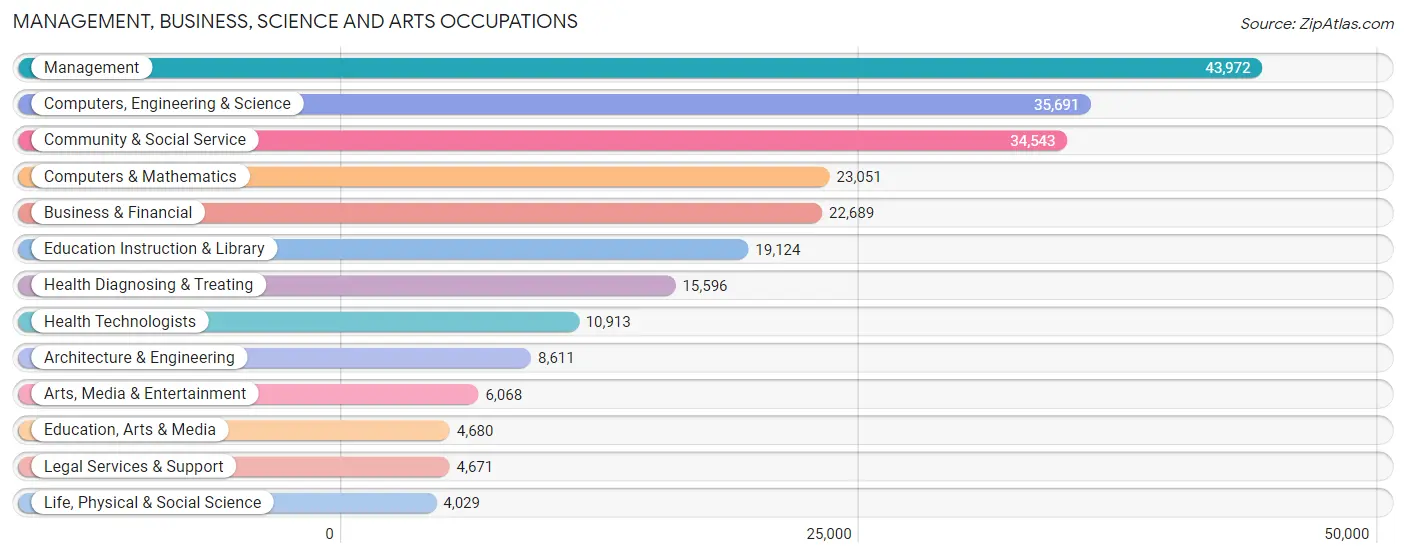
Management, Business, Science and Arts Occupations
The most common Management, Business, Science and Arts occupations in Anne Arundel County are Management (43,972 | 14.7%), Computers, Engineering & Science (35,691 | 11.9%), Community & Social Service (34,543 | 11.5%), Computers & Mathematics (23,051 | 7.7%), and Business & Financial (22,689 | 7.6%).
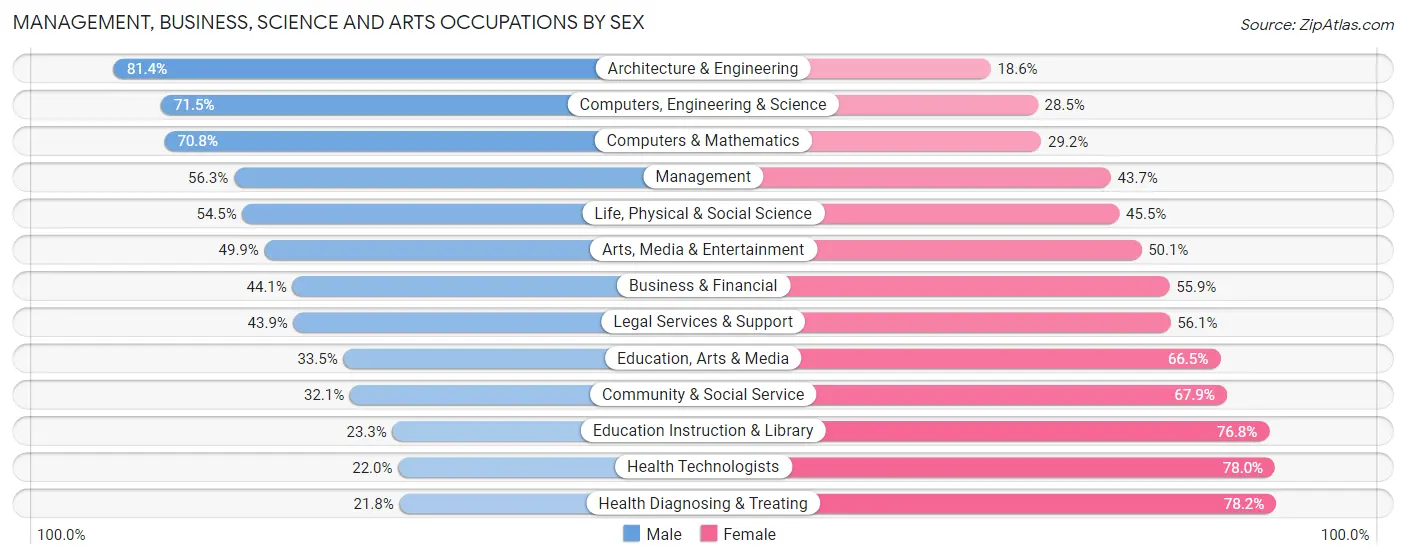
Management, Business, Science and Arts Occupations by Sex
Within the Management, Business, Science and Arts occupations in Anne Arundel County, the most male-oriented occupations are Architecture & Engineering (81.4%), Computers, Engineering & Science (71.5%), and Computers & Mathematics (70.8%), while the most female-oriented occupations are Health Diagnosing & Treating (78.2%), Health Technologists (78.0%), and Education Instruction & Library (76.7%).
| Occupation | Male | Female |
| Management | 24,755 (56.3%) | 19,217 (43.7%) |
| Business & Financial | 10,004 (44.1%) | 12,685 (55.9%) |
| Computers, Engineering & Science | 25,528 (71.5%) | 10,163 (28.5%) |
| Computers & Mathematics | 16,323 (70.8%) | 6,728 (29.2%) |
| Architecture & Engineering | 7,008 (81.4%) | 1,603 (18.6%) |
| Life, Physical & Social Science | 2,197 (54.5%) | 1,832 (45.5%) |
| Community & Social Service | 11,092 (32.1%) | 23,451 (67.9%) |
| Education, Arts & Media | 1,567 (33.5%) | 3,113 (66.5%) |
| Legal Services & Support | 2,049 (43.9%) | 2,622 (56.1%) |
| Education Instruction & Library | 4,446 (23.3%) | 14,678 (76.7%) |
| Arts, Media & Entertainment | 3,030 (49.9%) | 3,038 (50.1%) |
| Health Diagnosing & Treating | 3,399 (21.8%) | 12,197 (78.2%) |
| Health Technologists | 2,405 (22.0%) | 8,508 (78.0%) |
| Total (Category) | 74,778 (49.0%) | 77,713 (51.0%) |
| Total (Overall) | 156,151 (52.1%) | 143,638 (47.9%) |
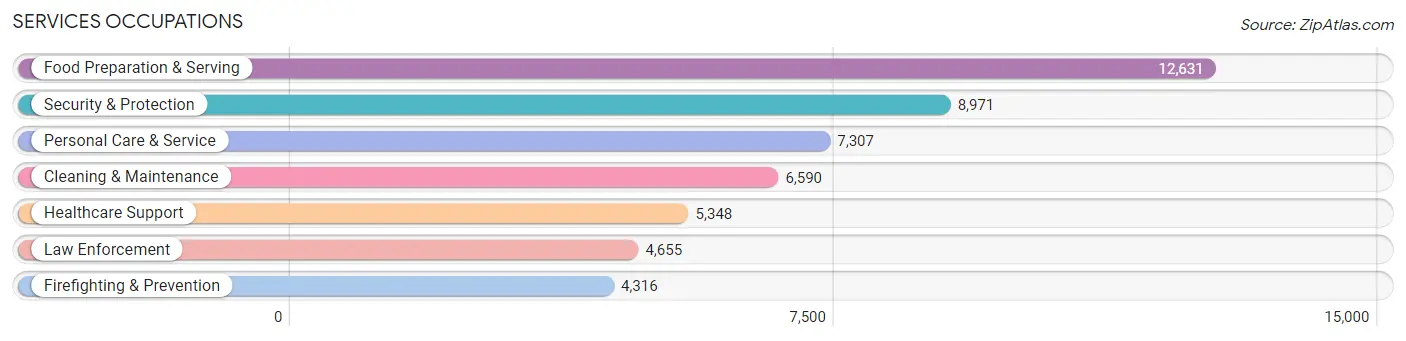
Services Occupations
The most common Services occupations in Anne Arundel County are Food Preparation & Serving (12,631 | 4.2%), Security & Protection (8,971 | 3.0%), Personal Care & Service (7,307 | 2.4%), Cleaning & Maintenance (6,590 | 2.2%), and Healthcare Support (5,348 | 1.8%).
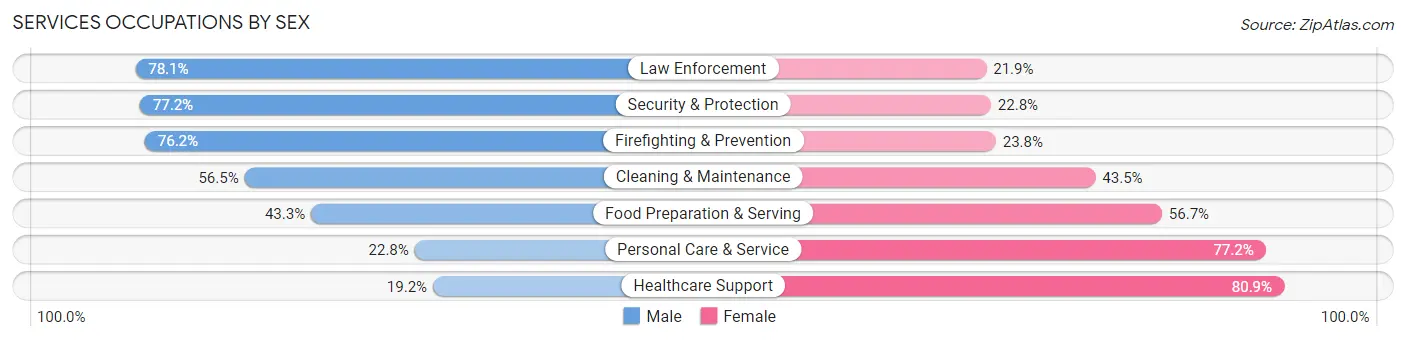
Services Occupations by Sex
Within the Services occupations in Anne Arundel County, the most male-oriented occupations are Law Enforcement (78.1%), Security & Protection (77.2%), and Firefighting & Prevention (76.2%), while the most female-oriented occupations are Healthcare Support (80.8%), Personal Care & Service (77.2%), and Food Preparation & Serving (56.7%).
| Occupation | Male | Female |
| Healthcare Support | 1,024 (19.2%) | 4,324 (80.8%) |
| Security & Protection | 6,922 (77.2%) | 2,049 (22.8%) |
| Firefighting & Prevention | 3,288 (76.2%) | 1,028 (23.8%) |
| Law Enforcement | 3,634 (78.1%) | 1,021 (21.9%) |
| Food Preparation & Serving | 5,468 (43.3%) | 7,163 (56.7%) |
| Cleaning & Maintenance | 3,721 (56.5%) | 2,869 (43.5%) |
| Personal Care & Service | 1,664 (22.8%) | 5,643 (77.2%) |
| Total (Category) | 18,799 (46.0%) | 22,048 (54.0%) |
| Total (Overall) | 156,151 (52.1%) | 143,638 (47.9%) |
Sales and Office Occupations
The most common Sales and Office occupations in Anne Arundel County are Office & Administration (33,267 | 11.1%), and Sales & Related (25,957 | 8.7%).

Sales and Office Occupations by Sex
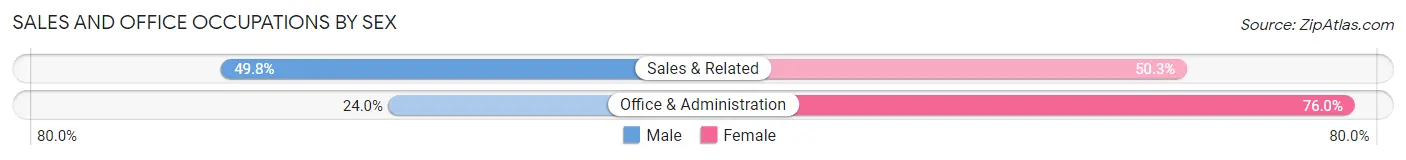
| Occupation | Male | Female |
| Sales & Related | 12,913 (49.7%) | 13,044 (50.2%) |
| Office & Administration | 7,972 (24.0%) | 25,295 (76.0%) |
| Total (Category) | 20,885 (35.3%) | 38,339 (64.7%) |
| Total (Overall) | 156,151 (52.1%) | 143,638 (47.9%) |
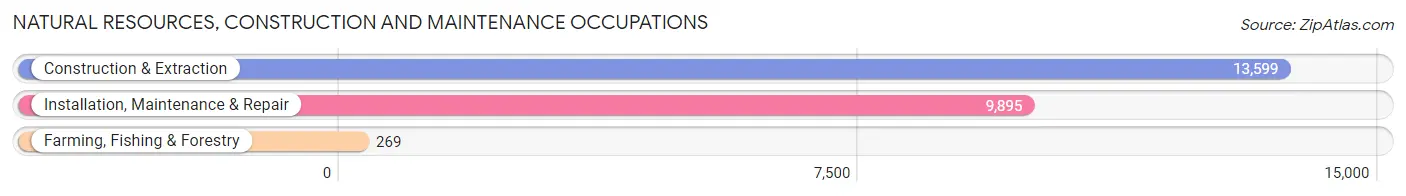
Natural Resources, Construction and Maintenance Occupations
The most common Natural Resources, Construction and Maintenance occupations in Anne Arundel County are Construction & Extraction (13,599 | 4.5%), Installation, Maintenance & Repair (9,895 | 3.3%), and Farming, Fishing & Forestry (269 | 0.1%).
Natural Resources, Construction and Maintenance Occupations by Sex
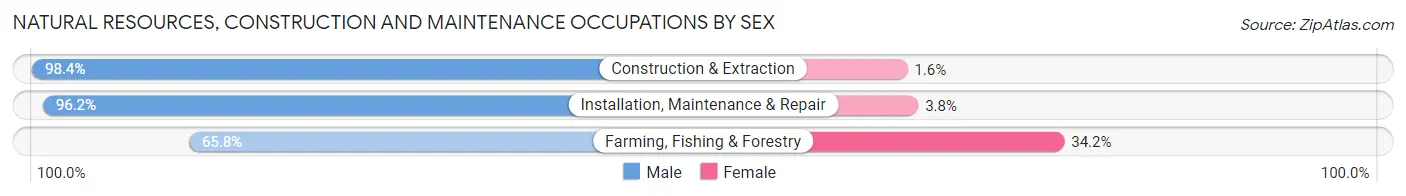
| Occupation | Male | Female |
| Farming, Fishing & Forestry | 177 (65.8%) | 92 (34.2%) |
| Construction & Extraction | 13,385 (98.4%) | 214 (1.6%) |
| Installation, Maintenance & Repair | 9,519 (96.2%) | 376 (3.8%) |
| Total (Category) | 23,081 (97.1%) | 682 (2.9%) |
| Total (Overall) | 156,151 (52.1%) | 143,638 (47.9%) |
Production, Transportation and Moving Occupations
The most common Production, Transportation and Moving occupations in Anne Arundel County are Transportation (9,157 | 3.0%), Material Moving (7,906 | 2.6%), and Production (6,401 | 2.1%).
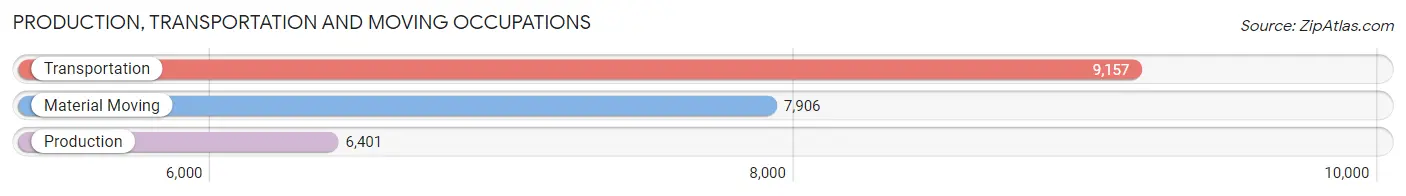
Production, Transportation and Moving Occupations by Sex
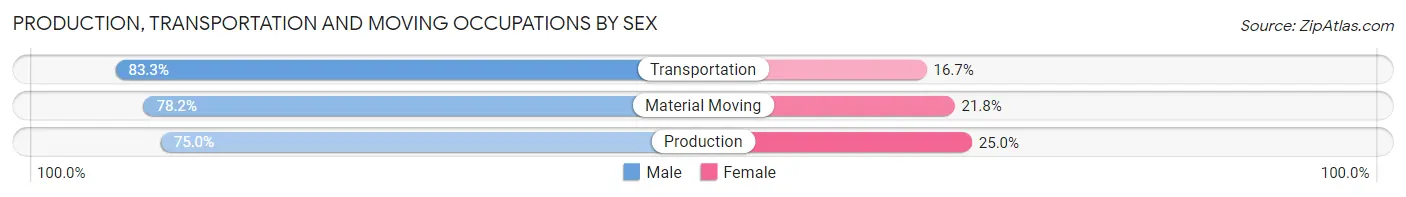
| Occupation | Male | Female |
| Production | 4,800 (75.0%) | 1,601 (25.0%) |
| Transportation | 7,629 (83.3%) | 1,528 (16.7%) |
| Material Moving | 6,179 (78.2%) | 1,727 (21.8%) |
| Total (Category) | 18,608 (79.3%) | 4,856 (20.7%) |
| Total (Overall) | 156,151 (52.1%) | 143,638 (47.9%) |
Employment Industries by Sex in Anne Arundel County
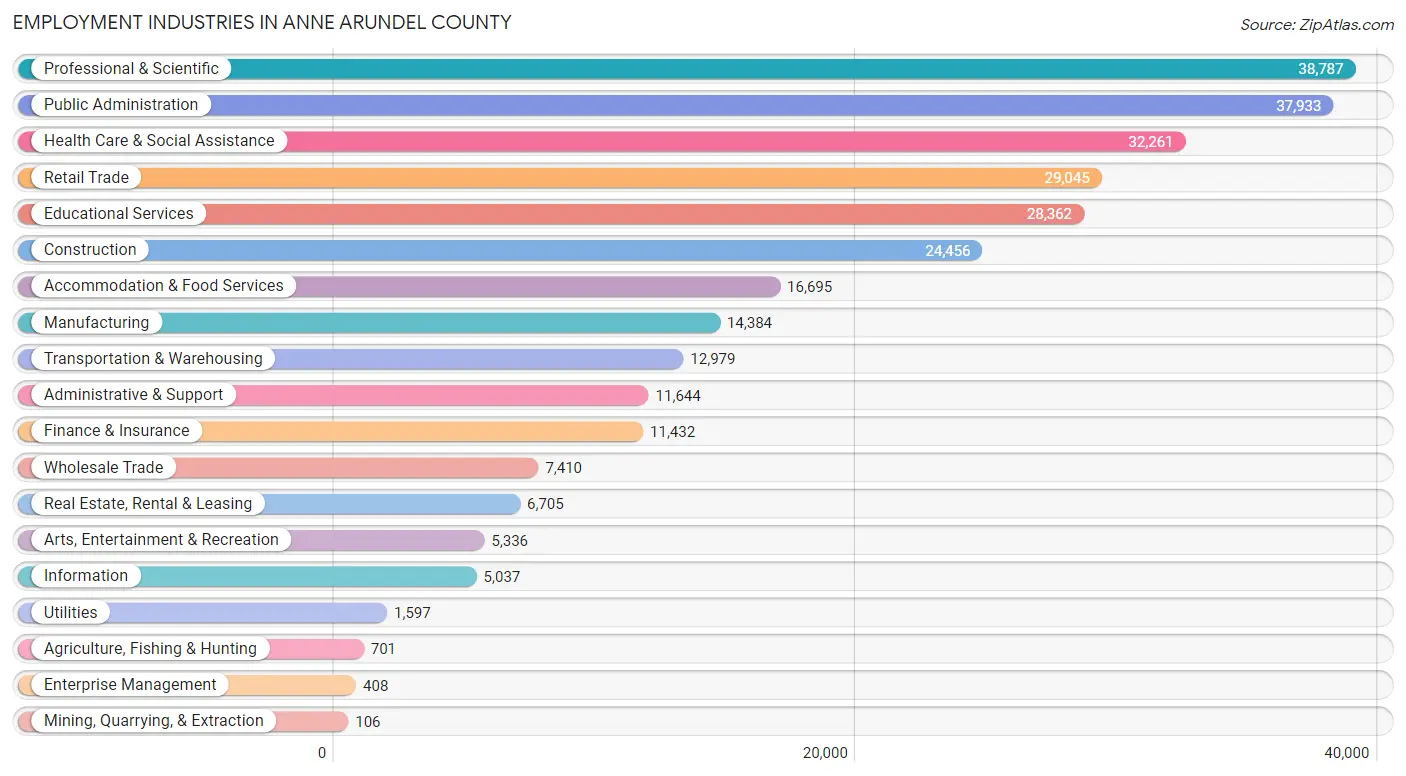
Employment Industries in Anne Arundel County
The major employment industries in Anne Arundel County include Professional & Scientific (38,787 | 12.9%), Public Administration (37,933 | 12.7%), Health Care & Social Assistance (32,261 | 10.8%), Retail Trade (29,045 | 9.7%), and Educational Services (28,362 | 9.5%).
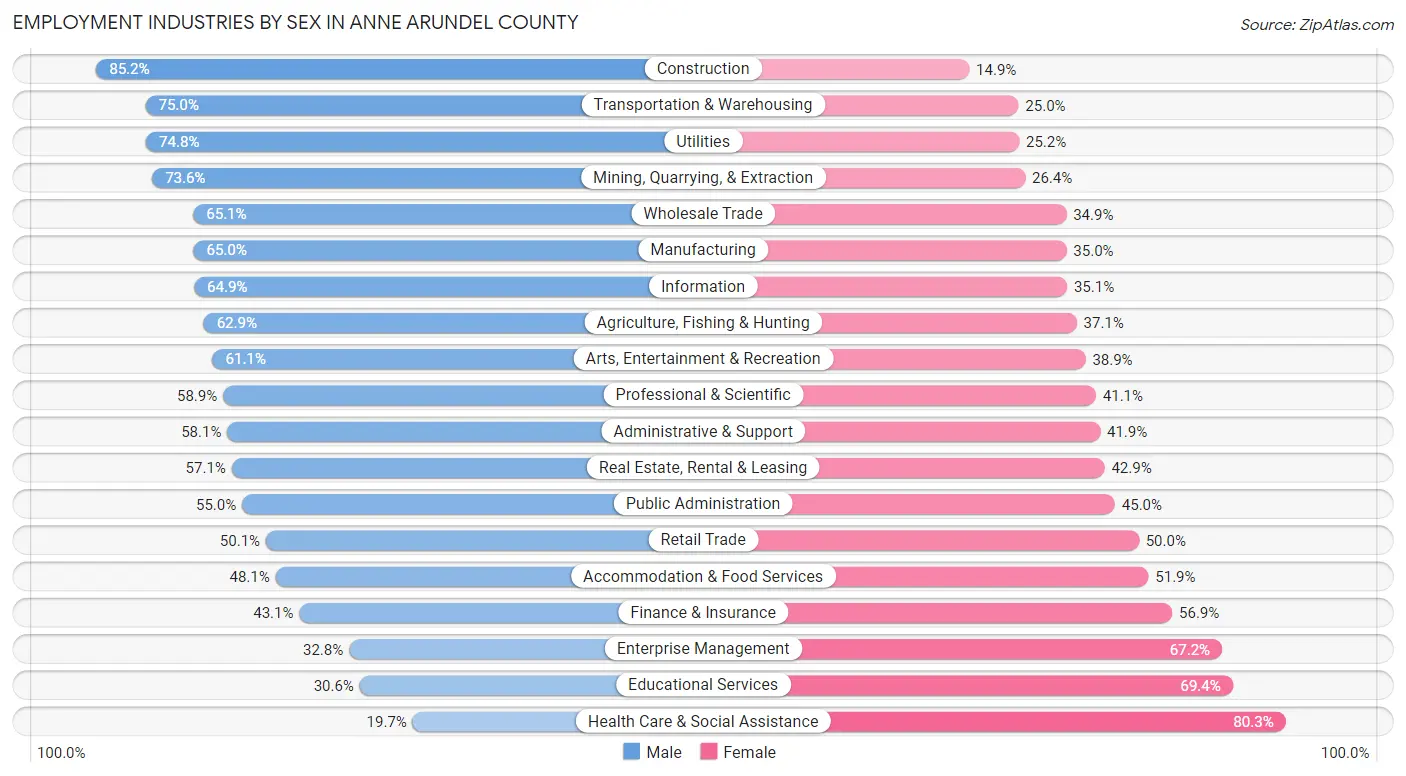
Employment Industries by Sex in Anne Arundel County
The Anne Arundel County industries that see more men than women are Construction (85.2%), Transportation & Warehousing (75.0%), and Utilities (74.8%), whereas the industries that tend to have a higher number of women are Health Care & Social Assistance (80.3%), Educational Services (69.4%), and Enterprise Management (67.2%).
| Industry | Male | Female |
| Agriculture, Fishing & Hunting | 441 (62.9%) | 260 (37.1%) |
| Mining, Quarrying, & Extraction | 78 (73.6%) | 28 (26.4%) |
| Construction | 20,824 (85.2%) | 3,632 (14.8%) |
| Manufacturing | 9,353 (65.0%) | 5,031 (35.0%) |
| Wholesale Trade | 4,821 (65.1%) | 2,589 (34.9%) |
| Retail Trade | 14,537 (50.0%) | 14,508 (49.9%) |
| Transportation & Warehousing | 9,729 (75.0%) | 3,250 (25.0%) |
| Utilities | 1,195 (74.8%) | 402 (25.2%) |
| Information | 3,269 (64.9%) | 1,768 (35.1%) |
| Finance & Insurance | 4,932 (43.1%) | 6,500 (56.9%) |
| Real Estate, Rental & Leasing | 3,831 (57.1%) | 2,874 (42.9%) |
| Professional & Scientific | 22,859 (58.9%) | 15,928 (41.1%) |
| Enterprise Management | 134 (32.8%) | 274 (67.2%) |
| Administrative & Support | 6,761 (58.1%) | 4,883 (41.9%) |
| Educational Services | 8,691 (30.6%) | 19,671 (69.4%) |
| Health Care & Social Assistance | 6,350 (19.7%) | 25,911 (80.3%) |
| Arts, Entertainment & Recreation | 3,259 (61.1%) | 2,077 (38.9%) |
| Accommodation & Food Services | 8,023 (48.1%) | 8,672 (51.9%) |
| Public Administration | 20,861 (55.0%) | 17,072 (45.0%) |
| Total | 156,151 (52.1%) | 143,638 (47.9%) |
Education in Anne Arundel County
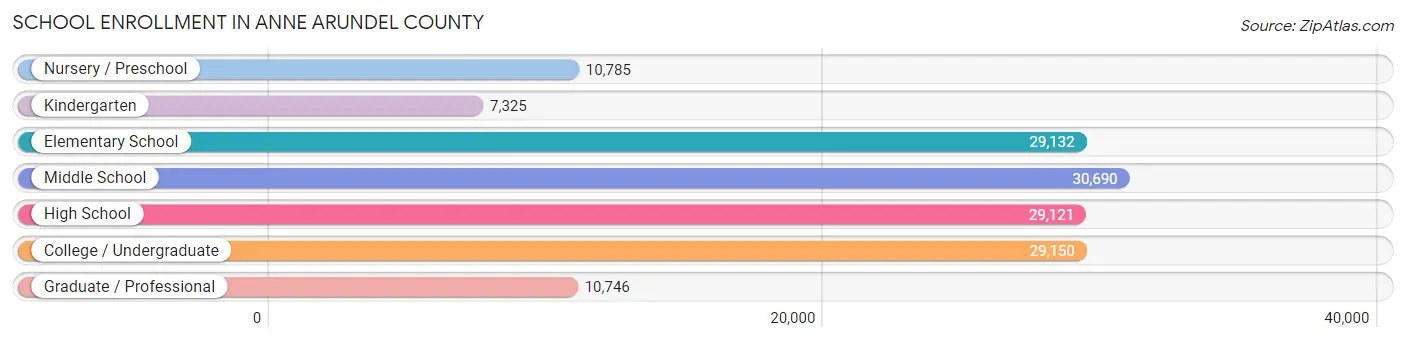
School Enrollment in Anne Arundel County
The most common levels of schooling among the 146,949 students in Anne Arundel County are middle school (30,690 | 20.9%), college / undergraduate (29,150 | 19.8%), and elementary school (29,132 | 19.8%).
| School Level | # Students | % Students |
| Nursery / Preschool | 10,785 | 7.3% |
| Kindergarten | 7,325 | 5.0% |
| Elementary School | 29,132 | 19.8% |
| Middle School | 30,690 | 20.9% |
| High School | 29,121 | 19.8% |
| College / Undergraduate | 29,150 | 19.8% |
| Graduate / Professional | 10,746 | 7.3% |
| Total | 146,949 | 100.0% |
School Enrollment by Age by Funding Source in Anne Arundel County
Out of a total of 146,949 students who are enrolled in schools in Anne Arundel County, 31,594 (21.5%) attend a private institution, while the remaining 115,355 (78.5%) are enrolled in public schools. The age group of 3 to 4 year olds has the highest likelihood of being enrolled in private schools, with 4,558 (54.6% in the age bracket) enrolled. Conversely, the age group of 10 to 14 year olds has the lowest likelihood of being enrolled in a private school, with 31,167 (83.2% in the age bracket) attending a public institution.
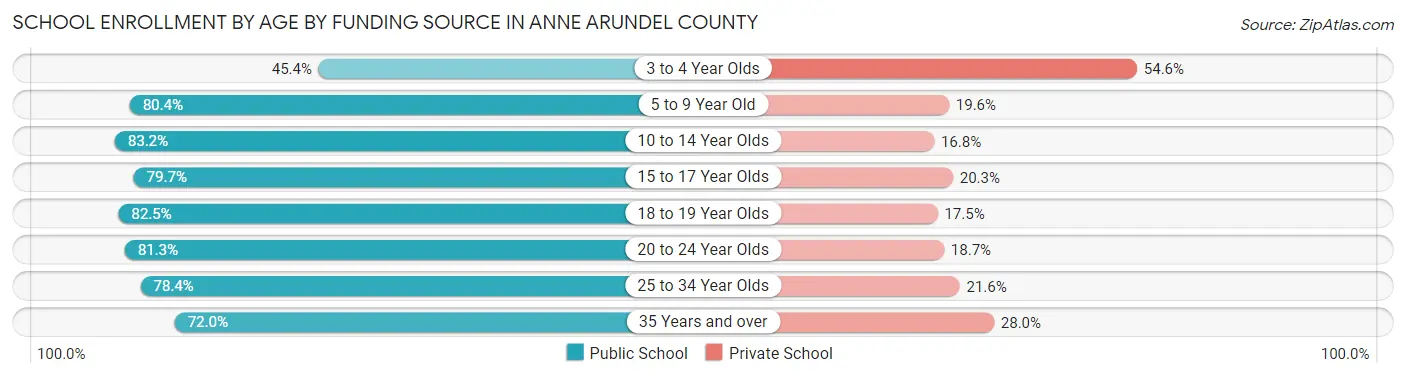
| Age Bracket | Public School | Private School |
| 3 to 4 Year Olds | 3,788 (45.4%) | 4,558 (54.6%) |
| 5 to 9 Year Old | 28,090 (80.4%) | 6,844 (19.6%) |
| 10 to 14 Year Olds | 31,167 (83.2%) | 6,301 (16.8%) |
| 15 to 17 Year Olds | 17,142 (79.7%) | 4,371 (20.3%) |
| 18 to 19 Year Olds | 7,899 (82.5%) | 1,672 (17.5%) |
| 20 to 24 Year Olds | 10,693 (81.3%) | 2,455 (18.7%) |
| 25 to 34 Year Olds | 8,833 (78.4%) | 2,430 (21.6%) |
| 35 Years and over | 7,711 (72.0%) | 2,995 (28.0%) |
| Total | 115,355 (78.5%) | 31,594 (21.5%) |
Educational Attainment by Field of Study in Anne Arundel County
Business (34,708 | 17.7%), social sciences (20,275 | 10.4%), education (17,979 | 9.2%), engineering (17,096 | 8.7%), and science & technology (15,758 | 8.1%) are the most common fields of study among 195,781 individuals in Anne Arundel County who have obtained a bachelor's degree or higher.
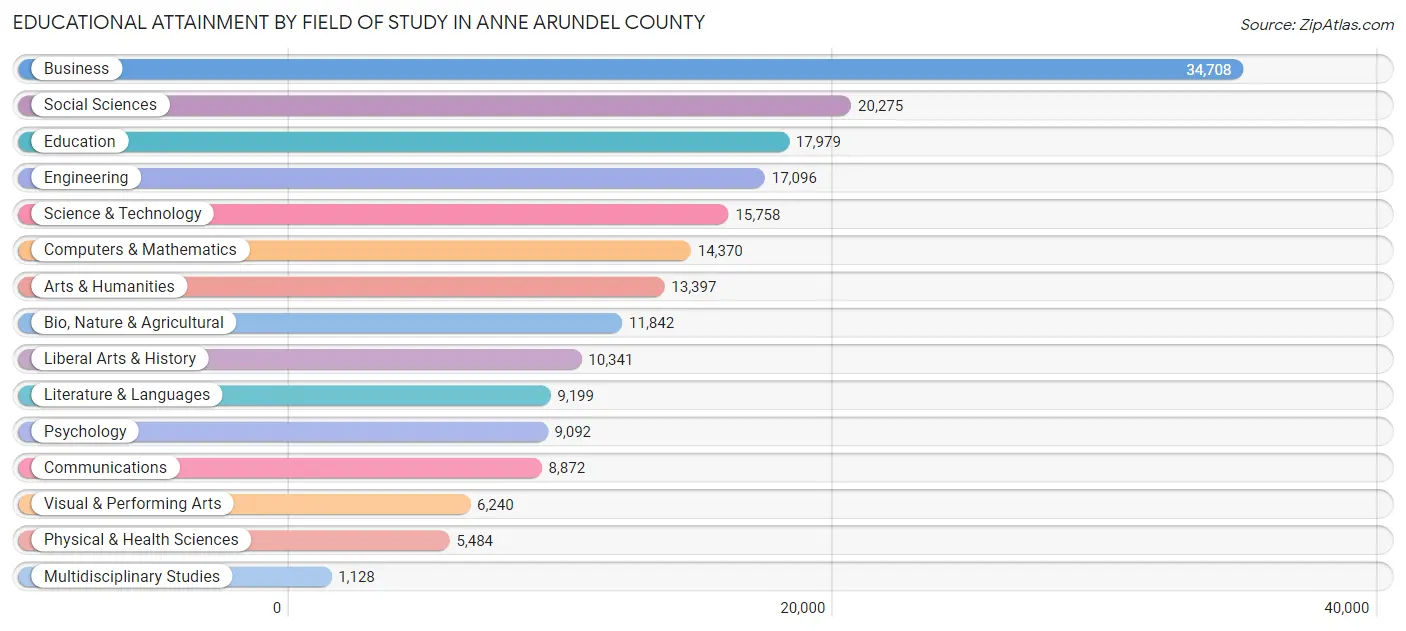
| Field of Study | # Graduates | % Graduates |
| Computers & Mathematics | 14,370 | 7.3% |
| Bio, Nature & Agricultural | 11,842 | 6.0% |
| Physical & Health Sciences | 5,484 | 2.8% |
| Psychology | 9,092 | 4.6% |
| Social Sciences | 20,275 | 10.4% |
| Engineering | 17,096 | 8.7% |
| Multidisciplinary Studies | 1,128 | 0.6% |
| Science & Technology | 15,758 | 8.1% |
| Business | 34,708 | 17.7% |
| Education | 17,979 | 9.2% |
| Literature & Languages | 9,199 | 4.7% |
| Liberal Arts & History | 10,341 | 5.3% |
| Visual & Performing Arts | 6,240 | 3.2% |
| Communications | 8,872 | 4.5% |
| Arts & Humanities | 13,397 | 6.8% |
| Total | 195,781 | 100.0% |
Transportation & Commute in Anne Arundel County
Vehicle Availability by Sex in Anne Arundel County
The most prevalent vehicle ownership categories in Anne Arundel County are males with 2 vehicles (70,646, accounting for 43.7%) and females with 2 vehicles (61,045, making up 49.5%).
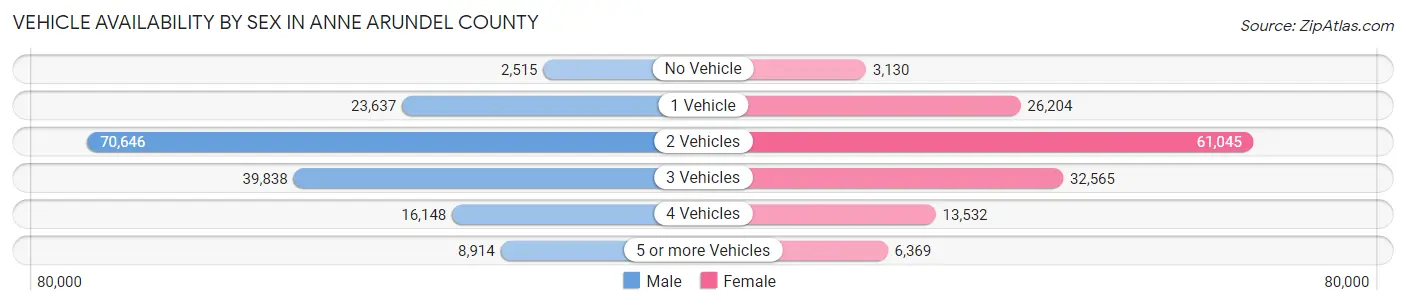
| Vehicles Available | Male | Female |
| No Vehicle | 2,515 (1.6%) | 3,130 (2.2%) |
| 1 Vehicle | 23,637 (14.6%) | 26,204 (18.3%) |
| 2 Vehicles | 70,646 (43.7%) | 61,045 (42.7%) |
| 3 Vehicles | 39,838 (24.6%) | 32,565 (22.8%) |
| 4 Vehicles | 16,148 (10.0%) | 13,532 (9.5%) |
| 5 or more Vehicles | 8,914 (5.5%) | 6,369 (4.5%) |
| Total | 161,698 (100.0%) | 142,845 (100.0%) |
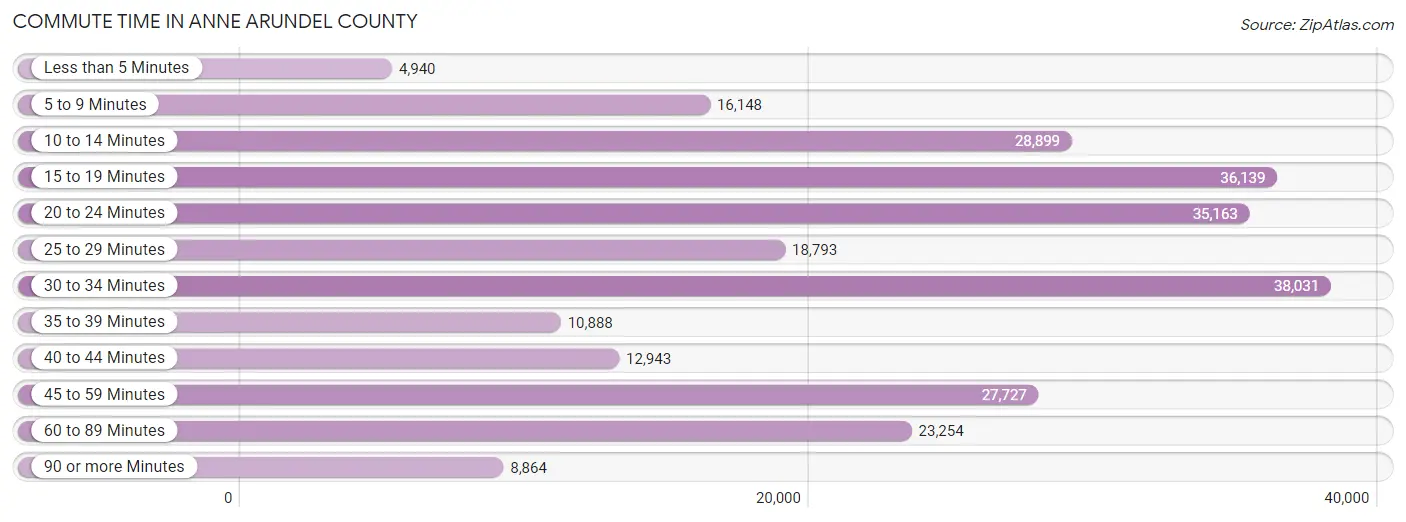
Commute Time in Anne Arundel County
The most frequently occuring commute durations in Anne Arundel County are 30 to 34 minutes (38,031 commuters, 14.5%), 15 to 19 minutes (36,139 commuters, 13.8%), and 20 to 24 minutes (35,163 commuters, 13.4%).
| Commute Time | # Commuters | % Commuters |
| Less than 5 Minutes | 4,940 | 1.9% |
| 5 to 9 Minutes | 16,148 | 6.2% |
| 10 to 14 Minutes | 28,899 | 11.0% |
| 15 to 19 Minutes | 36,139 | 13.8% |
| 20 to 24 Minutes | 35,163 | 13.4% |
| 25 to 29 Minutes | 18,793 | 7.2% |
| 30 to 34 Minutes | 38,031 | 14.5% |
| 35 to 39 Minutes | 10,888 | 4.2% |
| 40 to 44 Minutes | 12,943 | 4.9% |
| 45 to 59 Minutes | 27,727 | 10.6% |
| 60 to 89 Minutes | 23,254 | 8.9% |
| 90 or more Minutes | 8,864 | 3.4% |
Commute Time by Sex in Anne Arundel County
The most common commute times in Anne Arundel County are 30 to 34 minutes (20,455 commuters, 14.3%) for males and 30 to 34 minutes (17,576 commuters, 14.8%) for females.
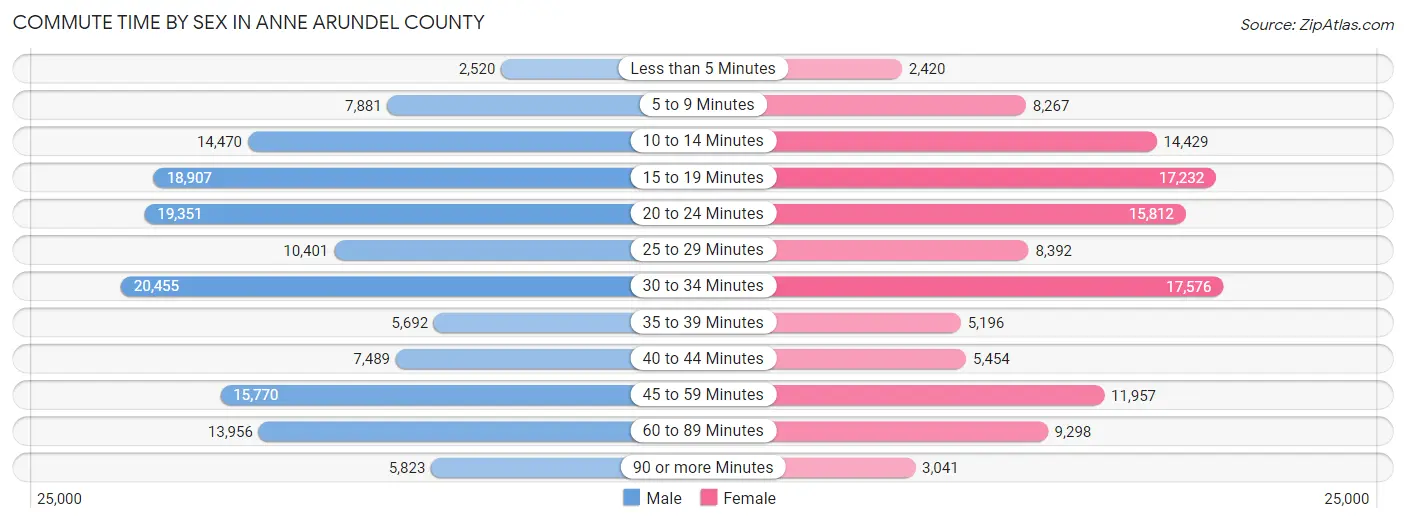
| Commute Time | Male | Female |
| Less than 5 Minutes | 2,520 (1.8%) | 2,420 (2.0%) |
| 5 to 9 Minutes | 7,881 (5.5%) | 8,267 (6.9%) |
| 10 to 14 Minutes | 14,470 (10.1%) | 14,429 (12.1%) |
| 15 to 19 Minutes | 18,907 (13.3%) | 17,232 (14.5%) |
| 20 to 24 Minutes | 19,351 (13.6%) | 15,812 (13.3%) |
| 25 to 29 Minutes | 10,401 (7.3%) | 8,392 (7.0%) |
| 30 to 34 Minutes | 20,455 (14.3%) | 17,576 (14.8%) |
| 35 to 39 Minutes | 5,692 (4.0%) | 5,196 (4.4%) |
| 40 to 44 Minutes | 7,489 (5.2%) | 5,454 (4.6%) |
| 45 to 59 Minutes | 15,770 (11.1%) | 11,957 (10.0%) |
| 60 to 89 Minutes | 13,956 (9.8%) | 9,298 (7.8%) |
| 90 or more Minutes | 5,823 (4.1%) | 3,041 (2.5%) |
Time of Departure to Work by Sex in Anne Arundel County
The most frequent times of departure to work in Anne Arundel County are 7:00 AM to 7:29 AM (18,776, 13.2%) for males and 7:00 AM to 7:29 AM (19,749, 16.6%) for females.
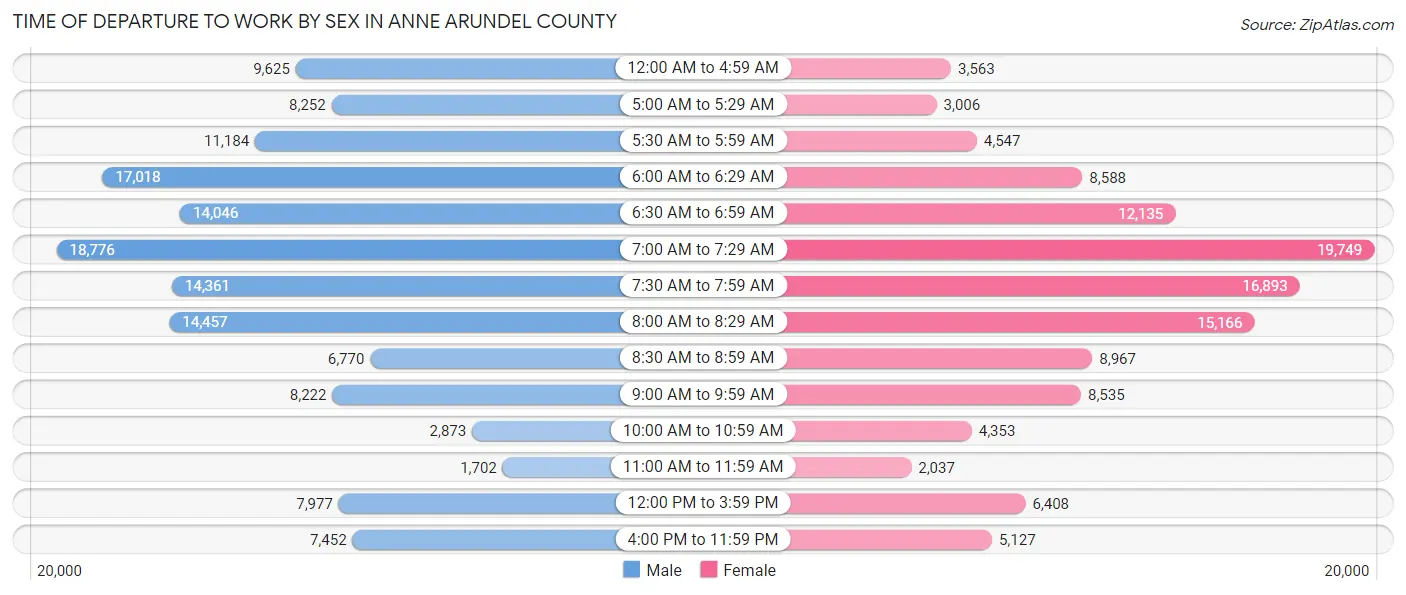
| Time of Departure | Male | Female |
| 12:00 AM to 4:59 AM | 9,625 (6.7%) | 3,563 (3.0%) |
| 5:00 AM to 5:29 AM | 8,252 (5.8%) | 3,006 (2.5%) |
| 5:30 AM to 5:59 AM | 11,184 (7.8%) | 4,547 (3.8%) |
| 6:00 AM to 6:29 AM | 17,018 (11.9%) | 8,588 (7.2%) |
| 6:30 AM to 6:59 AM | 14,046 (9.8%) | 12,135 (10.2%) |
| 7:00 AM to 7:29 AM | 18,776 (13.2%) | 19,749 (16.6%) |
| 7:30 AM to 7:59 AM | 14,361 (10.1%) | 16,893 (14.2%) |
| 8:00 AM to 8:29 AM | 14,457 (10.1%) | 15,166 (12.7%) |
| 8:30 AM to 8:59 AM | 6,770 (4.7%) | 8,967 (7.5%) |
| 9:00 AM to 9:59 AM | 8,222 (5.8%) | 8,535 (7.2%) |
| 10:00 AM to 10:59 AM | 2,873 (2.0%) | 4,353 (3.7%) |
| 11:00 AM to 11:59 AM | 1,702 (1.2%) | 2,037 (1.7%) |
| 12:00 PM to 3:59 PM | 7,977 (5.6%) | 6,408 (5.4%) |
| 4:00 PM to 11:59 PM | 7,452 (5.2%) | 5,127 (4.3%) |
| Total | 142,715 (100.0%) | 119,074 (100.0%) |
Housing Occupancy in Anne Arundel County
Occupancy by Ownership in Anne Arundel County
Of the total 221,704 dwellings in Anne Arundel County, owner-occupied units account for 166,367 (75.0%), while renter-occupied units make up 55,337 (25.0%).
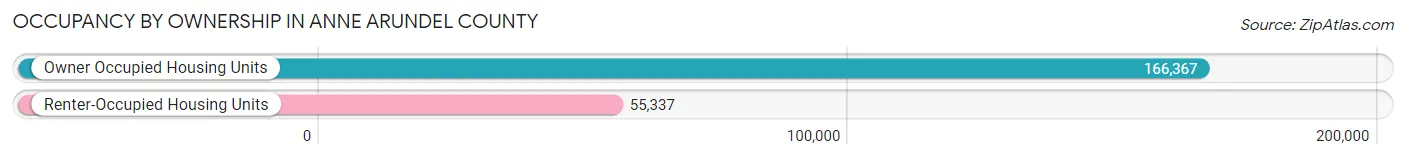
| Occupancy | # Housing Units | % Housing Units |
| Owner Occupied Housing Units | 166,367 | 75.0% |
| Renter-Occupied Housing Units | 55,337 | 25.0% |
| Total Occupied Housing Units | 221,704 | 100.0% |
Occupancy by Household Size in Anne Arundel County
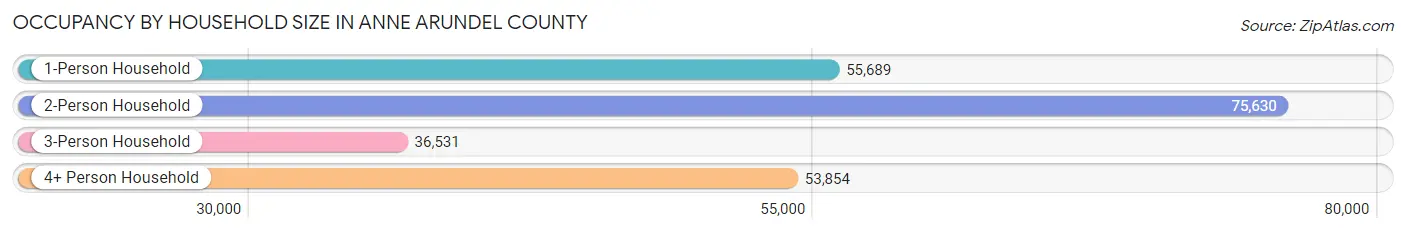
| Household Size | # Housing Units | % Housing Units |
| 1-Person Household | 55,689 | 25.1% |
| 2-Person Household | 75,630 | 34.1% |
| 3-Person Household | 36,531 | 16.5% |
| 4+ Person Household | 53,854 | 24.3% |
| Total Housing Units | 221,704 | 100.0% |
Occupancy by Ownership by Household Size in Anne Arundel County
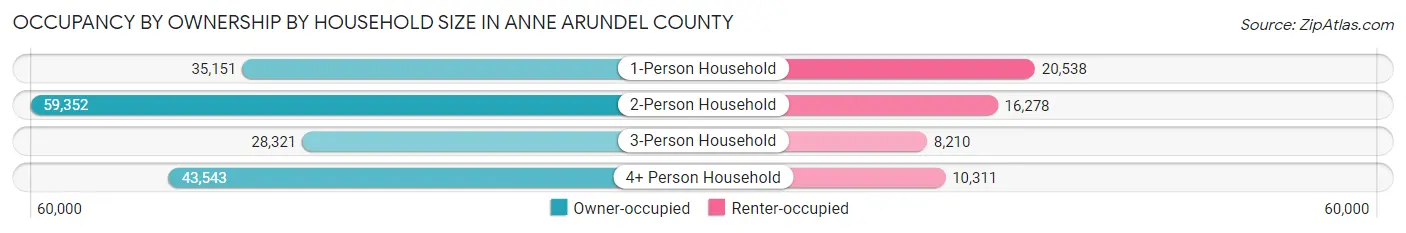
| Household Size | Owner-occupied | Renter-occupied |
| 1-Person Household | 35,151 (63.1%) | 20,538 (36.9%) |
| 2-Person Household | 59,352 (78.5%) | 16,278 (21.5%) |
| 3-Person Household | 28,321 (77.5%) | 8,210 (22.5%) |
| 4+ Person Household | 43,543 (80.8%) | 10,311 (19.2%) |
| Total Housing Units | 166,367 (75.0%) | 55,337 (25.0%) |
Occupancy by Educational Attainment in Anne Arundel County
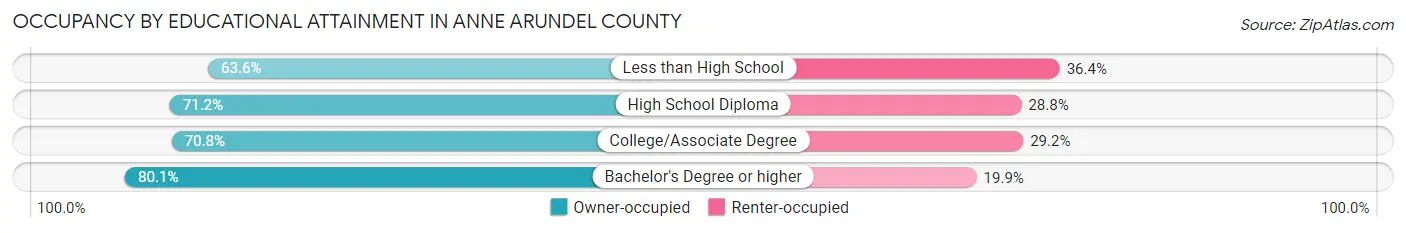
| Household Size | Owner-occupied | Renter-occupied |
| Less than High School | 6,714 (63.6%) | 3,843 (36.4%) |
| High School Diploma | 29,289 (71.2%) | 11,852 (28.8%) |
| College/Associate Degree | 44,264 (70.8%) | 18,221 (29.2%) |
| Bachelor's Degree or higher | 86,100 (80.1%) | 21,421 (19.9%) |
Occupancy by Age of Householder in Anne Arundel County
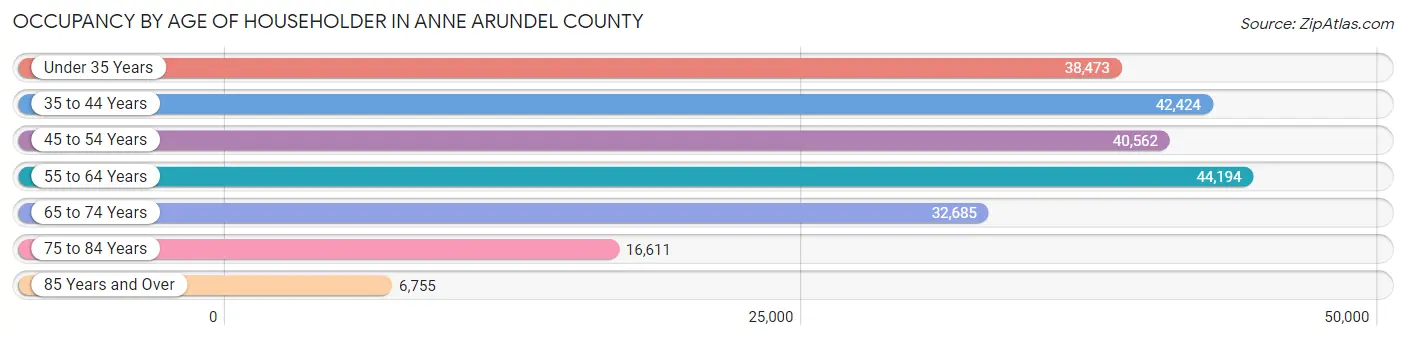
| Age Bracket | # Households | % Households |
| Under 35 Years | 38,473 | 17.3% |
| 35 to 44 Years | 42,424 | 19.1% |
| 45 to 54 Years | 40,562 | 18.3% |
| 55 to 64 Years | 44,194 | 19.9% |
| 65 to 74 Years | 32,685 | 14.7% |
| 75 to 84 Years | 16,611 | 7.5% |
| 85 Years and Over | 6,755 | 3.0% |
| Total | 221,704 | 100.0% |
Housing Finances in Anne Arundel County
Median Income by Occupancy in Anne Arundel County
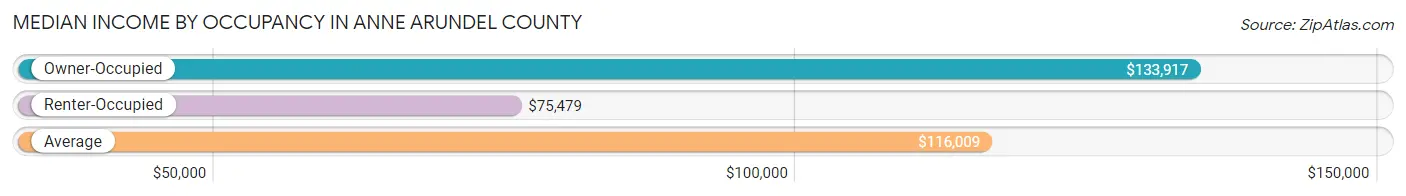
| Occupancy Type | # Households | Median Income |
| Owner-Occupied | 166,367 (75.0%) | $133,917 |
| Renter-Occupied | 55,337 (25.0%) | $75,479 |
| Average | 221,704 (100.0%) | $116,009 |
Occupancy by Householder Income Bracket in Anne Arundel County
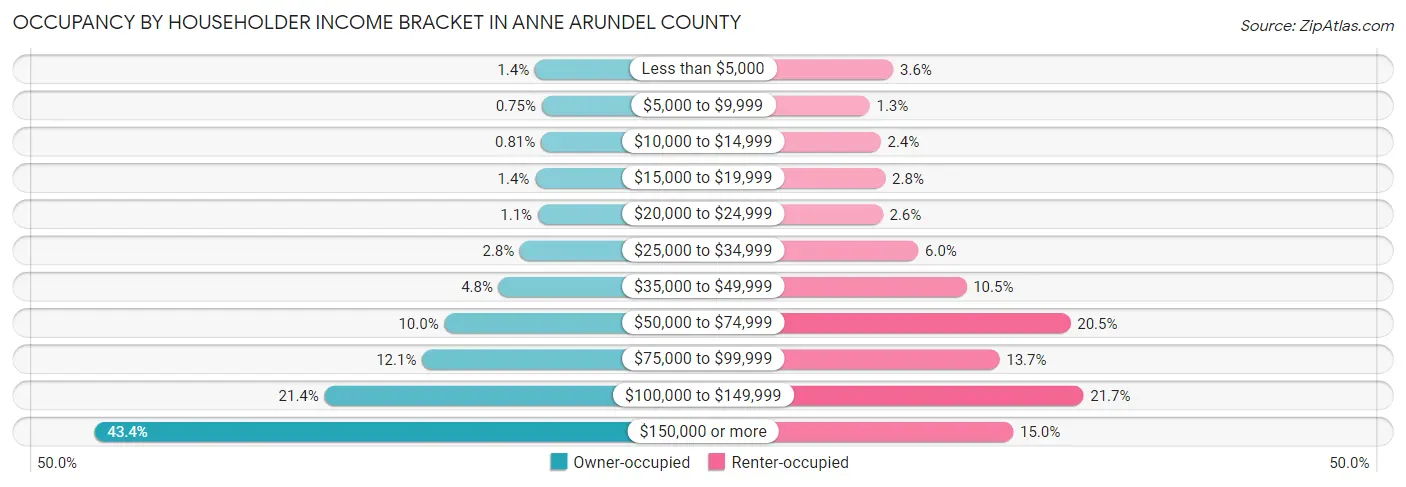
| Income Bracket | Owner-occupied | Renter-occupied |
| Less than $5,000 | 2,307 (1.4%) | 1,983 (3.6%) |
| $5,000 to $9,999 | 1,250 (0.7%) | 738 (1.3%) |
| $10,000 to $14,999 | 1,351 (0.8%) | 1,315 (2.4%) |
| $15,000 to $19,999 | 2,284 (1.4%) | 1,558 (2.8%) |
| $20,000 to $24,999 | 1,852 (1.1%) | 1,422 (2.6%) |
| $25,000 to $34,999 | 4,674 (2.8%) | 3,298 (6.0%) |
| $35,000 to $49,999 | 8,047 (4.8%) | 5,832 (10.5%) |
| $50,000 to $74,999 | 16,651 (10.0%) | 11,315 (20.4%) |
| $75,000 to $99,999 | 20,179 (12.1%) | 7,574 (13.7%) |
| $100,000 to $149,999 | 35,653 (21.4%) | 12,003 (21.7%) |
| $150,000 or more | 72,119 (43.3%) | 8,299 (15.0%) |
| Total | 166,367 (100.0%) | 55,337 (100.0%) |
Monthly Housing Cost Tiers in Anne Arundel County
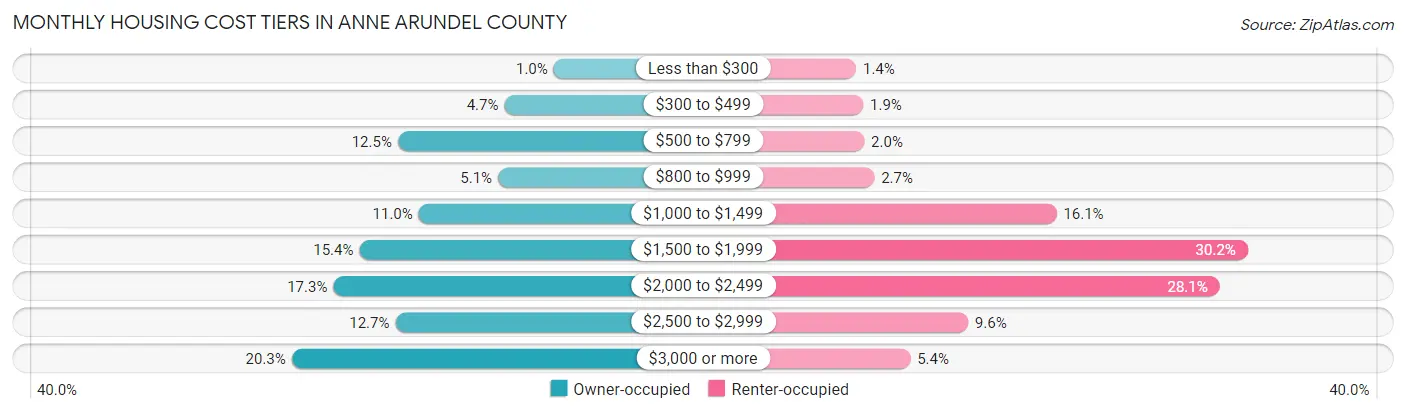
| Monthly Cost | Owner-occupied | Renter-occupied |
| Less than $300 | 1,734 (1.0%) | 759 (1.4%) |
| $300 to $499 | 7,766 (4.7%) | 1,044 (1.9%) |
| $500 to $799 | 20,825 (12.5%) | 1,092 (2.0%) |
| $800 to $999 | 8,548 (5.1%) | 1,497 (2.7%) |
| $1,000 to $1,499 | 18,272 (11.0%) | 8,927 (16.1%) |
| $1,500 to $1,999 | 25,531 (15.3%) | 16,718 (30.2%) |
| $2,000 to $2,499 | 28,729 (17.3%) | 15,574 (28.1%) |
| $2,500 to $2,999 | 21,124 (12.7%) | 5,317 (9.6%) |
| $3,000 or more | 33,838 (20.3%) | 2,965 (5.4%) |
| Total | 166,367 (100.0%) | 55,337 (100.0%) |
Physical Housing Characteristics in Anne Arundel County
Housing Structures in Anne Arundel County
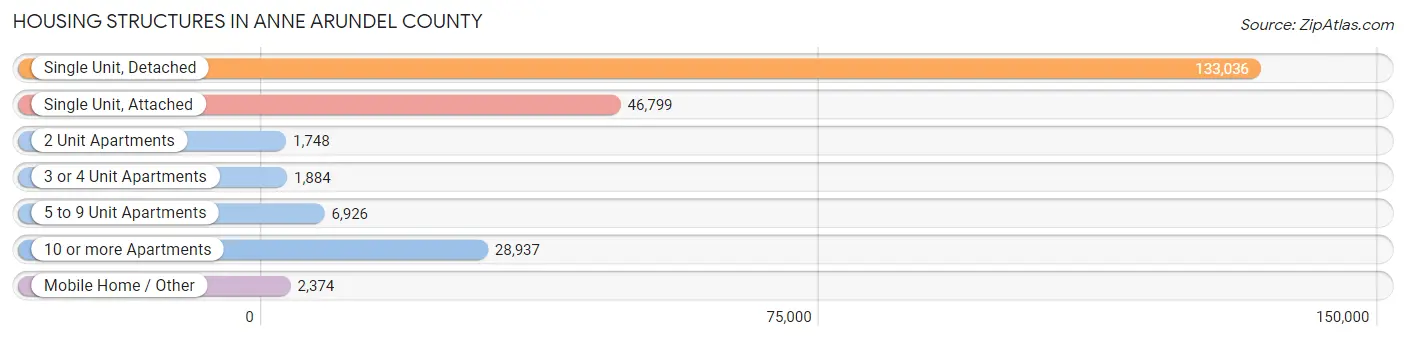
| Structure Type | # Housing Units | % Housing Units |
| Single Unit, Detached | 133,036 | 60.0% |
| Single Unit, Attached | 46,799 | 21.1% |
| 2 Unit Apartments | 1,748 | 0.8% |
| 3 or 4 Unit Apartments | 1,884 | 0.9% |
| 5 to 9 Unit Apartments | 6,926 | 3.1% |
| 10 or more Apartments | 28,937 | 13.1% |
| Mobile Home / Other | 2,374 | 1.1% |
| Total | 221,704 | 100.0% |
Housing Structures by Occupancy in Anne Arundel County
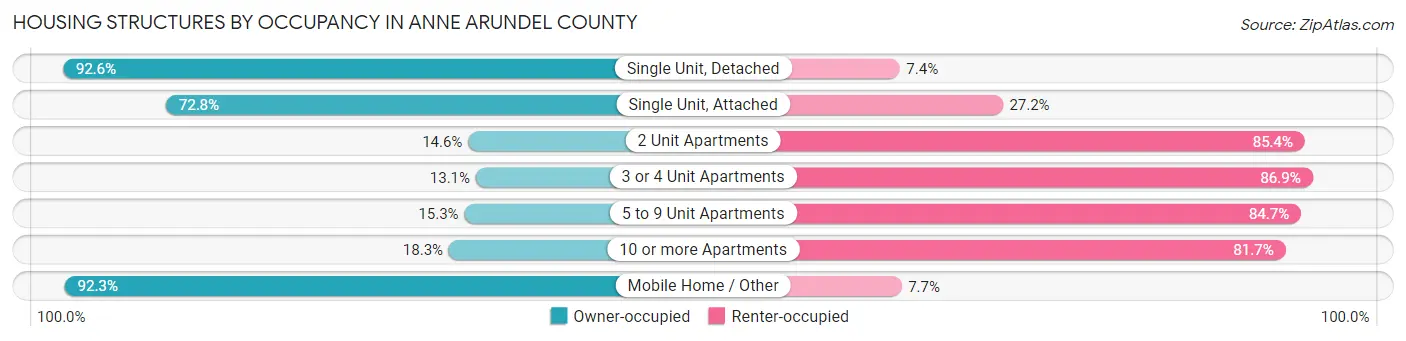
| Structure Type | Owner-occupied | Renter-occupied |
| Single Unit, Detached | 123,248 (92.6%) | 9,788 (7.4%) |
| Single Unit, Attached | 34,068 (72.8%) | 12,731 (27.2%) |
| 2 Unit Apartments | 255 (14.6%) | 1,493 (85.4%) |
| 3 or 4 Unit Apartments | 247 (13.1%) | 1,637 (86.9%) |
| 5 to 9 Unit Apartments | 1,061 (15.3%) | 5,865 (84.7%) |
| 10 or more Apartments | 5,297 (18.3%) | 23,640 (81.7%) |
| Mobile Home / Other | 2,191 (92.3%) | 183 (7.7%) |
| Total | 166,367 (75.0%) | 55,337 (25.0%) |
Housing Structures by Number of Rooms in Anne Arundel County
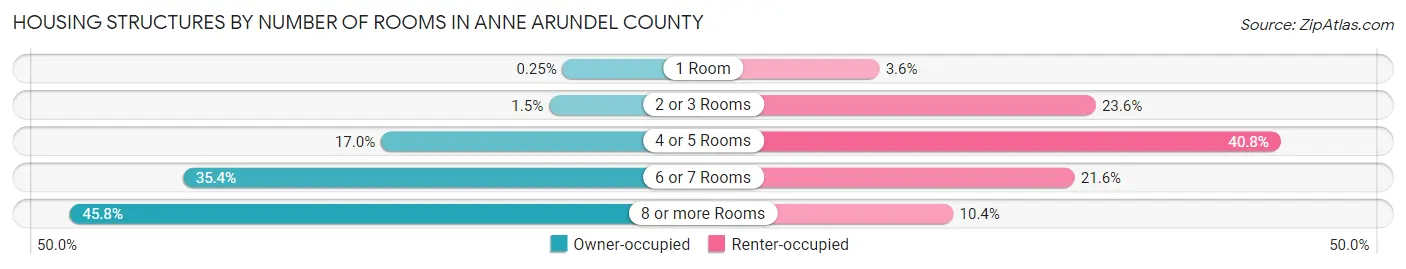
| Number of Rooms | Owner-occupied | Renter-occupied |
| 1 Room | 413 (0.3%) | 1,988 (3.6%) |
| 2 or 3 Rooms | 2,496 (1.5%) | 13,053 (23.6%) |
| 4 or 5 Rooms | 28,349 (17.0%) | 22,554 (40.8%) |
| 6 or 7 Rooms | 58,841 (35.4%) | 11,977 (21.6%) |
| 8 or more Rooms | 76,268 (45.8%) | 5,765 (10.4%) |
| Total | 166,367 (100.0%) | 55,337 (100.0%) |
Housing Structure by Heating Type in Anne Arundel County
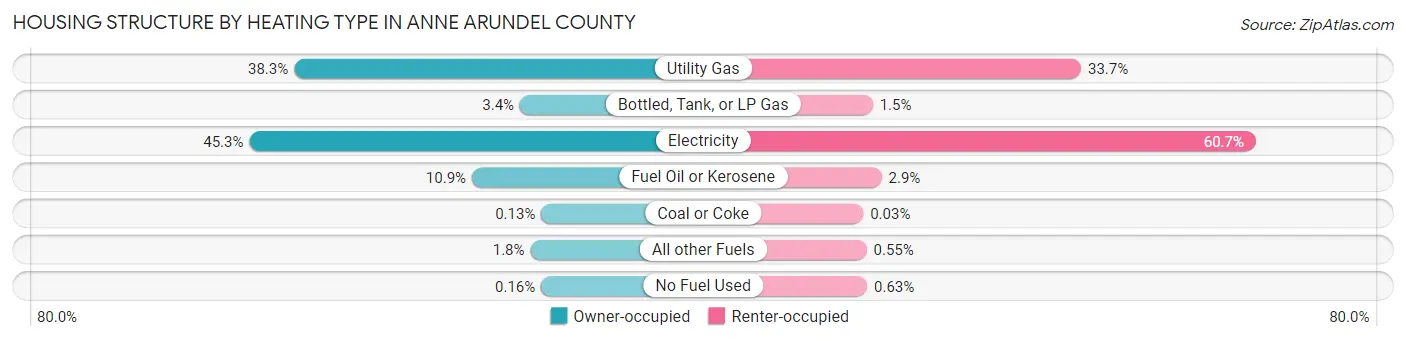
| Heating Type | Owner-occupied | Renter-occupied |
| Utility Gas | 63,791 (38.3%) | 18,649 (33.7%) |
| Bottled, Tank, or LP Gas | 5,705 (3.4%) | 831 (1.5%) |
| Electricity | 75,313 (45.3%) | 33,596 (60.7%) |
| Fuel Oil or Kerosene | 18,050 (10.8%) | 1,587 (2.9%) |
| Coal or Coke | 218 (0.1%) | 19 (0.0%) |
| All other Fuels | 3,017 (1.8%) | 306 (0.5%) |
| No Fuel Used | 273 (0.2%) | 349 (0.6%) |
| Total | 166,367 (100.0%) | 55,337 (100.0%) |
Household Vehicle Usage in Anne Arundel County
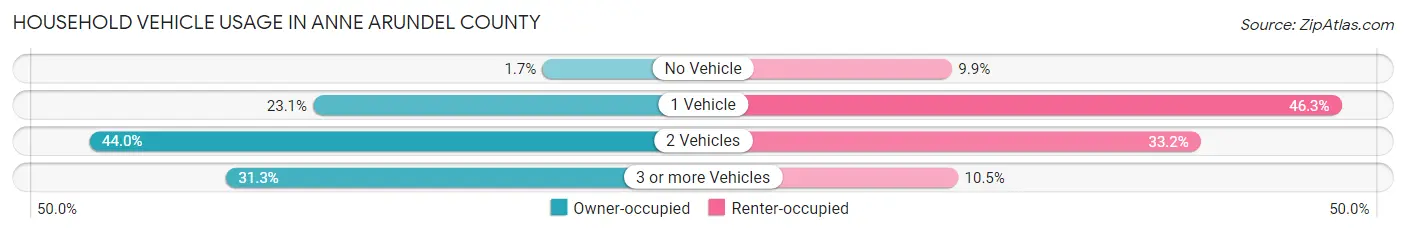
| Vehicles per Household | Owner-occupied | Renter-occupied |
| No Vehicle | 2,826 (1.7%) | 5,500 (9.9%) |
| 1 Vehicle | 38,411 (23.1%) | 25,644 (46.3%) |
| 2 Vehicles | 73,146 (44.0%) | 18,369 (33.2%) |
| 3 or more Vehicles | 51,984 (31.2%) | 5,824 (10.5%) |
| Total | 166,367 (100.0%) | 55,337 (100.0%) |
Real Estate & Mortgages in Anne Arundel County
Real Estate and Mortgage Overview in Anne Arundel County
| Characteristic | Without Mortgage | With Mortgage |
| Housing Units | 43,538 | 122,829 |
| Median Property Value | $415,300 | $438,200 |
| Median Household Income | $94,092 | $59,733 |
| Monthly Housing Costs | $687 | $33,452 |
| Real Estate Taxes | $3,543 | $1,786 |
Property Value by Mortgage Status in Anne Arundel County
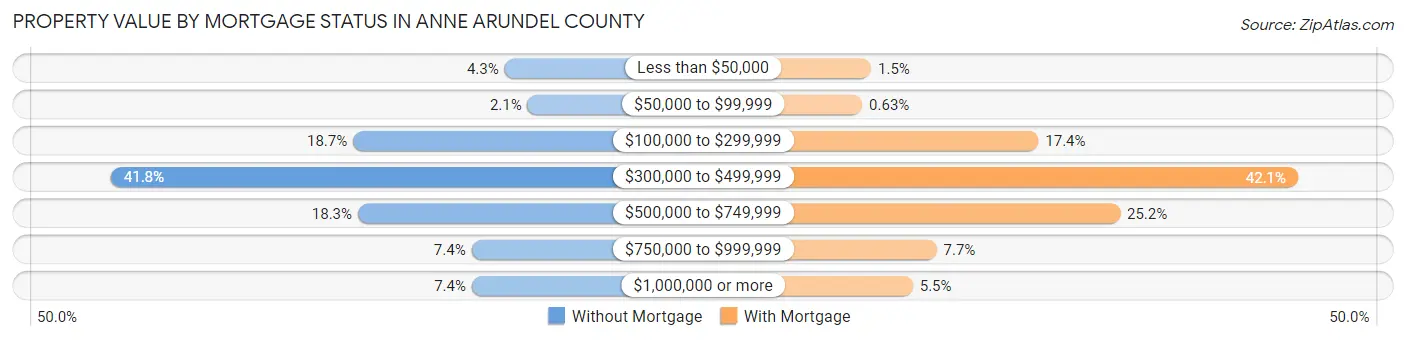
| Property Value | Without Mortgage | With Mortgage |
| Less than $50,000 | 1,866 (4.3%) | 1,813 (1.5%) |
| $50,000 to $99,999 | 915 (2.1%) | 774 (0.6%) |
| $100,000 to $299,999 | 8,152 (18.7%) | 21,379 (17.4%) |
| $300,000 to $499,999 | 18,190 (41.8%) | 51,739 (42.1%) |
| $500,000 to $749,999 | 7,950 (18.3%) | 30,946 (25.2%) |
| $750,000 to $999,999 | 3,240 (7.4%) | 9,479 (7.7%) |
| $1,000,000 or more | 3,225 (7.4%) | 6,699 (5.4%) |
| Total | 43,538 (100.0%) | 122,829 (100.0%) |
Household Income by Mortgage Status in Anne Arundel County
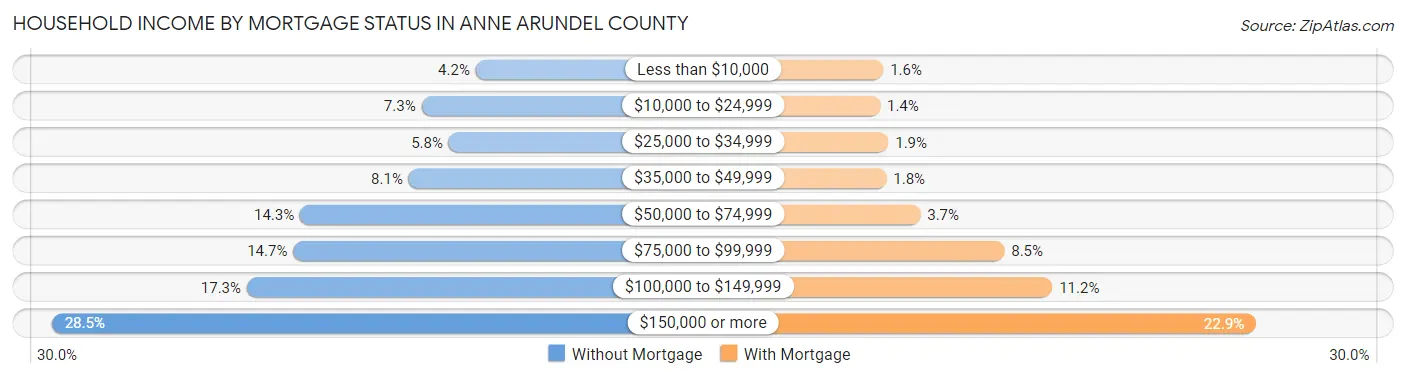
| Household Income | Without Mortgage | With Mortgage |
| Less than $10,000 | 1,837 (4.2%) | 1,935 (1.6%) |
| $10,000 to $24,999 | 3,185 (7.3%) | 1,720 (1.4%) |
| $25,000 to $34,999 | 2,509 (5.8%) | 2,302 (1.9%) |
| $35,000 to $49,999 | 3,503 (8.1%) | 2,165 (1.8%) |
| $50,000 to $74,999 | 6,208 (14.3%) | 4,544 (3.7%) |
| $75,000 to $99,999 | 6,378 (14.6%) | 10,443 (8.5%) |
| $100,000 to $149,999 | 7,532 (17.3%) | 13,801 (11.2%) |
| $150,000 or more | 12,386 (28.4%) | 28,121 (22.9%) |
| Total | 43,538 (100.0%) | 122,829 (100.0%) |
Property Value to Household Income Ratio in Anne Arundel County
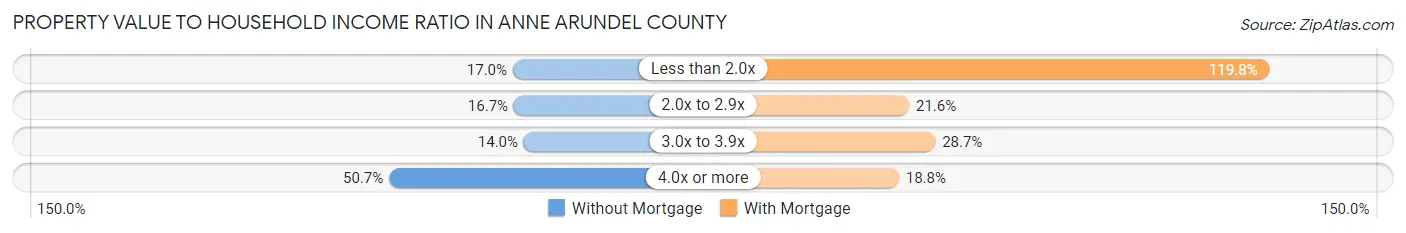
| Value-to-Income Ratio | Without Mortgage | With Mortgage |
| Less than 2.0x | 7,395 (17.0%) | 147,100 (119.8%) |
| 2.0x to 2.9x | 7,277 (16.7%) | 26,481 (21.6%) |
| 3.0x to 3.9x | 6,092 (14.0%) | 35,229 (28.7%) |
| 4.0x or more | 22,072 (50.7%) | 23,025 (18.8%) |
| Total | 43,538 (100.0%) | 122,829 (100.0%) |
Real Estate Taxes by Mortgage Status in Anne Arundel County

| Property Taxes | Without Mortgage | With Mortgage |
| Less than $800 | 1,337 (3.1%) | 484 (0.4%) |
| $800 to $1,499 | 1,601 (3.7%) | 2,080 (1.7%) |
| $800 to $1,499 | 38,045 (87.4%) | 5,437 (4.4%) |
| Total | 43,538 (100.0%) | 122,829 (100.0%) |
Health & Disability in Anne Arundel County
Health Insurance Coverage by Age in Anne Arundel County
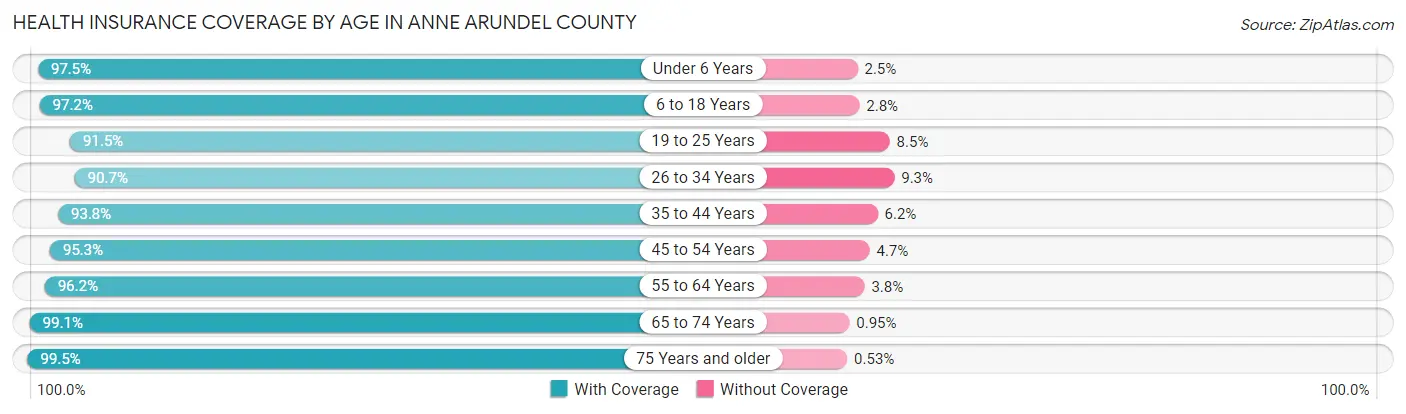
| Age Bracket | With Coverage | Without Coverage |
| Under 6 Years | 41,281 (97.5%) | 1,047 (2.5%) |
| 6 to 18 Years | 93,448 (97.2%) | 2,705 (2.8%) |
| 19 to 25 Years | 39,257 (91.5%) | 3,628 (8.5%) |
| 26 to 34 Years | 62,416 (90.7%) | 6,418 (9.3%) |
| 35 to 44 Years | 72,541 (93.8%) | 4,806 (6.2%) |
| 45 to 54 Years | 71,301 (95.3%) | 3,522 (4.7%) |
| 55 to 64 Years | 75,222 (96.2%) | 2,937 (3.8%) |
| 65 to 74 Years | 52,516 (99.1%) | 503 (0.9%) |
| 75 Years and older | 35,537 (99.5%) | 189 (0.5%) |
| Total | 543,519 (95.5%) | 25,755 (4.5%) |
Health Insurance Coverage by Citizenship Status in Anne Arundel County
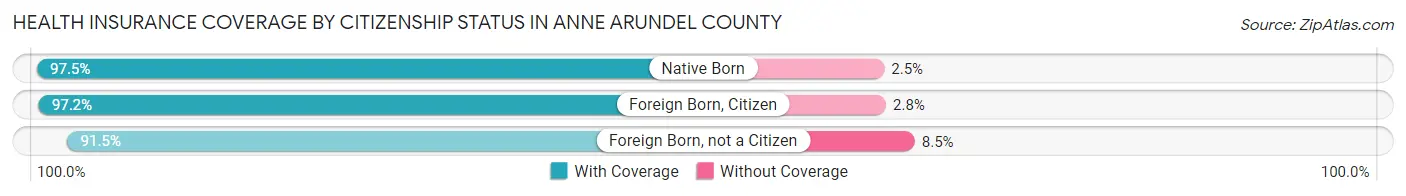
| Citizenship Status | With Coverage | Without Coverage |
| Native Born | 41,281 (97.5%) | 1,047 (2.5%) |
| Foreign Born, Citizen | 93,448 (97.2%) | 2,705 (2.8%) |
| Foreign Born, not a Citizen | 39,257 (91.5%) | 3,628 (8.5%) |
Health Insurance Coverage by Household Income in Anne Arundel County
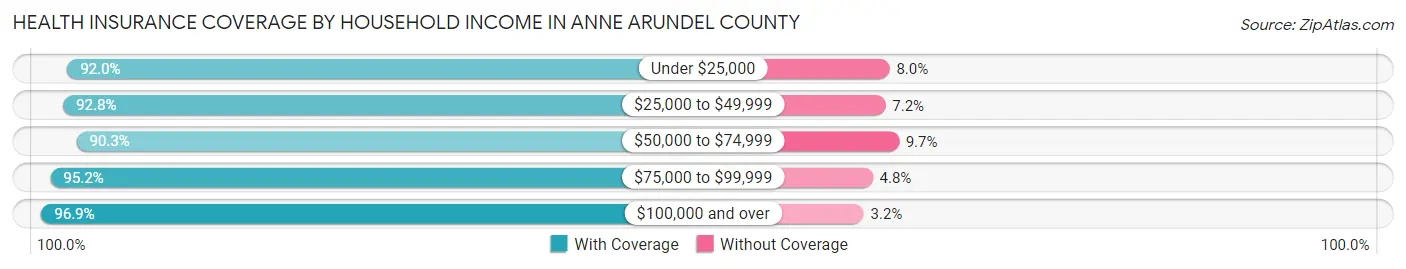
| Household Income | With Coverage | Without Coverage |
| Under $25,000 | 24,828 (92.0%) | 2,155 (8.0%) |
| $25,000 to $49,999 | 38,342 (92.8%) | 2,990 (7.2%) |
| $50,000 to $74,999 | 51,530 (90.3%) | 5,550 (9.7%) |
| $75,000 to $99,999 | 61,783 (95.2%) | 3,139 (4.8%) |
| $100,000 and over | 365,575 (96.9%) | 11,894 (3.2%) |
Public vs Private Health Insurance Coverage by Age in Anne Arundel County
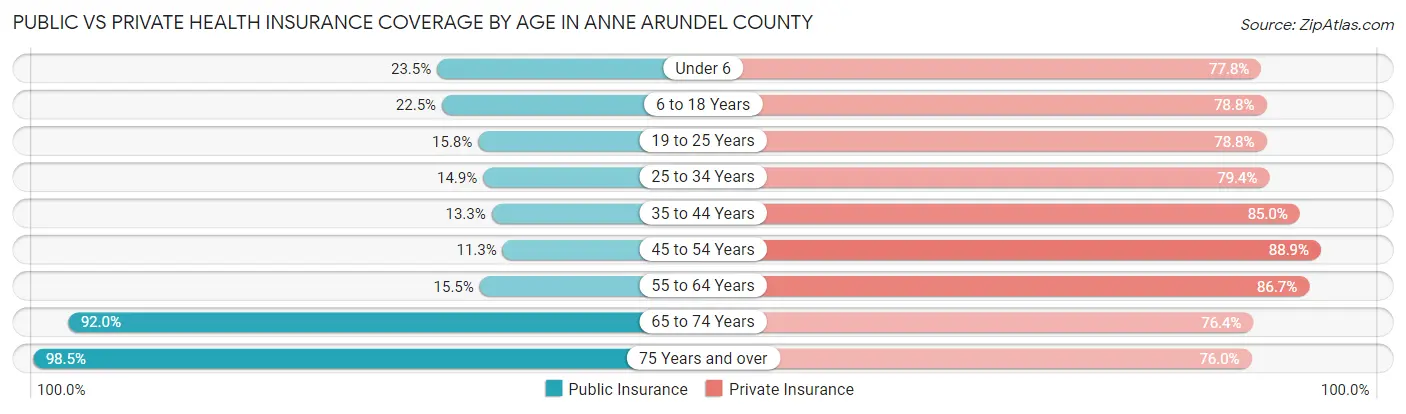
| Age Bracket | Public Insurance | Private Insurance |
| Under 6 | 9,925 (23.4%) | 32,944 (77.8%) |
| 6 to 18 Years | 21,672 (22.5%) | 75,747 (78.8%) |
| 19 to 25 Years | 6,783 (15.8%) | 33,794 (78.8%) |
| 25 to 34 Years | 10,260 (14.9%) | 54,620 (79.3%) |
| 35 to 44 Years | 10,303 (13.3%) | 65,735 (85.0%) |
| 45 to 54 Years | 8,448 (11.3%) | 66,529 (88.9%) |
| 55 to 64 Years | 12,143 (15.5%) | 67,789 (86.7%) |
| 65 to 74 Years | 48,772 (92.0%) | 40,502 (76.4%) |
| 75 Years and over | 35,185 (98.5%) | 27,162 (76.0%) |
| Total | 163,491 (28.7%) | 464,822 (81.7%) |
Disability Status by Sex by Age in Anne Arundel County
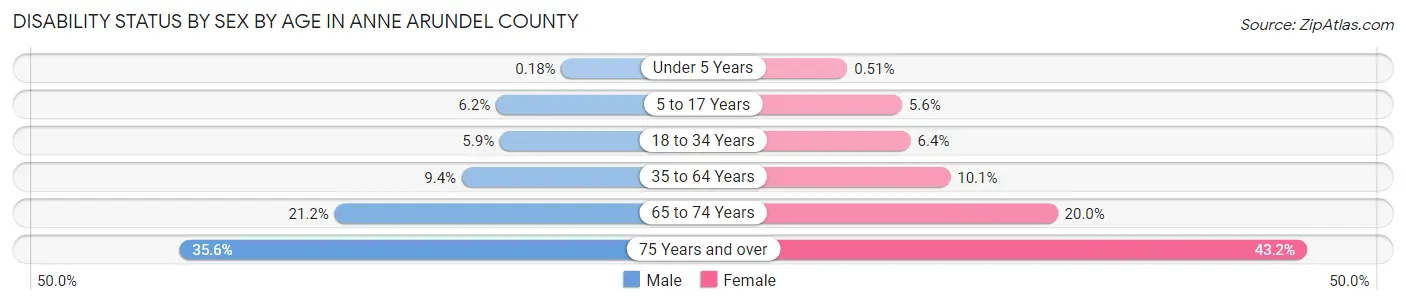
| Age Bracket | Male | Female |
| Under 5 Years | 32 (0.2%) | 88 (0.5%) |
| 5 to 17 Years | 3,064 (6.2%) | 2,629 (5.6%) |
| 18 to 34 Years | 3,433 (5.9%) | 3,853 (6.4%) |
| 35 to 64 Years | 10,532 (9.4%) | 11,924 (10.1%) |
| 65 to 74 Years | 5,248 (21.2%) | 5,669 (20.0%) |
| 75 Years and over | 5,354 (35.6%) | 8,935 (43.2%) |
Disability Class by Sex by Age in Anne Arundel County
Disability Class: Hearing Difficulty
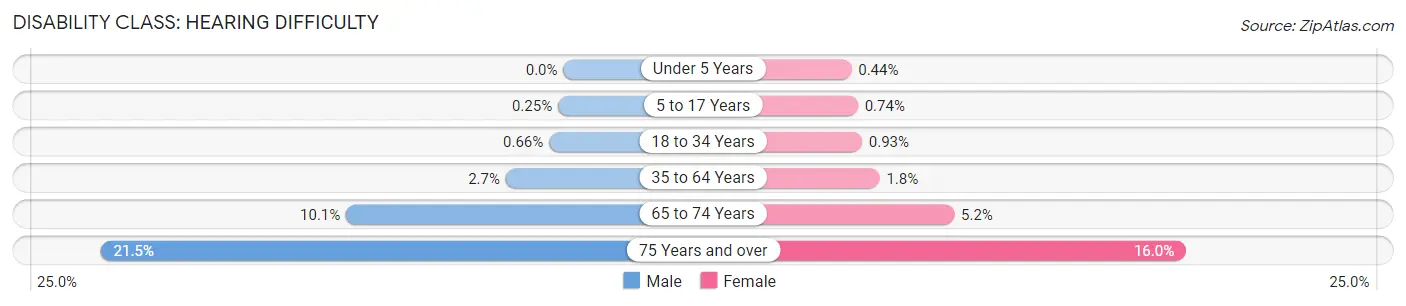
| Age Bracket | Male | Female |
| Under 5 Years | 0 (0.0%) | 77 (0.4%) |
| 5 to 17 Years | 121 (0.3%) | 348 (0.7%) |
| 18 to 34 Years | 385 (0.7%) | 563 (0.9%) |
| 35 to 64 Years | 2,992 (2.7%) | 2,068 (1.8%) |
| 65 to 74 Years | 2,492 (10.1%) | 1,474 (5.2%) |
| 75 Years and over | 3,226 (21.5%) | 3,307 (16.0%) |
Disability Class: Vision Difficulty
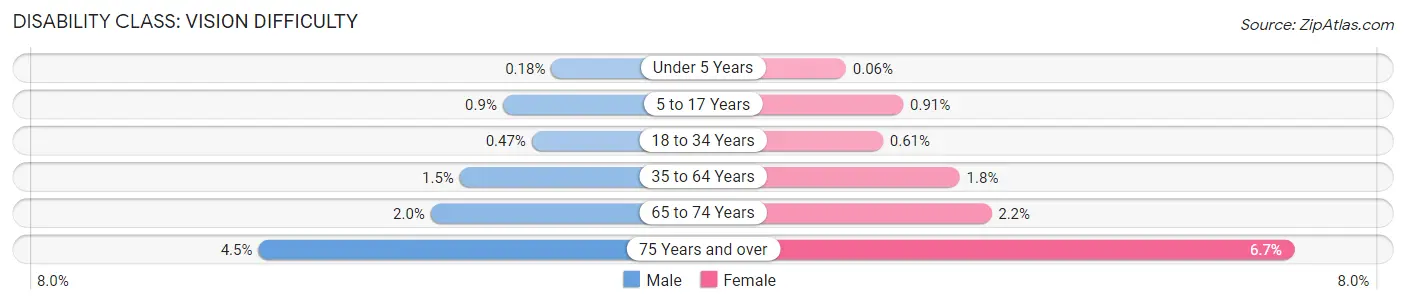
| Age Bracket | Male | Female |
| Under 5 Years | 32 (0.2%) | 11 (0.1%) |
| 5 to 17 Years | 443 (0.9%) | 428 (0.9%) |
| 18 to 34 Years | 274 (0.5%) | 369 (0.6%) |
| 35 to 64 Years | 1,723 (1.5%) | 2,078 (1.8%) |
| 65 to 74 Years | 487 (2.0%) | 627 (2.2%) |
| 75 Years and over | 680 (4.5%) | 1,390 (6.7%) |
Disability Class: Cognitive Difficulty
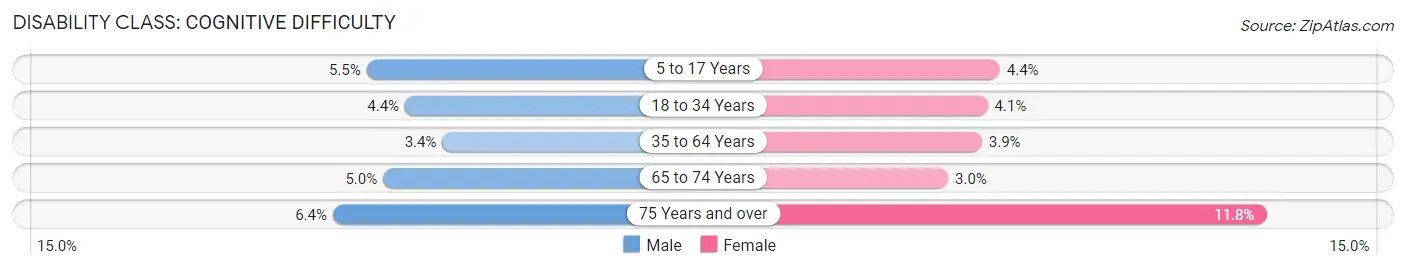
| Age Bracket | Male | Female |
| 5 to 17 Years | 2,691 (5.5%) | 2,074 (4.4%) |
| 18 to 34 Years | 2,574 (4.4%) | 2,448 (4.1%) |
| 35 to 64 Years | 3,767 (3.4%) | 4,616 (3.9%) |
| 65 to 74 Years | 1,240 (5.0%) | 839 (3.0%) |
| 75 Years and over | 964 (6.4%) | 2,448 (11.8%) |
Disability Class: Ambulatory Difficulty
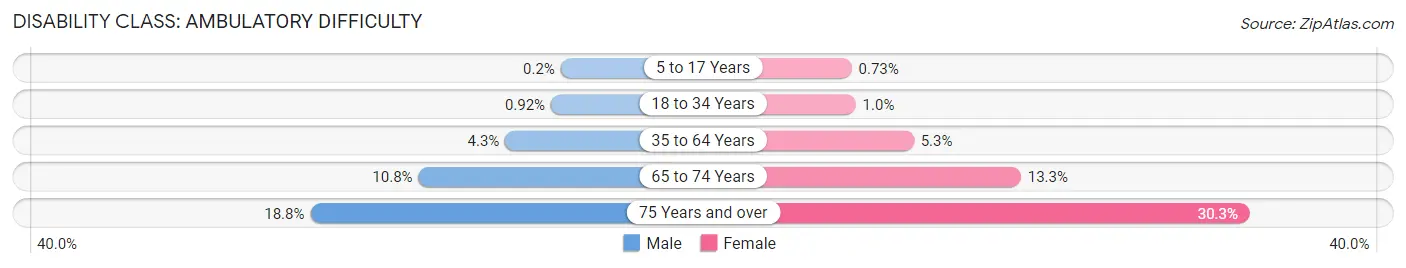
| Age Bracket | Male | Female |
| 5 to 17 Years | 97 (0.2%) | 344 (0.7%) |
| 18 to 34 Years | 539 (0.9%) | 621 (1.0%) |
| 35 to 64 Years | 4,830 (4.3%) | 6,321 (5.3%) |
| 65 to 74 Years | 2,660 (10.8%) | 3,760 (13.3%) |
| 75 Years and over | 2,823 (18.8%) | 6,270 (30.3%) |
Disability Class: Self-Care Difficulty
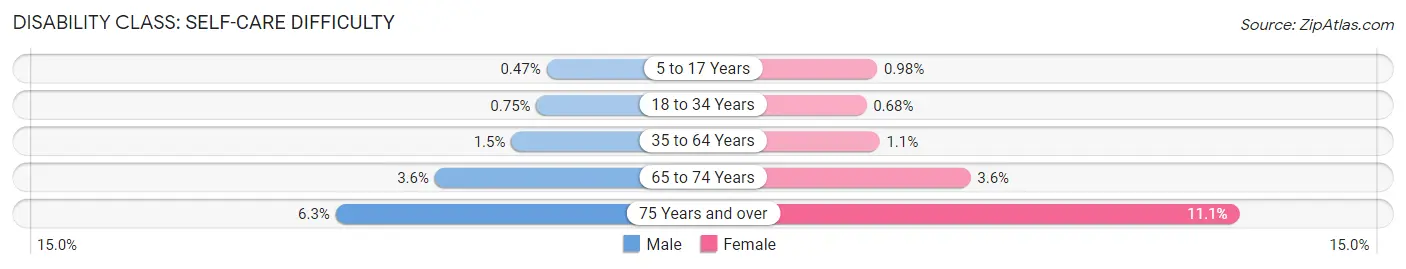
| Age Bracket | Male | Female |
| 5 to 17 Years | 229 (0.5%) | 464 (1.0%) |
| 18 to 34 Years | 436 (0.7%) | 408 (0.7%) |
| 35 to 64 Years | 1,621 (1.5%) | 1,238 (1.1%) |
| 65 to 74 Years | 885 (3.6%) | 1,014 (3.6%) |
| 75 Years and over | 953 (6.3%) | 2,292 (11.1%) |
Technology Access in Anne Arundel County
Computing Device Access in Anne Arundel County
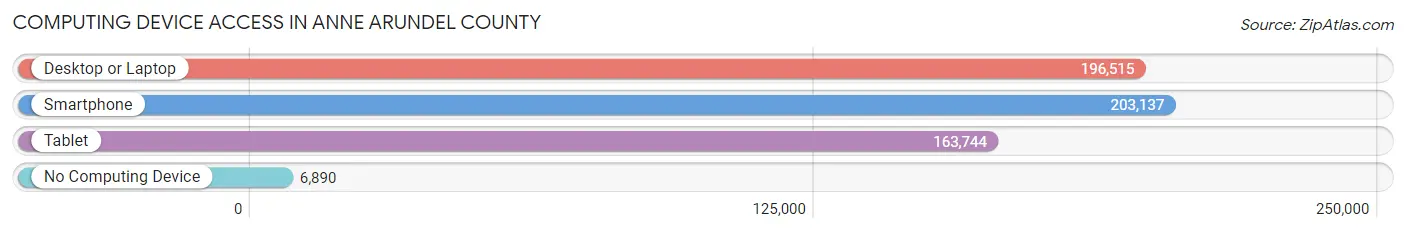
| Device Type | # Households | % Households |
| Desktop or Laptop | 196,515 | 88.6% |
| Smartphone | 203,137 | 91.6% |
| Tablet | 163,744 | 73.9% |
| No Computing Device | 6,890 | 3.1% |
| Total | 221,704 | 100.0% |
Internet Access in Anne Arundel County
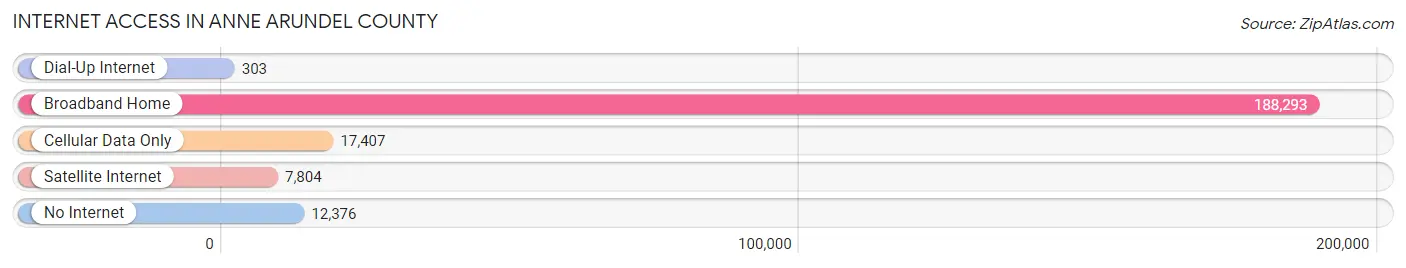
| Internet Type | # Households | % Households |
| Dial-Up Internet | 303 | 0.1% |
| Broadband Home | 188,293 | 84.9% |
| Cellular Data Only | 17,407 | 7.9% |
| Satellite Internet | 7,804 | 3.5% |
| No Internet | 12,376 | 5.6% |
| Total | 221,704 | 100.0% |
Anne Arundel County Summary
Anne Arundel County, Maryland is located in the central part of the state, just south of Baltimore and north of Washington, D.C. It is bordered by the Chesapeake Bay to the east, the Patuxent River to the south, and the Patapsco River to the west. The county is home to a population of approximately 575,000 people, making it the third most populous county in Maryland.
History
Anne Arundel County was established in 1650, making it one of the oldest counties in the United States. It was named after Lady Anne Arundell, the wife of Cecil Calvert, the second Lord Baltimore. The county was originally part of the Province of Maryland, which was established by the English in 1632.
The county was home to a number of prominent historical figures, including George Washington, who served as a surveyor in the county in 1749. The county was also home to the first capital of Maryland, Annapolis, which was established in 1694.
Geography
Anne Arundel County covers an area of 588 square miles, making it the second largest county in Maryland. The county is divided into two distinct regions: the Eastern Shore and the Western Shore. The Eastern Shore is characterized by flat terrain and is home to the Chesapeake Bay, while the Western Shore is more hilly and is home to the Patapsco River.
The county is home to a number of parks and recreational areas, including the Patuxent River State Park, the Chesapeake Bay Environmental Center, and the Anne Arundel County Bird Sanctuary.
Economy
Anne Arundel County is home to a diverse economy, with a number of major employers in the area. The county is home to the U.S. Naval Academy, Fort Meade, and the National Security Agency, all of which are major employers in the area. The county is also home to a number of technology companies, including Northrop Grumman, Lockheed Martin, and Booz Allen Hamilton.
The county is also home to a number of tourist attractions, including the Annapolis Historic District, the U.S. Naval Academy Museum, and the Maryland State House.
Demographics
As of the 2010 census, Anne Arundel County had a population of 537,656 people. The population is racially diverse, with the largest racial group being White (63.3%), followed by African American (20.2%), Hispanic or Latino (7.2%), and Asian (5.2%).
The median household income in the county is $87,811, and the median home value is $346,400. The county has a poverty rate of 8.2%, which is lower than the national average.
Anne Arundel County is a diverse and vibrant community, with a rich history and a strong economy. The county is home to a number of major employers, tourist attractions, and recreational areas, making it an attractive place to live and work.
Common Questions
What is the Total Population of Anne Arundel County?
Total Population of Anne Arundel County is 588,109.
What is the Total Male Population of Anne Arundel County?
Total Male Population of Anne Arundel County is 291,860.
What is the Total Female Population of Anne Arundel County?
Total Female Population of Anne Arundel County is 296,249.
What is the Ratio of Males per 100 Females in Anne Arundel County?
There are 98.52 Males per 100 Females in Anne Arundel County.
What is the Ratio of Females per 100 Males in Anne Arundel County?
There are 101.50 Females per 100 Males in Anne Arundel County.
What is the Median Population Age in Anne Arundel County?
Median Population Age in Anne Arundel County is 38.8 Years.
What is the Average Family Size in Anne Arundel County
Average Family Size in Anne Arundel County is 3.1 People.
What is the Average Household Size in Anne Arundel County
Average Household Size in Anne Arundel County is 2.6 People.
What is Per Capita Income in Anne Arundel County?
Per Capita income in Anne Arundel County is $56,187.
What is the Median Family Income in Anne Arundel County?
Median Family Income in Anne Arundel County is $136,266.
What is the Median Household income in Anne Arundel County?
Median Household Income in Anne Arundel County is $116,009.
What is Income or Wage Gap in Anne Arundel County?
Income or Wage Gap in Anne Arundel County is 26.0%.
Women in Anne Arundel County earn 74.0 cents for every dollar earned by a man.
What is Family Income Deficit in Anne Arundel County?
Family Income Deficit in Anne Arundel County is $12,914.
Families that are below poverty line in Anne Arundel County earn $12,914 less on average than the poverty threshold level.
What is Inequality or Gini Index in Anne Arundel County?
Inequality or Gini Index in Anne Arundel County is 0.42.
How Large is the Labor Force in Anne Arundel County?
There are 324,701 People in the Labor Forcein in Anne Arundel County.
What is the Percentage of People in the Labor Force in Anne Arundel County?
69.0% of People are in the Labor Force in Anne Arundel County.
What is the Unemployment Rate in Anne Arundel County?
Unemployment Rate in Anne Arundel County is 4.2%.