Allegany County, MD
Allegany County Map
Allegany County Overview
68,161
TOTAL POPULATION
35,912
MALE POPULATION
32,249
FEMALE POPULATION
111.36
MALES / 100 FEMALES
89.80
FEMALES / 100 MALES
41.9
MEDIAN AGE
2.9
AVG FAMILY SIZE
2.2
AVG HOUSEHOLD SIZE
$29,343
PER CAPITA INCOME
$71,459
AVG FAMILY INCOME
$55,248
AVG HOUSEHOLD INCOME
28.2%
WAGE / INCOME GAP [ % ]
71.8¢/ $1
WAGE / INCOME GAP [ $ ]
$9,596
FAMILY INCOME DEFICIT
0.45
INEQUALITY / GINI INDEX
28,515
LABOR FORCE [ PEOPLE ]
49.6%
PERCENT IN LABOR FORCE
6.8%
UNEMPLOYMENT RATE
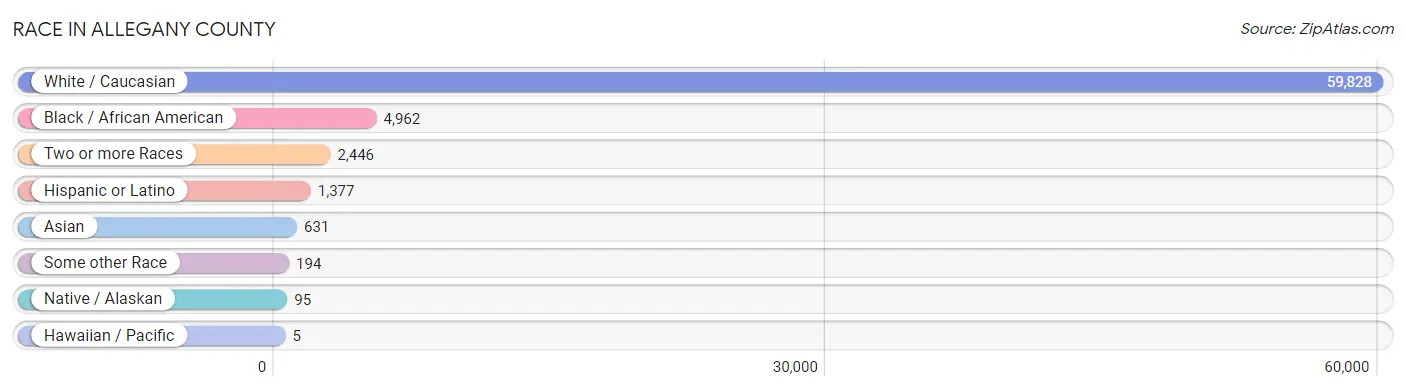
Race in Allegany County
The most populous races in Allegany County are White / Caucasian (59,828 | 87.8%), Black / African American (4,962 | 7.3%), and Two or more Races (2,446 | 3.6%).
| Race | # Population | % Population |
| Asian | 631 | 0.9% |
| Black / African American | 4,962 | 7.3% |
| Hawaiian / Pacific | 5 | 0.0% |
| Hispanic or Latino | 1,377 | 2.0% |
| Native / Alaskan | 95 | 0.1% |
| White / Caucasian | 59,828 | 87.8% |
| Two or more Races | 2,446 | 3.6% |
| Some other Race | 194 | 0.3% |
| Total | 68,161 | 100.0% |
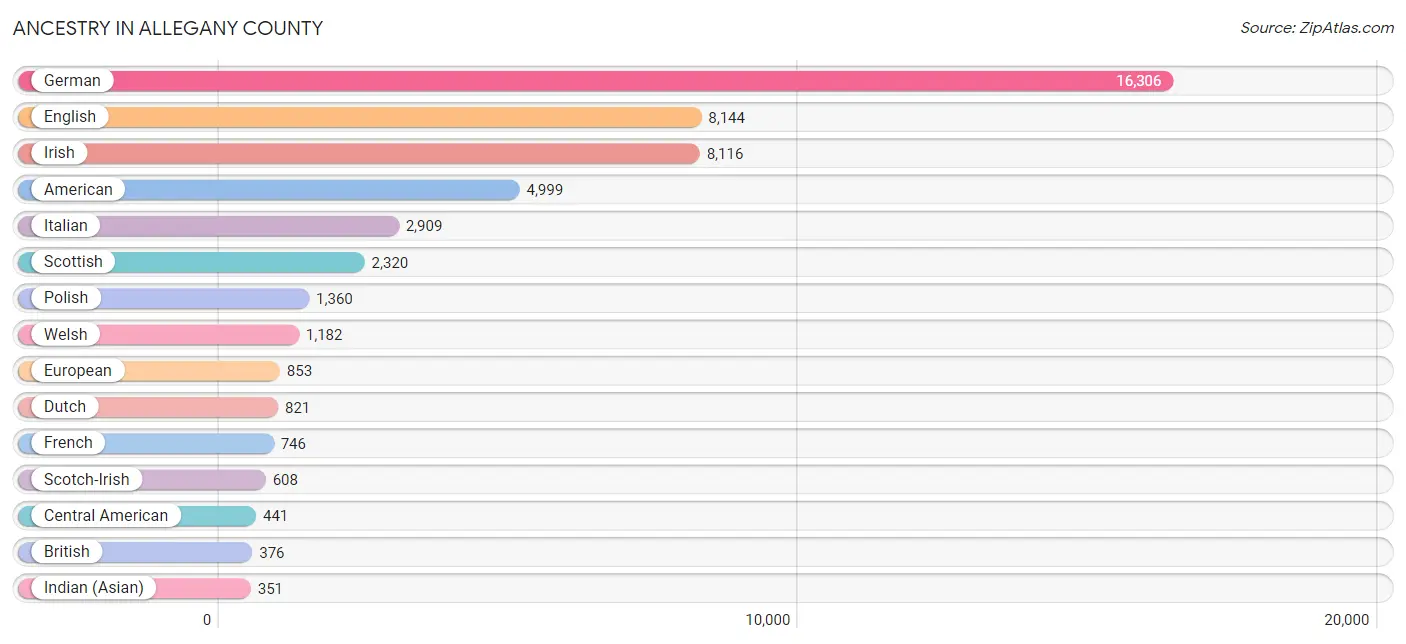
Ancestry in Allegany County
The most populous ancestries reported in Allegany County are German (16,306 | 23.9%), English (8,144 | 11.9%), Irish (8,116 | 11.9%), American (4,999 | 7.3%), and Italian (2,909 | 4.3%), together accounting for 59.4% of all Allegany County residents.
| Ancestry | # Population | % Population |
| African | 109 | 0.2% |
| Albanian | 9 | 0.0% |
| Alsatian | 11 | 0.0% |
| American | 4,999 | 7.3% |
| Arab | 89 | 0.1% |
| Armenian | 6 | 0.0% |
| Austrian | 106 | 0.2% |
| Belgian | 97 | 0.1% |
| Belizean | 1 | 0.0% |
| Bhutanese | 44 | 0.1% |
| Blackfeet | 14 | 0.0% |
| British | 376 | 0.5% |
| Burmese | 64 | 0.1% |
| Canadian | 20 | 0.0% |
| Celtic | 13 | 0.0% |
| Central American | 441 | 0.6% |
| Central American Indian | 38 | 0.1% |
| Cherokee | 164 | 0.2% |
| Chilean | 65 | 0.1% |
| Colombian | 56 | 0.1% |
| Croatian | 14 | 0.0% |
| Crow | 10 | 0.0% |
| Cuban | 19 | 0.0% |
| Czech | 157 | 0.2% |
| Czechoslovakian | 3 | 0.0% |
| Danish | 11 | 0.0% |
| Delaware | 7 | 0.0% |
| Dominican | 1 | 0.0% |
| Dutch | 821 | 1.2% |
| Eastern European | 84 | 0.1% |
| Ecuadorian | 75 | 0.1% |
| Egyptian | 16 | 0.0% |
| English | 8,144 | 11.9% |
| European | 853 | 1.3% |
| Filipino | 17 | 0.0% |
| Finnish | 44 | 0.1% |
| French | 746 | 1.1% |
| French Canadian | 156 | 0.2% |
| German | 16,306 | 23.9% |
| Ghanaian | 8 | 0.0% |
| Greek | 187 | 0.3% |
| Guamanian / Chamorro | 9 | 0.0% |
| Guatemalan | 6 | 0.0% |
| Haitian | 47 | 0.1% |
| Honduran | 93 | 0.1% |
| Hungarian | 244 | 0.4% |
| Indian (Asian) | 351 | 0.5% |
| Iranian | 35 | 0.1% |
| Irish | 8,116 | 11.9% |
| Iroquois | 57 | 0.1% |
| Israeli | 8 | 0.0% |
| Italian | 2,909 | 4.3% |
| Jamaican | 119 | 0.2% |
| Korean | 128 | 0.2% |
| Lebanese | 58 | 0.1% |
| Lithuanian | 38 | 0.1% |
| Lumbee | 17 | 0.0% |
| Mexican | 216 | 0.3% |
| Mexican American Indian | 14 | 0.0% |
| Moroccan | 15 | 0.0% |
| Native Hawaiian | 14 | 0.0% |
| Nigerian | 13 | 0.0% |
| Northern European | 77 | 0.1% |
| Norwegian | 149 | 0.2% |
| Pakistani | 8 | 0.0% |
| Pennsylvania German | 72 | 0.1% |
| Peruvian | 17 | 0.0% |
| Polish | 1,360 | 2.0% |
| Portuguese | 76 | 0.1% |
| Potawatomi | 5 | 0.0% |
| Puerto Rican | 106 | 0.2% |
| Romanian | 23 | 0.0% |
| Russian | 202 | 0.3% |
| Salvadoran | 342 | 0.5% |
| Samoan | 2 | 0.0% |
| Scandinavian | 124 | 0.2% |
| Scotch-Irish | 608 | 0.9% |
| Scottish | 2,320 | 3.4% |
| Serbian | 15 | 0.0% |
| Sioux | 24 | 0.0% |
| Slovak | 121 | 0.2% |
| Slovene | 76 | 0.1% |
| South American | 213 | 0.3% |
| Spaniard | 98 | 0.1% |
| Spanish | 12 | 0.0% |
| Sri Lankan | 152 | 0.2% |
| Subsaharan African | 130 | 0.2% |
| Swedish | 140 | 0.2% |
| Swiss | 293 | 0.4% |
| Thai | 58 | 0.1% |
| Trinidadian and Tobagonian | 6 | 0.0% |
| Turkish | 53 | 0.1% |
| Ukrainian | 68 | 0.1% |
| Welsh | 1,182 | 1.7% |
| West Indian | 90 | 0.1% |
| Yugoslavian | 32 | 0.1% | View All 96 Rows |
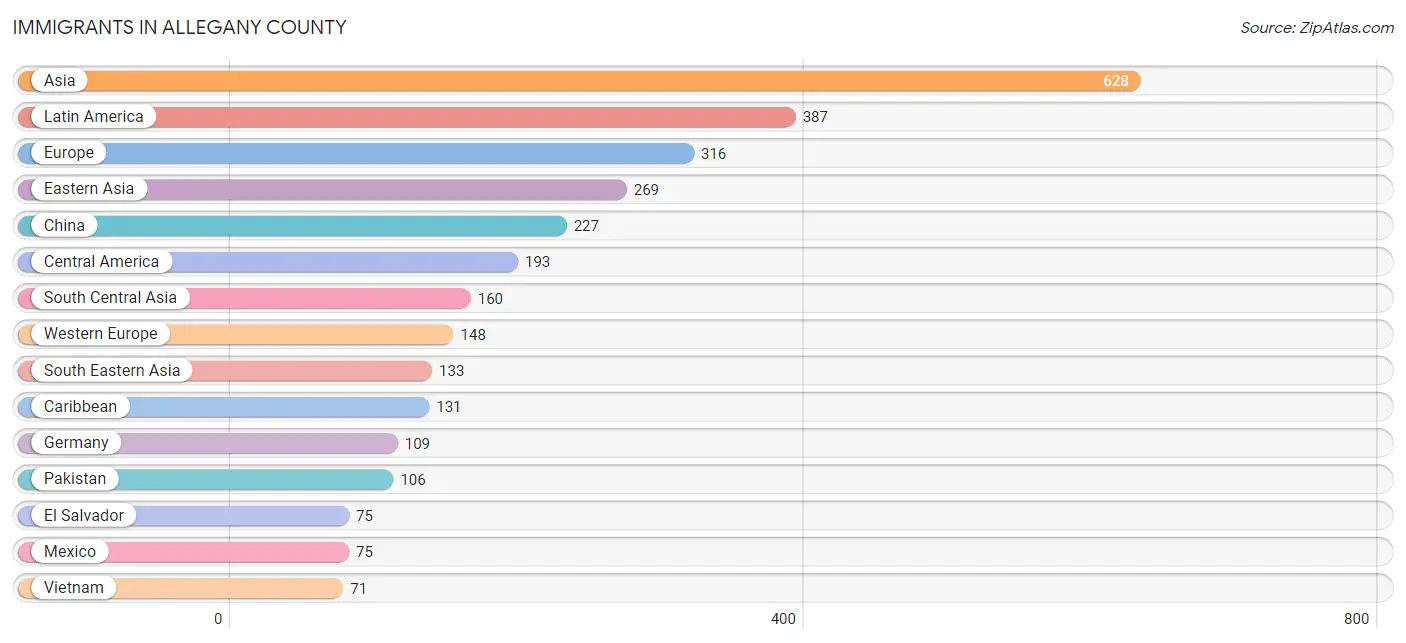
Immigrants in Allegany County
The most numerous immigrant groups reported in Allegany County came from Asia (628 | 0.9%), Latin America (387 | 0.6%), Europe (316 | 0.5%), Eastern Asia (269 | 0.4%), and China (227 | 0.3%), together accounting for 2.7% of all Allegany County residents.
| Immigration Origin | # Population | % Population |
| Africa | 53 | 0.1% |
| Asia | 628 | 0.9% |
| Austria | 7 | 0.0% |
| Belize | 8 | 0.0% |
| Bosnia and Herzegovina | 20 | 0.0% |
| Brazil | 18 | 0.0% |
| Bulgaria | 8 | 0.0% |
| Cambodia | 3 | 0.0% |
| Cameroon | 14 | 0.0% |
| Canada | 8 | 0.0% |
| Caribbean | 131 | 0.2% |
| Central America | 193 | 0.3% |
| China | 227 | 0.3% |
| Congo | 5 | 0.0% |
| Denmark | 6 | 0.0% |
| Dominica | 6 | 0.0% |
| Eastern Asia | 269 | 0.4% |
| Eastern Europe | 66 | 0.1% |
| Ecuador | 14 | 0.0% |
| Egypt | 7 | 0.0% |
| El Salvador | 75 | 0.1% |
| England | 19 | 0.0% |
| Europe | 316 | 0.5% |
| France | 24 | 0.0% |
| Germany | 109 | 0.2% |
| Ghana | 6 | 0.0% |
| Greece | 3 | 0.0% |
| Guatemala | 5 | 0.0% |
| Haiti | 26 | 0.0% |
| Honduras | 30 | 0.0% |
| Hungary | 7 | 0.0% |
| India | 33 | 0.1% |
| Iran | 10 | 0.0% |
| Italy | 40 | 0.1% |
| Jamaica | 62 | 0.1% |
| Korea | 42 | 0.1% |
| Latin America | 387 | 0.6% |
| Lebanon | 13 | 0.0% |
| Liberia | 16 | 0.0% |
| Mexico | 75 | 0.1% |
| Middle Africa | 19 | 0.0% |
| Netherlands | 8 | 0.0% |
| Nigeria | 5 | 0.0% |
| Northern Africa | 7 | 0.0% |
| Northern Europe | 43 | 0.1% |
| Pakistan | 106 | 0.2% |
| Peru | 7 | 0.0% |
| Philippines | 48 | 0.1% |
| Portugal | 15 | 0.0% |
| Russia | 10 | 0.0% |
| Scotland | 5 | 0.0% |
| South America | 63 | 0.1% |
| South Central Asia | 160 | 0.2% |
| South Eastern Asia | 133 | 0.2% |
| Southern Europe | 59 | 0.1% |
| Spain | 1 | 0.0% |
| Taiwan | 5 | 0.0% |
| Thailand | 3 | 0.0% |
| Trinidad and Tobago | 37 | 0.1% |
| Turkey | 53 | 0.1% |
| Ukraine | 21 | 0.0% |
| Uzbekistan | 11 | 0.0% |
| Venezuela | 24 | 0.0% |
| Vietnam | 71 | 0.1% |
| Western Africa | 27 | 0.0% |
| Western Asia | 66 | 0.1% |
| Western Europe | 148 | 0.2% | View All 67 Rows |
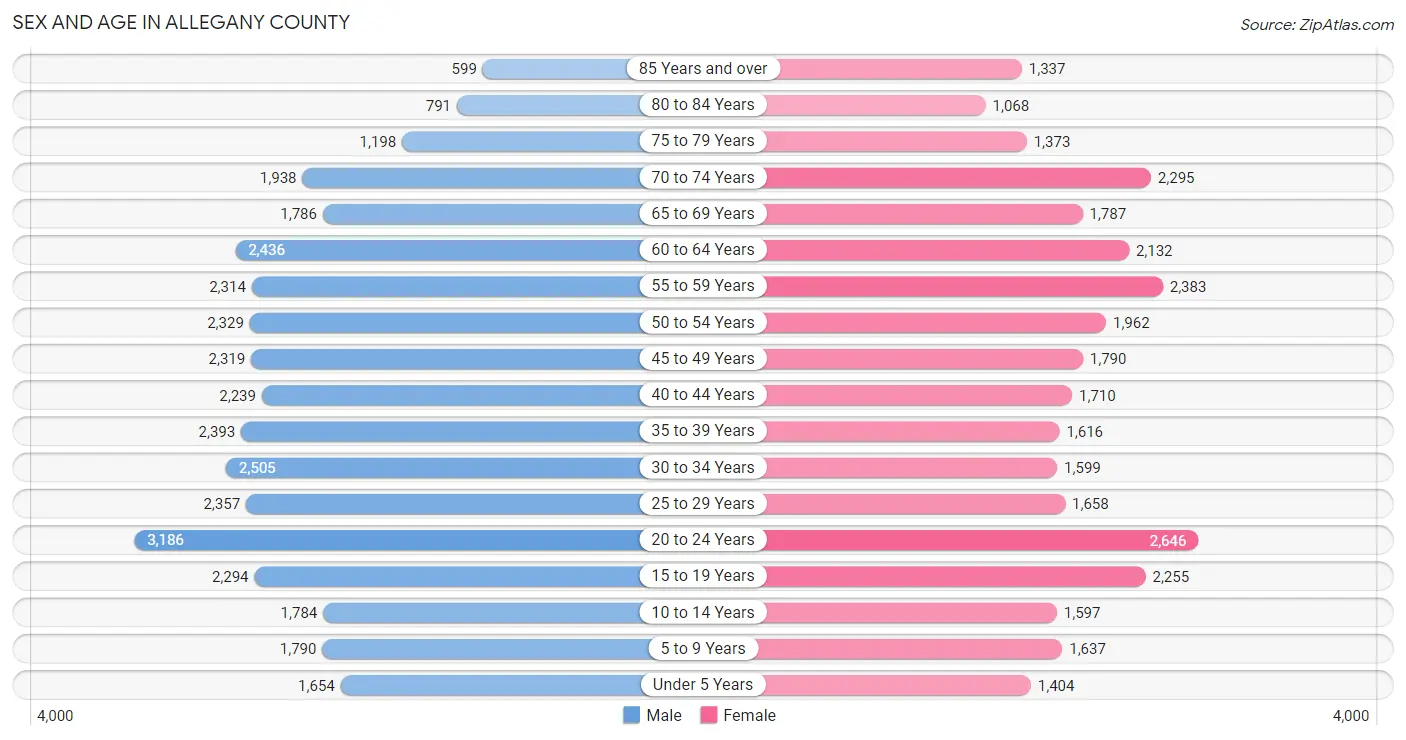
Sex and Age in Allegany County
Sex and Age in Allegany County
The most populous age groups in Allegany County are 20 to 24 Years (3,186 | 8.9%) for men and 20 to 24 Years (2,646 | 8.2%) for women.
| Age Bracket | Male | Female |
| Under 5 Years | 1,654 (4.6%) | 1,404 (4.3%) |
| 5 to 9 Years | 1,790 (5.0%) | 1,637 (5.1%) |
| 10 to 14 Years | 1,784 (5.0%) | 1,597 (5.0%) |
| 15 to 19 Years | 2,294 (6.4%) | 2,255 (7.0%) |
| 20 to 24 Years | 3,186 (8.9%) | 2,646 (8.2%) |
| 25 to 29 Years | 2,357 (6.6%) | 1,658 (5.1%) |
| 30 to 34 Years | 2,505 (7.0%) | 1,599 (5.0%) |
| 35 to 39 Years | 2,393 (6.7%) | 1,616 (5.0%) |
| 40 to 44 Years | 2,239 (6.2%) | 1,710 (5.3%) |
| 45 to 49 Years | 2,319 (6.5%) | 1,790 (5.6%) |
| 50 to 54 Years | 2,329 (6.5%) | 1,962 (6.1%) |
| 55 to 59 Years | 2,314 (6.4%) | 2,383 (7.4%) |
| 60 to 64 Years | 2,436 (6.8%) | 2,132 (6.6%) |
| 65 to 69 Years | 1,786 (5.0%) | 1,787 (5.5%) |
| 70 to 74 Years | 1,938 (5.4%) | 2,295 (7.1%) |
| 75 to 79 Years | 1,198 (3.3%) | 1,373 (4.3%) |
| 80 to 84 Years | 791 (2.2%) | 1,068 (3.3%) |
| 85 Years and over | 599 (1.7%) | 1,337 (4.2%) |
| Total | 35,912 (100.0%) | 32,249 (100.0%) |
Families and Households in Allegany County
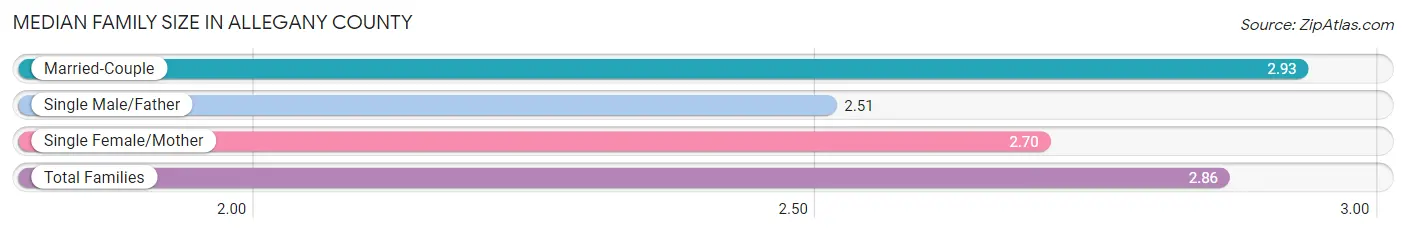
Median Family Size in Allegany County
The median family size in Allegany County is 2.86 persons per family, with married-couple families (11,782 | 74.7%) accounting for the largest median family size of 2.93 persons per family. On the other hand, single male/father families (1,174 | 7.4%) represent the smallest median family size with 2.51 persons per family.
| Family Type | # Families | Family Size |
| Married-Couple | 11,782 (74.7%) | 2.93 |
| Single Male/Father | 1,174 (7.4%) | 2.51 |
| Single Female/Mother | 2,814 (17.8%) | 2.70 |
| Total Families | 15,770 (100.0%) | 2.86 |
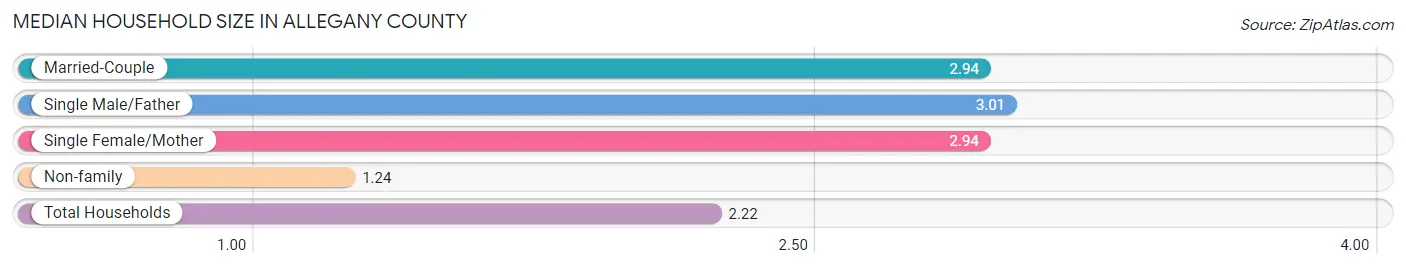
Median Household Size in Allegany County
The median household size in Allegany County is 2.22 persons per household, with single male/father households (1,174 | 4.3%) accounting for the largest median household size of 3.01 persons per household. non-family households (11,692 | 42.6%) represent the smallest median household size with 1.24 persons per household.
| Household Type | # Households | Household Size |
| Married-Couple | 11,782 (42.9%) | 2.94 |
| Single Male/Father | 1,174 (4.3%) | 3.01 |
| Single Female/Mother | 2,814 (10.2%) | 2.94 |
| Non-family | 11,692 (42.6%) | 1.24 |
| Total Households | 27,462 (100.0%) | 2.22 |
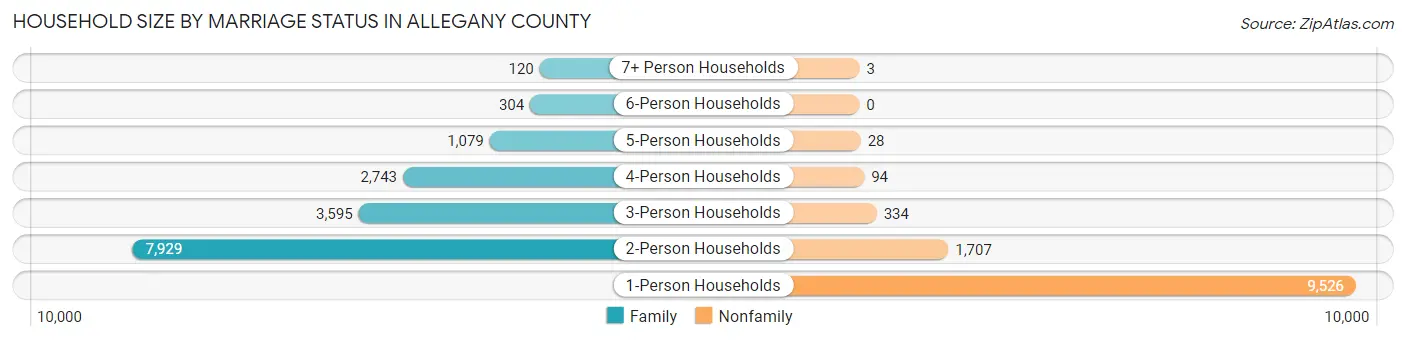
Household Size by Marriage Status in Allegany County
Out of a total of 27,462 households in Allegany County, 15,770 (57.4%) are family households, while 11,692 (42.6%) are nonfamily households. The most numerous type of family households are 2-person households, comprising 7,929, and the most common type of nonfamily households are 1-person households, comprising 9,526.
| Household Size | Family Households | Nonfamily Households |
| 1-Person Households | - | 9,526 (34.7%) |
| 2-Person Households | 7,929 (28.9%) | 1,707 (6.2%) |
| 3-Person Households | 3,595 (13.1%) | 334 (1.2%) |
| 4-Person Households | 2,743 (10.0%) | 94 (0.3%) |
| 5-Person Households | 1,079 (3.9%) | 28 (0.1%) |
| 6-Person Households | 304 (1.1%) | 0 (0.0%) |
| 7+ Person Households | 120 (0.4%) | 3 (0.0%) |
| Total | 15,770 (57.4%) | 11,692 (42.6%) |
Female Fertility in Allegany County
Fertility by Age in Allegany County
Average fertility rate in Allegany County is 55.0 births per 1,000 women. Women in the age bracket of 20 to 34 years have the highest fertility rate with 109.0 births per 1,000 women. Women in the age bracket of 20 to 34 years acount for 86.0% of all women with births.
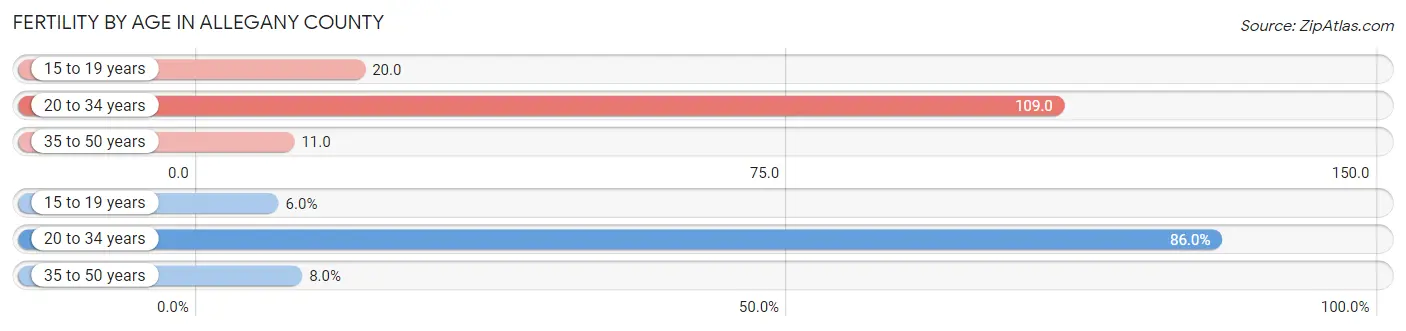
| Age Bracket | Women with Births | Births / 1,000 Women |
| 15 to 19 years | 45 (6.0%) | 20.0 |
| 20 to 34 years | 646 (86.0%) | 109.0 |
| 35 to 50 years | 60 (8.0%) | 11.0 |
| Total | 751 (100.0%) | 55.0 |
Fertility by Age by Marriage Status in Allegany County
58.3% of women with births (751) in Allegany County are married. The highest percentage of unmarried women with births falls into 15 to 19 years age bracket with 82.2% of them unmarried at the time of birth, while the lowest percentage of unmarried women with births belong to 20 to 34 years age bracket with 35.5% of them unmarried.
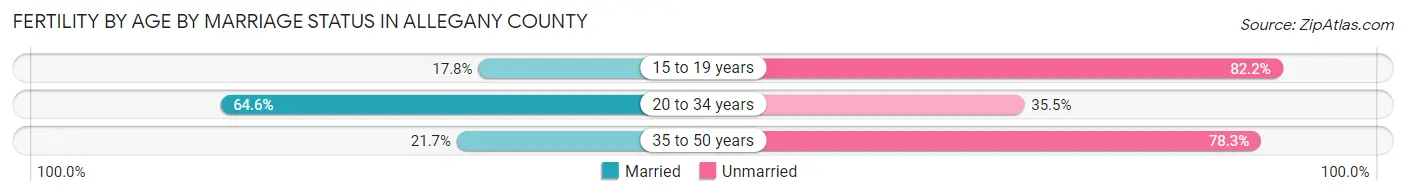
| Age Bracket | Married | Unmarried |
| 15 to 19 years | 8 (17.8%) | 37 (82.2%) |
| 20 to 34 years | 417 (64.5%) | 229 (35.4%) |
| 35 to 50 years | 13 (21.7%) | 47 (78.3%) |
| Total | 438 (58.3%) | 313 (41.7%) |
Fertility by Education in Allegany County
Average fertility rate in Allegany County is 55.0 births per 1,000 women. Women with the education attainment of high school diploma have the highest fertility rate of 94.0 births per 1,000 women, while women with the education attainment of less than high school have the lowest fertility at 12.0 births per 1,000 women. Women with the education attainment of high school diploma represent 48.1% of all women with births.
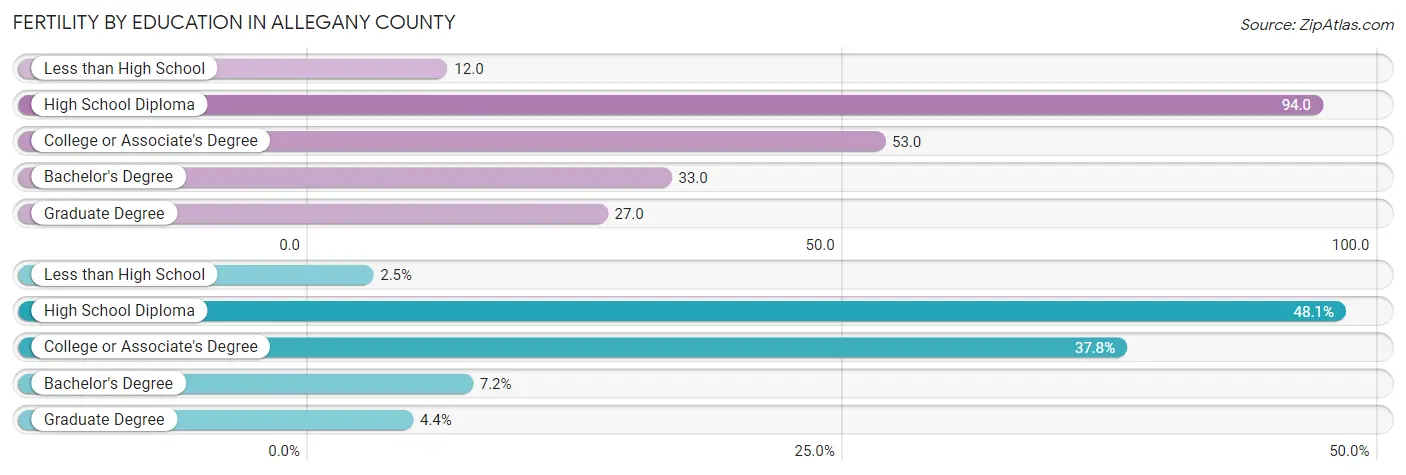
| Educational Attainment | Women with Births | Births / 1,000 Women |
| Less than High School | 19 (2.5%) | 12.0 |
| High School Diploma | 361 (48.1%) | 94.0 |
| College or Associate's Degree | 284 (37.8%) | 53.0 |
| Bachelor's Degree | 54 (7.2%) | 33.0 |
| Graduate Degree | 33 (4.4%) | 27.0 |
| Total | 751 (100.0%) | 55.0 |
Fertility by Education by Marriage Status in Allegany County
41.7% of women with births in Allegany County are unmarried. Women with the educational attainment of graduate degree are most likely to be married with 100.0% of them married at childbirth, while women with the educational attainment of high school diploma are least likely to be married with 53.2% of them unmarried at childbirth.
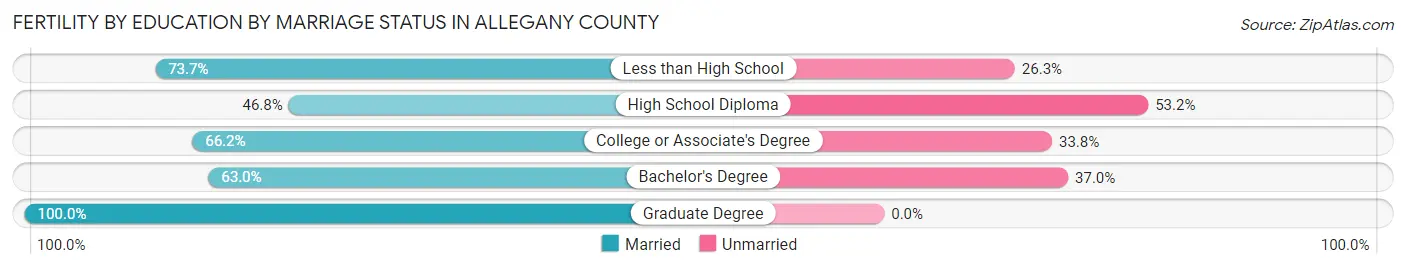
| Educational Attainment | Married | Unmarried |
| Less than High School | 14 (73.7%) | 5 (26.3%) |
| High School Diploma | 169 (46.8%) | 192 (53.2%) |
| College or Associate's Degree | 188 (66.2%) | 96 (33.8%) |
| Bachelor's Degree | 34 (63.0%) | 20 (37.0%) |
| Graduate Degree | 33 (100.0%) | 0 (0.0%) |
| Total | 438 (58.3%) | 313 (41.7%) |
Income in Allegany County
Income Overview in Allegany County
Per Capita Income in Allegany County is $29,343, while median incomes of families and households are $71,459 and $55,248 respectively.
| Characteristic | Number | Measure |
| Per Capita Income | 68,161 | $29,343 |
| Median Family Income | 15,770 | $71,459 |
| Mean Family Income | 15,770 | $87,421 |
| Median Household Income | 27,462 | $55,248 |
| Mean Household Income | 27,462 | $70,741 |
| Income Deficit | 15,770 | $9,596 |
| Wage / Income Gap (%) | 68,161 | 28.24% |
| Wage / Income Gap ($) | 68,161 | 71.76¢ per $1 |
| Gini / Inequality Index | 68,161 | 0.45 |
Earnings by Sex in Allegany County
Average Earnings in Allegany County are $33,816, $41,264 for men and $29,613 for women, a difference of 28.2%.
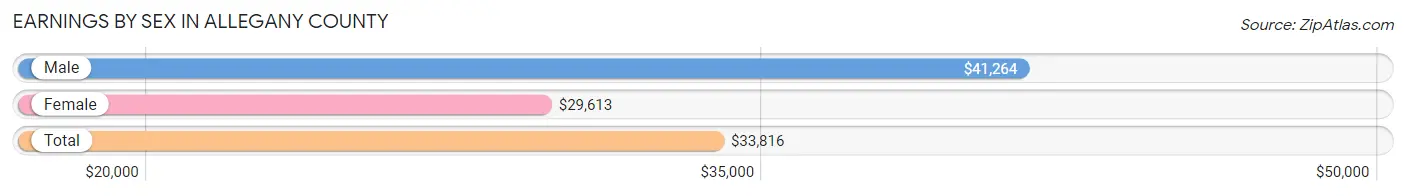
| Sex | Number | Average Earnings |
| Male | 16,651 (53.9%) | $41,264 |
| Female | 14,243 (46.1%) | $29,613 |
| Total | 30,894 (100.0%) | $33,816 |
Earnings by Sex by Income Bracket in Allegany County
The most common earnings brackets in Allegany County are $75,000 to $99,999 for men (1,934 | 11.6%) and $30,000 to $34,999 for women (1,259 | 8.8%).
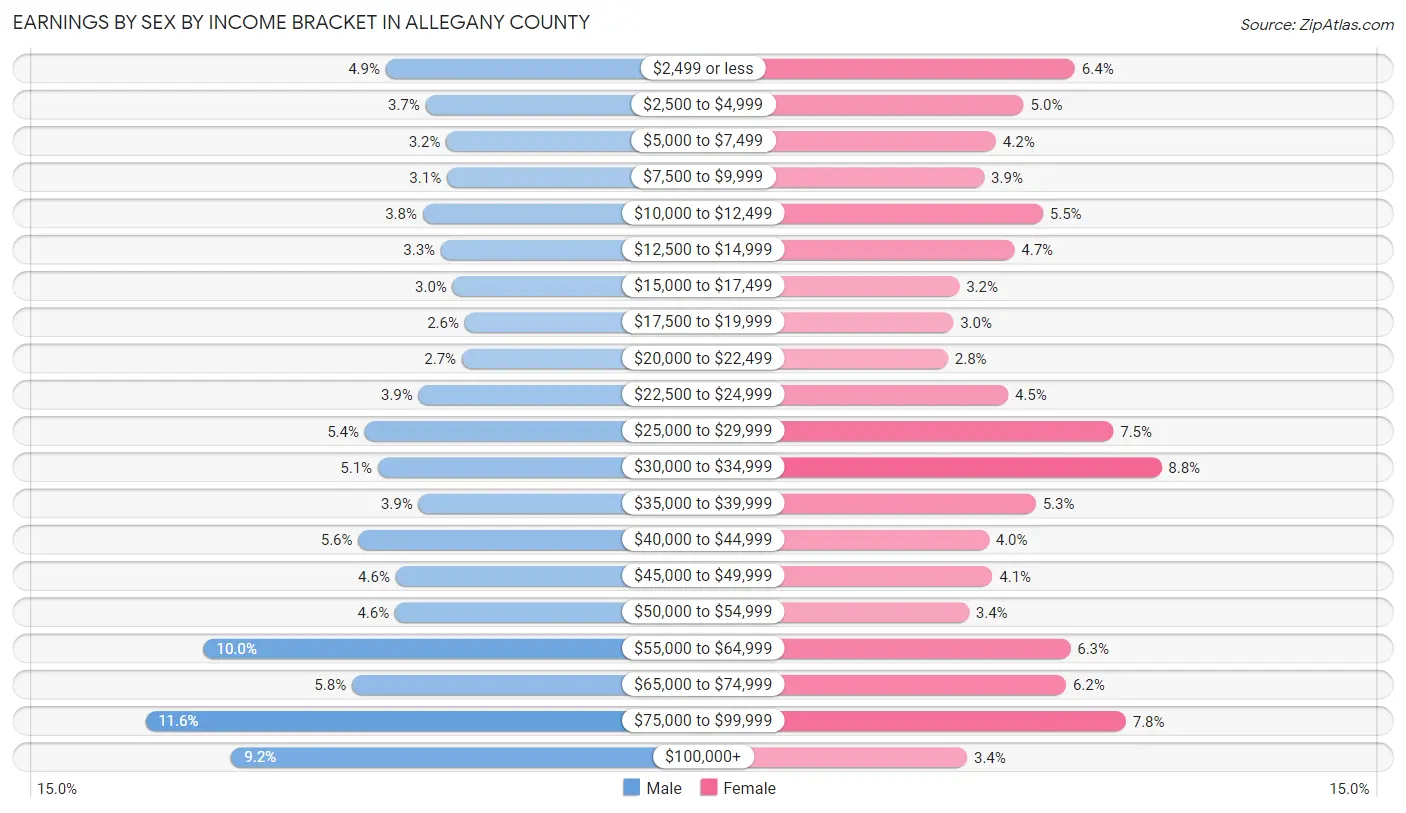
| Income | Male | Female |
| $2,499 or less | 807 (4.9%) | 913 (6.4%) |
| $2,500 to $4,999 | 621 (3.7%) | 708 (5.0%) |
| $5,000 to $7,499 | 525 (3.2%) | 597 (4.2%) |
| $7,500 to $9,999 | 521 (3.1%) | 550 (3.9%) |
| $10,000 to $12,499 | 635 (3.8%) | 785 (5.5%) |
| $12,500 to $14,999 | 549 (3.3%) | 671 (4.7%) |
| $15,000 to $17,499 | 495 (3.0%) | 450 (3.2%) |
| $17,500 to $19,999 | 438 (2.6%) | 426 (3.0%) |
| $20,000 to $22,499 | 451 (2.7%) | 405 (2.8%) |
| $22,500 to $24,999 | 654 (3.9%) | 645 (4.5%) |
| $25,000 to $29,999 | 905 (5.4%) | 1,067 (7.5%) |
| $30,000 to $34,999 | 844 (5.1%) | 1,259 (8.8%) |
| $35,000 to $39,999 | 654 (3.9%) | 757 (5.3%) |
| $40,000 to $44,999 | 936 (5.6%) | 569 (4.0%) |
| $45,000 to $49,999 | 761 (4.6%) | 582 (4.1%) |
| $50,000 to $54,999 | 765 (4.6%) | 488 (3.4%) |
| $55,000 to $64,999 | 1,660 (10.0%) | 894 (6.3%) |
| $65,000 to $74,999 | 965 (5.8%) | 878 (6.2%) |
| $75,000 to $99,999 | 1,934 (11.6%) | 1,117 (7.8%) |
| $100,000+ | 1,531 (9.2%) | 482 (3.4%) |
| Total | 16,651 (100.0%) | 14,243 (100.0%) |
Earnings by Sex by Educational Attainment in Allegany County
Average earnings in Allegany County are $48,465 for men and $35,023 for women, a difference of 27.7%. Men with an educational attainment of graduate degree enjoy the highest average annual earnings of $77,969, while those with less than high school education earn the least with $23,750. Women with an educational attainment of graduate degree earn the most with the average annual earnings of $68,464, while those with less than high school education have the smallest earnings of $14,350.
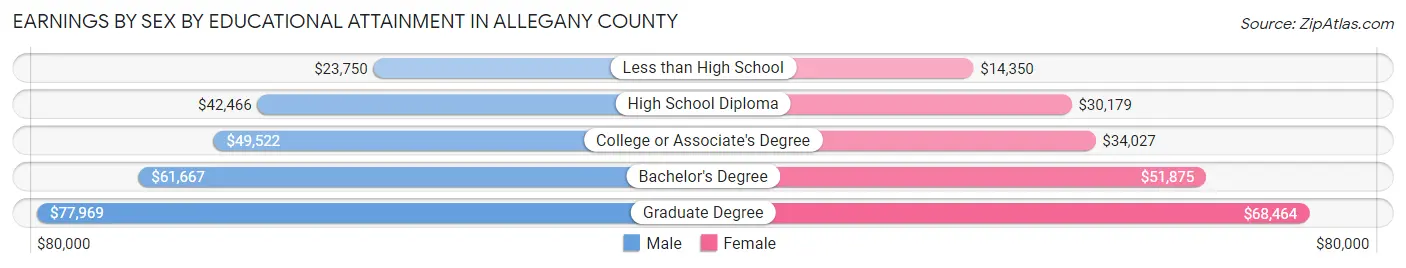
| Educational Attainment | Male Income | Female Income |
| Less than High School | $23,750 | $14,350 |
| High School Diploma | $42,466 | $30,179 |
| College or Associate's Degree | $49,522 | $34,027 |
| Bachelor's Degree | $61,667 | $51,875 |
| Graduate Degree | $77,969 | $68,464 |
| Total | $48,465 | $35,023 |
Family Income in Allegany County
Family Income Brackets in Allegany County
According to the Allegany County family income data, there are 3,280 families falling into the $50,000 to $74,999 income range, which is the most common income bracket and makes up 20.8% of all families. Conversely, the $10,000 to $14,999 income bracket is the least frequent group with only 268 families (1.7%) belonging to this category.
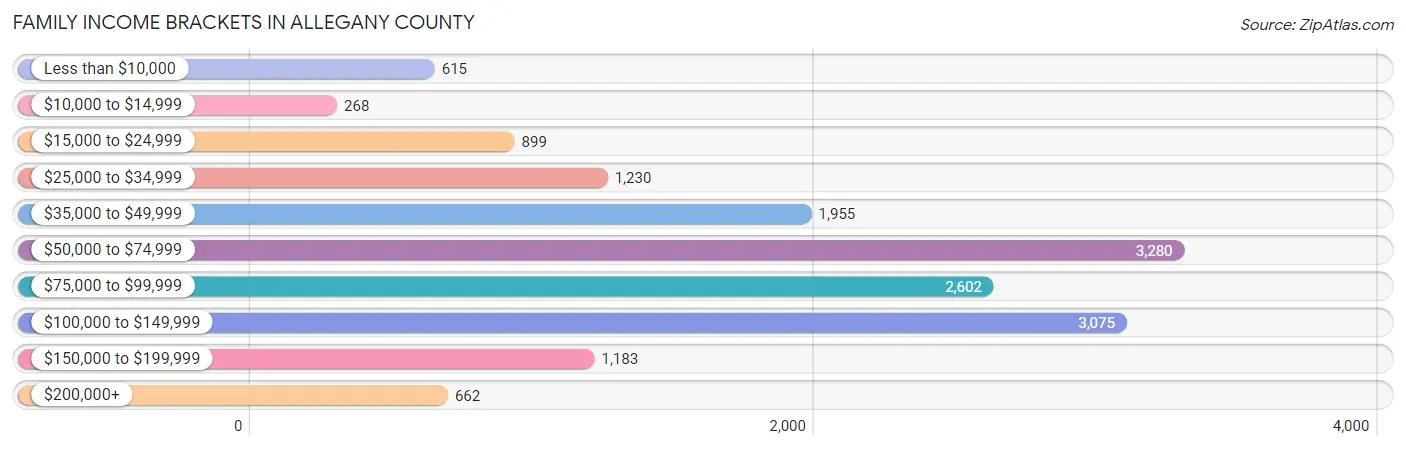
| Income Bracket | # Families | % Families |
| Less than $10,000 | 615 | 3.9% |
| $10,000 to $14,999 | 268 | 1.7% |
| $15,000 to $24,999 | 899 | 5.7% |
| $25,000 to $34,999 | 1,230 | 7.8% |
| $35,000 to $49,999 | 1,955 | 12.4% |
| $50,000 to $74,999 | 3,280 | 20.8% |
| $75,000 to $99,999 | 2,602 | 16.5% |
| $100,000 to $149,999 | 3,075 | 19.5% |
| $150,000 to $199,999 | 1,183 | 7.5% |
| $200,000+ | 662 | 4.2% |
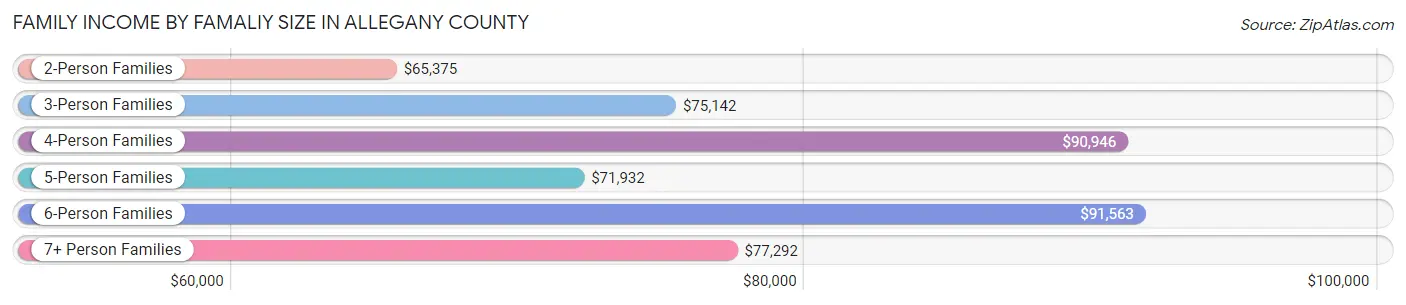
Family Income by Famaliy Size in Allegany County
6-person families (231 | 1.5%) account for the highest median family income in Allegany County with $91,563 per family, while 2-person families (8,502 | 53.9%) have the highest median income of $32,688 per family member.
| Income Bracket | # Families | Median Income |
| 2-Person Families | 8,502 (53.9%) | $65,375 |
| 3-Person Families | 3,417 (21.7%) | $75,142 |
| 4-Person Families | 2,620 (16.6%) | $90,946 |
| 5-Person Families | 921 (5.8%) | $71,932 |
| 6-Person Families | 231 (1.5%) | $91,563 |
| 7+ Person Families | 79 (0.5%) | $77,292 |
| Total | 15,770 (100.0%) | $71,459 |
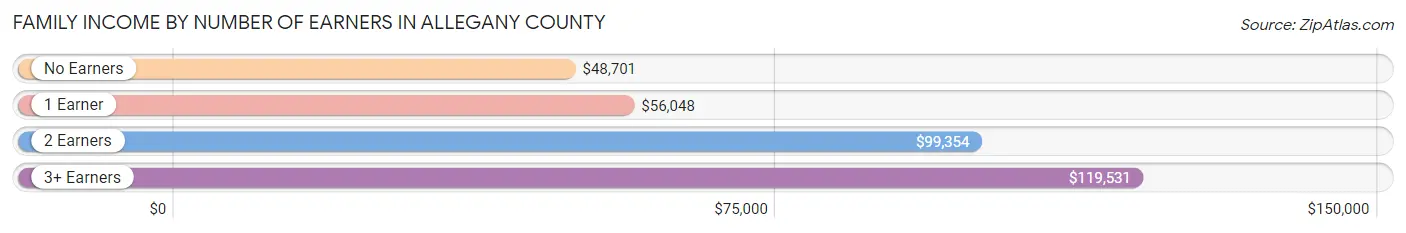
Family Income by Number of Earners in Allegany County
The median family income in Allegany County is $71,459, with families comprising 3+ earners (1,288) having the highest median family income of $119,531, while families with no earners (3,395) have the lowest median family income of $48,701, accounting for 8.2% and 21.5% of families, respectively.
| Number of Earners | # Families | Median Income |
| No Earners | 3,395 (21.5%) | $48,701 |
| 1 Earner | 5,601 (35.5%) | $56,048 |
| 2 Earners | 5,486 (34.8%) | $99,354 |
| 3+ Earners | 1,288 (8.2%) | $119,531 |
| Total | 15,770 (100.0%) | $71,459 |
Household Income in Allegany County
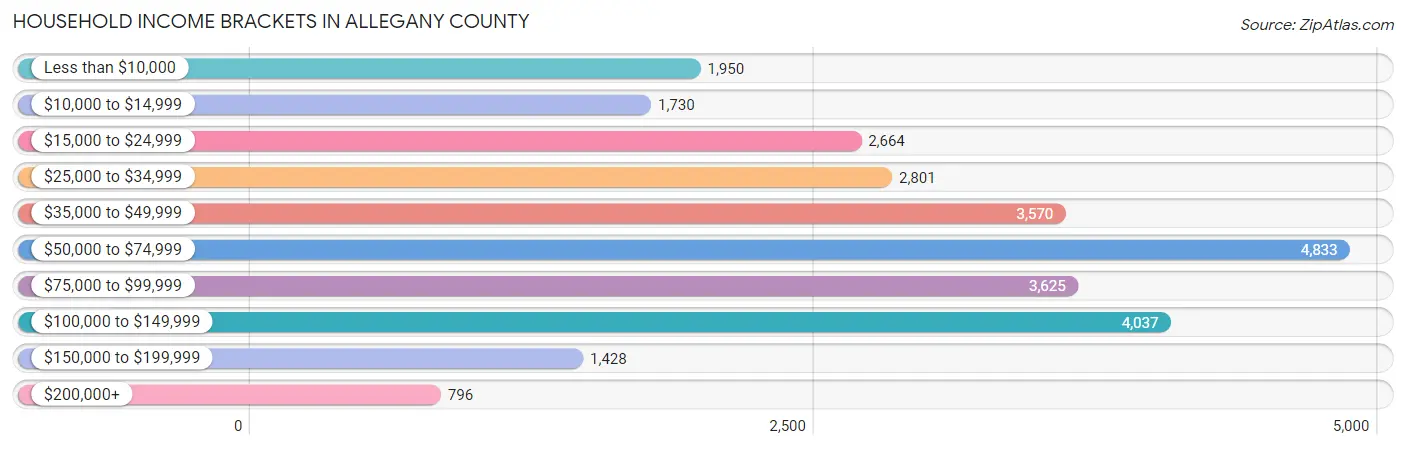
Household Income Brackets in Allegany County
With 4,833 households falling in the category, the $50,000 to $74,999 income range is the most frequent in Allegany County, accounting for 17.6% of all households. In contrast, only 796 households (2.9%) fall into the $200,000+ income bracket, making it the least populous group.
| Income Bracket | # Households | % Households |
| Less than $10,000 | 1,950 | 7.1% |
| $10,000 to $14,999 | 1,730 | 6.3% |
| $15,000 to $24,999 | 2,664 | 9.7% |
| $25,000 to $34,999 | 2,801 | 10.2% |
| $35,000 to $49,999 | 3,570 | 13.0% |
| $50,000 to $74,999 | 4,833 | 17.6% |
| $75,000 to $99,999 | 3,625 | 13.2% |
| $100,000 to $149,999 | 4,037 | 14.7% |
| $150,000 to $199,999 | 1,428 | 5.2% |
| $200,000+ | 796 | 2.9% |
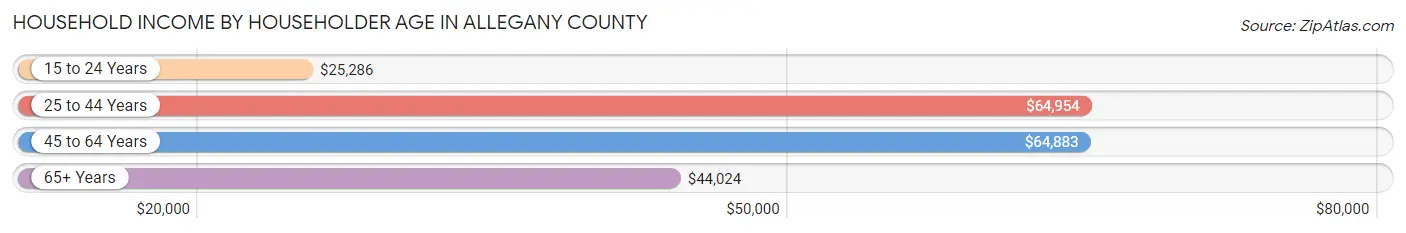
Household Income by Householder Age in Allegany County
The median household income in Allegany County is $55,248, with the highest median household income of $64,954 found in the 25 to 44 years age bracket for the primary householder. A total of 6,947 households (25.3%) fall into this category. Meanwhile, the 15 to 24 years age bracket for the primary householder has the lowest median household income of $25,286, with 1,589 households (5.8%) in this group.
| Income Bracket | # Households | Median Income |
| 15 to 24 Years | 1,589 (5.8%) | $25,286 |
| 25 to 44 Years | 6,947 (25.3%) | $64,954 |
| 45 to 64 Years | 9,698 (35.3%) | $64,883 |
| 65+ Years | 9,228 (33.6%) | $44,024 |
| Total | 27,462 (100.0%) | $55,248 |
Poverty in Allegany County
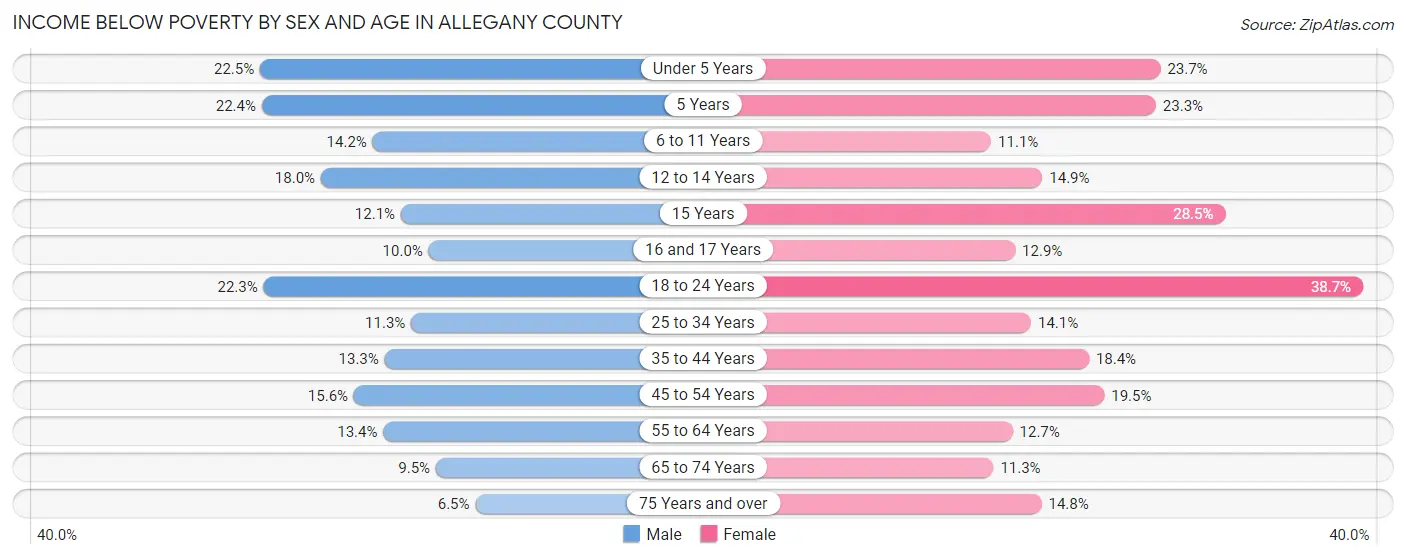
Income Below Poverty by Sex and Age in Allegany County
With 14.0% poverty level for males and 17.7% for females among the residents of Allegany County, under 5 year old males and 18 to 24 year old females are the most vulnerable to poverty, with 367 males (22.5%) and 1,127 females (38.7%) in their respective age groups living below the poverty level.
| Age Bracket | Male | Female |
| Under 5 Years | 367 (22.5%) | 321 (23.7%) |
| 5 Years | 75 (22.4%) | 104 (23.3%) |
| 6 to 11 Years | 318 (14.2%) | 196 (11.1%) |
| 12 to 14 Years | 162 (18.0%) | 140 (14.9%) |
| 15 Years | 31 (12.1%) | 156 (28.5%) |
| 16 and 17 Years | 84 (10.0%) | 61 (12.9%) |
| 18 to 24 Years | 721 (22.3%) | 1,127 (38.7%) |
| 25 to 34 Years | 411 (11.3%) | 453 (14.1%) |
| 35 to 44 Years | 461 (13.3%) | 609 (18.3%) |
| 45 to 54 Years | 590 (15.5%) | 730 (19.5%) |
| 55 to 64 Years | 571 (13.4%) | 568 (12.7%) |
| 65 to 74 Years | 328 (9.5%) | 439 (11.3%) |
| 75 Years and over | 162 (6.5%) | 507 (14.8%) |
| Total | 4,281 (14.0%) | 5,411 (17.7%) |
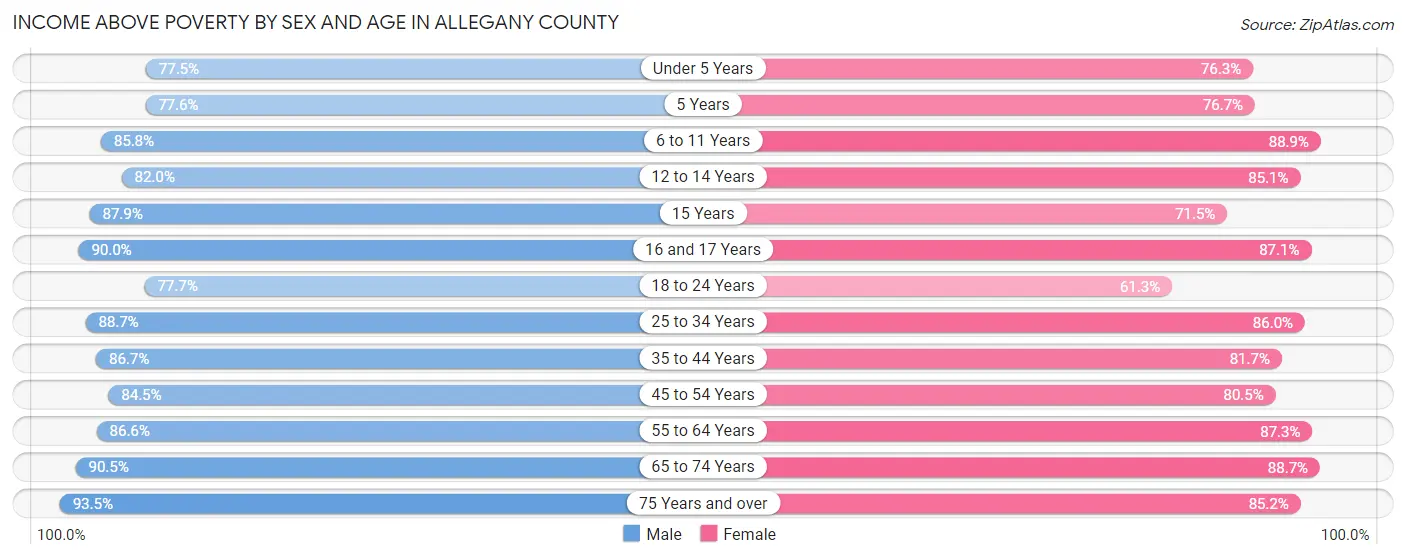
Income Above Poverty by Sex and Age in Allegany County
According to the poverty statistics in Allegany County, males aged 75 years and over and females aged 6 to 11 years are the age groups that are most secure financially, with 93.5% of males and 88.9% of females in these age groups living above the poverty line.
| Age Bracket | Male | Female |
| Under 5 Years | 1,263 (77.5%) | 1,036 (76.3%) |
| 5 Years | 260 (77.6%) | 342 (76.7%) |
| 6 to 11 Years | 1,928 (85.8%) | 1,571 (88.9%) |
| 12 to 14 Years | 738 (82.0%) | 800 (85.1%) |
| 15 Years | 226 (87.9%) | 392 (71.5%) |
| 16 and 17 Years | 756 (90.0%) | 413 (87.1%) |
| 18 to 24 Years | 2,518 (77.7%) | 1,786 (61.3%) |
| 25 to 34 Years | 3,225 (88.7%) | 2,771 (86.0%) |
| 35 to 44 Years | 3,012 (86.7%) | 2,710 (81.7%) |
| 45 to 54 Years | 3,204 (84.5%) | 3,015 (80.5%) |
| 55 to 64 Years | 3,700 (86.6%) | 3,910 (87.3%) |
| 65 to 74 Years | 3,141 (90.5%) | 3,460 (88.7%) |
| 75 Years and over | 2,317 (93.5%) | 2,912 (85.2%) |
| Total | 26,288 (86.0%) | 25,118 (82.3%) |
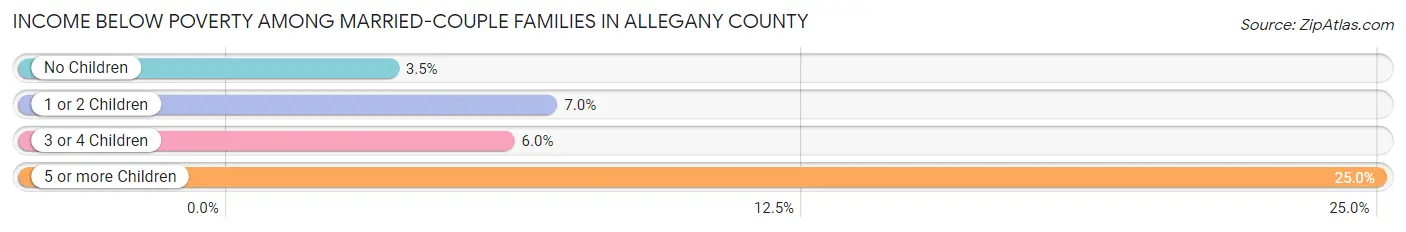
Income Below Poverty Among Married-Couple Families in Allegany County
The poverty statistics for married-couple families in Allegany County show that 4.7% or 551 of the total 11,782 families live below the poverty line. Families with 5 or more children have the highest poverty rate of 25.0%, comprising of 12 families. On the other hand, families with no children have the lowest poverty rate of 3.5%, which includes 274 families.
| Children | Above Poverty | Below Poverty |
| No Children | 7,551 (96.5%) | 274 (3.5%) |
| 1 or 2 Children | 2,973 (93.0%) | 222 (7.0%) |
| 3 or 4 Children | 671 (94.0%) | 43 (6.0%) |
| 5 or more Children | 36 (75.0%) | 12 (25.0%) |
| Total | 11,231 (95.3%) | 551 (4.7%) |
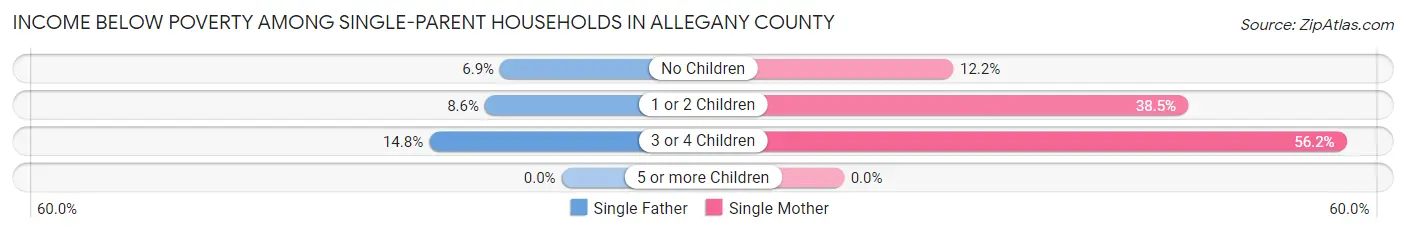
Income Below Poverty Among Single-Parent Households in Allegany County
According to the poverty data in Allegany County, 8.4% or 98 single-father households and 30.8% or 867 single-mother households are living below the poverty line. Among single-father households, those with 3 or 4 children have the highest poverty rate, with 12 households (14.8%) experiencing poverty. Likewise, among single-mother households, those with 3 or 4 children have the highest poverty rate, with 100 households (56.2%) falling below the poverty line.
| Children | Single Father | Single Mother |
| No Children | 28 (6.9%) | 115 (12.2%) |
| 1 or 2 Children | 58 (8.6%) | 652 (38.5%) |
| 3 or 4 Children | 12 (14.8%) | 100 (56.2%) |
| 5 or more Children | 0 (0.0%) | 0 (0.0%) |
| Total | 98 (8.4%) | 867 (30.8%) |
Income Below Poverty Among Married-Couple vs Single-Parent Households in Allegany County
The poverty data for Allegany County shows that 551 of the married-couple family households (4.7%) and 965 of the single-parent households (24.2%) are living below the poverty level. Within the married-couple family households, those with 5 or more children have the highest poverty rate, with 12 households (25.0%) falling below the poverty line. Among the single-parent households, those with 3 or 4 children have the highest poverty rate, with 112 household (43.2%) living below poverty.
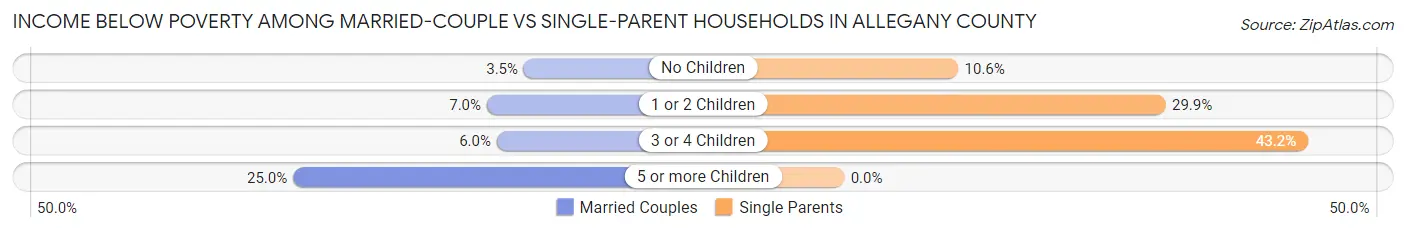
| Children | Married-Couple Families | Single-Parent Households |
| No Children | 274 (3.5%) | 143 (10.6%) |
| 1 or 2 Children | 222 (7.0%) | 710 (29.9%) |
| 3 or 4 Children | 43 (6.0%) | 112 (43.2%) |
| 5 or more Children | 12 (25.0%) | 0 (0.0%) |
| Total | 551 (4.7%) | 965 (24.2%) |
Employment Characteristics in Allegany County
Employment by Class of Employer in Allegany County
Among the 26,115 employed individuals in Allegany County, private company employees (16,040 | 61.4%), not-for-profit organizations (2,536 | 9.7%), and state government employees (2,410 | 9.2%) make up the most common classes of employment.
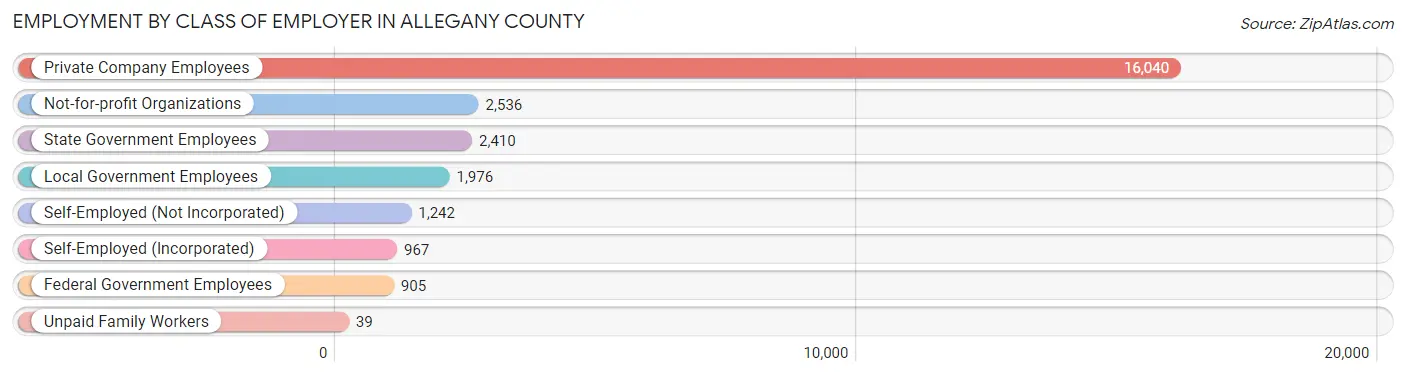
| Employer Class | # Employees | % Employees |
| Private Company Employees | 16,040 | 61.4% |
| Self-Employed (Incorporated) | 967 | 3.7% |
| Self-Employed (Not Incorporated) | 1,242 | 4.8% |
| Not-for-profit Organizations | 2,536 | 9.7% |
| Local Government Employees | 1,976 | 7.6% |
| State Government Employees | 2,410 | 9.2% |
| Federal Government Employees | 905 | 3.5% |
| Unpaid Family Workers | 39 | 0.2% |
| Total | 26,115 | 100.0% |
Employment Status by Age in Allegany County
According to the labor force statistics for Allegany County, out of the total population over 16 years of age (57,489), 49.6% or 28,515 individuals are in the labor force, with 6.8% or 1,939 of them unemployed. The age group with the highest labor force participation rate is 25 to 29 years, with 77.9% or 3,128 individuals in the labor force. Within the labor force, the 16 to 19 years age range has the highest percentage of unemployed individuals, with 24.1% or 365 of them being unemployed.
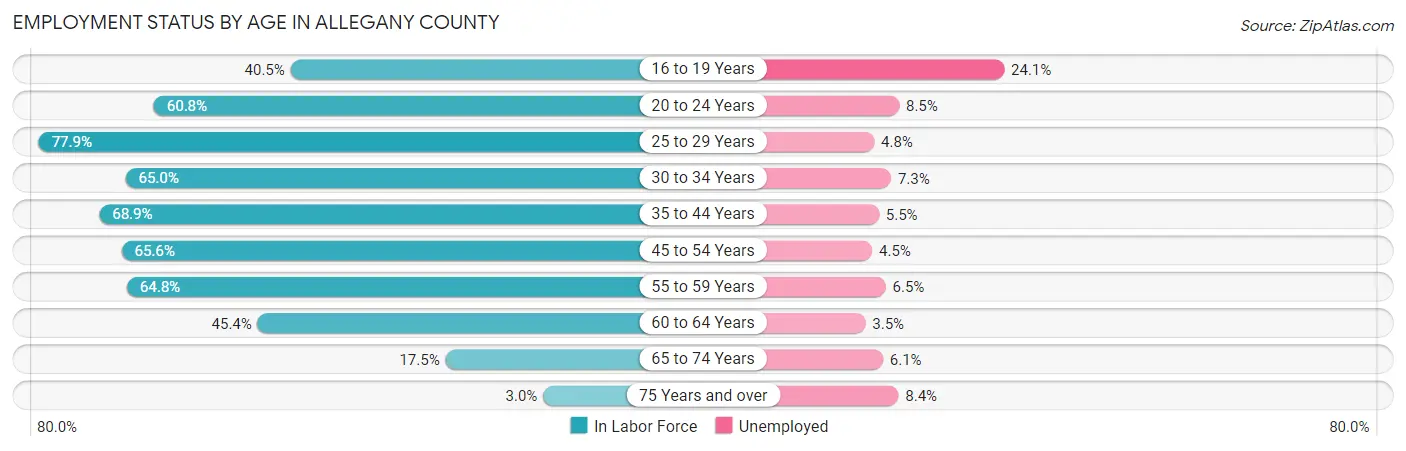
| Age Bracket | In Labor Force | Unemployed |
| 16 to 19 Years | 1,516 (40.5%) | 365 (24.1%) |
| 20 to 24 Years | 3,546 (60.8%) | 301 (8.5%) |
| 25 to 29 Years | 3,128 (77.9%) | 150 (4.8%) |
| 30 to 34 Years | 2,668 (65.0%) | 195 (7.3%) |
| 35 to 44 Years | 5,483 (68.9%) | 302 (5.5%) |
| 45 to 54 Years | 5,510 (65.6%) | 248 (4.5%) |
| 55 to 59 Years | 3,044 (64.8%) | 198 (6.5%) |
| 60 to 64 Years | 2,074 (45.4%) | 73 (3.5%) |
| 65 to 74 Years | 1,366 (17.5%) | 83 (6.1%) |
| 75 Years and over | 191 (3.0%) | 16 (8.4%) |
| Total | 28,515 (49.6%) | 1,939 (6.8%) |
Employment Status by Educational Attainment in Allegany County
According to labor force statistics for Allegany County, 64.9% of individuals (21,899) out of the total population between 25 and 64 years of age (33,742) are in the labor force, with 5.3% or 1,161 of them being unemployed. The group with the highest labor force participation rate are those with the educational attainment of bachelor's degree or higher, with 84.7% or 6,264 individuals in the labor force. Within the labor force, individuals with less than high school education have the highest percentage of unemployment, with 8.6% or 65 of them being unemployed.
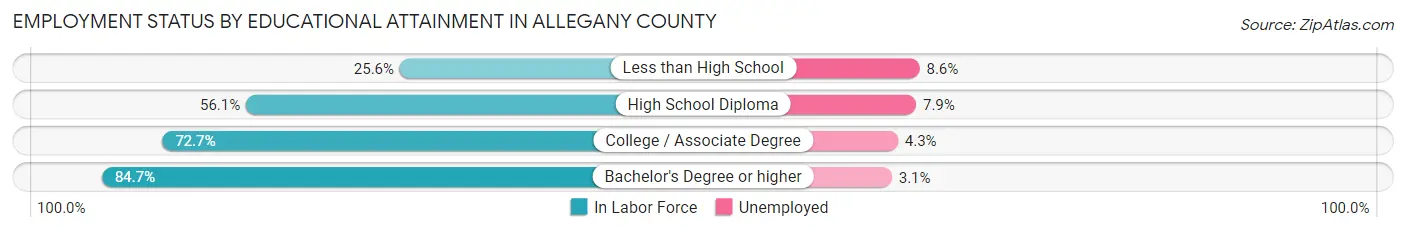
| Educational Attainment | In Labor Force | Unemployed |
| Less than High School | 751 (25.6%) | 252 (8.6%) |
| High School Diploma | 7,264 (56.1%) | 1,023 (7.9%) |
| College / Associate Degree | 7,609 (72.7%) | 450 (4.3%) |
| Bachelor's Degree or higher | 6,264 (84.7%) | 229 (3.1%) |
| Total | 21,899 (64.9%) | 1,788 (5.3%) |
Employment Occupations by Sex in Allegany County
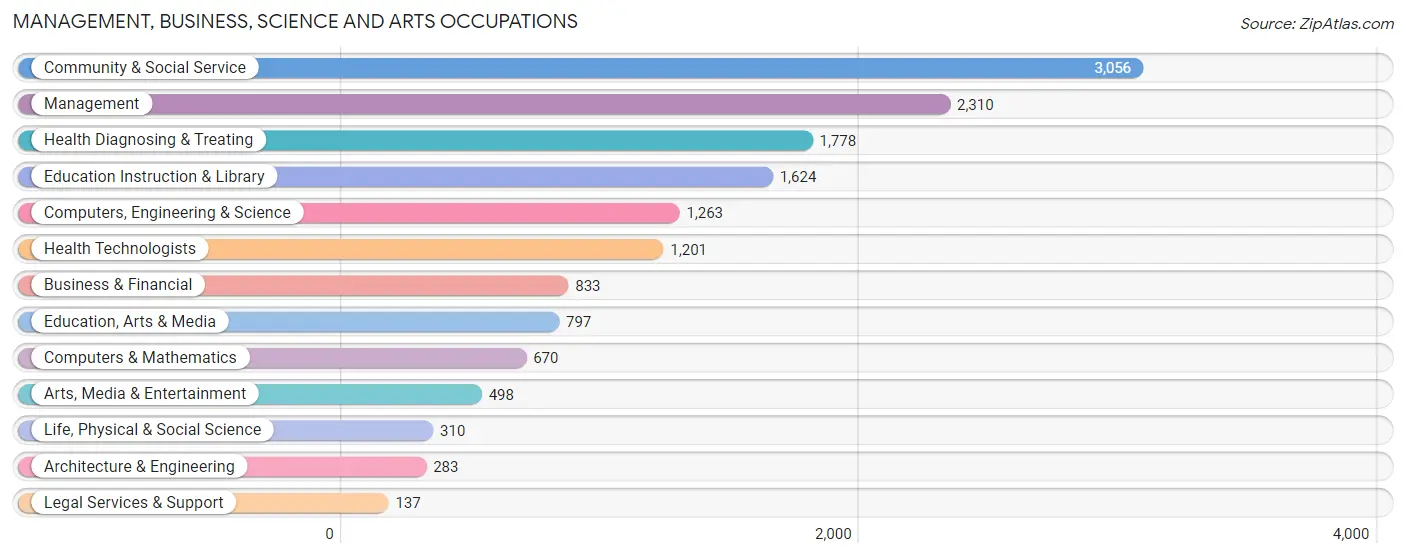
Management, Business, Science and Arts Occupations
The most common Management, Business, Science and Arts occupations in Allegany County are Community & Social Service (3,056 | 11.5%), Management (2,310 | 8.7%), Health Diagnosing & Treating (1,778 | 6.7%), Education Instruction & Library (1,624 | 6.1%), and Computers, Engineering & Science (1,263 | 4.8%).
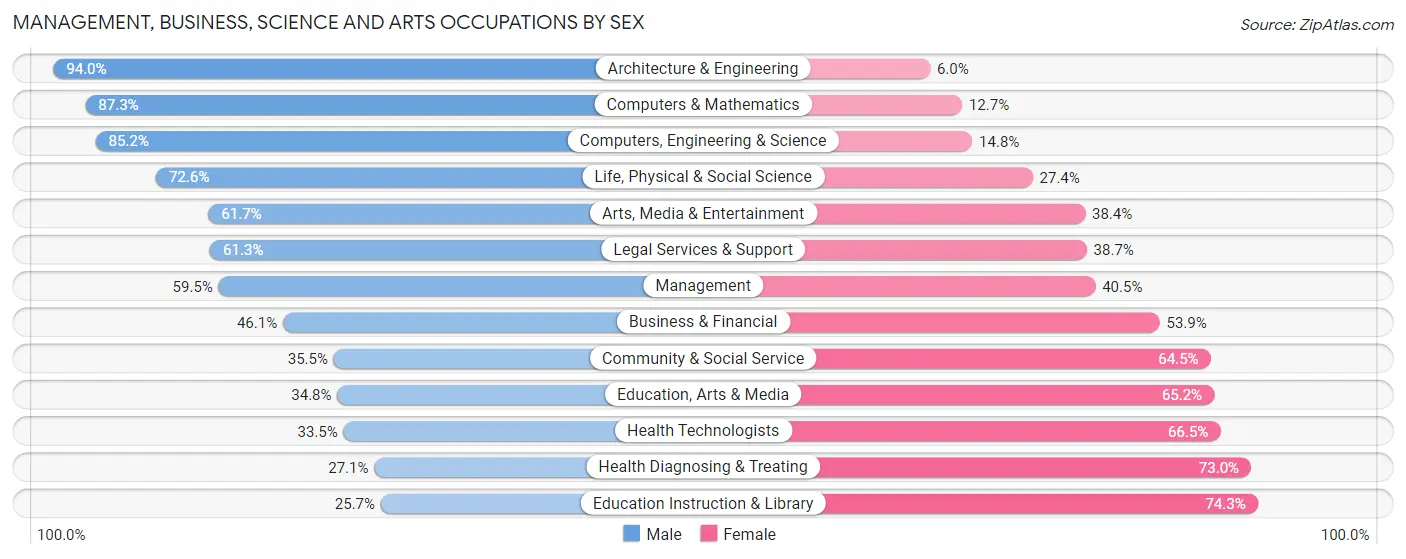
Management, Business, Science and Arts Occupations by Sex
Within the Management, Business, Science and Arts occupations in Allegany County, the most male-oriented occupations are Architecture & Engineering (94.0%), Computers & Mathematics (87.3%), and Computers, Engineering & Science (85.2%), while the most female-oriented occupations are Education Instruction & Library (74.3%), Health Diagnosing & Treating (73.0%), and Health Technologists (66.5%).
| Occupation | Male | Female |
| Management | 1,375 (59.5%) | 935 (40.5%) |
| Business & Financial | 384 (46.1%) | 449 (53.9%) |
| Computers, Engineering & Science | 1,076 (85.2%) | 187 (14.8%) |
| Computers & Mathematics | 585 (87.3%) | 85 (12.7%) |
| Architecture & Engineering | 266 (94.0%) | 17 (6.0%) |
| Life, Physical & Social Science | 225 (72.6%) | 85 (27.4%) |
| Community & Social Service | 1,085 (35.5%) | 1,971 (64.5%) |
| Education, Arts & Media | 277 (34.8%) | 520 (65.2%) |
| Legal Services & Support | 84 (61.3%) | 53 (38.7%) |
| Education Instruction & Library | 417 (25.7%) | 1,207 (74.3%) |
| Arts, Media & Entertainment | 307 (61.7%) | 191 (38.4%) |
| Health Diagnosing & Treating | 481 (27.1%) | 1,297 (73.0%) |
| Health Technologists | 402 (33.5%) | 799 (66.5%) |
| Total (Category) | 4,401 (47.6%) | 4,839 (52.4%) |
| Total (Overall) | 14,383 (54.2%) | 12,169 (45.8%) |
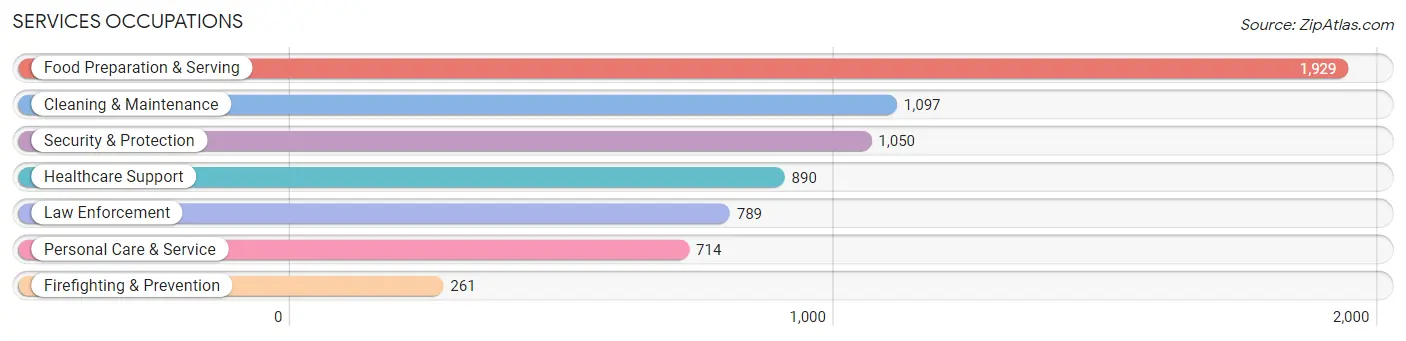
Services Occupations
The most common Services occupations in Allegany County are Food Preparation & Serving (1,929 | 7.3%), Cleaning & Maintenance (1,097 | 4.1%), Security & Protection (1,050 | 4.0%), Healthcare Support (890 | 3.4%), and Law Enforcement (789 | 3.0%).
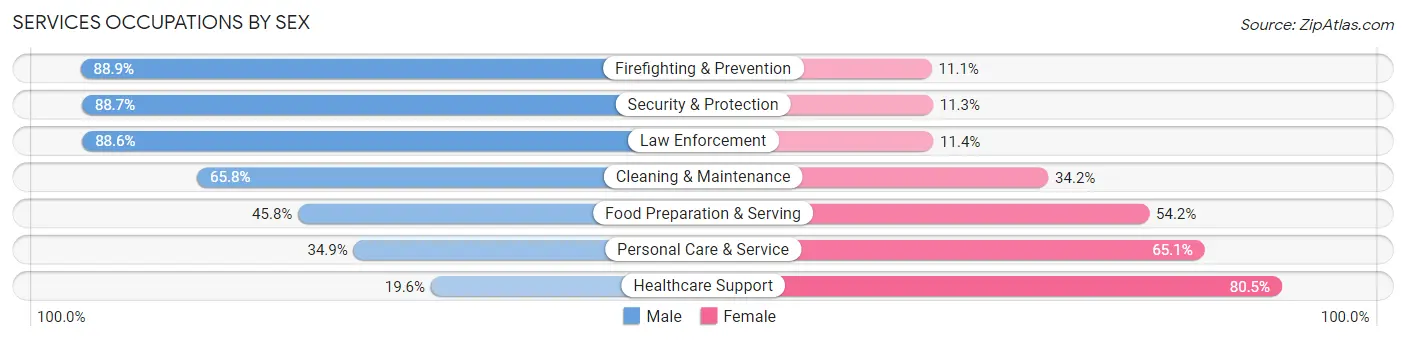
Services Occupations by Sex
Within the Services occupations in Allegany County, the most male-oriented occupations are Firefighting & Prevention (88.9%), Security & Protection (88.7%), and Law Enforcement (88.6%), while the most female-oriented occupations are Healthcare Support (80.4%), Personal Care & Service (65.1%), and Food Preparation & Serving (54.2%).
| Occupation | Male | Female |
| Healthcare Support | 174 (19.6%) | 716 (80.4%) |
| Security & Protection | 931 (88.7%) | 119 (11.3%) |
| Firefighting & Prevention | 232 (88.9%) | 29 (11.1%) |
| Law Enforcement | 699 (88.6%) | 90 (11.4%) |
| Food Preparation & Serving | 884 (45.8%) | 1,045 (54.2%) |
| Cleaning & Maintenance | 722 (65.8%) | 375 (34.2%) |
| Personal Care & Service | 249 (34.9%) | 465 (65.1%) |
| Total (Category) | 2,960 (52.1%) | 2,720 (47.9%) |
| Total (Overall) | 14,383 (54.2%) | 12,169 (45.8%) |
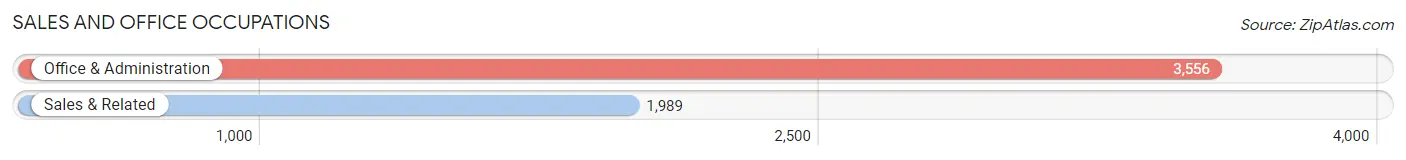
Sales and Office Occupations
The most common Sales and Office occupations in Allegany County are Office & Administration (3,556 | 13.4%), and Sales & Related (1,989 | 7.5%).
Sales and Office Occupations by Sex
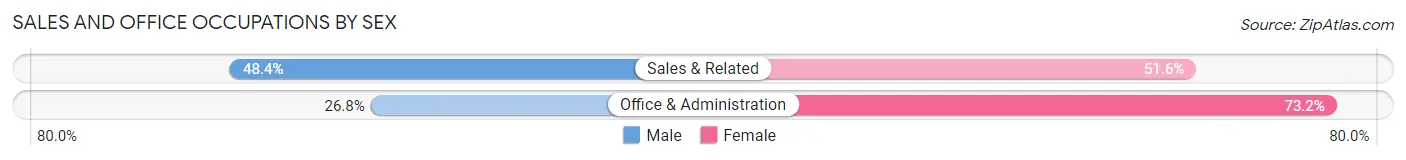
| Occupation | Male | Female |
| Sales & Related | 962 (48.4%) | 1,027 (51.6%) |
| Office & Administration | 952 (26.8%) | 2,604 (73.2%) |
| Total (Category) | 1,914 (34.5%) | 3,631 (65.5%) |
| Total (Overall) | 14,383 (54.2%) | 12,169 (45.8%) |
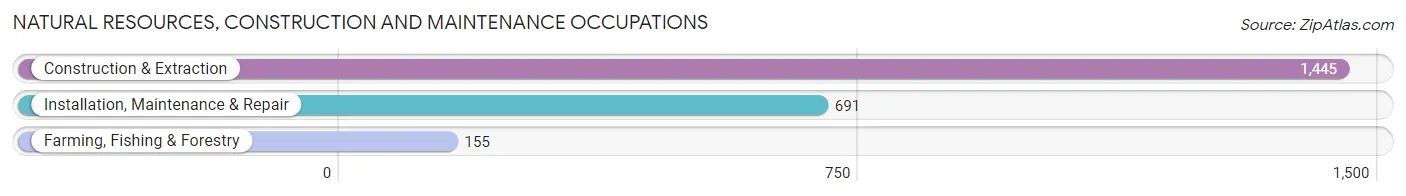
Natural Resources, Construction and Maintenance Occupations
The most common Natural Resources, Construction and Maintenance occupations in Allegany County are Construction & Extraction (1,445 | 5.4%), Installation, Maintenance & Repair (691 | 2.6%), and Farming, Fishing & Forestry (155 | 0.6%).
Natural Resources, Construction and Maintenance Occupations by Sex
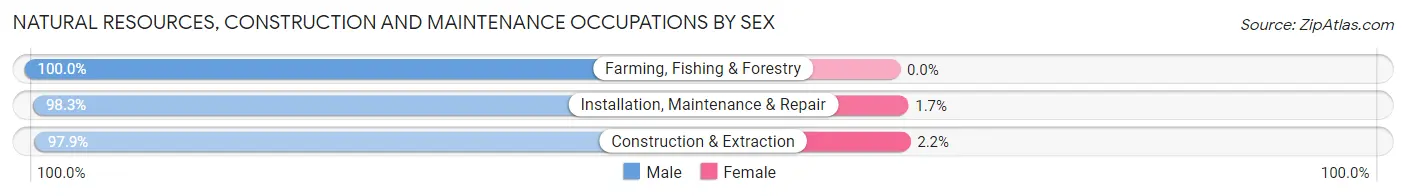
| Occupation | Male | Female |
| Farming, Fishing & Forestry | 155 (100.0%) | 0 (0.0%) |
| Construction & Extraction | 1,414 (97.9%) | 31 (2.1%) |
| Installation, Maintenance & Repair | 679 (98.3%) | 12 (1.7%) |
| Total (Category) | 2,248 (98.1%) | 43 (1.9%) |
| Total (Overall) | 14,383 (54.2%) | 12,169 (45.8%) |
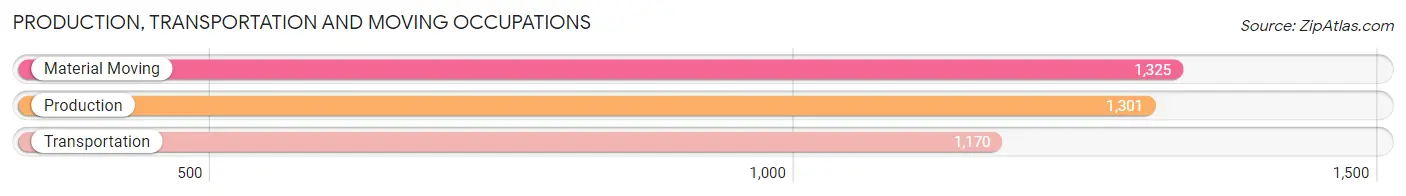
Production, Transportation and Moving Occupations
The most common Production, Transportation and Moving occupations in Allegany County are Material Moving (1,325 | 5.0%), Production (1,301 | 4.9%), and Transportation (1,170 | 4.4%).
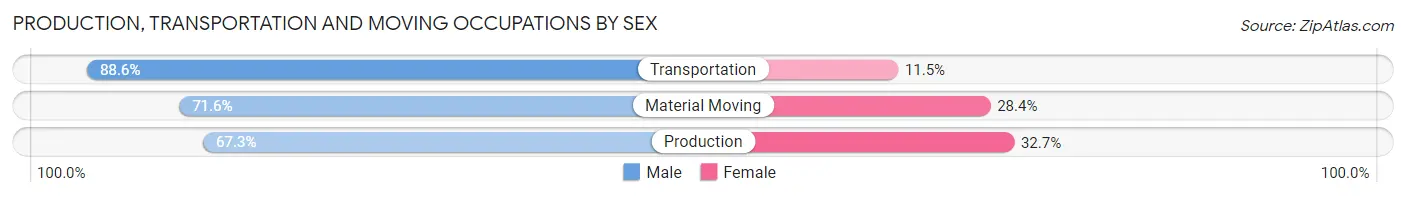
Production, Transportation and Moving Occupations by Sex
| Occupation | Male | Female |
| Production | 875 (67.3%) | 426 (32.7%) |
| Transportation | 1,036 (88.5%) | 134 (11.5%) |
| Material Moving | 949 (71.6%) | 376 (28.4%) |
| Total (Category) | 2,860 (75.3%) | 936 (24.7%) |
| Total (Overall) | 14,383 (54.2%) | 12,169 (45.8%) |
Employment Industries by Sex in Allegany County
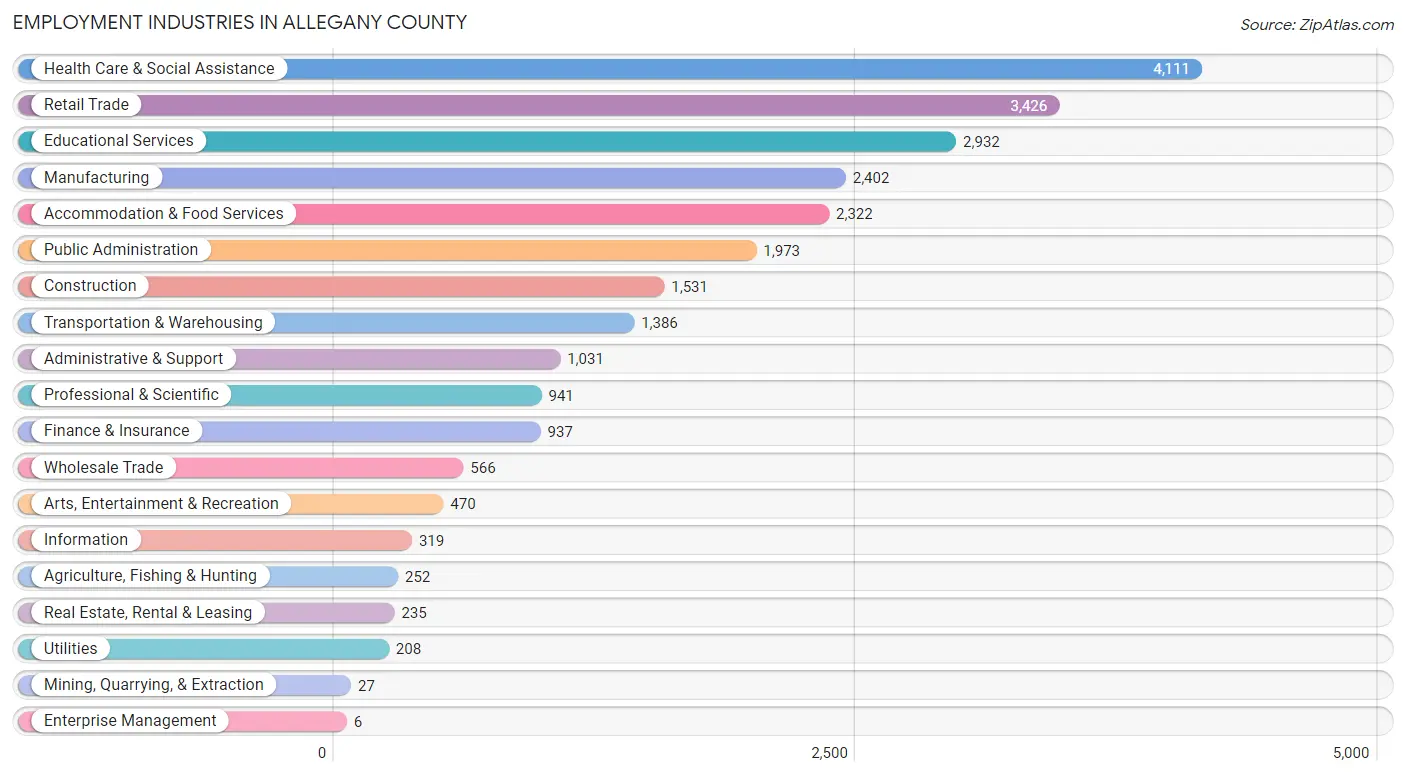
Employment Industries in Allegany County
The major employment industries in Allegany County include Health Care & Social Assistance (4,111 | 15.5%), Retail Trade (3,426 | 12.9%), Educational Services (2,932 | 11.0%), Manufacturing (2,402 | 9.0%), and Accommodation & Food Services (2,322 | 8.7%).
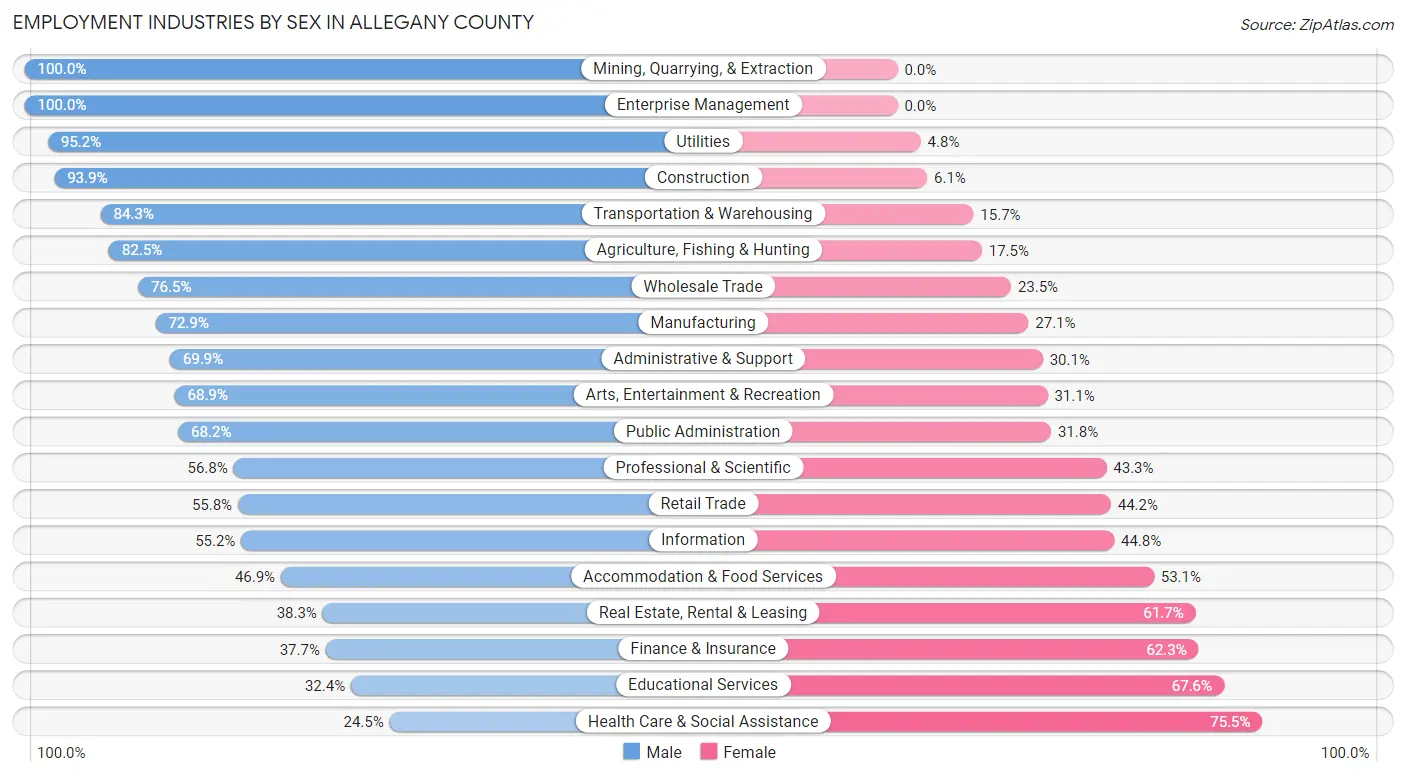
Employment Industries by Sex in Allegany County
The Allegany County industries that see more men than women are Mining, Quarrying, & Extraction (100.0%), Enterprise Management (100.0%), and Utilities (95.2%), whereas the industries that tend to have a higher number of women are Health Care & Social Assistance (75.5%), Educational Services (67.6%), and Finance & Insurance (62.3%).
| Industry | Male | Female |
| Agriculture, Fishing & Hunting | 208 (82.5%) | 44 (17.5%) |
| Mining, Quarrying, & Extraction | 27 (100.0%) | 0 (0.0%) |
| Construction | 1,437 (93.9%) | 94 (6.1%) |
| Manufacturing | 1,751 (72.9%) | 651 (27.1%) |
| Wholesale Trade | 433 (76.5%) | 133 (23.5%) |
| Retail Trade | 1,913 (55.8%) | 1,513 (44.2%) |
| Transportation & Warehousing | 1,168 (84.3%) | 218 (15.7%) |
| Utilities | 198 (95.2%) | 10 (4.8%) |
| Information | 176 (55.2%) | 143 (44.8%) |
| Finance & Insurance | 353 (37.7%) | 584 (62.3%) |
| Real Estate, Rental & Leasing | 90 (38.3%) | 145 (61.7%) |
| Professional & Scientific | 534 (56.8%) | 407 (43.2%) |
| Enterprise Management | 6 (100.0%) | 0 (0.0%) |
| Administrative & Support | 721 (69.9%) | 310 (30.1%) |
| Educational Services | 951 (32.4%) | 1,981 (67.6%) |
| Health Care & Social Assistance | 1,006 (24.5%) | 3,105 (75.5%) |
| Arts, Entertainment & Recreation | 324 (68.9%) | 146 (31.1%) |
| Accommodation & Food Services | 1,090 (46.9%) | 1,232 (53.1%) |
| Public Administration | 1,346 (68.2%) | 627 (31.8%) |
| Total | 14,383 (54.2%) | 12,169 (45.8%) |
Education in Allegany County
School Enrollment in Allegany County
The most common levels of schooling among the 14,800 students in Allegany County are college / undergraduate (4,324 | 29.2%), high school (2,928 | 19.8%), and elementary school (2,746 | 18.5%).
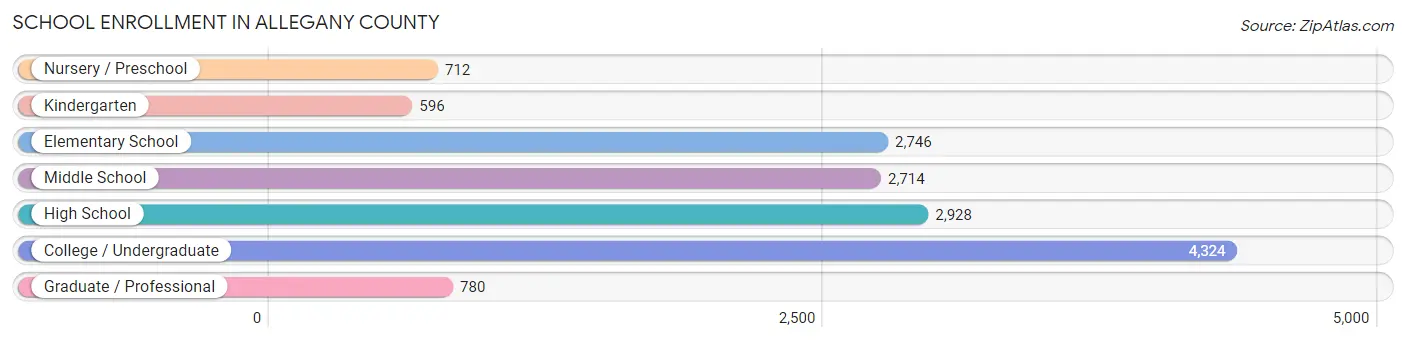
| School Level | # Students | % Students |
| Nursery / Preschool | 712 | 4.8% |
| Kindergarten | 596 | 4.0% |
| Elementary School | 2,746 | 18.5% |
| Middle School | 2,714 | 18.3% |
| High School | 2,928 | 19.8% |
| College / Undergraduate | 4,324 | 29.2% |
| Graduate / Professional | 780 | 5.3% |
| Total | 14,800 | 100.0% |
School Enrollment by Age by Funding Source in Allegany County
Out of a total of 14,800 students who are enrolled in schools in Allegany County, 1,880 (12.7%) attend a private institution, while the remaining 12,920 (87.3%) are enrolled in public schools. The age group of 3 to 4 year olds has the highest likelihood of being enrolled in private schools, with 198 (37.5% in the age bracket) enrolled. Conversely, the age group of 18 to 19 year olds has the lowest likelihood of being enrolled in a private school, with 2,008 (96.1% in the age bracket) attending a public institution.
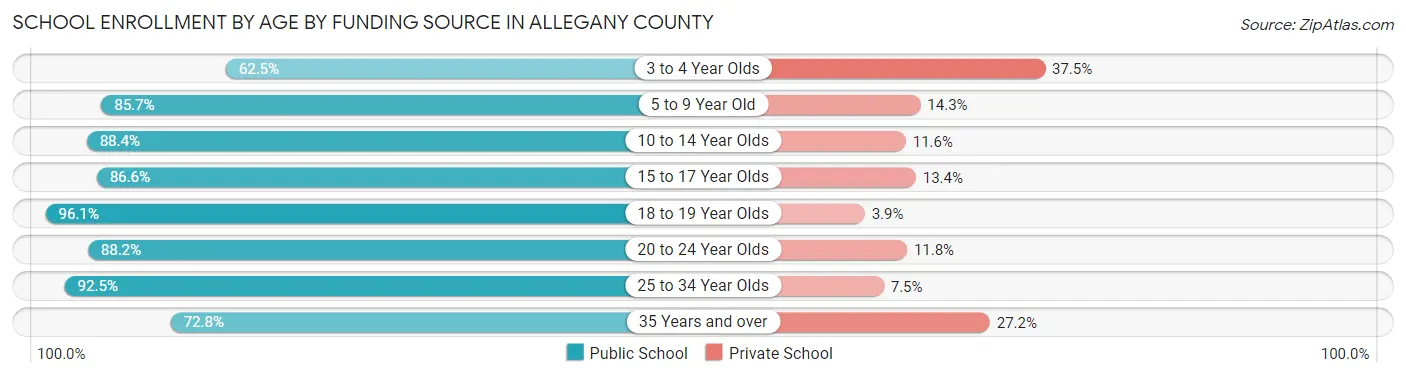
| Age Bracket | Public School | Private School |
| 3 to 4 Year Olds | 330 (62.5%) | 198 (37.5%) |
| 5 to 9 Year Old | 2,766 (85.7%) | 461 (14.3%) |
| 10 to 14 Year Olds | 2,959 (88.4%) | 387 (11.6%) |
| 15 to 17 Year Olds | 1,771 (86.6%) | 275 (13.4%) |
| 18 to 19 Year Olds | 2,008 (96.1%) | 82 (3.9%) |
| 20 to 24 Year Olds | 2,109 (88.2%) | 282 (11.8%) |
| 25 to 34 Year Olds | 595 (92.5%) | 48 (7.5%) |
| 35 Years and over | 385 (72.8%) | 144 (27.2%) |
| Total | 12,920 (87.3%) | 1,880 (12.7%) |
Educational Attainment by Field of Study in Allegany County
Education (2,086 | 19.2%), business (1,601 | 14.7%), social sciences (1,090 | 10.0%), science & technology (879 | 8.1%), and arts & humanities (778 | 7.2%) are the most common fields of study among 10,862 individuals in Allegany County who have obtained a bachelor's degree or higher.
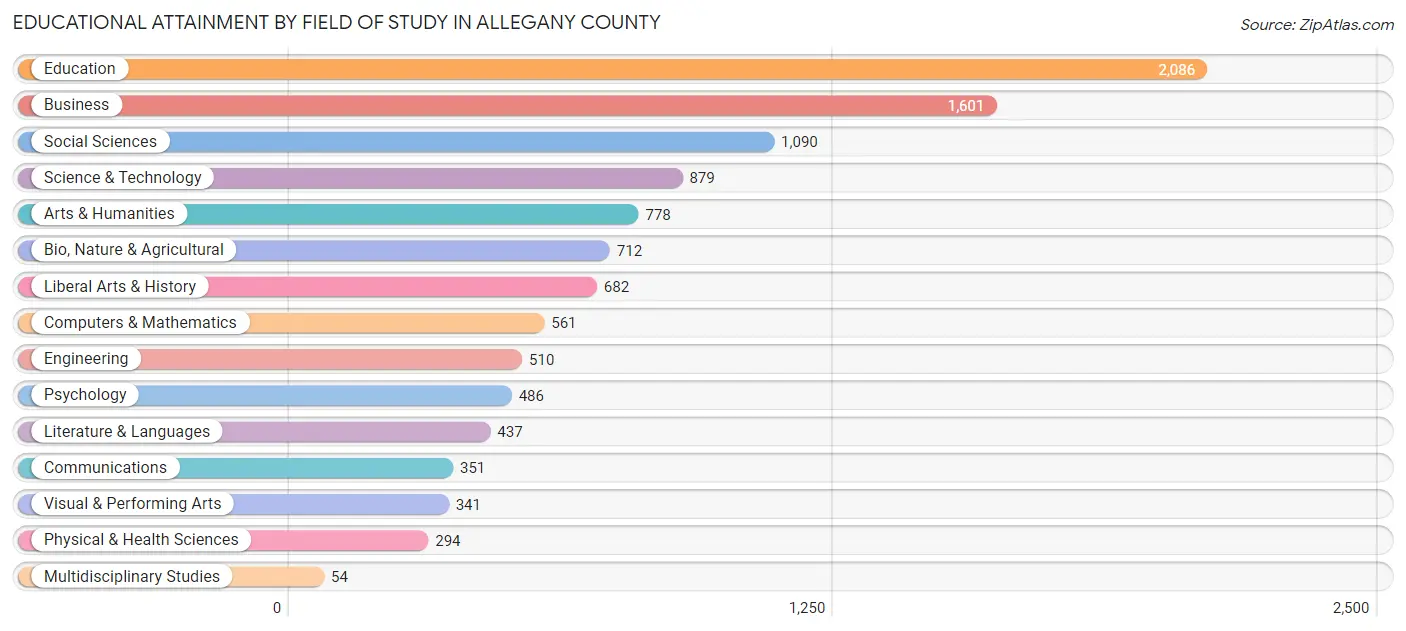
| Field of Study | # Graduates | % Graduates |
| Computers & Mathematics | 561 | 5.2% |
| Bio, Nature & Agricultural | 712 | 6.6% |
| Physical & Health Sciences | 294 | 2.7% |
| Psychology | 486 | 4.5% |
| Social Sciences | 1,090 | 10.0% |
| Engineering | 510 | 4.7% |
| Multidisciplinary Studies | 54 | 0.5% |
| Science & Technology | 879 | 8.1% |
| Business | 1,601 | 14.7% |
| Education | 2,086 | 19.2% |
| Literature & Languages | 437 | 4.0% |
| Liberal Arts & History | 682 | 6.3% |
| Visual & Performing Arts | 341 | 3.1% |
| Communications | 351 | 3.2% |
| Arts & Humanities | 778 | 7.2% |
| Total | 10,862 | 100.0% |
Transportation & Commute in Allegany County
Vehicle Availability by Sex in Allegany County
The most prevalent vehicle ownership categories in Allegany County are males with 2 vehicles (5,949, accounting for 42.7%) and females with 2 vehicles (4,843, making up 50.7%).
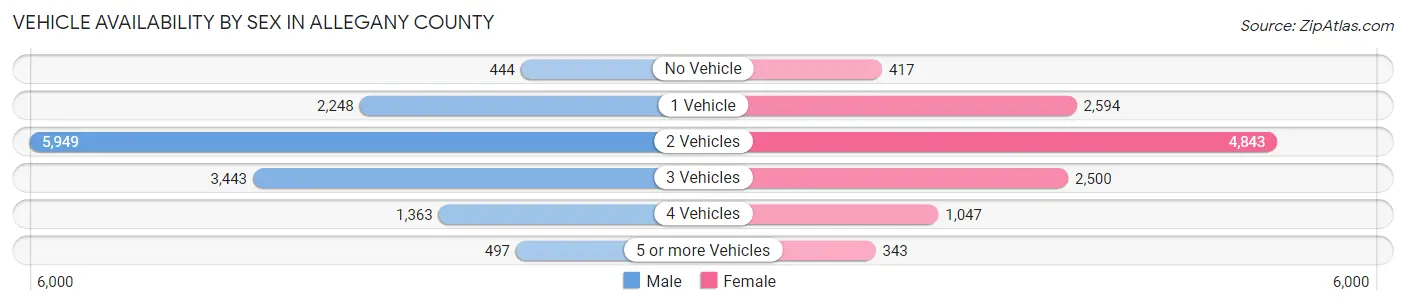
| Vehicles Available | Male | Female |
| No Vehicle | 444 (3.2%) | 417 (3.5%) |
| 1 Vehicle | 2,248 (16.1%) | 2,594 (22.1%) |
| 2 Vehicles | 5,949 (42.7%) | 4,843 (41.2%) |
| 3 Vehicles | 3,443 (24.7%) | 2,500 (21.3%) |
| 4 Vehicles | 1,363 (9.8%) | 1,047 (8.9%) |
| 5 or more Vehicles | 497 (3.6%) | 343 (2.9%) |
| Total | 13,944 (100.0%) | 11,744 (100.0%) |
Commute Time in Allegany County
The most frequently occuring commute durations in Allegany County are 15 to 19 minutes (4,913 commuters, 20.2%), 10 to 14 minutes (3,922 commuters, 16.1%), and 20 to 24 minutes (3,872 commuters, 15.9%).
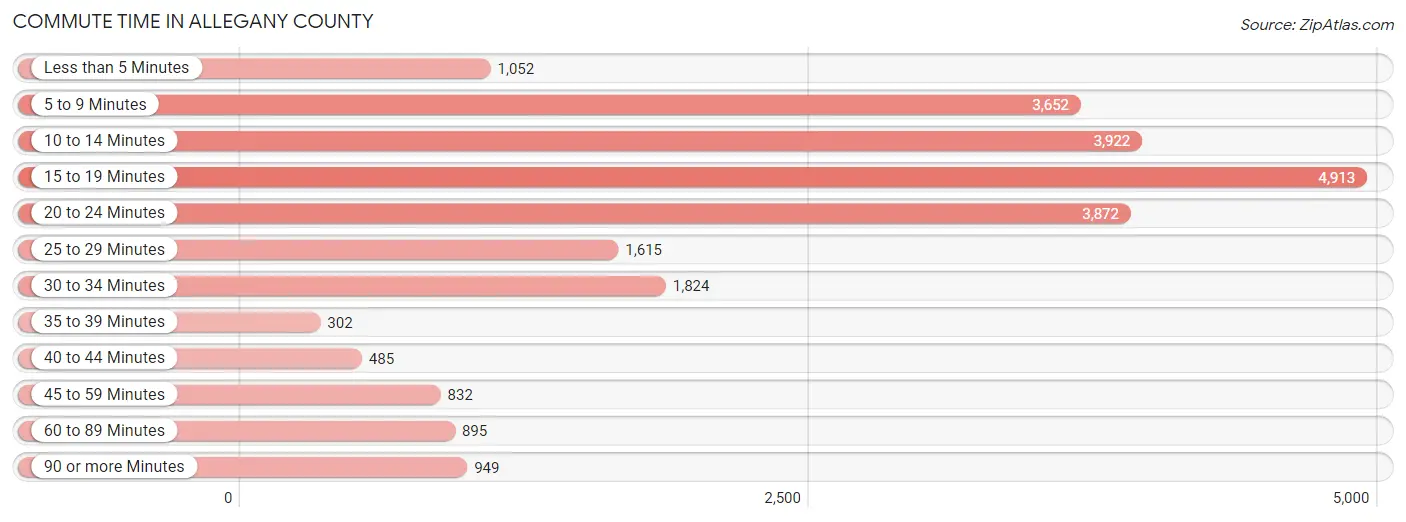
| Commute Time | # Commuters | % Commuters |
| Less than 5 Minutes | 1,052 | 4.3% |
| 5 to 9 Minutes | 3,652 | 15.0% |
| 10 to 14 Minutes | 3,922 | 16.1% |
| 15 to 19 Minutes | 4,913 | 20.2% |
| 20 to 24 Minutes | 3,872 | 15.9% |
| 25 to 29 Minutes | 1,615 | 6.6% |
| 30 to 34 Minutes | 1,824 | 7.5% |
| 35 to 39 Minutes | 302 | 1.2% |
| 40 to 44 Minutes | 485 | 2.0% |
| 45 to 59 Minutes | 832 | 3.4% |
| 60 to 89 Minutes | 895 | 3.7% |
| 90 or more Minutes | 949 | 3.9% |
Commute Time by Sex in Allegany County
The most common commute times in Allegany County are 15 to 19 minutes (2,521 commuters, 19.0%) for males and 15 to 19 minutes (2,392 commuters, 21.7%) for females.
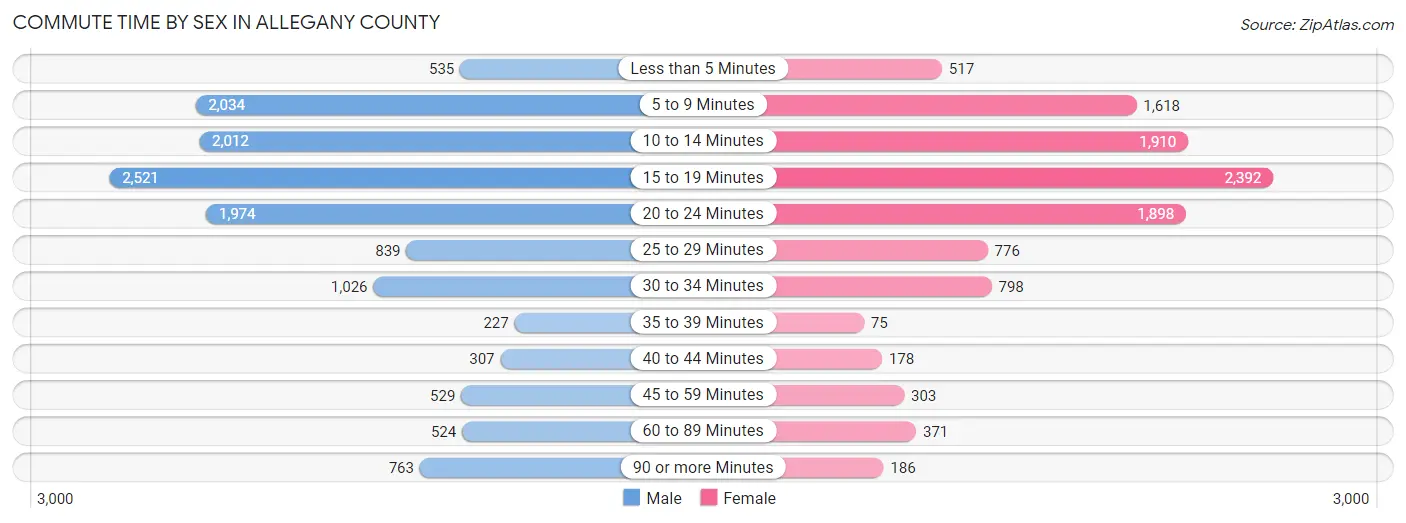
| Commute Time | Male | Female |
| Less than 5 Minutes | 535 (4.0%) | 517 (4.7%) |
| 5 to 9 Minutes | 2,034 (15.3%) | 1,618 (14.7%) |
| 10 to 14 Minutes | 2,012 (15.1%) | 1,910 (17.3%) |
| 15 to 19 Minutes | 2,521 (19.0%) | 2,392 (21.7%) |
| 20 to 24 Minutes | 1,974 (14.8%) | 1,898 (17.2%) |
| 25 to 29 Minutes | 839 (6.3%) | 776 (7.0%) |
| 30 to 34 Minutes | 1,026 (7.7%) | 798 (7.2%) |
| 35 to 39 Minutes | 227 (1.7%) | 75 (0.7%) |
| 40 to 44 Minutes | 307 (2.3%) | 178 (1.6%) |
| 45 to 59 Minutes | 529 (4.0%) | 303 (2.8%) |
| 60 to 89 Minutes | 524 (3.9%) | 371 (3.4%) |
| 90 or more Minutes | 763 (5.7%) | 186 (1.7%) |
Time of Departure to Work by Sex in Allegany County
The most frequent times of departure to work in Allegany County are 7:30 AM to 7:59 AM (1,538, 11.6%) for males and 7:30 AM to 7:59 AM (1,804, 16.4%) for females.
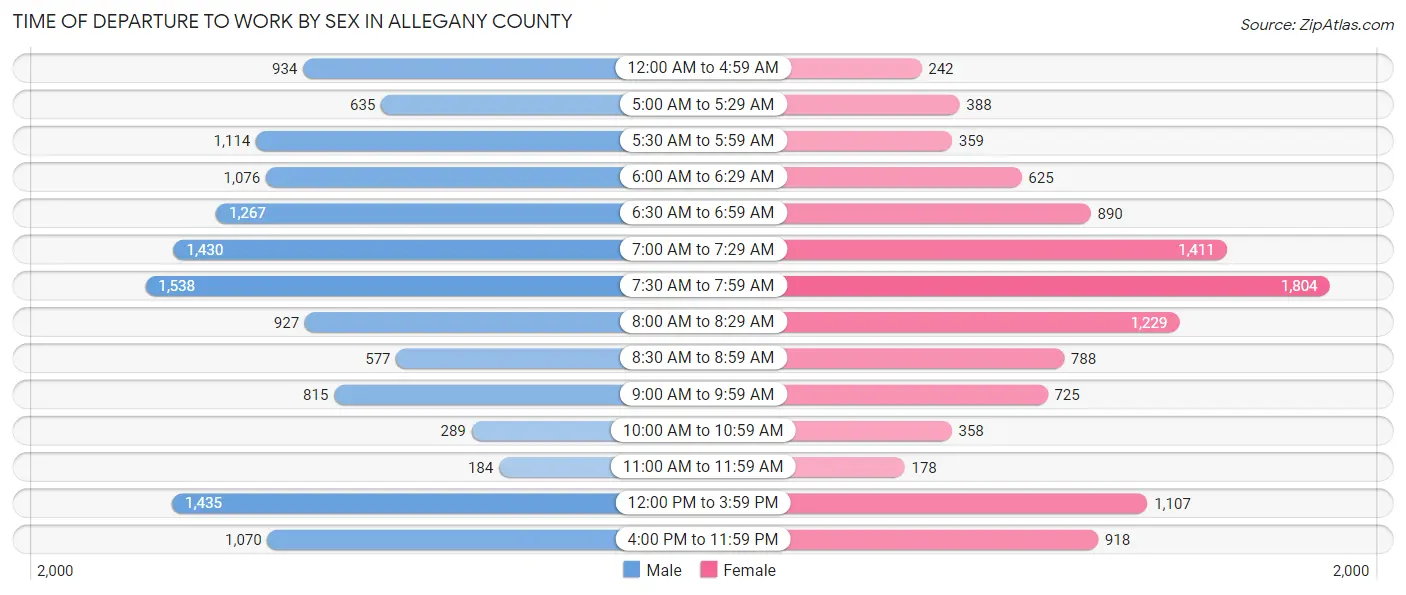
| Time of Departure | Male | Female |
| 12:00 AM to 4:59 AM | 934 (7.0%) | 242 (2.2%) |
| 5:00 AM to 5:29 AM | 635 (4.8%) | 388 (3.5%) |
| 5:30 AM to 5:59 AM | 1,114 (8.4%) | 359 (3.3%) |
| 6:00 AM to 6:29 AM | 1,076 (8.1%) | 625 (5.7%) |
| 6:30 AM to 6:59 AM | 1,267 (9.5%) | 890 (8.1%) |
| 7:00 AM to 7:29 AM | 1,430 (10.8%) | 1,411 (12.8%) |
| 7:30 AM to 7:59 AM | 1,538 (11.6%) | 1,804 (16.4%) |
| 8:00 AM to 8:29 AM | 927 (7.0%) | 1,229 (11.2%) |
| 8:30 AM to 8:59 AM | 577 (4.3%) | 788 (7.1%) |
| 9:00 AM to 9:59 AM | 815 (6.1%) | 725 (6.6%) |
| 10:00 AM to 10:59 AM | 289 (2.2%) | 358 (3.3%) |
| 11:00 AM to 11:59 AM | 184 (1.4%) | 178 (1.6%) |
| 12:00 PM to 3:59 PM | 1,435 (10.8%) | 1,107 (10.0%) |
| 4:00 PM to 11:59 PM | 1,070 (8.1%) | 918 (8.3%) |
| Total | 13,291 (100.0%) | 11,022 (100.0%) |
Housing Occupancy in Allegany County
Occupancy by Ownership in Allegany County
Of the total 27,462 dwellings in Allegany County, owner-occupied units account for 19,252 (70.1%), while renter-occupied units make up 8,210 (29.9%).
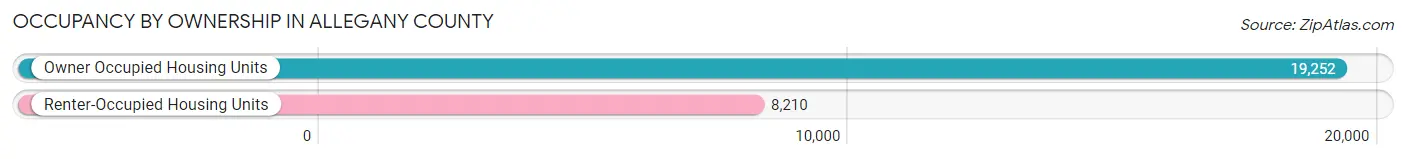
| Occupancy | # Housing Units | % Housing Units |
| Owner Occupied Housing Units | 19,252 | 70.1% |
| Renter-Occupied Housing Units | 8,210 | 29.9% |
| Total Occupied Housing Units | 27,462 | 100.0% |
Occupancy by Household Size in Allegany County
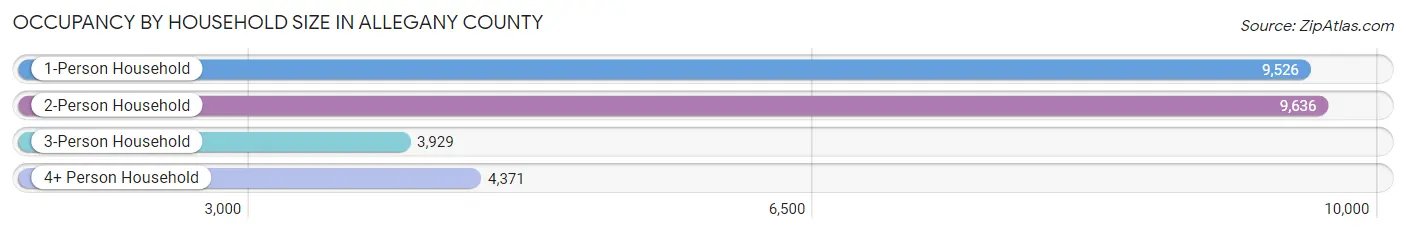
| Household Size | # Housing Units | % Housing Units |
| 1-Person Household | 9,526 | 34.7% |
| 2-Person Household | 9,636 | 35.1% |
| 3-Person Household | 3,929 | 14.3% |
| 4+ Person Household | 4,371 | 15.9% |
| Total Housing Units | 27,462 | 100.0% |
Occupancy by Ownership by Household Size in Allegany County
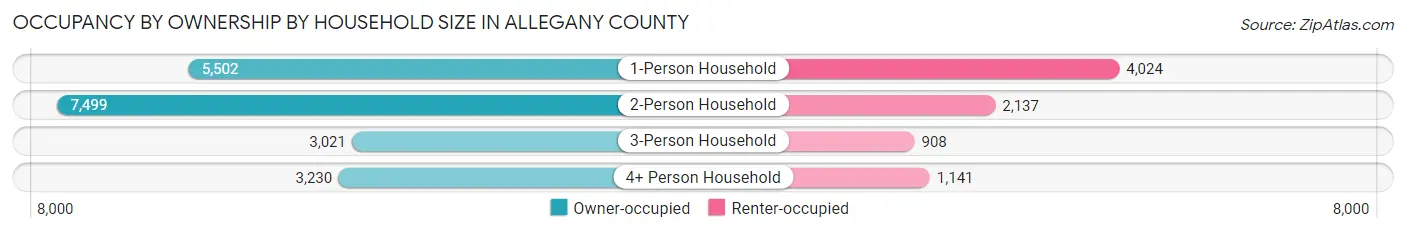
| Household Size | Owner-occupied | Renter-occupied |
| 1-Person Household | 5,502 (57.8%) | 4,024 (42.2%) |
| 2-Person Household | 7,499 (77.8%) | 2,137 (22.2%) |
| 3-Person Household | 3,021 (76.9%) | 908 (23.1%) |
| 4+ Person Household | 3,230 (73.9%) | 1,141 (26.1%) |
| Total Housing Units | 19,252 (70.1%) | 8,210 (29.9%) |
Occupancy by Educational Attainment in Allegany County
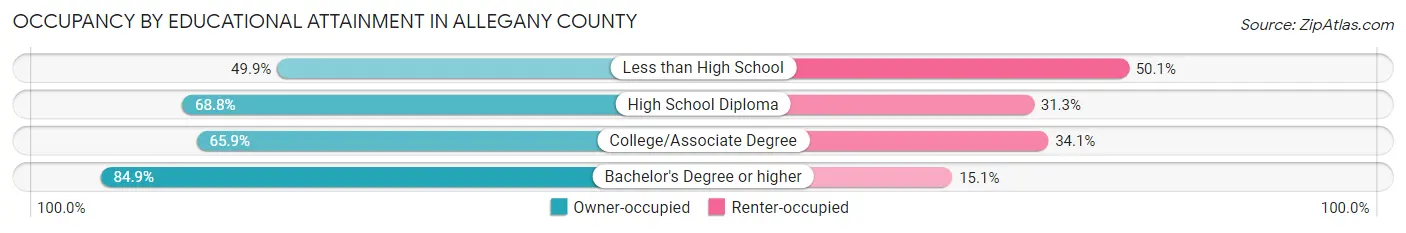
| Household Size | Owner-occupied | Renter-occupied |
| Less than High School | 1,011 (49.9%) | 1,014 (50.1%) |
| High School Diploma | 6,817 (68.8%) | 3,099 (31.2%) |
| College/Associate Degree | 6,080 (65.9%) | 3,148 (34.1%) |
| Bachelor's Degree or higher | 5,344 (84.9%) | 949 (15.1%) |
Occupancy by Age of Householder in Allegany County
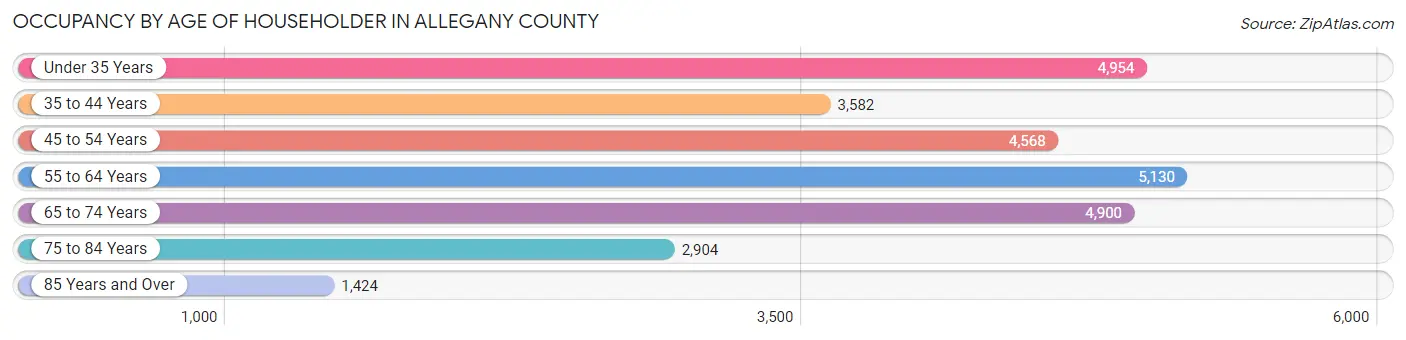
| Age Bracket | # Households | % Households |
| Under 35 Years | 4,954 | 18.0% |
| 35 to 44 Years | 3,582 | 13.0% |
| 45 to 54 Years | 4,568 | 16.6% |
| 55 to 64 Years | 5,130 | 18.7% |
| 65 to 74 Years | 4,900 | 17.8% |
| 75 to 84 Years | 2,904 | 10.6% |
| 85 Years and Over | 1,424 | 5.2% |
| Total | 27,462 | 100.0% |
Housing Finances in Allegany County
Median Income by Occupancy in Allegany County
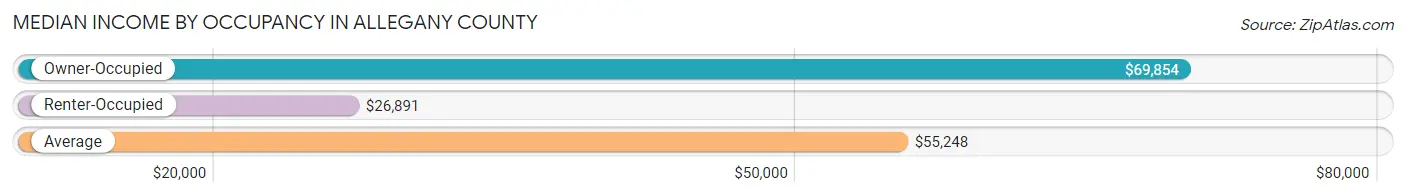
| Occupancy Type | # Households | Median Income |
| Owner-Occupied | 19,252 (70.1%) | $69,854 |
| Renter-Occupied | 8,210 (29.9%) | $26,891 |
| Average | 27,462 (100.0%) | $55,248 |
Occupancy by Householder Income Bracket in Allegany County
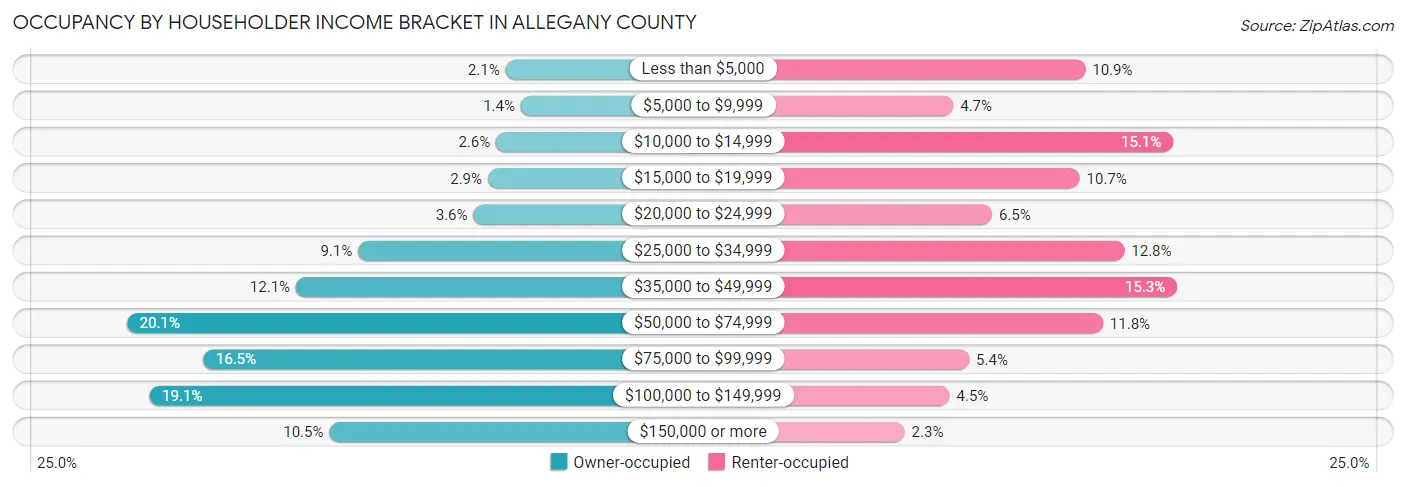
| Income Bracket | Owner-occupied | Renter-occupied |
| Less than $5,000 | 404 (2.1%) | 898 (10.9%) |
| $5,000 to $9,999 | 264 (1.4%) | 382 (4.6%) |
| $10,000 to $14,999 | 491 (2.5%) | 1,241 (15.1%) |
| $15,000 to $19,999 | 566 (2.9%) | 876 (10.7%) |
| $20,000 to $24,999 | 699 (3.6%) | 534 (6.5%) |
| $25,000 to $34,999 | 1,756 (9.1%) | 1,051 (12.8%) |
| $35,000 to $49,999 | 2,325 (12.1%) | 1,257 (15.3%) |
| $50,000 to $74,999 | 3,877 (20.1%) | 967 (11.8%) |
| $75,000 to $99,999 | 3,178 (16.5%) | 444 (5.4%) |
| $100,000 to $149,999 | 3,672 (19.1%) | 368 (4.5%) |
| $150,000 or more | 2,020 (10.5%) | 192 (2.3%) |
| Total | 19,252 (100.0%) | 8,210 (100.0%) |
Monthly Housing Cost Tiers in Allegany County
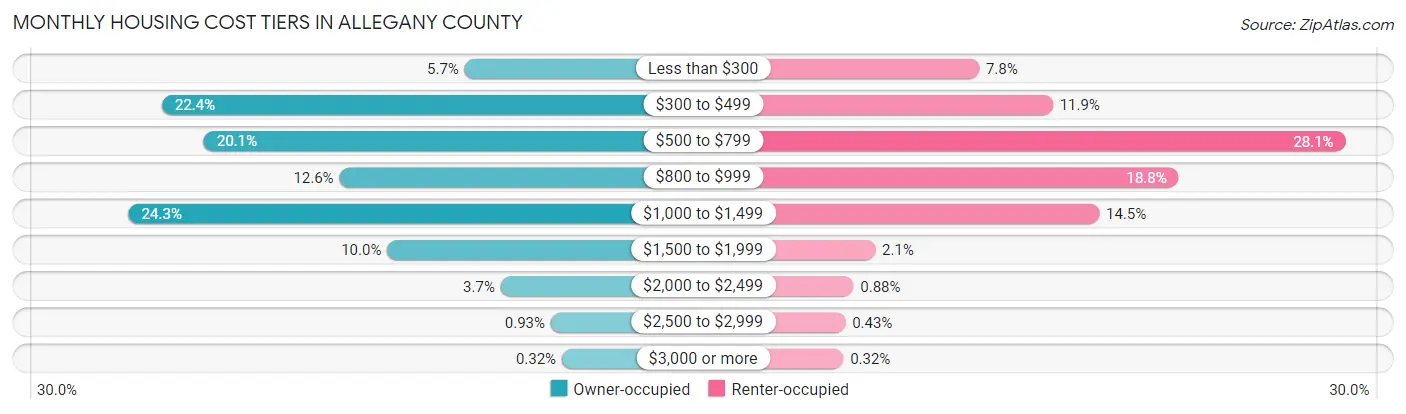
| Monthly Cost | Owner-occupied | Renter-occupied |
| Less than $300 | 1,096 (5.7%) | 642 (7.8%) |
| $300 to $499 | 4,316 (22.4%) | 976 (11.9%) |
| $500 to $799 | 3,870 (20.1%) | 2,304 (28.1%) |
| $800 to $999 | 2,428 (12.6%) | 1,547 (18.8%) |
| $1,000 to $1,499 | 4,671 (24.3%) | 1,186 (14.4%) |
| $1,500 to $1,999 | 1,919 (10.0%) | 171 (2.1%) |
| $2,000 to $2,499 | 712 (3.7%) | 72 (0.9%) |
| $2,500 to $2,999 | 179 (0.9%) | 35 (0.4%) |
| $3,000 or more | 61 (0.3%) | 26 (0.3%) |
| Total | 19,252 (100.0%) | 8,210 (100.0%) |
Physical Housing Characteristics in Allegany County
Housing Structures in Allegany County
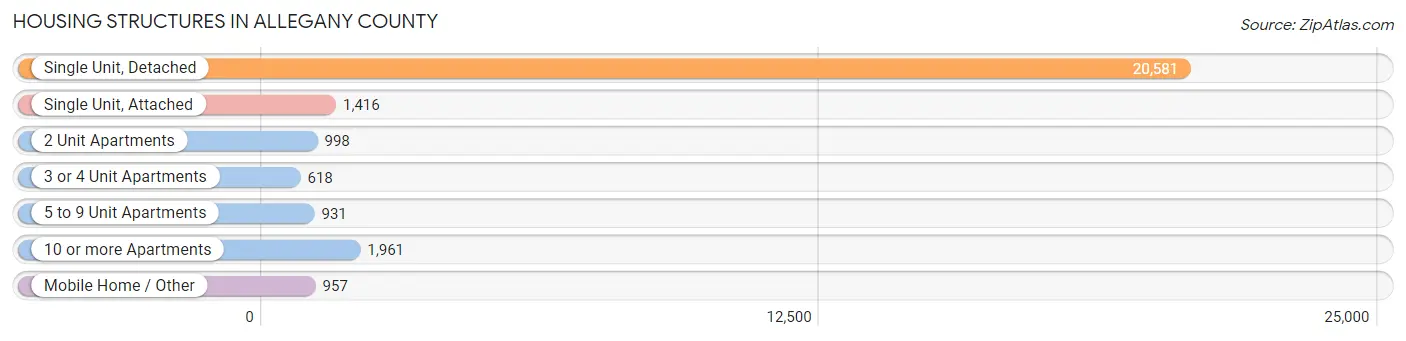
| Structure Type | # Housing Units | % Housing Units |
| Single Unit, Detached | 20,581 | 74.9% |
| Single Unit, Attached | 1,416 | 5.2% |
| 2 Unit Apartments | 998 | 3.6% |
| 3 or 4 Unit Apartments | 618 | 2.2% |
| 5 to 9 Unit Apartments | 931 | 3.4% |
| 10 or more Apartments | 1,961 | 7.1% |
| Mobile Home / Other | 957 | 3.5% |
| Total | 27,462 | 100.0% |
Housing Structures by Occupancy in Allegany County
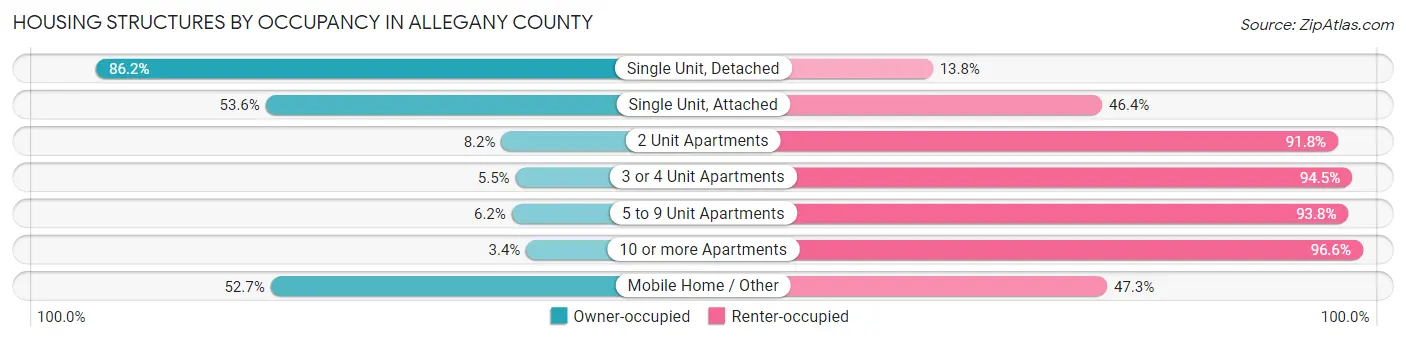
| Structure Type | Owner-occupied | Renter-occupied |
| Single Unit, Detached | 17,748 (86.2%) | 2,833 (13.8%) |
| Single Unit, Attached | 759 (53.6%) | 657 (46.4%) |
| 2 Unit Apartments | 82 (8.2%) | 916 (91.8%) |
| 3 or 4 Unit Apartments | 34 (5.5%) | 584 (94.5%) |
| 5 to 9 Unit Apartments | 58 (6.2%) | 873 (93.8%) |
| 10 or more Apartments | 67 (3.4%) | 1,894 (96.6%) |
| Mobile Home / Other | 504 (52.7%) | 453 (47.3%) |
| Total | 19,252 (70.1%) | 8,210 (29.9%) |
Housing Structures by Number of Rooms in Allegany County
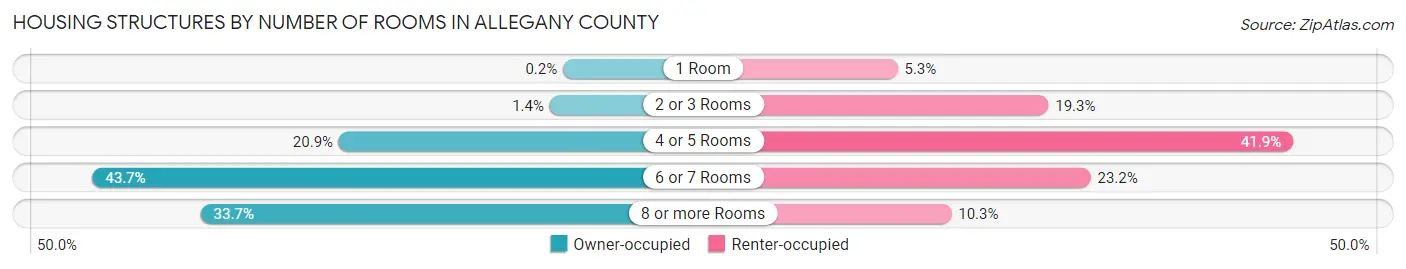
| Number of Rooms | Owner-occupied | Renter-occupied |
| 1 Room | 38 (0.2%) | 438 (5.3%) |
| 2 or 3 Rooms | 275 (1.4%) | 1,582 (19.3%) |
| 4 or 5 Rooms | 4,029 (20.9%) | 3,441 (41.9%) |
| 6 or 7 Rooms | 8,419 (43.7%) | 1,903 (23.2%) |
| 8 or more Rooms | 6,491 (33.7%) | 846 (10.3%) |
| Total | 19,252 (100.0%) | 8,210 (100.0%) |
Housing Structure by Heating Type in Allegany County
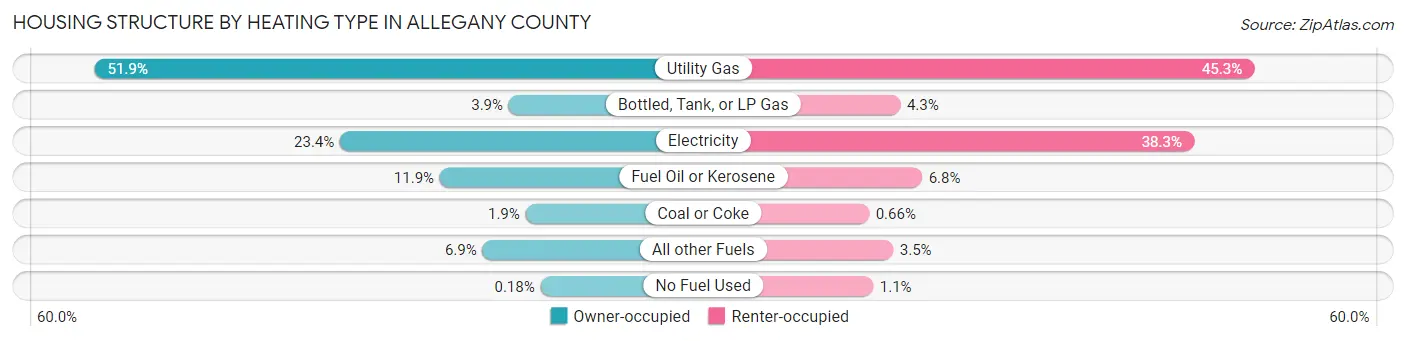
| Heating Type | Owner-occupied | Renter-occupied |
| Utility Gas | 9,990 (51.9%) | 3,721 (45.3%) |
| Bottled, Tank, or LP Gas | 742 (3.8%) | 351 (4.3%) |
| Electricity | 4,508 (23.4%) | 3,148 (38.3%) |
| Fuel Oil or Kerosene | 2,281 (11.8%) | 558 (6.8%) |
| Coal or Coke | 367 (1.9%) | 54 (0.7%) |
| All other Fuels | 1,329 (6.9%) | 284 (3.5%) |
| No Fuel Used | 35 (0.2%) | 94 (1.1%) |
| Total | 19,252 (100.0%) | 8,210 (100.0%) |
Household Vehicle Usage in Allegany County
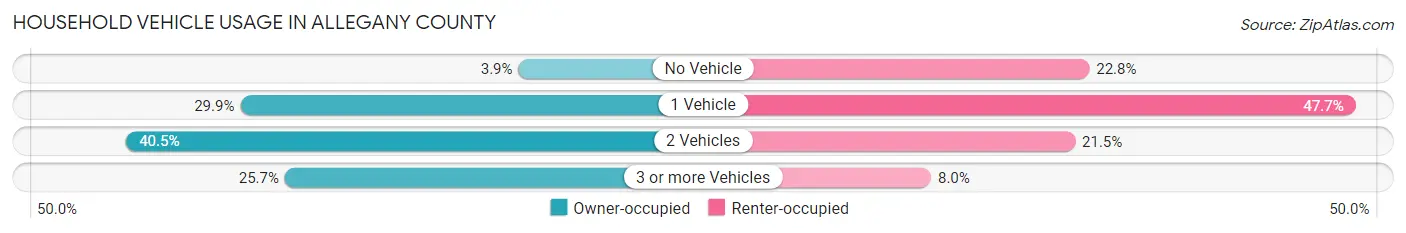
| Vehicles per Household | Owner-occupied | Renter-occupied |
| No Vehicle | 752 (3.9%) | 1,873 (22.8%) |
| 1 Vehicle | 5,751 (29.9%) | 3,913 (47.7%) |
| 2 Vehicles | 7,799 (40.5%) | 1,764 (21.5%) |
| 3 or more Vehicles | 4,950 (25.7%) | 660 (8.0%) |
| Total | 19,252 (100.0%) | 8,210 (100.0%) |
Real Estate & Mortgages in Allegany County
Real Estate and Mortgage Overview in Allegany County
| Characteristic | Without Mortgage | With Mortgage |
| Housing Units | 8,591 | 10,661 |
| Median Property Value | $127,500 | $151,600 |
| Median Household Income | $54,327 | $1,267 |
| Monthly Housing Costs | $457 | $53 |
| Real Estate Taxes | $1,466 | $268 |
Property Value by Mortgage Status in Allegany County
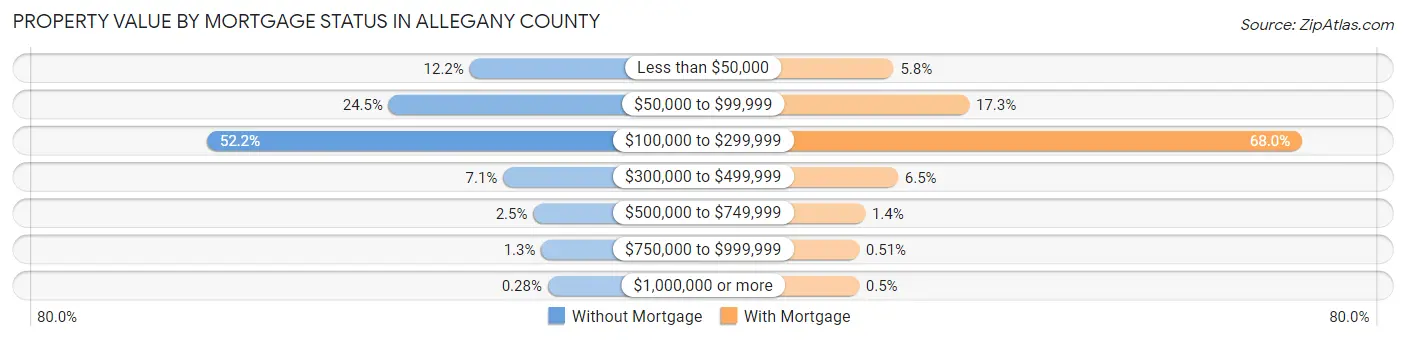
| Property Value | Without Mortgage | With Mortgage |
| Less than $50,000 | 1,047 (12.2%) | 616 (5.8%) |
| $50,000 to $99,999 | 2,105 (24.5%) | 1,844 (17.3%) |
| $100,000 to $299,999 | 4,487 (52.2%) | 7,254 (68.0%) |
| $300,000 to $499,999 | 607 (7.1%) | 688 (6.5%) |
| $500,000 to $749,999 | 213 (2.5%) | 152 (1.4%) |
| $750,000 to $999,999 | 108 (1.3%) | 54 (0.5%) |
| $1,000,000 or more | 24 (0.3%) | 53 (0.5%) |
| Total | 8,591 (100.0%) | 10,661 (100.0%) |
Household Income by Mortgage Status in Allegany County
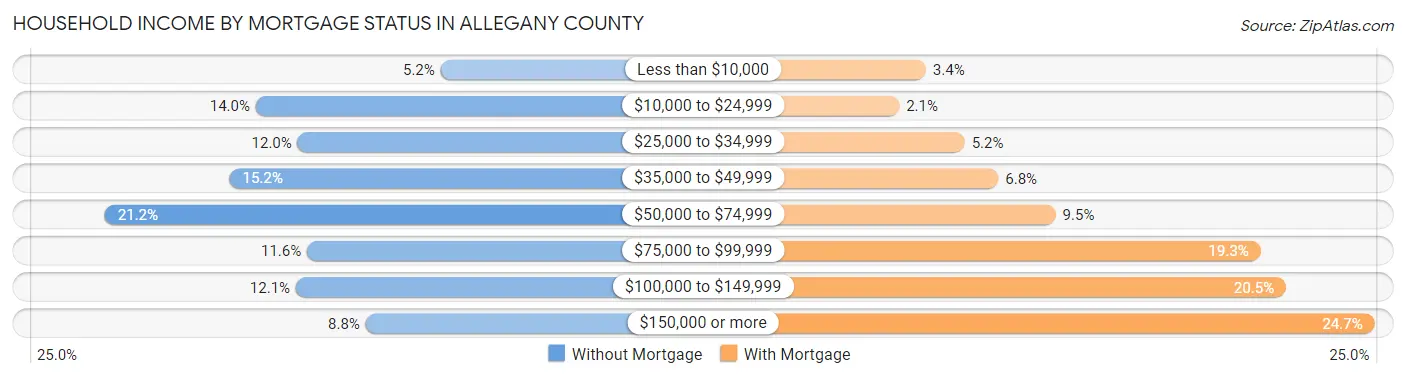
| Household Income | Without Mortgage | With Mortgage |
| Less than $10,000 | 446 (5.2%) | 357 (3.4%) |
| $10,000 to $24,999 | 1,202 (14.0%) | 222 (2.1%) |
| $25,000 to $34,999 | 1,031 (12.0%) | 554 (5.2%) |
| $35,000 to $49,999 | 1,309 (15.2%) | 725 (6.8%) |
| $50,000 to $74,999 | 1,820 (21.2%) | 1,016 (9.5%) |
| $75,000 to $99,999 | 992 (11.6%) | 2,057 (19.3%) |
| $100,000 to $149,999 | 1,038 (12.1%) | 2,186 (20.5%) |
| $150,000 or more | 753 (8.8%) | 2,634 (24.7%) |
| Total | 8,591 (100.0%) | 10,661 (100.0%) |
Property Value to Household Income Ratio in Allegany County
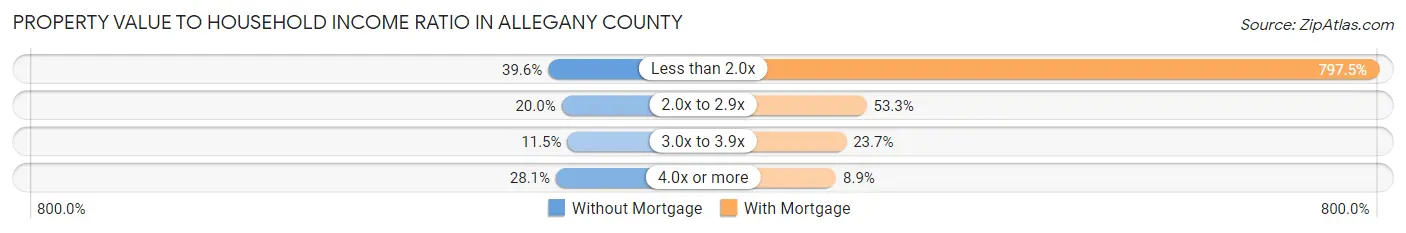
| Value-to-Income Ratio | Without Mortgage | With Mortgage |
| Less than 2.0x | 3,398 (39.6%) | 85,026 (797.5%) |
| 2.0x to 2.9x | 1,714 (20.0%) | 5,677 (53.2%) |
| 3.0x to 3.9x | 984 (11.5%) | 2,528 (23.7%) |
| 4.0x or more | 2,416 (28.1%) | 953 (8.9%) |
| Total | 8,591 (100.0%) | 10,661 (100.0%) |
Real Estate Taxes by Mortgage Status in Allegany County
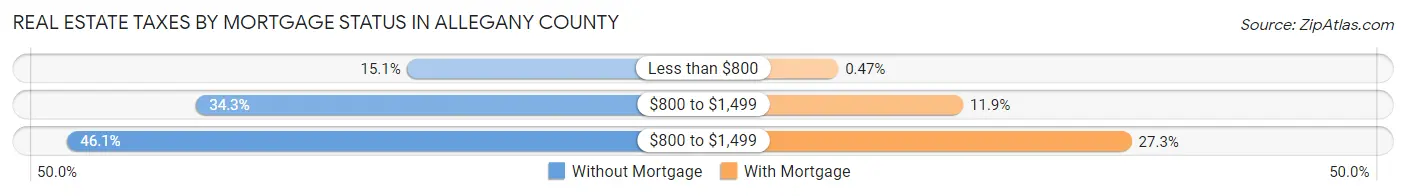
| Property Taxes | Without Mortgage | With Mortgage |
| Less than $800 | 1,299 (15.1%) | 50 (0.5%) |
| $800 to $1,499 | 2,948 (34.3%) | 1,267 (11.9%) |
| $800 to $1,499 | 3,960 (46.1%) | 2,907 (27.3%) |
| Total | 8,591 (100.0%) | 10,661 (100.0%) |
Health & Disability in Allegany County
Health Insurance Coverage by Age in Allegany County
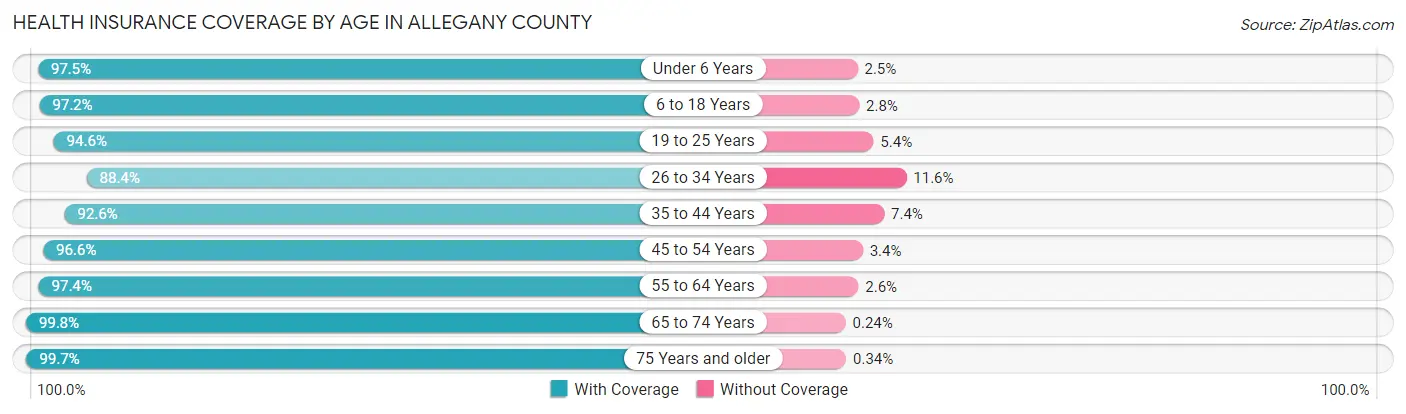
| Age Bracket | With Coverage | Without Coverage |
| Under 6 Years | 3,744 (97.5%) | 95 (2.5%) |
| 6 to 18 Years | 9,062 (97.2%) | 257 (2.8%) |
| 19 to 25 Years | 7,065 (94.6%) | 406 (5.4%) |
| 26 to 34 Years | 5,550 (88.4%) | 726 (11.6%) |
| 35 to 44 Years | 6,264 (92.6%) | 503 (7.4%) |
| 45 to 54 Years | 7,280 (96.6%) | 259 (3.4%) |
| 55 to 64 Years | 8,520 (97.4%) | 229 (2.6%) |
| 65 to 74 Years | 7,350 (99.8%) | 18 (0.2%) |
| 75 Years and older | 5,878 (99.7%) | 20 (0.3%) |
| Total | 60,713 (96.0%) | 2,513 (4.0%) |
Health Insurance Coverage by Citizenship Status in Allegany County
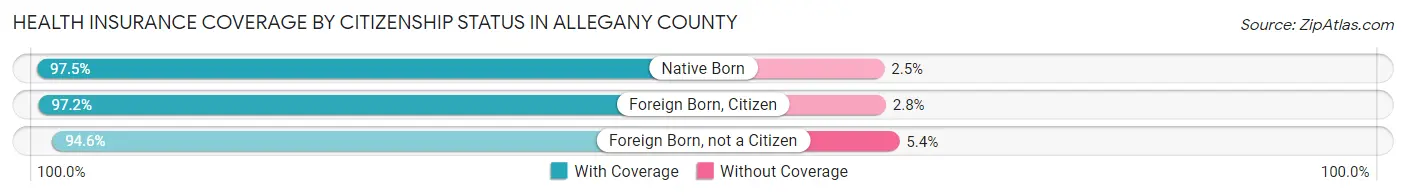
| Citizenship Status | With Coverage | Without Coverage |
| Native Born | 3,744 (97.5%) | 95 (2.5%) |
| Foreign Born, Citizen | 9,062 (97.2%) | 257 (2.8%) |
| Foreign Born, not a Citizen | 7,065 (94.6%) | 406 (5.4%) |
Health Insurance Coverage by Household Income in Allegany County
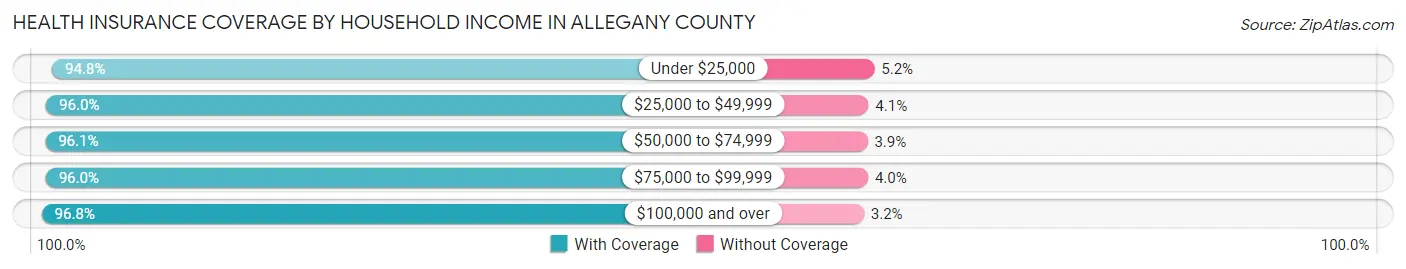
| Household Income | With Coverage | Without Coverage |
| Under $25,000 | 9,030 (94.8%) | 491 (5.2%) |
| $25,000 to $49,999 | 12,245 (96.0%) | 517 (4.1%) |
| $50,000 to $74,999 | 10,595 (96.1%) | 426 (3.9%) |
| $75,000 to $99,999 | 9,149 (96.0%) | 377 (4.0%) |
| $100,000 and over | 17,504 (96.8%) | 576 (3.2%) |
Public vs Private Health Insurance Coverage by Age in Allegany County
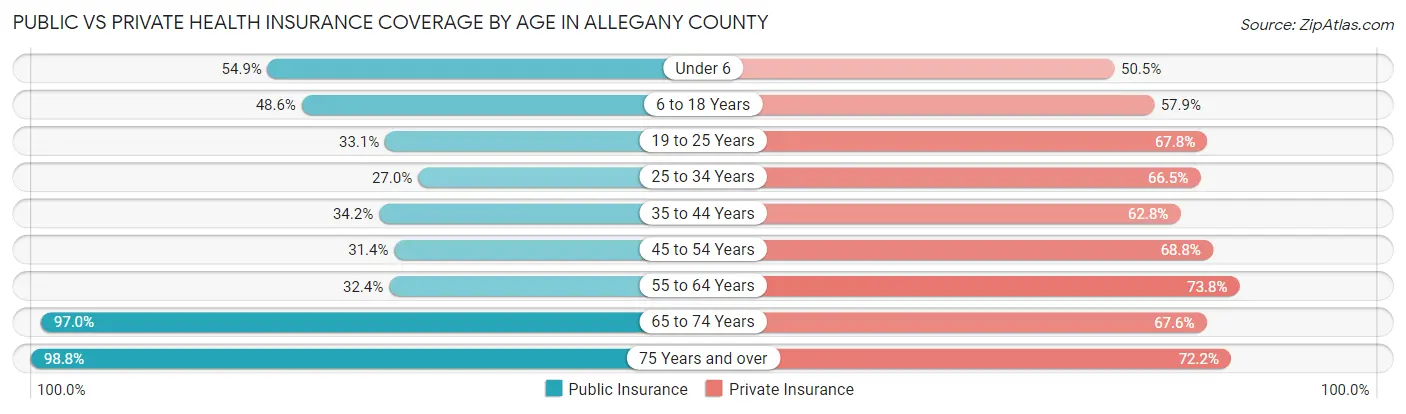
| Age Bracket | Public Insurance | Private Insurance |
| Under 6 | 2,107 (54.9%) | 1,940 (50.5%) |
| 6 to 18 Years | 4,526 (48.6%) | 5,396 (57.9%) |
| 19 to 25 Years | 2,473 (33.1%) | 5,064 (67.8%) |
| 25 to 34 Years | 1,693 (27.0%) | 4,173 (66.5%) |
| 35 to 44 Years | 2,316 (34.2%) | 4,250 (62.8%) |
| 45 to 54 Years | 2,366 (31.4%) | 5,190 (68.8%) |
| 55 to 64 Years | 2,830 (32.4%) | 6,454 (73.8%) |
| 65 to 74 Years | 7,145 (97.0%) | 4,984 (67.6%) |
| 75 Years and over | 5,829 (98.8%) | 4,258 (72.2%) |
| Total | 31,285 (49.5%) | 41,709 (66.0%) |
Disability Status by Sex by Age in Allegany County
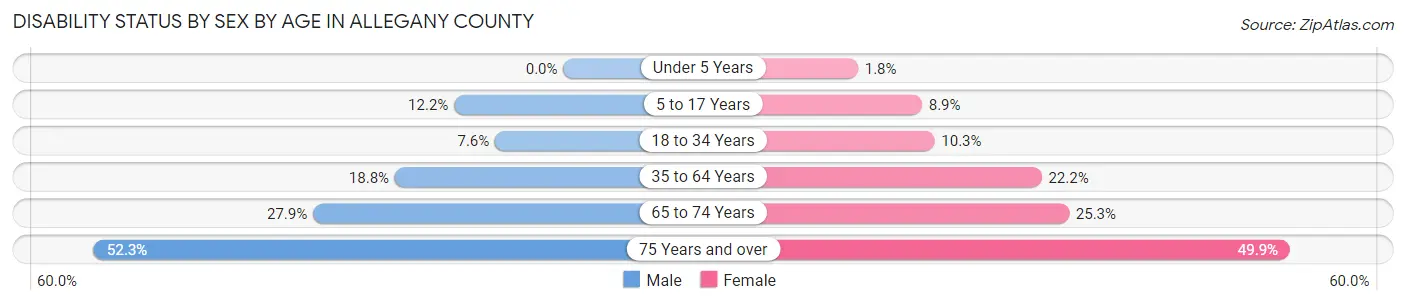
| Age Bracket | Male | Female |
| Under 5 Years | 0 (0.0%) | 25 (1.8%) |
| 5 to 17 Years | 567 (12.2%) | 379 (8.9%) |
| 18 to 34 Years | 593 (7.6%) | 734 (10.3%) |
| 35 to 64 Years | 2,163 (18.8%) | 2,564 (22.2%) |
| 65 to 74 Years | 967 (27.9%) | 986 (25.3%) |
| 75 Years and over | 1,296 (52.3%) | 1,706 (49.9%) |
Disability Class by Sex by Age in Allegany County
Disability Class: Hearing Difficulty
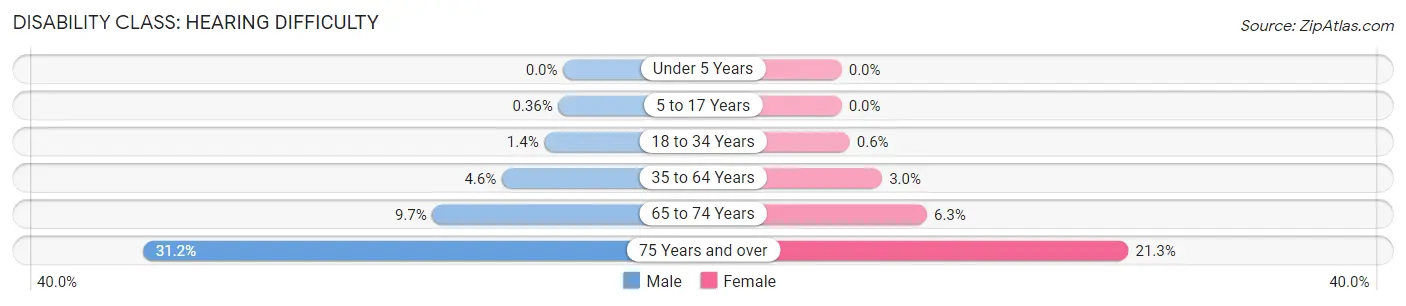
| Age Bracket | Male | Female |
| Under 5 Years | 0 (0.0%) | 0 (0.0%) |
| 5 to 17 Years | 17 (0.4%) | 0 (0.0%) |
| 18 to 34 Years | 109 (1.4%) | 43 (0.6%) |
| 35 to 64 Years | 525 (4.5%) | 346 (3.0%) |
| 65 to 74 Years | 337 (9.7%) | 247 (6.3%) |
| 75 Years and over | 774 (31.2%) | 728 (21.3%) |
Disability Class: Vision Difficulty
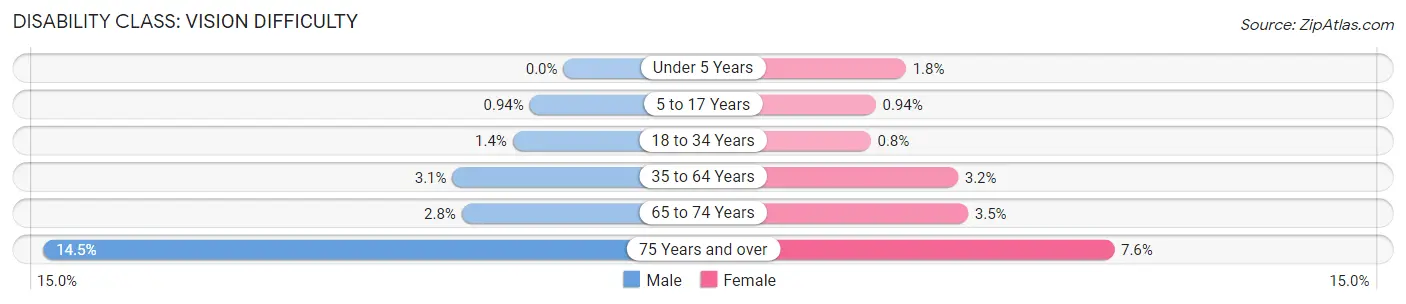
| Age Bracket | Male | Female |
| Under 5 Years | 0 (0.0%) | 25 (1.8%) |
| 5 to 17 Years | 44 (0.9%) | 40 (0.9%) |
| 18 to 34 Years | 110 (1.4%) | 57 (0.8%) |
| 35 to 64 Years | 356 (3.1%) | 372 (3.2%) |
| 65 to 74 Years | 98 (2.8%) | 137 (3.5%) |
| 75 Years and over | 359 (14.5%) | 259 (7.6%) |
Disability Class: Cognitive Difficulty
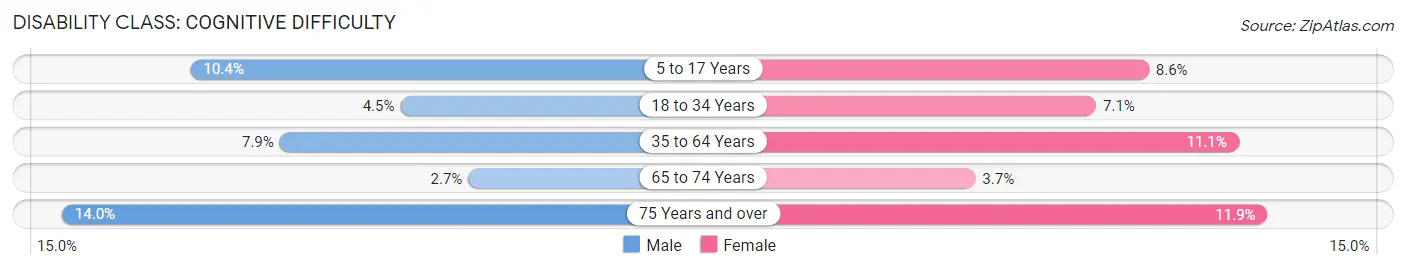
| Age Bracket | Male | Female |
| 5 to 17 Years | 484 (10.4%) | 364 (8.6%) |
| 18 to 34 Years | 354 (4.5%) | 504 (7.1%) |
| 35 to 64 Years | 911 (7.9%) | 1,274 (11.1%) |
| 65 to 74 Years | 92 (2.6%) | 145 (3.7%) |
| 75 Years and over | 346 (14.0%) | 405 (11.8%) |
Disability Class: Ambulatory Difficulty
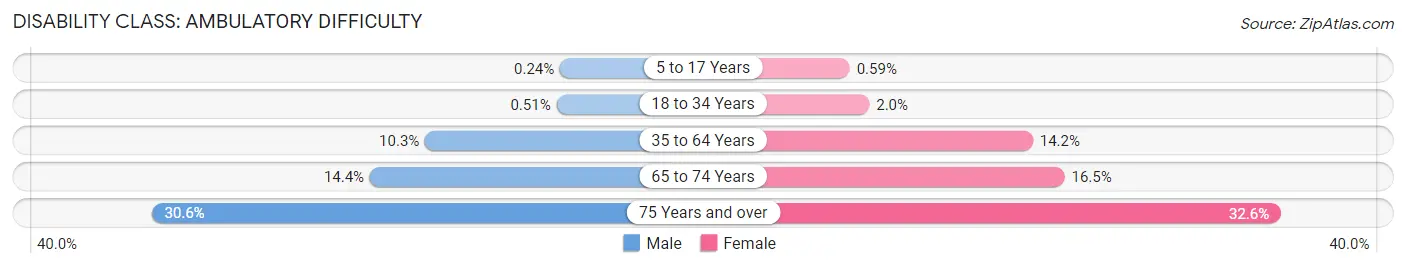
| Age Bracket | Male | Female |
| 5 to 17 Years | 11 (0.2%) | 25 (0.6%) |
| 18 to 34 Years | 40 (0.5%) | 145 (2.0%) |
| 35 to 64 Years | 1,183 (10.3%) | 1,635 (14.2%) |
| 65 to 74 Years | 498 (14.4%) | 645 (16.5%) |
| 75 Years and over | 758 (30.6%) | 1,115 (32.6%) |
Disability Class: Self-Care Difficulty
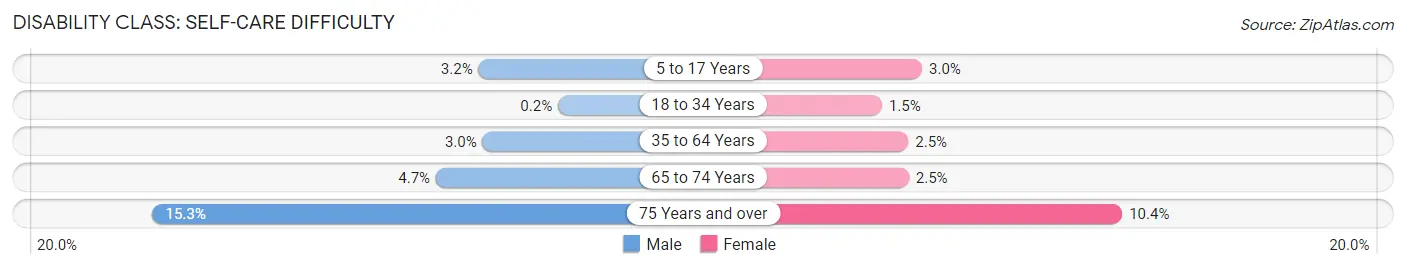
| Age Bracket | Male | Female |
| 5 to 17 Years | 147 (3.2%) | 127 (3.0%) |
| 18 to 34 Years | 16 (0.2%) | 106 (1.5%) |
| 35 to 64 Years | 346 (3.0%) | 285 (2.5%) |
| 65 to 74 Years | 164 (4.7%) | 97 (2.5%) |
| 75 Years and over | 378 (15.2%) | 356 (10.4%) |
Technology Access in Allegany County
Computing Device Access in Allegany County
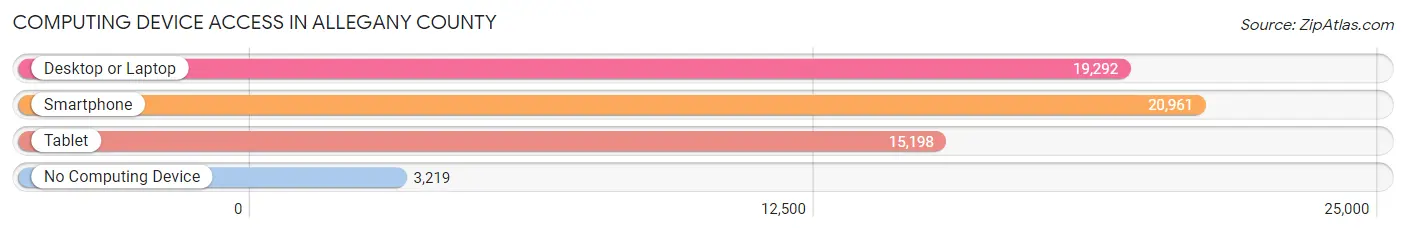
| Device Type | # Households | % Households |
| Desktop or Laptop | 19,292 | 70.3% |
| Smartphone | 20,961 | 76.3% |
| Tablet | 15,198 | 55.3% |
| No Computing Device | 3,219 | 11.7% |
| Total | 27,462 | 100.0% |
Internet Access in Allegany County
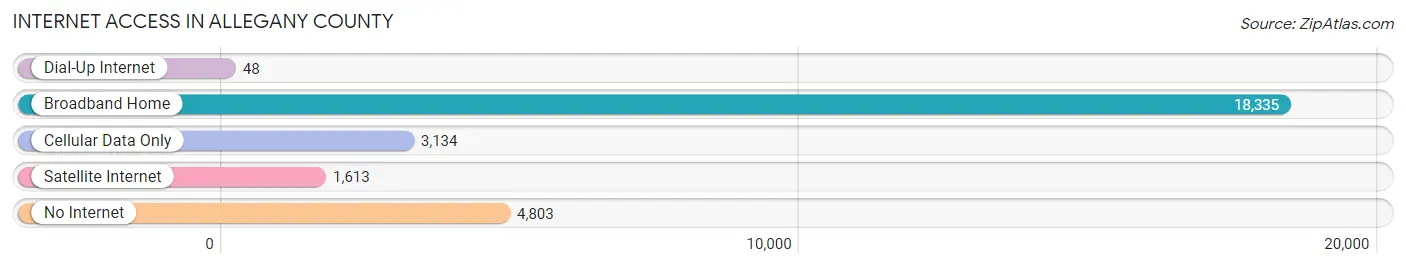
| Internet Type | # Households | % Households |
| Dial-Up Internet | 48 | 0.2% |
| Broadband Home | 18,335 | 66.8% |
| Cellular Data Only | 3,134 | 11.4% |
| Satellite Internet | 1,613 | 5.9% |
| No Internet | 4,803 | 17.5% |
| Total | 27,462 | 100.0% |
Allegany County Summary
Allegany County, Maryland is located in the western part of the state and is part of the Appalachian Mountains region. It is bordered by Garrett County to the north, Washington County to the east, and the states of West Virginia and Pennsylvania to the south and west, respectively. The county seat is Cumberland, and the county has a total area of 430 square miles. As of the 2010 census, the population was 75,087.
Geography
Allegany County is located in the Appalachian Mountains region of Maryland. The terrain is mostly mountainous, with the highest point being Hoye-Crest at 3,360 feet. The county is drained by the Potomac River and its tributaries, including the North Branch Potomac River, Savage River, and Youghiogheny River. The county is home to several state parks, including Green Ridge State Forest, New Germany State Park, and Savage River State Forest.
Economy
Allegany County’s economy is largely based on manufacturing, with the largest employers being Allegany Ballistics Laboratory, Allegany County Public Schools, and the Allegany County Board of Education. Other major employers include the Allegany County Health Department, Allegany County Government, and the Allegany County Sheriff’s Office. The county is also home to several colleges and universities, including Frostburg State University, Allegany College of Maryland, and the University of Maryland University College.
Demographics
As of the 2010 census, the population of Allegany County was 75,087, with a population density of 174 people per square mile. The racial makeup of the county was 91.3% White, 5.2% African American, 0.4% Native American, 0.7% Asian, 0.1% Pacific Islander, 0.7% from other races, and 1.6% from two or more races. Hispanic or Latino of any race were 2.2% of the population.
The median income for a household in the county was $41,945, and the median income for a family was $50,945. The per capita income for the county was $20,945. About 11.2% of families and 15.2% of the population were below the poverty line, including 21.2% of those under age 18 and 8.2% of those age 65 or over.
Allegany County is home to a variety of religious denominations, including Roman Catholic, Methodist, Presbyterian, and Baptist. The county is also home to several museums, including the Allegany Museum, the Western Maryland Railway Museum, and the Allegany County Historical Society.
Allegany County is a rural county with a rich history and a diverse population. It is home to a variety of industries, educational institutions, and recreational activities. The county is a great place to live, work, and play, and is a great place to call home.
Common Questions
What is the Total Population of Allegany County?
Total Population of Allegany County is 68,161.
What is the Total Male Population of Allegany County?
Total Male Population of Allegany County is 35,912.
What is the Total Female Population of Allegany County?
Total Female Population of Allegany County is 32,249.
What is the Ratio of Males per 100 Females in Allegany County?
There are 111.36 Males per 100 Females in Allegany County.
What is the Ratio of Females per 100 Males in Allegany County?
There are 89.80 Females per 100 Males in Allegany County.
What is the Median Population Age in Allegany County?
Median Population Age in Allegany County is 41.9 Years.
What is the Average Family Size in Allegany County
Average Family Size in Allegany County is 2.9 People.
What is the Average Household Size in Allegany County
Average Household Size in Allegany County is 2.2 People.
What is Per Capita Income in Allegany County?
Per Capita income in Allegany County is $29,343.
What is the Median Family Income in Allegany County?
Median Family Income in Allegany County is $71,459.
What is the Median Household income in Allegany County?
Median Household Income in Allegany County is $55,248.
What is Income or Wage Gap in Allegany County?
Income or Wage Gap in Allegany County is 28.2%.
Women in Allegany County earn 71.8 cents for every dollar earned by a man.
What is Family Income Deficit in Allegany County?
Family Income Deficit in Allegany County is $9,596.
Families that are below poverty line in Allegany County earn $9,596 less on average than the poverty threshold level.
What is Inequality or Gini Index in Allegany County?
Inequality or Gini Index in Allegany County is 0.45.
How Large is the Labor Force in Allegany County?
There are 28,515 People in the Labor Forcein in Allegany County.
What is the Percentage of People in the Labor Force in Allegany County?
49.6% of People are in the Labor Force in Allegany County.
What is the Unemployment Rate in Allegany County?
Unemployment Rate in Allegany County is 6.8%.