Cities with the Most Immigrants from Western Europe in Virginia
RELATED REPORTS & OPTIONS
Western Europe
Virginia
Compare Cities
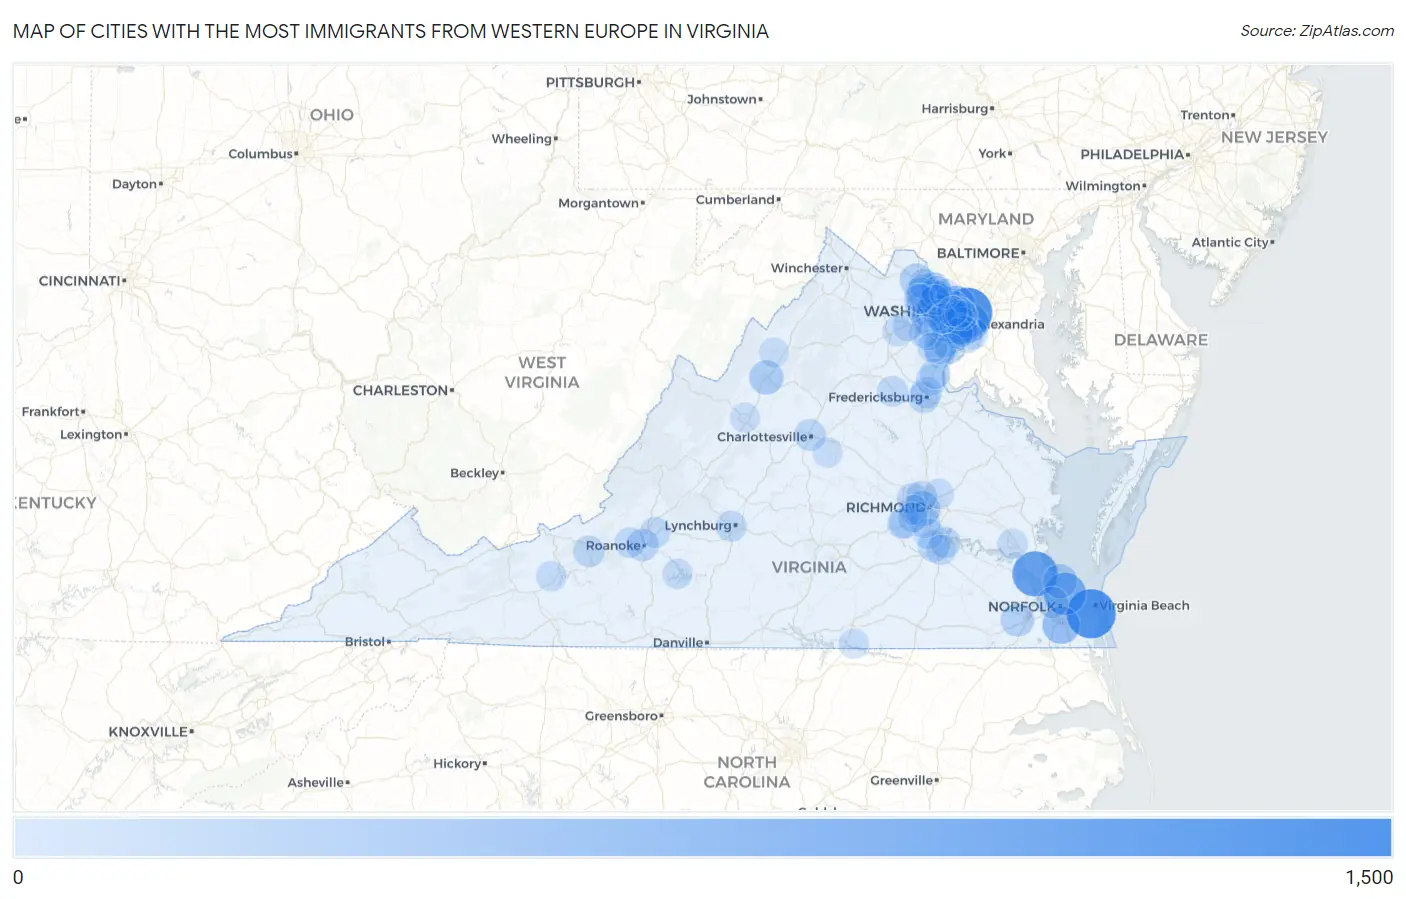
Map of Cities with the Most Immigrants from Western Europe in Virginia
0
1,500
Cities with the Most Immigrants from Western Europe in Virginia
| City | Western Europe | vs State | vs National | |
| 1. | Arlington | 1,477 | 28,783(5.13%)#1 | 924,665(0.16%)#39 |
| 2. | Virginia Beach | 1,443 | 28,783(5.01%)#2 | 924,665(0.16%)#41 |
| 3. | Newport News | 1,151 | 28,783(4.00%)#3 | 924,665(0.12%)#58 |
| 4. | Norfolk | 916 | 28,783(3.18%)#4 | 924,665(0.10%)#86 |
| 5. | Alexandria | 758 | 28,783(2.63%)#5 | 924,665(0.08%)#110 |
| 6. | Mclean | 643 | 28,783(2.23%)#6 | 924,665(0.07%)#146 |
| 7. | Chesapeake | 598 | 28,783(2.08%)#7 | 924,665(0.06%)#160 |
| 8. | Reston | 486 | 28,783(1.69%)#8 | 924,665(0.05%)#201 |
| 9. | Richmond | 424 | 28,783(1.47%)#9 | 924,665(0.05%)#243 |
| 10. | Harrisonburg | 347 | 28,783(1.21%)#10 | 924,665(0.04%)#318 |
| 11. | Centreville | 346 | 28,783(1.20%)#11 | 924,665(0.04%)#323 |
| 12. | Hampton | 342 | 28,783(1.19%)#12 | 924,665(0.04%)#331 |
| 13. | Ashburn | 332 | 28,783(1.15%)#13 | 924,665(0.04%)#347 |
| 14. | Wolf Trap | 293 | 28,783(1.02%)#14 | 924,665(0.03%)#416 |
| 15. | Leesburg | 281 | 28,783(0.98%)#15 | 924,665(0.03%)#437 |
| 16. | Suffolk | 276 | 28,783(0.96%)#16 | 924,665(0.03%)#444 |
| 17. | Oakton | 250 | 28,783(0.87%)#17 | 924,665(0.03%)#507 |
| 18. | Dale City | 237 | 28,783(0.82%)#18 | 924,665(0.03%)#544 |
| 19. | Vienna | 221 | 28,783(0.77%)#19 | 924,665(0.02%)#589 |
| 20. | Springfield | 217 | 28,783(0.75%)#20 | 924,665(0.02%)#607 |
| 21. | Roanoke | 207 | 28,783(0.72%)#21 | 924,665(0.02%)#633 |
| 22. | Tysons | 202 | 28,783(0.70%)#22 | 924,665(0.02%)#651 |
| 23. | Burke | 193 | 28,783(0.67%)#23 | 924,665(0.02%)#689 |
| 24. | South Riding | 189 | 28,783(0.66%)#24 | 924,665(0.02%)#714 |
| 25. | Rose Hill Cdp Fairfax County | 169 | 28,783(0.59%)#25 | 924,665(0.02%)#802 |
| 26. | Charlottesville | 167 | 28,783(0.58%)#26 | 924,665(0.02%)#814 |
| 27. | Colonial Heights | 164 | 28,783(0.57%)#27 | 924,665(0.02%)#831 |
| 28. | Portsmouth | 159 | 28,783(0.55%)#28 | 924,665(0.02%)#854 |
| 29. | Idylwood | 153 | 28,783(0.53%)#29 | 924,665(0.02%)#894 |
| 30. | Fredericksburg | 151 | 28,783(0.52%)#30 | 924,665(0.02%)#904 |
| 31. | Dranesville | 148 | 28,783(0.51%)#31 | 924,665(0.02%)#932 |
| 32. | Annandale | 145 | 28,783(0.50%)#32 | 924,665(0.02%)#951 |
| 33. | West Springfield | 144 | 28,783(0.50%)#33 | 924,665(0.02%)#958 |
| 34. | Tuckahoe | 139 | 28,783(0.48%)#34 | 924,665(0.02%)#995 |
| 35. | Blacksburg | 136 | 28,783(0.47%)#35 | 924,665(0.01%)#1,017 |
| 36. | Falmouth | 132 | 28,783(0.46%)#36 | 924,665(0.01%)#1,055 |
| 37. | Brandermill | 130 | 28,783(0.45%)#37 | 924,665(0.01%)#1,071 |
| 38. | Lake Barcroft | 128 | 28,783(0.44%)#38 | 924,665(0.01%)#1,086 |
| 39. | Laymantown | 127 | 28,783(0.44%)#39 | 924,665(0.01%)#1,095 |
| 40. | Lake Ridge | 125 | 28,783(0.43%)#40 | 924,665(0.01%)#1,106 |
| 41. | Lake Of The Woods | 118 | 28,783(0.41%)#41 | 924,665(0.01%)#1,188 |
| 42. | Fort Hunt | 114 | 28,783(0.40%)#42 | 924,665(0.01%)#1,230 |
| 43. | Dumbarton | 113 | 28,783(0.39%)#43 | 924,665(0.01%)#1,239 |
| 44. | Lynchburg | 111 | 28,783(0.39%)#44 | 924,665(0.01%)#1,253 |
| 45. | Hopewell | 111 | 28,783(0.39%)#45 | 924,665(0.01%)#1,256 |
| 46. | Mcnair | 111 | 28,783(0.39%)#46 | 924,665(0.01%)#1,257 |
| 47. | Meadowbrook | 110 | 28,783(0.38%)#47 | 924,665(0.01%)#1,272 |
| 48. | Cascades | 110 | 28,783(0.38%)#48 | 924,665(0.01%)#1,274 |
| 49. | Countryside | 108 | 28,783(0.38%)#49 | 924,665(0.01%)#1,305 |
| 50. | Montclair | 100 | 28,783(0.35%)#50 | 924,665(0.01%)#1,403 |
| 51. | Franklin Farm | 100 | 28,783(0.35%)#51 | 924,665(0.01%)#1,405 |
| 52. | Merrifield | 99 | 28,783(0.34%)#52 | 924,665(0.01%)#1,413 |
| 53. | Stafford Courthouse | 99 | 28,783(0.34%)#53 | 924,665(0.01%)#1,418 |
| 54. | Salem | 98 | 28,783(0.34%)#54 | 924,665(0.01%)#1,423 |
| 55. | Chester | 98 | 28,783(0.34%)#55 | 924,665(0.01%)#1,424 |
| 56. | Buckhall | 95 | 28,783(0.33%)#56 | 924,665(0.01%)#1,453 |
| 57. | Burke Centre | 93 | 28,783(0.32%)#57 | 924,665(0.01%)#1,482 |
| 58. | Lincolnia | 88 | 28,783(0.31%)#58 | 924,665(0.01%)#1,552 |
| 59. | Franconia | 88 | 28,783(0.31%)#59 | 924,665(0.01%)#1,553 |
| 60. | Woodlake | 88 | 28,783(0.31%)#60 | 924,665(0.01%)#1,564 |
| 61. | Sterling | 86 | 28,783(0.30%)#61 | 924,665(0.01%)#1,583 |
| 62. | Pulaski | 86 | 28,783(0.30%)#62 | 924,665(0.01%)#1,592 |
| 63. | Fairfax | 84 | 28,783(0.29%)#63 | 924,665(0.01%)#1,625 |
| 64. | Aquia Harbour | 82 | 28,783(0.28%)#64 | 924,665(0.01%)#1,667 |
| 65. | Broadlands | 81 | 28,783(0.28%)#65 | 924,665(0.01%)#1,686 |
| 66. | Fort Lee | 81 | 28,783(0.28%)#66 | 924,665(0.01%)#1,688 |
| 67. | Kings Park West | 78 | 28,783(0.27%)#67 | 924,665(0.01%)#1,746 |
| 68. | Chantilly | 76 | 28,783(0.26%)#68 | 924,665(0.01%)#1,777 |
| 69. | Kingstowne | 76 | 28,783(0.26%)#69 | 924,665(0.01%)#1,781 |
| 70. | Mount Vernon | 76 | 28,783(0.26%)#70 | 924,665(0.01%)#1,783 |
| 71. | Mechanicsville | 72 | 28,783(0.25%)#71 | 924,665(0.01%)#1,851 |
| 72. | Hayfield | 72 | 28,783(0.25%)#72 | 924,665(0.01%)#1,864 |
| 73. | Fair Oaks | 70 | 28,783(0.24%)#73 | 924,665(0.01%)#1,897 |
| 74. | Seven Corners | 70 | 28,783(0.24%)#74 | 924,665(0.01%)#1,910 |
| 75. | Williamsburg | 69 | 28,783(0.24%)#75 | 924,665(0.01%)#1,933 |
| 76. | Lansdowne | 69 | 28,783(0.24%)#76 | 924,665(0.01%)#1,936 |
| 77. | Sugarland Run | 69 | 28,783(0.24%)#77 | 924,665(0.01%)#1,937 |
| 78. | Newington | 67 | 28,783(0.23%)#78 | 924,665(0.01%)#1,974 |
| 79. | New Baltimore | 67 | 28,783(0.23%)#79 | 924,665(0.01%)#1,977 |
| 80. | Woodbridge | 66 | 28,783(0.23%)#80 | 924,665(0.01%)#1,991 |
| 81. | Bon Air | 65 | 28,783(0.23%)#81 | 924,665(0.01%)#2,022 |
| 82. | Manassas | 62 | 28,783(0.22%)#82 | 924,665(0.01%)#2,102 |
| 83. | North Shore | 62 | 28,783(0.22%)#83 | 924,665(0.01%)#2,129 |
| 84. | Herndon | 60 | 28,783(0.21%)#84 | 924,665(0.01%)#2,171 |
| 85. | Staunton | 57 | 28,783(0.20%)#85 | 924,665(0.01%)#2,254 |
| 86. | Woodlawn Cdp Fairfax County | 57 | 28,783(0.20%)#86 | 924,665(0.01%)#2,256 |
| 87. | Loudoun Valley Estates | 57 | 28,783(0.20%)#87 | 924,665(0.01%)#2,265 |
| 88. | George Mason | 57 | 28,783(0.20%)#88 | 924,665(0.01%)#2,266 |
| 89. | Lake Monticello | 56 | 28,783(0.19%)#89 | 924,665(0.01%)#2,301 |
| 90. | West Falls Church | 55 | 28,783(0.19%)#90 | 924,665(0.01%)#2,325 |
| 91. | Brambleton | 55 | 28,783(0.19%)#91 | 924,665(0.01%)#2,329 |
| 92. | Gainesville | 55 | 28,783(0.19%)#92 | 924,665(0.01%)#2,334 |
| 93. | Falls Church | 55 | 28,783(0.19%)#93 | 924,665(0.01%)#2,337 |
| 94. | Great Falls | 54 | 28,783(0.19%)#94 | 924,665(0.01%)#2,367 |
| 95. | Independent Hill | 54 | 28,783(0.19%)#95 | 924,665(0.01%)#2,374 |
| 96. | Bracey | 54 | 28,783(0.19%)#96 | 924,665(0.01%)#2,385 |
| 97. | Difficult Run | 53 | 28,783(0.18%)#97 | 924,665(0.01%)#2,405 |
| 98. | Dunn Loring | 53 | 28,783(0.18%)#98 | 924,665(0.01%)#2,408 |
| 99. | Rockwood | 53 | 28,783(0.18%)#99 | 924,665(0.01%)#2,414 |
| 100. | Broadway | 53 | 28,783(0.18%)#100 | 924,665(0.01%)#2,421 |
Common Questions
What are the Top 10 Cities with the Most Immigrants from Western Europe in Virginia?
Top 10 Cities with the Most Immigrants from Western Europe in Virginia are:
#1
1,477
#2
1,443
#3
1,151
#4
916
#5
758
#6
643
#7
598
#8
486
#9
424
#10
347
What city has the Most Immigrants from Western Europe in Virginia?
Arlington has the Most Immigrants from Western Europe in Virginia with 1,477.
What is the Total Immigrants from Western Europe in the State of Virginia?
Total Immigrants from Western Europe in Virginia is 28,783.
What is the Total Immigrants from Western Europe in the United States?
Total Immigrants from Western Europe in the United States is 924,665.