Cities with the Most Immigrants from Western Europe in Missouri
RELATED REPORTS & OPTIONS
Western Europe
Missouri
Compare Cities
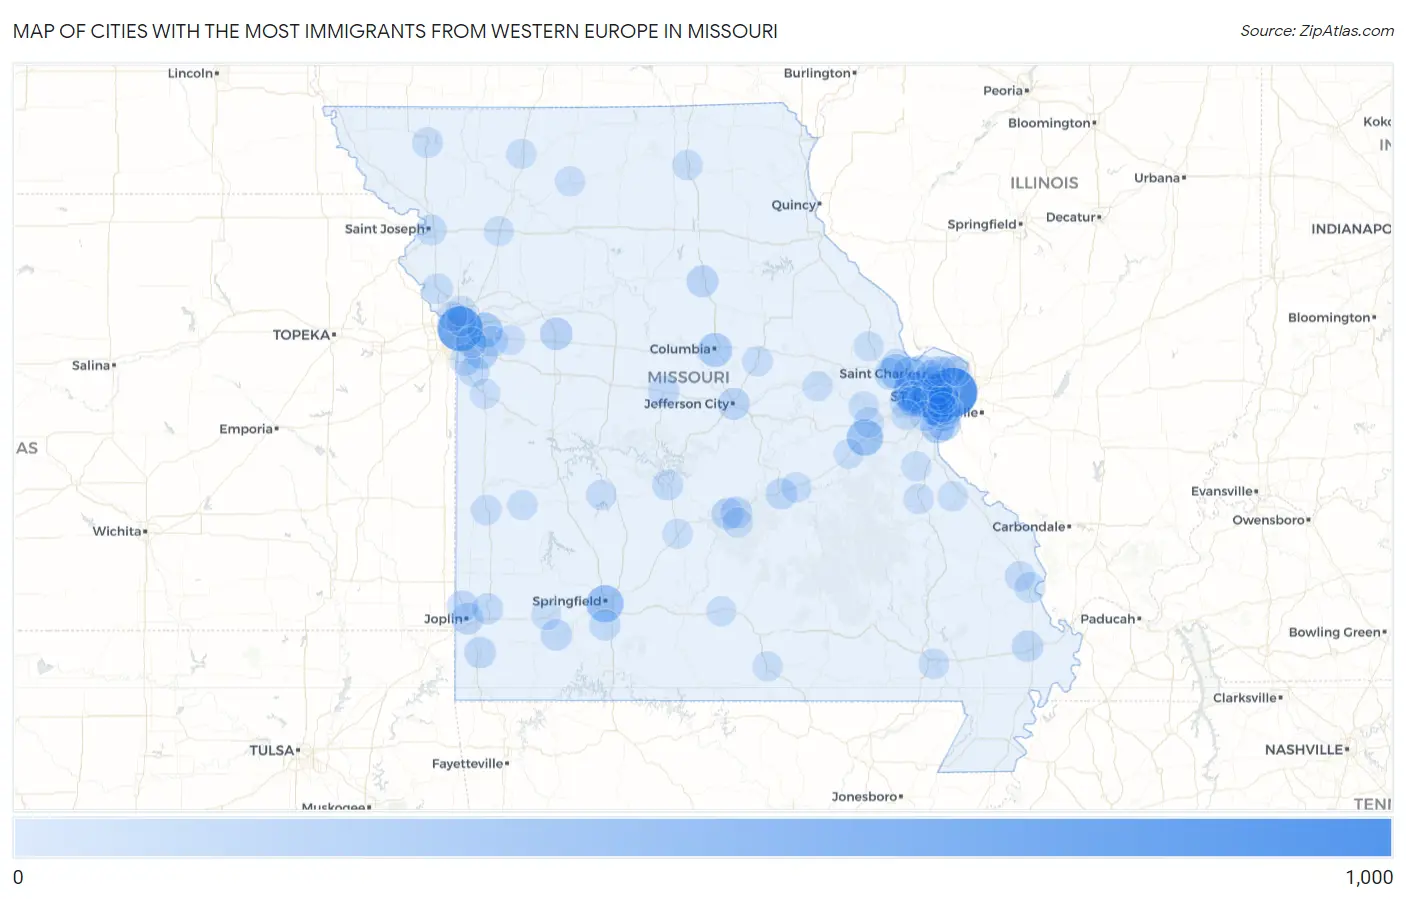
Map of Cities with the Most Immigrants from Western Europe in Missouri
0
1,000
Cities with the Most Immigrants from Western Europe in Missouri
| City | Western Europe | vs State | vs National | |
| 1. | St Louis | 817 | 10,331(7.91%)#1 | 924,665(0.09%)#95 |
| 2. | Kansas City | 618 | 10,331(5.98%)#2 | 924,665(0.07%)#153 |
| 3. | Chesterfield | 464 | 10,331(4.49%)#3 | 924,665(0.05%)#214 |
| 4. | Springfield | 296 | 10,331(2.87%)#4 | 924,665(0.03%)#407 |
| 5. | St Clair | 260 | 10,331(2.52%)#5 | 924,665(0.03%)#473 |
| 6. | Creve Coeur | 234 | 10,331(2.27%)#6 | 924,665(0.03%)#555 |
| 7. | Independence | 201 | 10,331(1.95%)#7 | 924,665(0.02%)#653 |
| 8. | Mehlville | 185 | 10,331(1.79%)#8 | 924,665(0.02%)#733 |
| 9. | Columbia | 173 | 10,331(1.67%)#9 | 924,665(0.02%)#778 |
| 10. | O Fallon | 173 | 10,331(1.67%)#10 | 924,665(0.02%)#779 |
| 11. | University City | 171 | 10,331(1.66%)#11 | 924,665(0.02%)#788 |
| 12. | St Peters | 170 | 10,331(1.65%)#12 | 924,665(0.02%)#793 |
| 13. | Arnold | 170 | 10,331(1.65%)#13 | 924,665(0.02%)#798 |
| 14. | Oakville | 150 | 10,331(1.45%)#14 | 924,665(0.02%)#912 |
| 15. | Lee S Summit | 143 | 10,331(1.38%)#15 | 924,665(0.02%)#963 |
| 16. | Clayton | 111 | 10,331(1.07%)#16 | 924,665(0.01%)#1,259 |
| 17. | Higginsville | 107 | 10,331(1.04%)#17 | 924,665(0.01%)#1,315 |
| 18. | St Charles | 98 | 10,331(0.95%)#18 | 924,665(0.01%)#1,419 |
| 19. | Jefferson City | 85 | 10,331(0.82%)#19 | 924,665(0.01%)#1,602 |
| 20. | Moberly | 82 | 10,331(0.79%)#20 | 924,665(0.01%)#1,659 |
| 21. | Joplin | 79 | 10,331(0.76%)#21 | 924,665(0.01%)#1,710 |
| 22. | St George | 79 | 10,331(0.76%)#22 | 924,665(0.01%)#1,734 |
| 23. | Waynesville | 78 | 10,331(0.76%)#23 | 924,665(0.01%)#1,753 |
| 24. | Maryland Heights | 74 | 10,331(0.72%)#24 | 924,665(0.01%)#1,805 |
| 25. | Lake St Louis | 74 | 10,331(0.72%)#25 | 924,665(0.01%)#1,811 |
| 26. | St Robert | 73 | 10,331(0.71%)#26 | 924,665(0.01%)#1,843 |
| 27. | Kirkwood | 71 | 10,331(0.69%)#27 | 924,665(0.01%)#1,875 |
| 28. | St Ann | 67 | 10,331(0.65%)#28 | 924,665(0.01%)#1,975 |
| 29. | Neosho | 66 | 10,331(0.64%)#29 | 924,665(0.01%)#2,003 |
| 30. | Aurora | 65 | 10,331(0.63%)#30 | 924,665(0.01%)#2,030 |
| 31. | Carl Junction | 64 | 10,331(0.62%)#31 | 924,665(0.01%)#2,053 |
| 32. | Rolla | 63 | 10,331(0.61%)#32 | 924,665(0.01%)#2,071 |
| 33. | Sikeston | 63 | 10,331(0.61%)#33 | 924,665(0.01%)#2,076 |
| 34. | Tipton | 62 | 10,331(0.60%)#34 | 924,665(0.01%)#2,131 |
| 35. | Ballwin | 60 | 10,331(0.58%)#35 | 924,665(0.01%)#2,167 |
| 36. | Carthage | 56 | 10,331(0.54%)#36 | 924,665(0.01%)#2,297 |
| 37. | Richmond Heights | 56 | 10,331(0.54%)#37 | 924,665(0.01%)#2,306 |
| 38. | Nixa | 55 | 10,331(0.53%)#38 | 924,665(0.01%)#2,327 |
| 39. | Overland | 54 | 10,331(0.52%)#39 | 924,665(0.01%)#2,365 |
| 40. | Wildwood | 49 | 10,331(0.47%)#40 | 924,665(0.01%)#2,535 |
| 41. | Grandview | 49 | 10,331(0.47%)#41 | 924,665(0.01%)#2,540 |
| 42. | Raymore | 48 | 10,331(0.46%)#42 | 924,665(0.01%)#2,570 |
| 43. | Town And Country | 48 | 10,331(0.46%)#43 | 924,665(0.01%)#2,580 |
| 44. | Camdenton | 44 | 10,331(0.43%)#44 | 924,665(0.00%)#2,771 |
| 45. | St Joseph | 43 | 10,331(0.42%)#45 | 924,665(0.00%)#2,780 |
| 46. | Lemay | 42 | 10,331(0.41%)#46 | 924,665(0.00%)#2,839 |
| 47. | Blue Springs | 41 | 10,331(0.40%)#47 | 924,665(0.00%)#2,875 |
| 48. | Sappington | 41 | 10,331(0.40%)#48 | 924,665(0.00%)#2,904 |
| 49. | Concord | 39 | 10,331(0.38%)#49 | 924,665(0.00%)#2,985 |
| 50. | Raytown | 38 | 10,331(0.37%)#50 | 924,665(0.00%)#3,034 |
| 51. | Cape Girardeau | 37 | 10,331(0.36%)#51 | 924,665(0.00%)#3,094 |
| 52. | Maryville | 33 | 10,331(0.32%)#52 | 924,665(0.00%)#3,344 |
| 53. | Manchester | 32 | 10,331(0.31%)#53 | 924,665(0.00%)#3,402 |
| 54. | Platte City | 32 | 10,331(0.31%)#54 | 924,665(0.00%)#3,434 |
| 55. | Webster Groves | 30 | 10,331(0.29%)#55 | 924,665(0.00%)#3,547 |
| 56. | Poplar Bluff | 30 | 10,331(0.29%)#56 | 924,665(0.00%)#3,558 |
| 57. | Nevada | 30 | 10,331(0.29%)#57 | 924,665(0.00%)#3,575 |
| 58. | Kirksville | 28 | 10,331(0.27%)#58 | 924,665(0.00%)#3,704 |
| 59. | Jackson | 28 | 10,331(0.27%)#59 | 924,665(0.00%)#3,711 |
| 60. | Sunset Hills | 28 | 10,331(0.27%)#60 | 924,665(0.00%)#3,727 |
| 61. | Brentwood | 28 | 10,331(0.27%)#61 | 924,665(0.00%)#3,737 |
| 62. | St James | 26 | 10,331(0.25%)#62 | 924,665(0.00%)#3,903 |
| 63. | Fulton | 23 | 10,331(0.22%)#63 | 924,665(0.00%)#4,126 |
| 64. | Ladue | 23 | 10,331(0.22%)#64 | 924,665(0.00%)#4,132 |
| 65. | Black Jack | 23 | 10,331(0.22%)#65 | 924,665(0.00%)#4,142 |
| 66. | Clarkson Valley | 23 | 10,331(0.22%)#66 | 924,665(0.00%)#4,173 |
| 67. | Hermitage | 23 | 10,331(0.22%)#67 | 924,665(0.00%)#4,183 |
| 68. | Union | 22 | 10,331(0.21%)#68 | 924,665(0.00%)#4,223 |
| 69. | Olivette | 22 | 10,331(0.21%)#69 | 924,665(0.00%)#4,240 |
| 70. | North Kansas City | 21 | 10,331(0.20%)#70 | 924,665(0.00%)#4,370 |
| 71. | Ellisville | 20 | 10,331(0.19%)#71 | 924,665(0.00%)#4,466 |
| 72. | Bonne Terre | 20 | 10,331(0.19%)#72 | 924,665(0.00%)#4,484 |
| 73. | Oak Grove | 19 | 10,331(0.18%)#73 | 924,665(0.00%)#4,597 |
| 74. | De Soto | 19 | 10,331(0.18%)#74 | 924,665(0.00%)#4,607 |
| 75. | Fort Leonard Wood | 18 | 10,331(0.17%)#75 | 924,665(0.00%)#4,699 |
| 76. | Gladstone | 17 | 10,331(0.16%)#76 | 924,665(0.00%)#4,837 |
| 77. | Lebanon | 17 | 10,331(0.16%)#77 | 924,665(0.00%)#4,851 |
| 78. | Harrisonville | 17 | 10,331(0.16%)#78 | 924,665(0.00%)#4,866 |
| 79. | Washington | 16 | 10,331(0.15%)#79 | 924,665(0.00%)#4,975 |
| 80. | Murphy | 16 | 10,331(0.15%)#80 | 924,665(0.00%)#5,007 |
| 81. | Grayhawk | 16 | 10,331(0.15%)#81 | 924,665(0.00%)#5,080 |
| 82. | Bridgeton | 15 | 10,331(0.15%)#82 | 924,665(0.00%)#5,124 |
| 83. | Maplewood | 15 | 10,331(0.15%)#83 | 924,665(0.00%)#5,138 |
| 84. | Mount Vernon | 15 | 10,331(0.15%)#84 | 924,665(0.00%)#5,167 |
| 85. | Eureka | 14 | 10,331(0.14%)#85 | 924,665(0.00%)#5,287 |
| 86. | Trenton | 14 | 10,331(0.14%)#86 | 924,665(0.00%)#5,329 |
| 87. | El Dorado Springs | 14 | 10,331(0.14%)#87 | 924,665(0.00%)#5,352 |
| 88. | Hazelwood | 13 | 10,331(0.13%)#88 | 924,665(0.00%)#5,426 |
| 89. | Cameron | 13 | 10,331(0.13%)#89 | 924,665(0.00%)#5,468 |
| 90. | Mountain Grove | 13 | 10,331(0.13%)#90 | 924,665(0.00%)#5,504 |
| 91. | Florissant | 11 | 10,331(0.11%)#91 | 924,665(0.00%)#5,791 |
| 92. | Spanish Lake | 11 | 10,331(0.11%)#92 | 924,665(0.00%)#5,807 |
| 93. | Troy | 11 | 10,331(0.11%)#93 | 924,665(0.00%)#5,823 |
| 94. | Hermann | 11 | 10,331(0.11%)#94 | 924,665(0.00%)#5,949 |
| 95. | Oak Grove Village | 11 | 10,331(0.11%)#95 | 924,665(0.00%)#6,026 |
| 96. | Affton | 10 | 10,331(0.10%)#96 | 924,665(0.00%)#6,043 |
| 97. | West Plains | 10 | 10,331(0.10%)#97 | 924,665(0.00%)#6,071 |
| 98. | Riverside | 10 | 10,331(0.10%)#98 | 924,665(0.00%)#6,148 |
| 99. | St Paul | 10 | 10,331(0.10%)#99 | 924,665(0.00%)#6,169 |
| 100. | Bethany | 10 | 10,331(0.10%)#100 | 924,665(0.00%)#6,170 |
Common Questions
What are the Top 10 Cities with the Most Immigrants from Western Europe in Missouri?
Top 10 Cities with the Most Immigrants from Western Europe in Missouri are:
#1
817
#2
618
#3
464
#4
296
#5
260
#6
234
#7
201
#8
185
#9
173
#10
173
What city has the Most Immigrants from Western Europe in Missouri?
St Louis has the Most Immigrants from Western Europe in Missouri with 817.
What is the Total Immigrants from Western Europe in the State of Missouri?
Total Immigrants from Western Europe in Missouri is 10,331.
What is the Total Immigrants from Western Europe in the United States?
Total Immigrants from Western Europe in the United States is 924,665.