Cities with the Most Immigrants from Western Europe in Tennessee
RELATED REPORTS & OPTIONS
Western Europe
Tennessee
Compare Cities
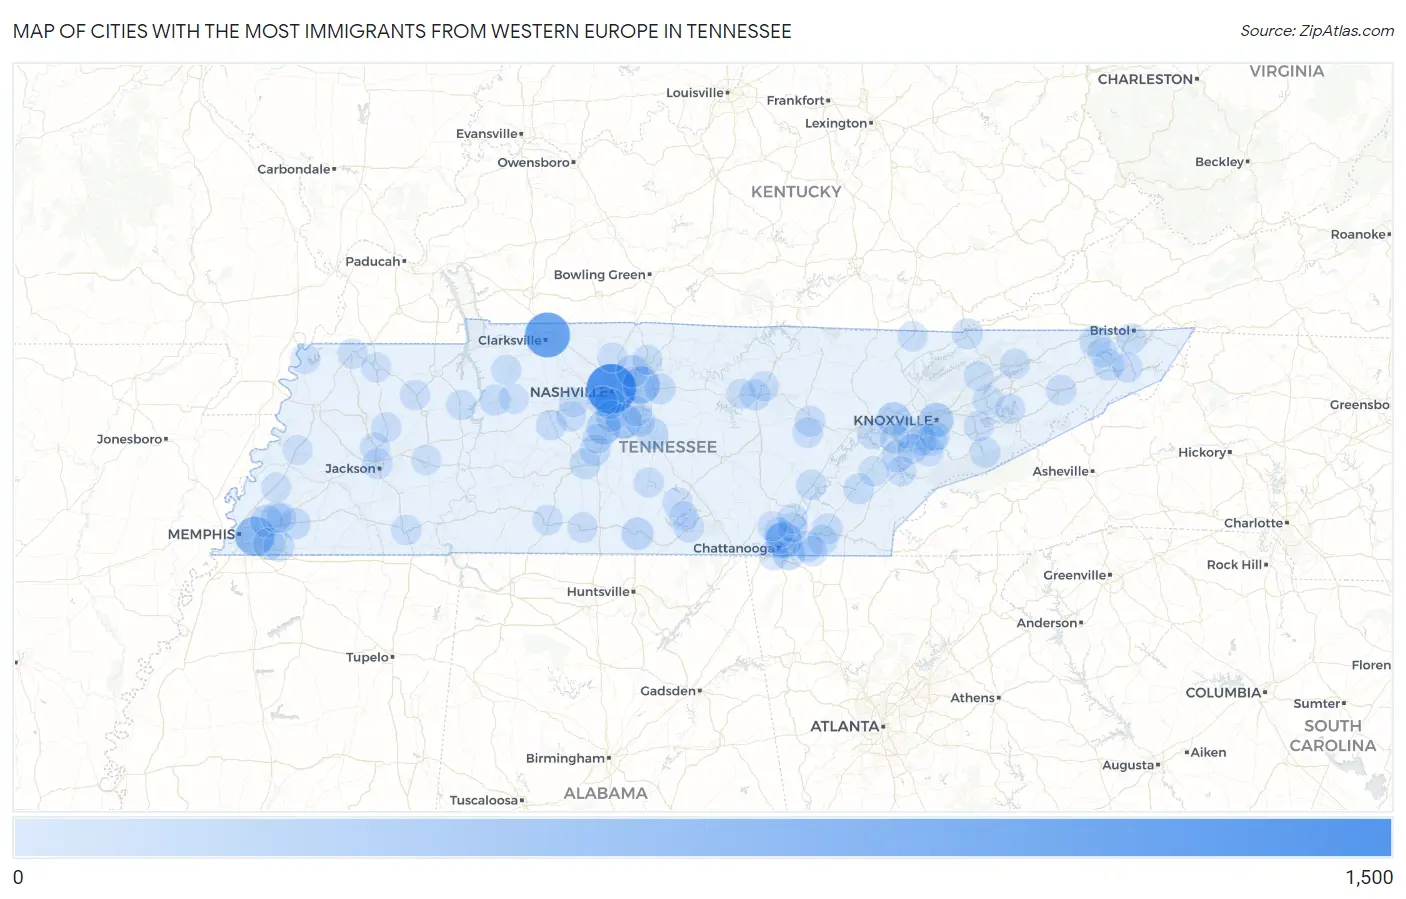
Map of Cities with the Most Immigrants from Western Europe in Tennessee
0
1,500
Cities with the Most Immigrants from Western Europe in Tennessee
| City | Western Europe | vs State | vs National | |
| 1. | Nashville | 1,223 | 11,524(10.61%)#1 | 924,665(0.13%)#55 |
| 2. | Clarksville | 929 | 11,524(8.06%)#2 | 924,665(0.10%)#84 |
| 3. | Memphis | 569 | 11,524(4.94%)#3 | 924,665(0.06%)#171 |
| 4. | Mount Juliet | 421 | 11,524(3.65%)#4 | 924,665(0.05%)#247 |
| 5. | Chattanooga | 368 | 11,524(3.19%)#5 | 924,665(0.04%)#292 |
| 6. | Nolensville | 318 | 11,524(2.76%)#6 | 924,665(0.03%)#378 |
| 7. | Knoxville | 264 | 11,524(2.29%)#7 | 924,665(0.03%)#466 |
| 8. | Franklin | 241 | 11,524(2.09%)#8 | 924,665(0.03%)#526 |
| 9. | Oak Ridge | 209 | 11,524(1.81%)#9 | 924,665(0.02%)#629 |
| 10. | Hendersonville | 156 | 11,524(1.35%)#10 | 924,665(0.02%)#873 |
| 11. | Bartlett | 146 | 11,524(1.27%)#11 | 924,665(0.02%)#940 |
| 12. | Fayetteville | 139 | 11,524(1.21%)#12 | 924,665(0.02%)#1,002 |
| 13. | East Ridge | 136 | 11,524(1.18%)#13 | 924,665(0.01%)#1,020 |
| 14. | Germantown | 112 | 11,524(0.97%)#14 | 924,665(0.01%)#1,246 |
| 15. | Murfreesboro | 106 | 11,524(0.92%)#15 | 924,665(0.01%)#1,317 |
| 16. | Tellico Village | 100 | 11,524(0.87%)#16 | 924,665(0.01%)#1,411 |
| 17. | Brentwood | 83 | 11,524(0.72%)#17 | 924,665(0.01%)#1,638 |
| 18. | Alcoa | 82 | 11,524(0.71%)#18 | 924,665(0.01%)#1,664 |
| 19. | Johnson City | 80 | 11,524(0.69%)#19 | 924,665(0.01%)#1,693 |
| 20. | Oakland | 75 | 11,524(0.65%)#20 | 924,665(0.01%)#1,795 |
| 21. | Kingsport | 72 | 11,524(0.62%)#21 | 924,665(0.01%)#1,849 |
| 22. | Lebanon | 68 | 11,524(0.59%)#22 | 924,665(0.01%)#1,948 |
| 23. | Collegedale | 66 | 11,524(0.57%)#23 | 924,665(0.01%)#2,004 |
| 24. | Spring Hill | 61 | 11,524(0.53%)#24 | 924,665(0.01%)#2,138 |
| 25. | Collierville | 61 | 11,524(0.53%)#25 | 924,665(0.01%)#2,139 |
| 26. | Cookeville | 58 | 11,524(0.50%)#26 | 924,665(0.01%)#2,228 |
| 27. | Waverly | 58 | 11,524(0.50%)#27 | 924,665(0.01%)#2,247 |
| 28. | Smyrna | 57 | 11,524(0.49%)#28 | 924,665(0.01%)#2,250 |
| 29. | Oak Hill | 57 | 11,524(0.49%)#29 | 924,665(0.01%)#2,274 |
| 30. | Columbia | 54 | 11,524(0.47%)#30 | 924,665(0.01%)#2,354 |
| 31. | Farragut | 54 | 11,524(0.47%)#31 | 924,665(0.01%)#2,361 |
| 32. | Lakeland | 54 | 11,524(0.47%)#32 | 924,665(0.01%)#2,368 |
| 33. | Athens | 53 | 11,524(0.46%)#33 | 924,665(0.01%)#2,399 |
| 34. | Louisville | 52 | 11,524(0.45%)#34 | 924,665(0.01%)#2,457 |
| 35. | Harrogate | 49 | 11,524(0.43%)#35 | 924,665(0.01%)#2,557 |
| 36. | Powell | 47 | 11,524(0.41%)#36 | 924,665(0.01%)#2,615 |
| 37. | Rarity Bay | 45 | 11,524(0.39%)#37 | 924,665(0.00%)#2,729 |
| 38. | Cleveland | 39 | 11,524(0.34%)#38 | 924,665(0.00%)#2,974 |
| 39. | Crossville | 39 | 11,524(0.34%)#39 | 924,665(0.00%)#2,997 |
| 40. | Jackson | 38 | 11,524(0.33%)#40 | 924,665(0.00%)#3,030 |
| 41. | Greeneville | 35 | 11,524(0.30%)#41 | 924,665(0.00%)#3,232 |
| 42. | South Cleveland | 34 | 11,524(0.30%)#42 | 924,665(0.00%)#3,295 |
| 43. | Dayton | 34 | 11,524(0.30%)#43 | 924,665(0.00%)#3,296 |
| 44. | Kingston | 34 | 11,524(0.30%)#44 | 924,665(0.00%)#3,299 |
| 45. | Gatlinburg | 33 | 11,524(0.29%)#45 | 924,665(0.00%)#3,367 |
| 46. | Bon Aqua Junction | 33 | 11,524(0.29%)#46 | 924,665(0.00%)#3,378 |
| 47. | Bristol | 32 | 11,524(0.28%)#47 | 924,665(0.00%)#3,389 |
| 48. | Lynchburg | 30 | 11,524(0.26%)#48 | 924,665(0.00%)#3,581 |
| 49. | Lawrenceburg | 29 | 11,524(0.25%)#49 | 924,665(0.00%)#3,639 |
| 50. | Mckenzie | 28 | 11,524(0.24%)#50 | 924,665(0.00%)#3,745 |
| 51. | Red Bank | 27 | 11,524(0.23%)#51 | 924,665(0.00%)#3,792 |
| 52. | Lake Tansi | 26 | 11,524(0.23%)#52 | 924,665(0.00%)#3,897 |
| 53. | Selmer | 26 | 11,524(0.23%)#53 | 924,665(0.00%)#3,898 |
| 54. | Algood | 26 | 11,524(0.23%)#54 | 924,665(0.00%)#3,902 |
| 55. | Sevierville | 25 | 11,524(0.22%)#55 | 924,665(0.00%)#3,935 |
| 56. | Elizabethton | 24 | 11,524(0.21%)#56 | 924,665(0.00%)#4,035 |
| 57. | Arlington | 23 | 11,524(0.20%)#57 | 924,665(0.00%)#4,123 |
| 58. | Winchester | 22 | 11,524(0.19%)#58 | 924,665(0.00%)#4,236 |
| 59. | Pulaski | 21 | 11,524(0.18%)#59 | 924,665(0.00%)#4,341 |
| 60. | Maryville | 19 | 11,524(0.16%)#60 | 924,665(0.00%)#4,560 |
| 61. | Shelbyville | 18 | 11,524(0.16%)#61 | 924,665(0.00%)#4,684 |
| 62. | Tullahoma | 18 | 11,524(0.16%)#62 | 924,665(0.00%)#4,688 |
| 63. | Union City | 17 | 11,524(0.15%)#63 | 924,665(0.00%)#4,861 |
| 64. | Sweetwater | 17 | 11,524(0.15%)#64 | 924,665(0.00%)#4,885 |
| 65. | Lookout Mountain | 17 | 11,524(0.15%)#65 | 924,665(0.00%)#4,930 |
| 66. | Jellico | 17 | 11,524(0.15%)#66 | 924,665(0.00%)#4,935 |
| 67. | Soddy Daisy | 16 | 11,524(0.14%)#67 | 924,665(0.00%)#4,984 |
| 68. | Gallatin | 15 | 11,524(0.13%)#68 | 924,665(0.00%)#5,095 |
| 69. | Lenoir City | 15 | 11,524(0.13%)#69 | 924,665(0.00%)#5,131 |
| 70. | Jefferson City | 15 | 11,524(0.13%)#70 | 924,665(0.00%)#5,136 |
| 71. | Walden | 15 | 11,524(0.13%)#71 | 924,665(0.00%)#5,227 |
| 72. | Fairview | 14 | 11,524(0.12%)#72 | 924,665(0.00%)#5,302 |
| 73. | Apison | 13 | 11,524(0.11%)#73 | 924,665(0.00%)#5,510 |
| 74. | Erin | 13 | 11,524(0.11%)#74 | 924,665(0.00%)#5,570 |
| 75. | Milan | 12 | 11,524(0.10%)#75 | 924,665(0.00%)#5,655 |
| 76. | Camden | 12 | 11,524(0.10%)#76 | 924,665(0.00%)#5,706 |
| 77. | La Vergne | 11 | 11,524(0.10%)#77 | 924,665(0.00%)#5,792 |
| 78. | Middle Valley | 11 | 11,524(0.10%)#78 | 924,665(0.00%)#5,833 |
| 79. | Thompson S Station | 11 | 11,524(0.10%)#79 | 924,665(0.00%)#5,869 |
| 80. | Belle Meade | 11 | 11,524(0.10%)#80 | 924,665(0.00%)#5,929 |
| 81. | Baneberry | 11 | 11,524(0.10%)#81 | 924,665(0.00%)#6,020 |
| 82. | Tiptonville | 10 | 11,524(0.09%)#82 | 924,665(0.00%)#6,153 |
| 83. | Brighton | 10 | 11,524(0.09%)#83 | 924,665(0.00%)#6,176 |
| 84. | Spurgeon | 9 | 11,524(0.08%)#84 | 924,665(0.00%)#6,385 |
| 85. | Mcewen | 9 | 11,524(0.08%)#85 | 924,665(0.00%)#6,454 |
| 86. | Mooresburg | 9 | 11,524(0.08%)#86 | 924,665(0.00%)#6,523 |
| 87. | Lexington | 8 | 11,524(0.07%)#87 | 924,665(0.00%)#6,610 |
| 88. | Rutledge | 8 | 11,524(0.07%)#88 | 924,665(0.00%)#6,751 |
| 89. | Friendsville | 8 | 11,524(0.07%)#89 | 924,665(0.00%)#6,782 |
| 90. | Estill Springs | 7 | 11,524(0.06%)#90 | 924,665(0.00%)#6,982 |
| 91. | Lone Oak | 7 | 11,524(0.06%)#91 | 924,665(0.00%)#7,015 |
| 92. | Delano | 7 | 11,524(0.06%)#92 | 924,665(0.00%)#7,057 |
| 93. | Three Way | 6 | 11,524(0.05%)#93 | 924,665(0.00%)#7,264 |
| 94. | Vonore | 6 | 11,524(0.05%)#94 | 924,665(0.00%)#7,266 |
| 95. | Rockford | 6 | 11,524(0.05%)#95 | 924,665(0.00%)#7,334 |
| 96. | Martin | 5 | 11,524(0.04%)#96 | 924,665(0.00%)#7,400 |
| 97. | Ripley | 5 | 11,524(0.04%)#97 | 924,665(0.00%)#7,422 |
| 98. | Baxter | 5 | 11,524(0.04%)#98 | 924,665(0.00%)#7,572 |
| 99. | Kingston Springs | 4 | 11,524(0.03%)#99 | 924,665(0.00%)#7,762 |
| 100. | Ridgetop | 4 | 11,524(0.03%)#100 | 924,665(0.00%)#7,785 |
Common Questions
What are the Top 10 Cities with the Most Immigrants from Western Europe in Tennessee?
Top 10 Cities with the Most Immigrants from Western Europe in Tennessee are:
#1
1,223
#2
929
#3
569
#4
421
#5
368
#6
318
#7
264
#8
241
#9
209
#10
156
What city has the Most Immigrants from Western Europe in Tennessee?
Nashville has the Most Immigrants from Western Europe in Tennessee with 1,223.
What is the Total Immigrants from Western Europe in the State of Tennessee?
Total Immigrants from Western Europe in Tennessee is 11,524.
What is the Total Immigrants from Western Europe in the United States?
Total Immigrants from Western Europe in the United States is 924,665.