Cities with the Most Immigrants from Western Europe in New York
RELATED REPORTS & OPTIONS
Western Europe
New York
Compare Cities
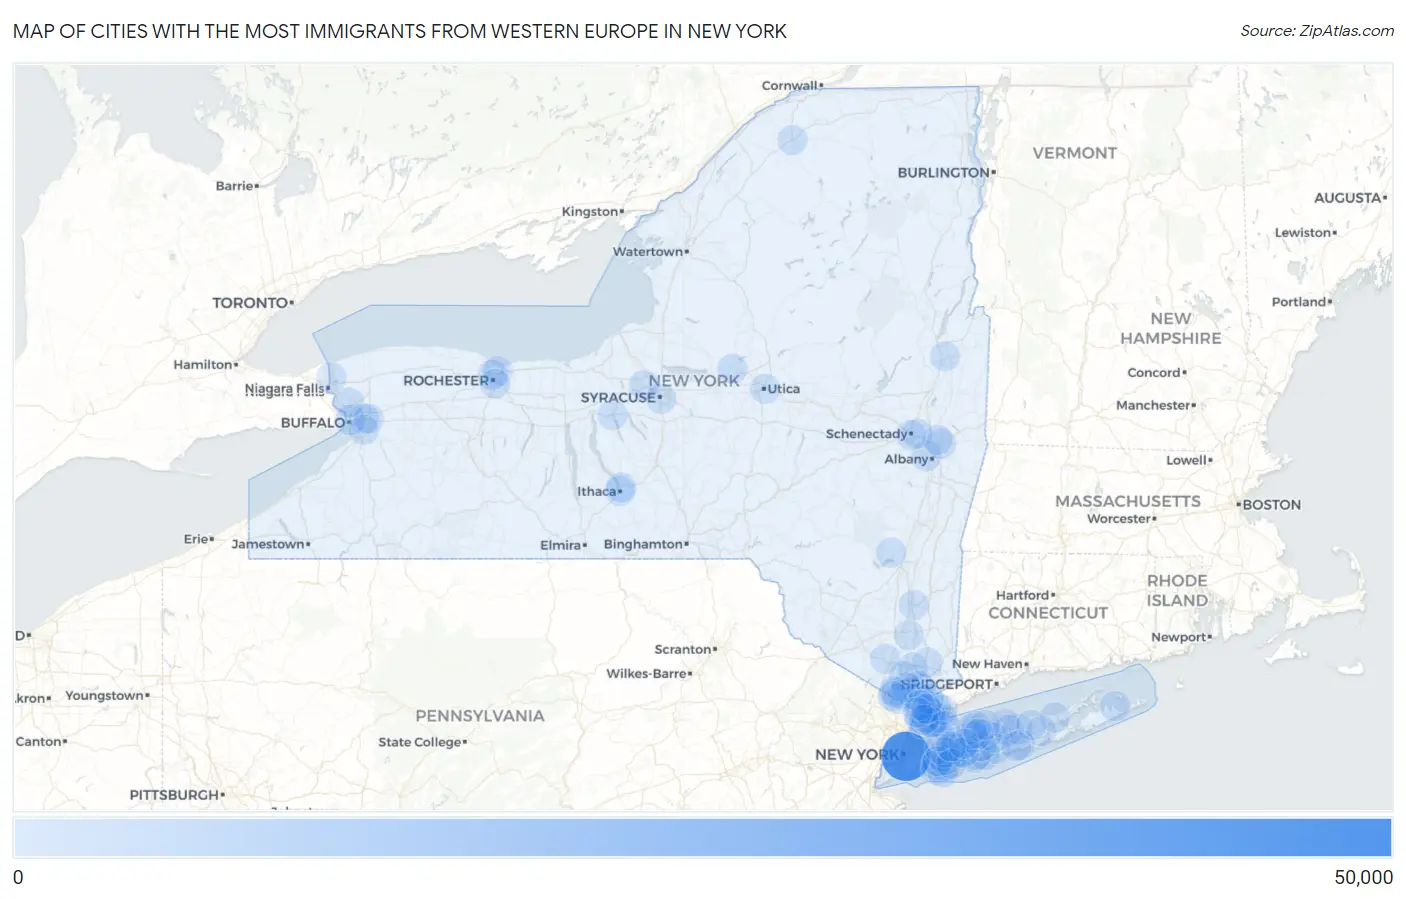
Map of Cities with the Most Immigrants from Western Europe in New York
0
50,000
Cities with the Most Immigrants from Western Europe in New York
| City | Western Europe | vs State | vs National | |
| 1. | New York | 44,937 | 84,138(53.41%)#1 | 924,665(4.86%)#1 |
| 2. | Buffalo | 633 | 84,138(0.75%)#2 | 924,665(0.07%)#151 |
| 3. | Yonkers | 596 | 84,138(0.71%)#3 | 924,665(0.06%)#161 |
| 4. | White Plains | 540 | 84,138(0.64%)#4 | 924,665(0.06%)#182 |
| 5. | New Rochelle | 489 | 84,138(0.58%)#5 | 924,665(0.05%)#199 |
| 6. | Albany | 445 | 84,138(0.53%)#6 | 924,665(0.05%)#227 |
| 7. | Mamaroneck | 441 | 84,138(0.52%)#7 | 924,665(0.05%)#230 |
| 8. | Syracuse | 318 | 84,138(0.38%)#8 | 924,665(0.03%)#376 |
| 9. | Cheektowaga | 318 | 84,138(0.38%)#9 | 924,665(0.03%)#377 |
| 10. | Rochester | 317 | 84,138(0.38%)#10 | 924,665(0.03%)#379 |
| 11. | Stony Point | 286 | 84,138(0.34%)#11 | 924,665(0.03%)#427 |
| 12. | Rye | 279 | 84,138(0.33%)#12 | 924,665(0.03%)#438 |
| 13. | Monsey | 274 | 84,138(0.33%)#13 | 924,665(0.03%)#450 |
| 14. | Coram | 257 | 84,138(0.31%)#14 | 924,665(0.03%)#486 |
| 15. | Lawrence | 240 | 84,138(0.29%)#15 | 924,665(0.03%)#531 |
| 16. | Lewiston | 216 | 84,138(0.26%)#16 | 924,665(0.02%)#611 |
| 17. | Irondequoit | 210 | 84,138(0.25%)#17 | 924,665(0.02%)#623 |
| 18. | Dobbs Ferry | 205 | 84,138(0.24%)#18 | 924,665(0.02%)#641 |
| 19. | Hicksville | 200 | 84,138(0.24%)#19 | 924,665(0.02%)#657 |
| 20. | Chestnut Ridge | 197 | 84,138(0.23%)#20 | 924,665(0.02%)#671 |
| 21. | Utica | 189 | 84,138(0.22%)#21 | 924,665(0.02%)#712 |
| 22. | Harrison | 186 | 84,138(0.22%)#22 | 924,665(0.02%)#730 |
| 23. | Scarsdale | 178 | 84,138(0.21%)#23 | 924,665(0.02%)#757 |
| 24. | Lindenhurst | 176 | 84,138(0.21%)#24 | 924,665(0.02%)#768 |
| 25. | Ithaca | 174 | 84,138(0.21%)#25 | 924,665(0.02%)#777 |
| 26. | Centereach | 173 | 84,138(0.21%)#26 | 924,665(0.02%)#780 |
| 27. | Commack | 171 | 84,138(0.20%)#27 | 924,665(0.02%)#787 |
| 28. | Ossining | 167 | 84,138(0.20%)#28 | 924,665(0.02%)#816 |
| 29. | Jericho | 167 | 84,138(0.20%)#29 | 924,665(0.02%)#817 |
| 30. | East Patchogue | 165 | 84,138(0.20%)#30 | 924,665(0.02%)#828 |
| 31. | Kiryas Joel | 158 | 84,138(0.19%)#31 | 924,665(0.02%)#862 |
| 32. | Viola | 158 | 84,138(0.19%)#32 | 924,665(0.02%)#864 |
| 33. | Springs | 152 | 84,138(0.18%)#33 | 924,665(0.02%)#898 |
| 34. | Stony Brook University | 149 | 84,138(0.18%)#34 | 924,665(0.02%)#925 |
| 35. | Woodmere | 148 | 84,138(0.18%)#35 | 924,665(0.02%)#931 |
| 36. | Cayuga Heights | 148 | 84,138(0.18%)#36 | 924,665(0.02%)#933 |
| 37. | Oceanside | 145 | 84,138(0.17%)#37 | 924,665(0.02%)#953 |
| 38. | Auburn | 145 | 84,138(0.17%)#38 | 924,665(0.02%)#954 |
| 39. | Mount Vernon | 140 | 84,138(0.17%)#39 | 924,665(0.02%)#986 |
| 40. | Tonawanda | 140 | 84,138(0.17%)#40 | 924,665(0.02%)#987 |
| 41. | Poughkeepsie | 135 | 84,138(0.16%)#41 | 924,665(0.01%)#1,028 |
| 42. | Long Beach | 132 | 84,138(0.16%)#42 | 924,665(0.01%)#1,049 |
| 43. | Eastchester | 132 | 84,138(0.16%)#43 | 924,665(0.01%)#1,051 |
| 44. | East Meadow | 128 | 84,138(0.15%)#44 | 924,665(0.01%)#1,080 |
| 45. | Levittown | 127 | 84,138(0.15%)#45 | 924,665(0.01%)#1,089 |
| 46. | West Islip | 125 | 84,138(0.15%)#46 | 924,665(0.01%)#1,107 |
| 47. | Franklin Square | 123 | 84,138(0.15%)#47 | 924,665(0.01%)#1,124 |
| 48. | Manorville | 122 | 84,138(0.14%)#48 | 924,665(0.01%)#1,133 |
| 49. | Troy | 121 | 84,138(0.14%)#49 | 924,665(0.01%)#1,137 |
| 50. | Rome | 121 | 84,138(0.14%)#50 | 924,665(0.01%)#1,143 |
| 51. | West Babylon | 118 | 84,138(0.14%)#51 | 924,665(0.01%)#1,179 |
| 52. | Salisbury | 116 | 84,138(0.14%)#52 | 924,665(0.01%)#1,207 |
| 53. | Niskayuna | 110 | 84,138(0.13%)#53 | 924,665(0.01%)#1,271 |
| 54. | Islip Terrace | 110 | 84,138(0.13%)#54 | 924,665(0.01%)#1,276 |
| 55. | Glen Cove | 109 | 84,138(0.13%)#55 | 924,665(0.01%)#1,282 |
| 56. | Sleepy Hollow | 109 | 84,138(0.13%)#56 | 924,665(0.01%)#1,287 |
| 57. | Deer Park | 108 | 84,138(0.13%)#57 | 924,665(0.01%)#1,295 |
| 58. | Briarcliff Manor | 104 | 84,138(0.12%)#58 | 924,665(0.01%)#1,349 |
| 59. | Cohoes | 103 | 84,138(0.12%)#59 | 924,665(0.01%)#1,357 |
| 60. | Nanuet | 102 | 84,138(0.12%)#60 | 924,665(0.01%)#1,374 |
| 61. | South Huntington | 102 | 84,138(0.12%)#61 | 924,665(0.01%)#1,379 |
| 62. | Schenectady | 101 | 84,138(0.12%)#62 | 924,665(0.01%)#1,385 |
| 63. | Rockville Centre | 101 | 84,138(0.12%)#63 | 924,665(0.01%)#1,391 |
| 64. | Hauppauge | 101 | 84,138(0.12%)#64 | 924,665(0.01%)#1,393 |
| 65. | Greenville Cdp Westchester County | 100 | 84,138(0.12%)#65 | 924,665(0.01%)#1,410 |
| 66. | North New Hyde Park | 97 | 84,138(0.12%)#66 | 924,665(0.01%)#1,438 |
| 67. | Brighton | 94 | 84,138(0.11%)#67 | 924,665(0.01%)#1,470 |
| 68. | Huntington Station | 91 | 84,138(0.11%)#68 | 924,665(0.01%)#1,504 |
| 69. | Huntington | 91 | 84,138(0.11%)#69 | 924,665(0.01%)#1,511 |
| 70. | Port Chester | 90 | 84,138(0.11%)#70 | 924,665(0.01%)#1,521 |
| 71. | Garden City | 90 | 84,138(0.11%)#71 | 924,665(0.01%)#1,524 |
| 72. | Riverhead | 88 | 84,138(0.10%)#72 | 924,665(0.01%)#1,558 |
| 73. | Fort Salonga | 88 | 84,138(0.10%)#73 | 924,665(0.01%)#1,560 |
| 74. | Beacon | 87 | 84,138(0.10%)#74 | 924,665(0.01%)#1,572 |
| 75. | Valley Stream | 85 | 84,138(0.10%)#75 | 924,665(0.01%)#1,603 |
| 76. | Centerport | 85 | 84,138(0.10%)#76 | 924,665(0.01%)#1,614 |
| 77. | Woodstock | 85 | 84,138(0.10%)#77 | 924,665(0.01%)#1,616 |
| 78. | Freeport | 81 | 84,138(0.10%)#78 | 924,665(0.01%)#1,675 |
| 79. | New City | 81 | 84,138(0.10%)#79 | 924,665(0.01%)#1,677 |
| 80. | Port Washington | 80 | 84,138(0.10%)#80 | 924,665(0.01%)#1,701 |
| 81. | West Seneca | 79 | 84,138(0.09%)#81 | 924,665(0.01%)#1,712 |
| 82. | Depew | 79 | 84,138(0.09%)#82 | 924,665(0.01%)#1,723 |
| 83. | Larchmont | 79 | 84,138(0.09%)#83 | 924,665(0.01%)#1,728 |
| 84. | Valhalla | 79 | 84,138(0.09%)#84 | 924,665(0.01%)#1,731 |
| 85. | Peekskill | 78 | 84,138(0.09%)#85 | 924,665(0.01%)#1,741 |
| 86. | Irvington | 78 | 84,138(0.09%)#86 | 924,665(0.01%)#1,751 |
| 87. | Ridge | 76 | 84,138(0.09%)#87 | 924,665(0.01%)#1,784 |
| 88. | Bronxville | 76 | 84,138(0.09%)#88 | 924,665(0.01%)#1,788 |
| 89. | Plainedge | 75 | 84,138(0.09%)#89 | 924,665(0.01%)#1,796 |
| 90. | Potsdam | 75 | 84,138(0.09%)#90 | 924,665(0.01%)#1,797 |
| 91. | Plainview | 73 | 84,138(0.09%)#91 | 924,665(0.01%)#1,828 |
| 92. | Westbury | 73 | 84,138(0.09%)#92 | 924,665(0.01%)#1,835 |
| 93. | Hastings On Hudson | 73 | 84,138(0.09%)#93 | 924,665(0.01%)#1,840 |
| 94. | Glens Falls | 72 | 84,138(0.09%)#94 | 924,665(0.01%)#1,858 |
| 95. | Patchogue | 72 | 84,138(0.09%)#95 | 924,665(0.01%)#1,859 |
| 96. | Elwood | 72 | 84,138(0.09%)#96 | 924,665(0.01%)#1,862 |
| 97. | Hartsdale | 72 | 84,138(0.09%)#97 | 924,665(0.01%)#1,868 |
| 98. | Jefferson Valley Yorktown | 70 | 84,138(0.08%)#98 | 924,665(0.01%)#1,904 |
| 99. | Airmont | 70 | 84,138(0.08%)#99 | 924,665(0.01%)#1,907 |
| 100. | Seneca Knolls | 68 | 84,138(0.08%)#100 | 924,665(0.01%)#1,967 |
Common Questions
What are the Top 10 Cities with the Most Immigrants from Western Europe in New York?
Top 10 Cities with the Most Immigrants from Western Europe in New York are:
#1
44,937
#2
633
#3
596
#4
540
#5
489
#6
445
#7
441
#8
318
#9
318
#10
317
What city has the Most Immigrants from Western Europe in New York?
New York has the Most Immigrants from Western Europe in New York with 44,937.
What is the Total Immigrants from Western Europe in the State of New York?
Total Immigrants from Western Europe in New York is 84,138.
What is the Total Immigrants from Western Europe in the United States?
Total Immigrants from Western Europe in the United States is 924,665.