Cities with the Most Immigrants from Hong Kong in Connecticut
RELATED REPORTS & OPTIONS
Hong Kong
Connecticut
Compare Cities
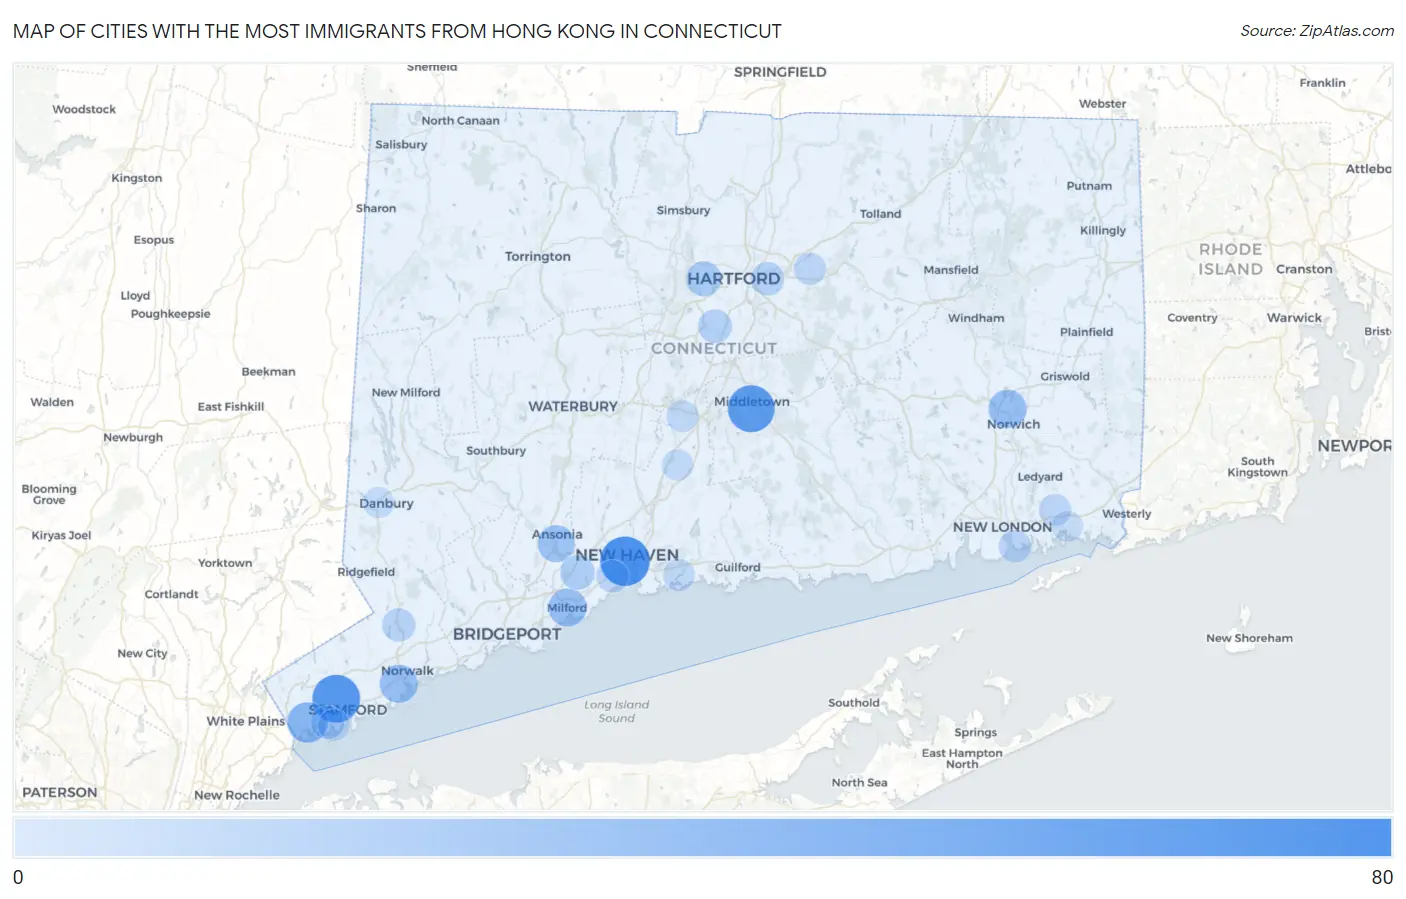
Map of Cities with the Most Immigrants from Hong Kong in Connecticut
0
80
Cities with the Most Immigrants from Hong Kong in Connecticut
| City | Hong Kong | vs State | vs National | |
| 1. | New Haven | 78 | 1,172(6.66%)#1 | 239,302(0.03%)#377 |
| 2. | Stamford | 71 | 1,172(6.06%)#2 | 239,302(0.03%)#412 |
| 3. | Middletown | 67 | 1,172(5.72%)#3 | 239,302(0.03%)#433 |
| 4. | Greenwich | 41 | 1,172(3.50%)#4 | 239,302(0.02%)#656 |
| 5. | Norwalk | 31 | 1,172(2.65%)#5 | 239,302(0.01%)#800 |
| 6. | Milford City Balance | 31 | 1,172(2.65%)#6 | 239,302(0.01%)#805 |
| 7. | Norwich | 31 | 1,172(2.65%)#7 | 239,302(0.01%)#807 |
| 8. | Derby | 27 | 1,172(2.30%)#8 | 239,302(0.01%)#892 |
| 9. | Trumbull Center | 25 | 1,172(2.13%)#9 | 239,302(0.01%)#952 |
| 10. | Noroton | 25 | 1,172(2.13%)#10 | 239,302(0.01%)#957 |
| 11. | New Canaan | 23 | 1,172(1.96%)#11 | 239,302(0.01%)#1,001 |
| 12. | Staples | 22 | 1,172(1.88%)#12 | 239,302(0.01%)#1,037 |
| 13. | West Hartford | 19 | 1,172(1.62%)#13 | 239,302(0.01%)#1,097 |
| 14. | Orange | 17 | 1,172(1.45%)#14 | 239,302(0.01%)#1,188 |
| 15. | Newington | 14 | 1,172(1.19%)#15 | 239,302(0.01%)#1,313 |
| 16. | East Hartford | 13 | 1,172(1.11%)#16 | 239,302(0.01%)#1,363 |
| 17. | Riverside | 12 | 1,172(1.02%)#17 | 239,302(0.01%)#1,435 |
| 18. | Wilton Center | 12 | 1,172(1.02%)#18 | 239,302(0.01%)#1,451 |
| 19. | West Haven | 9 | 1,172(0.77%)#19 | 239,302(0.00%)#1,584 |
| 20. | Groton | 9 | 1,172(0.77%)#20 | 239,302(0.00%)#1,627 |
| 21. | Coleytown | 9 | 1,172(0.77%)#21 | 239,302(0.00%)#1,639 |
| 22. | Manchester | 8 | 1,172(0.68%)#22 | 239,302(0.00%)#1,663 |
| 23. | Old Mystic | 8 | 1,172(0.68%)#23 | 239,302(0.00%)#1,695 |
| 24. | Meriden | 7 | 1,172(0.60%)#24 | 239,302(0.00%)#1,711 |
| 25. | Branford Center | 7 | 1,172(0.60%)#25 | 239,302(0.00%)#1,754 |
| 26. | Old Hill | 7 | 1,172(0.60%)#26 | 239,302(0.00%)#1,764 |
| 27. | Westport | 7 | 1,172(0.60%)#27 | 239,302(0.00%)#1,766 |
| 28. | Indian Field | 7 | 1,172(0.60%)#28 | 239,302(0.00%)#1,776 |
| 29. | Old Greenwich | 6 | 1,172(0.51%)#29 | 239,302(0.00%)#1,822 |
| 30. | Wallingford Center | 5 | 1,172(0.43%)#30 | 239,302(0.00%)#1,863 |
| 31. | Danbury | 4 | 1,172(0.34%)#31 | 239,302(0.00%)#1,897 |
| 32. | Mystic | 3 | 1,172(0.26%)#32 | 239,302(0.00%)#1,950 |
1
2Common Questions
What are the Top 10 Cities with the Most Immigrants from Hong Kong in Connecticut?
Top 10 Cities with the Most Immigrants from Hong Kong in Connecticut are:
#1
78
#2
71
#3
67
#4
41
#5
31
#6
31
#7
31
#8
27
#9
19
#10
17
What city has the Most Immigrants from Hong Kong in Connecticut?
New Haven has the Most Immigrants from Hong Kong in Connecticut with 78.
What is the Total Immigrants from Hong Kong in the State of Connecticut?
Total Immigrants from Hong Kong in Connecticut is 1,172.
What is the Total Immigrants from Hong Kong in the United States?
Total Immigrants from Hong Kong in the United States is 239,302.