Cities with the Most Immigrants from Hong Kong in Virginia
RELATED REPORTS & OPTIONS
Hong Kong
Virginia
Compare Cities
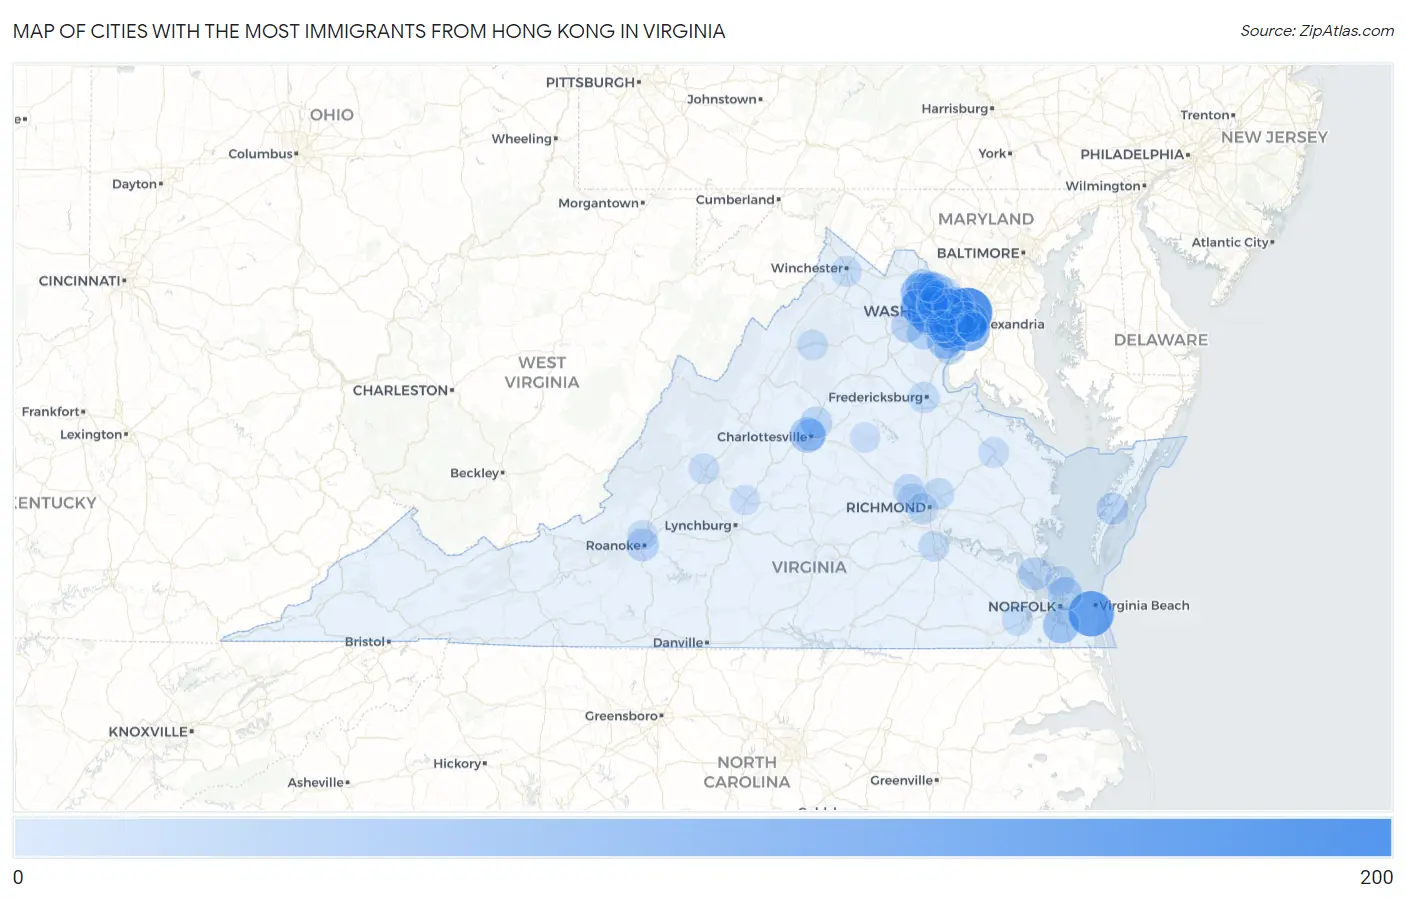
Map of Cities with the Most Immigrants from Hong Kong in Virginia
0
200
Cities with the Most Immigrants from Hong Kong in Virginia
| City | Hong Kong | vs State | vs National | |
| 1. | Arlington | 190 | 2,903(6.54%)#1 | 239,302(0.08%)#163 |
| 2. | Virginia Beach | 148 | 2,903(5.10%)#2 | 239,302(0.06%)#203 |
| 3. | Groveton | 115 | 2,903(3.96%)#3 | 239,302(0.05%)#264 |
| 4. | Alexandria | 101 | 2,903(3.48%)#4 | 239,302(0.04%)#294 |
| 5. | Chantilly | 101 | 2,903(3.48%)#5 | 239,302(0.04%)#295 |
| 6. | Burke | 95 | 2,903(3.27%)#6 | 239,302(0.04%)#311 |
| 7. | South Riding | 87 | 2,903(3.00%)#7 | 239,302(0.04%)#335 |
| 8. | Broadlands | 79 | 2,903(2.72%)#8 | 239,302(0.03%)#376 |
| 9. | Reston | 74 | 2,903(2.55%)#9 | 239,302(0.03%)#396 |
| 10. | Idylwood | 70 | 2,903(2.41%)#10 | 239,302(0.03%)#418 |
| 11. | Tysons | 67 | 2,903(2.31%)#11 | 239,302(0.03%)#434 |
| 12. | Chesapeake | 61 | 2,903(2.10%)#12 | 239,302(0.03%)#477 |
| 13. | Newington Forest | 59 | 2,903(2.03%)#13 | 239,302(0.02%)#499 |
| 14. | West Falls Church | 55 | 2,903(1.89%)#14 | 239,302(0.02%)#520 |
| 15. | Sugarland Run | 55 | 2,903(1.89%)#15 | 239,302(0.02%)#523 |
| 16. | Oakton | 52 | 2,903(1.79%)#16 | 239,302(0.02%)#543 |
| 17. | Mclean | 51 | 2,903(1.76%)#17 | 239,302(0.02%)#547 |
| 18. | Lake Ridge | 51 | 2,903(1.76%)#18 | 239,302(0.02%)#549 |
| 19. | Springfield | 51 | 2,903(1.76%)#19 | 239,302(0.02%)#550 |
| 20. | University Of Virginia | 50 | 2,903(1.72%)#20 | 239,302(0.02%)#561 |
| 21. | Ashburn | 45 | 2,903(1.55%)#21 | 239,302(0.02%)#616 |
| 22. | North Springfield | 45 | 2,903(1.55%)#22 | 239,302(0.02%)#622 |
| 23. | Fair Oaks | 40 | 2,903(1.38%)#23 | 239,302(0.02%)#665 |
| 24. | Fairfax | 39 | 2,903(1.34%)#24 | 239,302(0.02%)#679 |
| 25. | Belmont | 39 | 2,903(1.34%)#25 | 239,302(0.02%)#681 |
| 26. | South Run | 39 | 2,903(1.34%)#26 | 239,302(0.02%)#683 |
| 27. | Lincolnia | 36 | 2,903(1.24%)#27 | 239,302(0.02%)#730 |
| 28. | Norfolk | 35 | 2,903(1.21%)#28 | 239,302(0.01%)#738 |
| 29. | Manassas | 35 | 2,903(1.21%)#29 | 239,302(0.01%)#742 |
| 30. | Centreville | 31 | 2,903(1.07%)#30 | 239,302(0.01%)#803 |
| 31. | Rose Hill Cdp Fairfax County | 31 | 2,903(1.07%)#31 | 239,302(0.01%)#812 |
| 32. | Newport News | 28 | 2,903(0.96%)#32 | 239,302(0.01%)#866 |
| 33. | George Mason | 28 | 2,903(0.96%)#33 | 239,302(0.01%)#879 |
| 34. | Great Falls | 27 | 2,903(0.93%)#34 | 239,302(0.01%)#891 |
| 35. | Roanoke | 26 | 2,903(0.90%)#35 | 239,302(0.01%)#909 |
| 36. | Gainesville | 25 | 2,903(0.86%)#36 | 239,302(0.01%)#949 |
| 37. | Brambleton | 24 | 2,903(0.83%)#37 | 239,302(0.01%)#970 |
| 38. | Stone Ridge | 22 | 2,903(0.76%)#38 | 239,302(0.01%)#1,033 |
| 39. | Long Branch | 21 | 2,903(0.72%)#39 | 239,302(0.01%)#1,062 |
| 40. | Charlottesville | 19 | 2,903(0.65%)#40 | 239,302(0.01%)#1,100 |
| 41. | Hollymead | 19 | 2,903(0.65%)#41 | 239,302(0.01%)#1,122 |
| 42. | Exmore | 19 | 2,903(0.65%)#42 | 239,302(0.01%)#1,128 |
| 43. | Herndon | 18 | 2,903(0.62%)#43 | 239,302(0.01%)#1,148 |
| 44. | Franklin Farm | 18 | 2,903(0.62%)#44 | 239,302(0.01%)#1,153 |
| 45. | Kingstowne | 18 | 2,903(0.62%)#45 | 239,302(0.01%)#1,154 |
| 46. | Navy | 17 | 2,903(0.59%)#46 | 239,302(0.01%)#1,205 |
| 47. | Woodbridge | 16 | 2,903(0.55%)#47 | 239,302(0.01%)#1,218 |
| 48. | Short Pump | 16 | 2,903(0.55%)#48 | 239,302(0.01%)#1,224 |
| 49. | Burke Centre | 16 | 2,903(0.55%)#49 | 239,302(0.01%)#1,229 |
| 50. | Sterling | 15 | 2,903(0.52%)#50 | 239,302(0.01%)#1,269 |
| 51. | Mechanicsville | 14 | 2,903(0.48%)#51 | 239,302(0.01%)#1,309 |
| 52. | Floris | 13 | 2,903(0.45%)#52 | 239,302(0.01%)#1,391 |
| 53. | Richmond | 12 | 2,903(0.41%)#53 | 239,302(0.01%)#1,405 |
| 54. | Fredericksburg | 12 | 2,903(0.41%)#54 | 239,302(0.01%)#1,417 |
| 55. | Dranesville | 11 | 2,903(0.38%)#55 | 239,302(0.00%)#1,493 |
| 56. | Countryside | 11 | 2,903(0.38%)#56 | 239,302(0.00%)#1,497 |
| 57. | Suffolk | 10 | 2,903(0.34%)#57 | 239,302(0.00%)#1,526 |
| 58. | Bailey S Crossroads | 10 | 2,903(0.34%)#58 | 239,302(0.00%)#1,541 |
| 59. | Difficult Run | 10 | 2,903(0.34%)#59 | 239,302(0.00%)#1,559 |
| 60. | Winchester | 9 | 2,903(0.31%)#60 | 239,302(0.00%)#1,603 |
| 61. | Leesylvania | 9 | 2,903(0.31%)#61 | 239,302(0.00%)#1,606 |
| 62. | Colonial Heights | 9 | 2,903(0.31%)#62 | 239,302(0.00%)#1,612 |
| 63. | Vienna | 9 | 2,903(0.31%)#63 | 239,302(0.00%)#1,613 |
| 64. | Huntington | 9 | 2,903(0.31%)#64 | 239,302(0.00%)#1,619 |
| 65. | Fairfax Station | 9 | 2,903(0.31%)#65 | 239,302(0.00%)#1,623 |
| 66. | Mcnair | 8 | 2,903(0.28%)#66 | 239,302(0.00%)#1,678 |
| 67. | Wolf Trap | 7 | 2,903(0.24%)#67 | 239,302(0.00%)#1,740 |
| 68. | East Lexington | 7 | 2,903(0.24%)#68 | 239,302(0.00%)#1,768 |
| 69. | Tappahannock | 7 | 2,903(0.24%)#69 | 239,302(0.00%)#1,769 |
| 70. | Tuckahoe | 6 | 2,903(0.21%)#70 | 239,302(0.00%)#1,788 |
| 71. | University Center | 6 | 2,903(0.21%)#71 | 239,302(0.00%)#1,829 |
| 72. | Luray | 5 | 2,903(0.17%)#72 | 239,302(0.00%)#1,878 |
| 73. | Braddock | 4 | 2,903(0.14%)#73 | 239,302(0.00%)#1,917 |
| 74. | Amherst | 4 | 2,903(0.14%)#74 | 239,302(0.00%)#1,922 |
| 75. | Hampton | 3 | 2,903(0.10%)#75 | 239,302(0.00%)#1,932 |
| 76. | Hollins | 3 | 2,903(0.10%)#76 | 239,302(0.00%)#1,942 |
| 77. | Louisa | 3 | 2,903(0.10%)#77 | 239,302(0.00%)#1,957 |
| 78. | Belle Haven | 1 | 2,903(0.03%)#78 | 239,302(0.00%)#2,023 |
Common Questions
What are the Top 10 Cities with the Most Immigrants from Hong Kong in Virginia?
Top 10 Cities with the Most Immigrants from Hong Kong in Virginia are:
#1
190
#2
148
#3
115
#4
101
#5
101
#6
95
#7
87
#8
79
#9
74
#10
70
What city has the Most Immigrants from Hong Kong in Virginia?
Arlington has the Most Immigrants from Hong Kong in Virginia with 190.
What is the Total Immigrants from Hong Kong in the State of Virginia?
Total Immigrants from Hong Kong in Virginia is 2,903.
What is the Total Immigrants from Hong Kong in the United States?
Total Immigrants from Hong Kong in the United States is 239,302.