Cities with the Most Immigrants from Hong Kong in Minnesota
RELATED REPORTS & OPTIONS
Hong Kong
Minnesota
Compare Cities
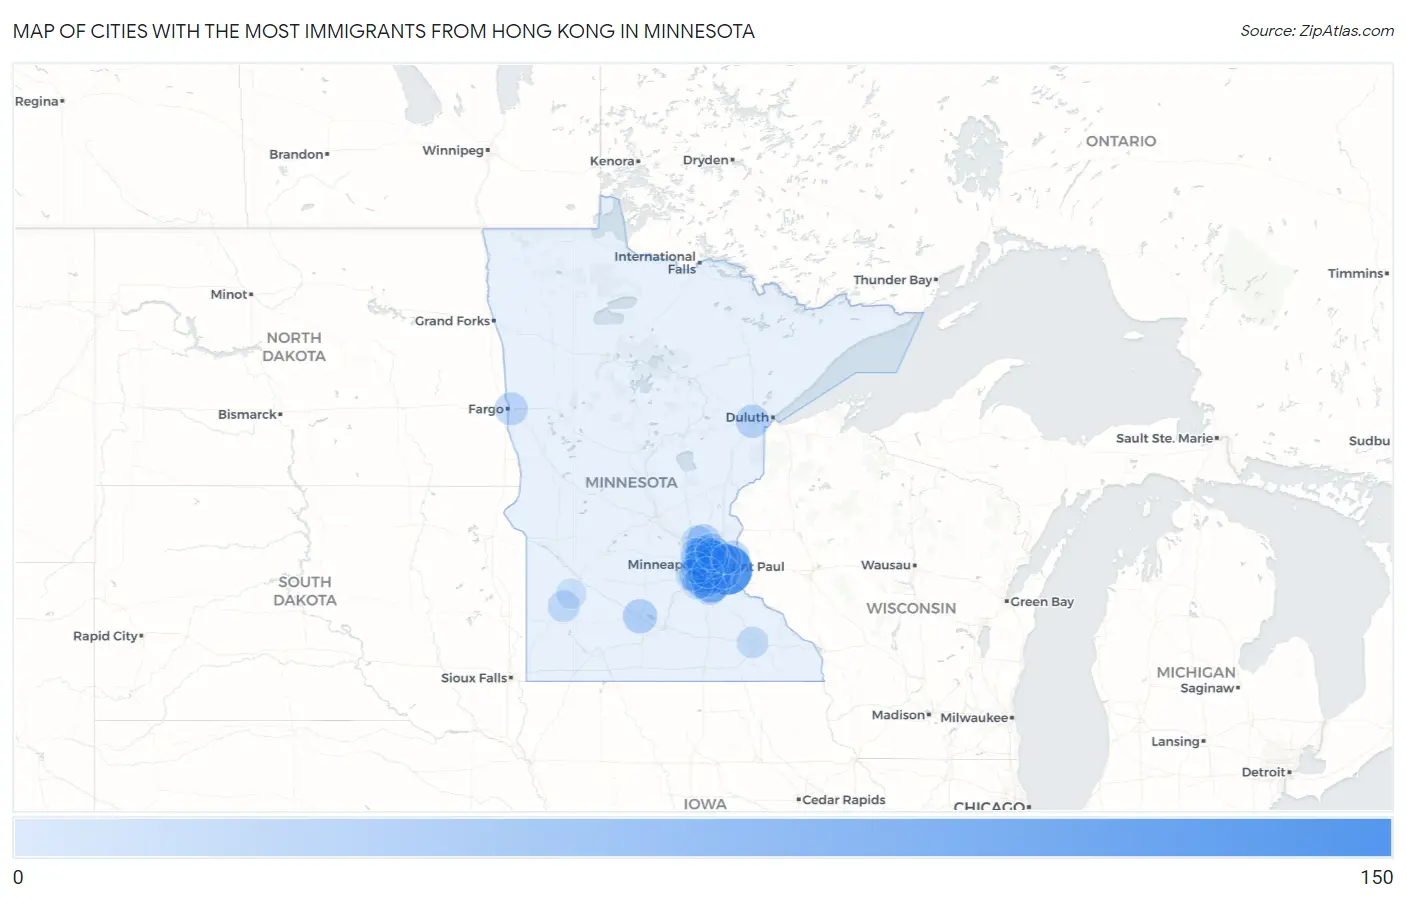
Map of Cities with the Most Immigrants from Hong Kong in Minnesota
0
150
Cities with the Most Immigrants from Hong Kong in Minnesota
| City | Hong Kong | vs State | vs National | |
| 1. | Woodbury | 135 | 1,119(12.06%)#1 | 239,302(0.06%)#220 |
| 2. | Minneapolis | 97 | 1,119(8.67%)#2 | 239,302(0.04%)#302 |
| 3. | Apple Valley | 67 | 1,119(5.99%)#3 | 239,302(0.03%)#432 |
| 4. | Brooklyn Center | 63 | 1,119(5.63%)#4 | 239,302(0.03%)#464 |
| 5. | Shoreview | 47 | 1,119(4.20%)#5 | 239,302(0.02%)#592 |
| 6. | Little Canada | 47 | 1,119(4.20%)#6 | 239,302(0.02%)#594 |
| 7. | Brooklyn Park | 41 | 1,119(3.66%)#7 | 239,302(0.02%)#649 |
| 8. | Eden Prairie | 39 | 1,119(3.49%)#8 | 239,302(0.02%)#675 |
| 9. | St Paul | 33 | 1,119(2.95%)#9 | 239,302(0.01%)#772 |
| 10. | New Brighton | 33 | 1,119(2.95%)#10 | 239,302(0.01%)#781 |
| 11. | Roseville | 32 | 1,119(2.86%)#11 | 239,302(0.01%)#791 |
| 12. | Bloomington | 29 | 1,119(2.59%)#12 | 239,302(0.01%)#848 |
| 13. | New Ulm | 28 | 1,119(2.50%)#13 | 239,302(0.01%)#877 |
| 14. | Eagan | 27 | 1,119(2.41%)#14 | 239,302(0.01%)#884 |
| 15. | Andover | 26 | 1,119(2.32%)#15 | 239,302(0.01%)#920 |
| 16. | Savage | 26 | 1,119(2.32%)#16 | 239,302(0.01%)#921 |
| 17. | Stillwater | 25 | 1,119(2.23%)#17 | 239,302(0.01%)#947 |
| 18. | Edina | 24 | 1,119(2.14%)#18 | 239,302(0.01%)#963 |
| 19. | Burnsville | 23 | 1,119(2.06%)#19 | 239,302(0.01%)#984 |
| 20. | Cloquet | 22 | 1,119(1.97%)#20 | 239,302(0.01%)#1,035 |
| 21. | St Louis Park | 20 | 1,119(1.79%)#21 | 239,302(0.01%)#1,072 |
| 22. | Moorhead | 19 | 1,119(1.70%)#22 | 239,302(0.01%)#1,101 |
| 23. | Lakeville | 18 | 1,119(1.61%)#23 | 239,302(0.01%)#1,133 |
| 24. | Golden Valley | 18 | 1,119(1.61%)#24 | 239,302(0.01%)#1,149 |
| 25. | Newport | 17 | 1,119(1.52%)#25 | 239,302(0.01%)#1,203 |
| 26. | Columbia Heights | 12 | 1,119(1.07%)#26 | 239,302(0.01%)#1,420 |
| 27. | Arden Hills | 12 | 1,119(1.07%)#27 | 239,302(0.01%)#1,433 |
| 28. | Ramsey | 11 | 1,119(0.98%)#28 | 239,302(0.00%)#1,481 |
| 29. | Marshall | 11 | 1,119(0.98%)#29 | 239,302(0.00%)#1,490 |
| 30. | Falcon Heights | 11 | 1,119(0.98%)#30 | 239,302(0.00%)#1,508 |
| 31. | Plymouth | 10 | 1,119(0.89%)#31 | 239,302(0.00%)#1,529 |
| 32. | Maple Grove | 10 | 1,119(0.89%)#32 | 239,302(0.00%)#1,530 |
| 33. | Chanhassen | 10 | 1,119(0.89%)#33 | 239,302(0.00%)#1,540 |
| 34. | Rochester | 9 | 1,119(0.80%)#34 | 239,302(0.00%)#1,580 |
| 35. | Blaine | 9 | 1,119(0.80%)#35 | 239,302(0.00%)#1,582 |
| 36. | Minnetonka | 8 | 1,119(0.71%)#36 | 239,302(0.00%)#1,656 |
| 37. | Prior Lake | 7 | 1,119(0.63%)#37 | 239,302(0.00%)#1,724 |
| 38. | Richfield | 6 | 1,119(0.54%)#38 | 239,302(0.00%)#1,794 |
| 39. | Mounds View | 6 | 1,119(0.54%)#39 | 239,302(0.00%)#1,815 |
| 40. | Cottonwood | 1 | 1,119(0.09%)#40 | 239,302(0.00%)#2,030 |
| 41. | Pine Springs | 1 | 1,119(0.09%)#41 | 239,302(0.00%)#2,040 |
Common Questions
What are the Top 10 Cities with the Most Immigrants from Hong Kong in Minnesota?
Top 10 Cities with the Most Immigrants from Hong Kong in Minnesota are:
#1
135
#2
97
#3
67
#4
63
#5
47
#6
47
#7
41
#8
39
#9
33
#10
33
What city has the Most Immigrants from Hong Kong in Minnesota?
Woodbury has the Most Immigrants from Hong Kong in Minnesota with 135.
What is the Total Immigrants from Hong Kong in the State of Minnesota?
Total Immigrants from Hong Kong in Minnesota is 1,119.
What is the Total Immigrants from Hong Kong in the United States?
Total Immigrants from Hong Kong in the United States is 239,302.