Cities with the Most Immigrants from Dominican Republic in South Carolina
RELATED REPORTS & OPTIONS
Dominican Republic
South Carolina
Compare Cities
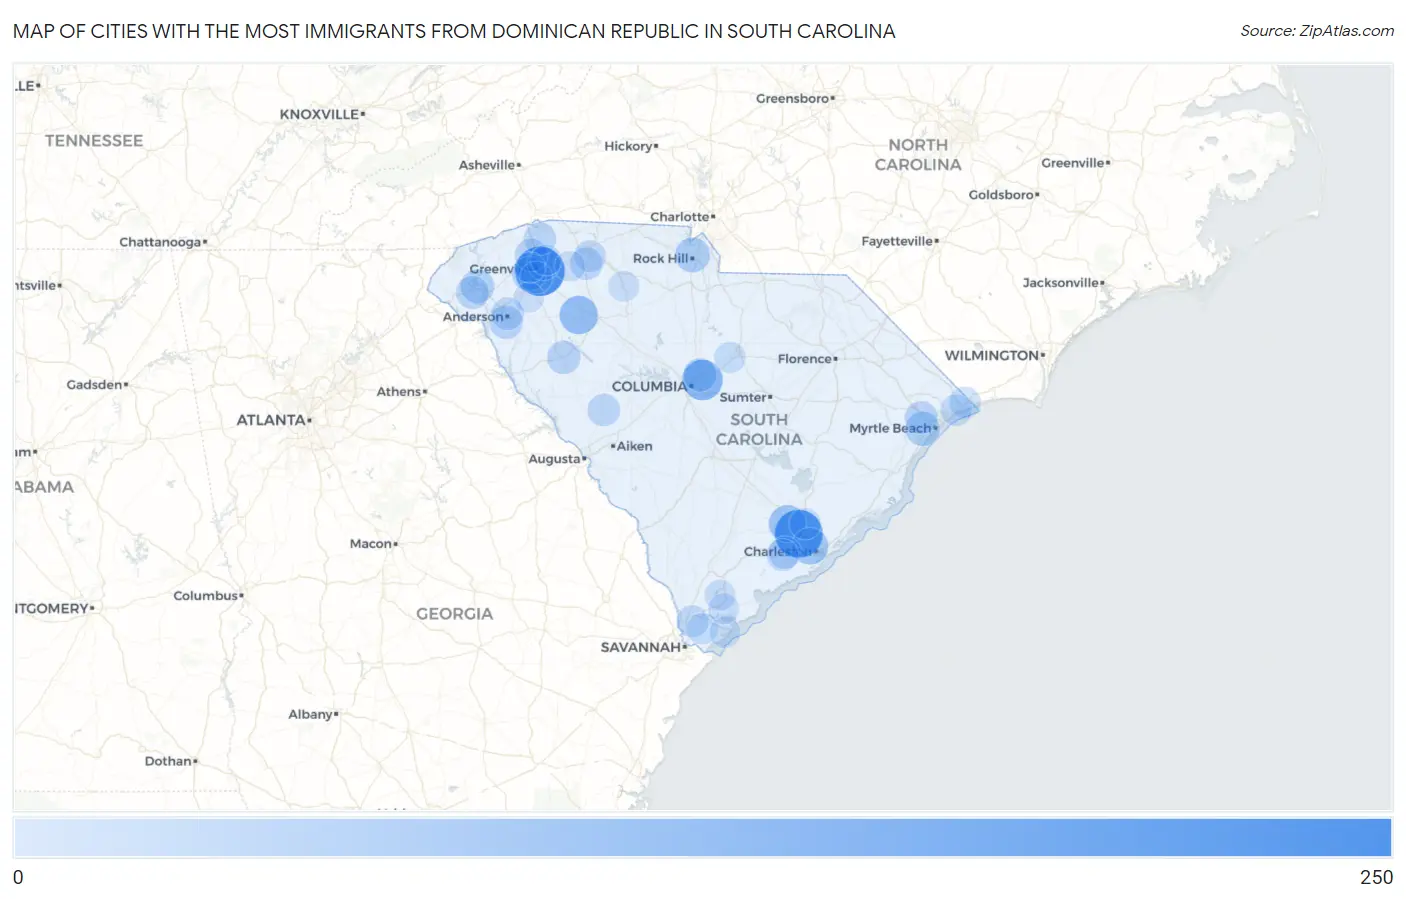
Map of Cities with the Most Immigrants from Dominican Republic in South Carolina
0
250
Cities with the Most Immigrants from Dominican Republic in South Carolina
| City | Dominican Republic | vs State | vs National | |
| 1. | Greenville | 201 | 2,357(8.53%)#1 | 1,223,316(0.02%)#452 |
| 2. | North Charleston | 183 | 2,357(7.76%)#2 | 1,223,316(0.01%)#483 |
| 3. | Columbia | 106 | 2,357(4.50%)#3 | 1,223,316(0.01%)#709 |
| 4. | Laurens | 83 | 2,357(3.52%)#4 | 1,223,316(0.01%)#848 |
| 5. | Summerville | 72 | 2,357(3.05%)#5 | 1,223,316(0.01%)#940 |
| 6. | Charleston | 65 | 2,357(2.76%)#6 | 1,223,316(0.01%)#999 |
| 7. | Rock Hill | 48 | 2,357(2.04%)#7 | 1,223,316(0.00%)#1,171 |
| 8. | Socastee | 43 | 2,357(1.82%)#8 | 1,223,316(0.00%)#1,238 |
| 9. | Welcome | 38 | 2,357(1.61%)#9 | 1,223,316(0.00%)#1,334 |
| 10. | Newry | 36 | 2,357(1.53%)#10 | 1,223,316(0.00%)#1,371 |
| 11. | Carolina Forest | 34 | 2,357(1.44%)#11 | 1,223,316(0.00%)#1,404 |
| 12. | Dentsville | 32 | 2,357(1.36%)#12 | 1,223,316(0.00%)#1,456 |
| 13. | Greenwood | 30 | 2,357(1.27%)#13 | 1,223,316(0.00%)#1,489 |
| 14. | Homeland Park | 30 | 2,357(1.27%)#14 | 1,223,316(0.00%)#1,495 |
| 15. | Red Hill | 27 | 2,357(1.15%)#15 | 1,223,316(0.00%)#1,572 |
| 16. | Seneca | 27 | 2,357(1.15%)#16 | 1,223,316(0.00%)#1,576 |
| 17. | Wade Hampton | 26 | 2,357(1.10%)#17 | 1,223,316(0.00%)#1,602 |
| 18. | Travelers Rest | 26 | 2,357(1.10%)#18 | 1,223,316(0.00%)#1,614 |
| 19. | Anderson | 25 | 2,357(1.06%)#19 | 1,223,316(0.00%)#1,635 |
| 20. | Roebuck | 23 | 2,357(0.98%)#20 | 1,223,316(0.00%)#1,696 |
| 21. | Johnston | 22 | 2,357(0.93%)#21 | 1,223,316(0.00%)#1,733 |
| 22. | Tigerville | 22 | 2,357(0.93%)#22 | 1,223,316(0.00%)#1,734 |
| 23. | Ravenel | 21 | 2,357(0.89%)#23 | 1,223,316(0.00%)#1,778 |
| 24. | Hollywood | 18 | 2,357(0.76%)#24 | 1,223,316(0.00%)#1,868 |
| 25. | Spartanburg | 17 | 2,357(0.72%)#25 | 1,223,316(0.00%)#1,890 |
| 26. | Gantt | 17 | 2,357(0.72%)#26 | 1,223,316(0.00%)#1,904 |
| 27. | Hardeeville | 16 | 2,357(0.68%)#27 | 1,223,316(0.00%)#1,954 |
| 28. | Little River | 14 | 2,357(0.59%)#28 | 1,223,316(0.00%)#2,042 |
| 29. | North Myrtle Beach | 13 | 2,357(0.55%)#29 | 1,223,316(0.00%)#2,074 |
| 30. | Goose Creek | 12 | 2,357(0.51%)#30 | 1,223,316(0.00%)#2,114 |
| 31. | Lugoff | 10 | 2,357(0.42%)#31 | 1,223,316(0.00%)#2,232 |
| 32. | Bluffton | 9 | 2,357(0.38%)#32 | 1,223,316(0.00%)#2,272 |
| 33. | Hilton Head Island | 7 | 2,357(0.30%)#33 | 1,223,316(0.00%)#2,374 |
| 34. | Taylors | 7 | 2,357(0.30%)#34 | 1,223,316(0.00%)#2,379 |
| 35. | Union | 7 | 2,357(0.30%)#35 | 1,223,316(0.00%)#2,396 |
| 36. | Laurel Bay | 7 | 2,357(0.30%)#36 | 1,223,316(0.00%)#2,408 |
| 37. | Whitney | 6 | 2,357(0.25%)#37 | 1,223,316(0.00%)#2,471 |
| 38. | Port Royal | 5 | 2,357(0.21%)#38 | 1,223,316(0.00%)#2,517 |
| 39. | Reidville | 3 | 2,357(0.13%)#39 | 1,223,316(0.00%)#2,640 |
| 40. | Pelzer | 2 | 2,357(0.08%)#40 | 1,223,316(0.00%)#2,693 |
| 41. | Parker | 1 | 2,357(0.04%)#41 | 1,223,316(0.00%)#2,723 |
Common Questions
What are the Top 10 Cities with the Most Immigrants from Dominican Republic in South Carolina?
Top 10 Cities with the Most Immigrants from Dominican Republic in South Carolina are:
#1
201
#2
183
#3
106
#4
83
#5
72
#6
65
#7
48
#8
43
#9
38
#10
36
What city has the Most Immigrants from Dominican Republic in South Carolina?
Greenville has the Most Immigrants from Dominican Republic in South Carolina with 201.
What is the Total Immigrants from Dominican Republic in the State of South Carolina?
Total Immigrants from Dominican Republic in South Carolina is 2,357.
What is the Total Immigrants from Dominican Republic in the United States?
Total Immigrants from Dominican Republic in the United States is 1,223,316.