Cities with the Most Immigrants from Dominican Republic in Connecticut
RELATED REPORTS & OPTIONS
Dominican Republic
Connecticut
Compare Cities
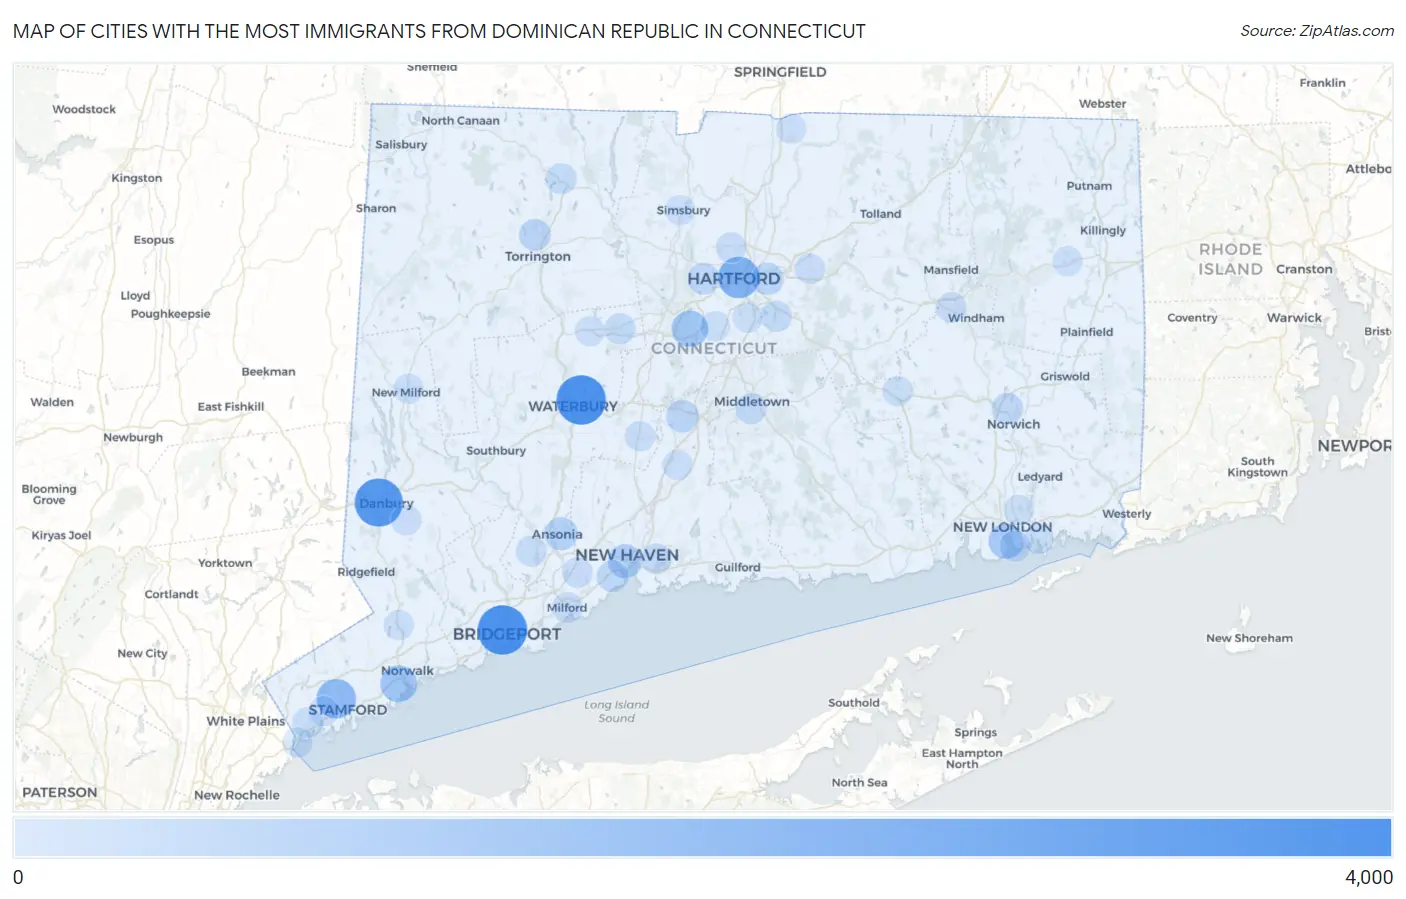
Map of Cities with the Most Immigrants from Dominican Republic in Connecticut
0
4,000
Cities with the Most Immigrants from Dominican Republic in Connecticut
| City | Dominican Republic | vs State | vs National | |
| 1. | Bridgeport | 3,949 | 27,361(14.43%)#1 | 1,223,316(0.32%)#27 |
| 2. | Waterbury | 3,928 | 27,361(14.36%)#2 | 1,223,316(0.32%)#29 |
| 3. | Danbury | 3,633 | 27,361(13.28%)#3 | 1,223,316(0.30%)#31 |
| 4. | Hartford | 2,278 | 27,361(8.33%)#4 | 1,223,316(0.19%)#49 |
| 5. | Stamford | 1,861 | 27,361(6.80%)#5 | 1,223,316(0.15%)#58 |
| 6. | Norwalk | 1,294 | 27,361(4.73%)#6 | 1,223,316(0.11%)#84 |
| 7. | New Britain | 1,240 | 27,361(4.53%)#7 | 1,223,316(0.10%)#90 |
| 8. | New London | 1,024 | 27,361(3.74%)#8 | 1,223,316(0.08%)#103 |
| 9. | New Haven | 769 | 27,361(2.81%)#9 | 1,223,316(0.06%)#139 |
| 10. | Ansonia | 608 | 27,361(2.22%)#10 | 1,223,316(0.05%)#176 |
| 11. | Meriden | 461 | 27,361(1.68%)#11 | 1,223,316(0.04%)#229 |
| 12. | East Hartford | 441 | 27,361(1.61%)#12 | 1,223,316(0.04%)#240 |
| 13. | Torrington | 362 | 27,361(1.32%)#13 | 1,223,316(0.03%)#278 |
| 14. | Norwich | 308 | 27,361(1.13%)#14 | 1,223,316(0.03%)#318 |
| 15. | West Haven | 302 | 27,361(1.10%)#15 | 1,223,316(0.02%)#329 |
| 16. | West Hartford | 299 | 27,361(1.09%)#16 | 1,223,316(0.02%)#330 |
| 17. | Naugatuck Borough | 229 | 27,361(0.84%)#17 | 1,223,316(0.02%)#404 |
| 18. | Bristol | 211 | 27,361(0.77%)#18 | 1,223,316(0.02%)#432 |
| 19. | Glastonbury Center | 203 | 27,361(0.74%)#19 | 1,223,316(0.02%)#450 |
| 20. | Middletown | 173 | 27,361(0.63%)#20 | 1,223,316(0.01%)#510 |
| 21. | Winsted | 168 | 27,361(0.61%)#21 | 1,223,316(0.01%)#531 |
| 22. | Groton | 157 | 27,361(0.57%)#22 | 1,223,316(0.01%)#549 |
| 23. | Milford City Balance | 122 | 27,361(0.45%)#23 | 1,223,316(0.01%)#655 |
| 24. | East Haven | 118 | 27,361(0.43%)#24 | 1,223,316(0.01%)#670 |
| 25. | Shelton | 113 | 27,361(0.41%)#25 | 1,223,316(0.01%)#688 |
| 26. | Bethel | 81 | 27,361(0.30%)#26 | 1,223,316(0.01%)#862 |
| 27. | Willimantic | 80 | 27,361(0.29%)#27 | 1,223,316(0.01%)#866 |
| 28. | Manchester | 74 | 27,361(0.27%)#28 | 1,223,316(0.01%)#923 |
| 29. | Greenwich | 67 | 27,361(0.24%)#29 | 1,223,316(0.01%)#987 |
| 30. | Blue Hills | 65 | 27,361(0.24%)#30 | 1,223,316(0.01%)#1,003 |
| 31. | Orange | 54 | 27,361(0.20%)#31 | 1,223,316(0.00%)#1,104 |
| 32. | Colchester | 43 | 27,361(0.16%)#32 | 1,223,316(0.00%)#1,244 |
| 33. | Cheshire Village | 33 | 27,361(0.12%)#33 | 1,223,316(0.00%)#1,440 |
| 34. | Newington | 32 | 27,361(0.12%)#34 | 1,223,316(0.00%)#1,451 |
| 35. | Wallingford Center | 32 | 27,361(0.12%)#35 | 1,223,316(0.00%)#1,454 |
| 36. | Sandy Hook | 32 | 27,361(0.12%)#36 | 1,223,316(0.00%)#1,459 |
| 37. | Sherwood Manor | 32 | 27,361(0.12%)#37 | 1,223,316(0.00%)#1,465 |
| 38. | Poquonock Bridge | 29 | 27,361(0.11%)#38 | 1,223,316(0.00%)#1,532 |
| 39. | Route 7 Gateway | 29 | 27,361(0.11%)#39 | 1,223,316(0.00%)#1,533 |
| 40. | Byram | 27 | 27,361(0.10%)#40 | 1,223,316(0.00%)#1,582 |
| 41. | New Milford | 26 | 27,361(0.10%)#41 | 1,223,316(0.00%)#1,615 |
| 42. | Wilton Center | 22 | 27,361(0.08%)#42 | 1,223,316(0.00%)#1,735 |
| 43. | Newtown Borough | 21 | 27,361(0.08%)#43 | 1,223,316(0.00%)#1,782 |
| 44. | Staples | 18 | 27,361(0.07%)#44 | 1,223,316(0.00%)#1,867 |
| 45. | Terryville | 17 | 27,361(0.06%)#45 | 1,223,316(0.00%)#1,912 |
| 46. | Cos Cob | 14 | 27,361(0.05%)#46 | 1,223,316(0.00%)#2,047 |
| 47. | Conning Towers Nautilus Park | 13 | 27,361(0.05%)#47 | 1,223,316(0.00%)#2,083 |
| 48. | Bigelow Corners | 11 | 27,361(0.04%)#48 | 1,223,316(0.00%)#2,200 |
| 49. | Wethersfield | 10 | 27,361(0.04%)#49 | 1,223,316(0.00%)#2,220 |
| 50. | Quinnipiac University | 10 | 27,361(0.04%)#50 | 1,223,316(0.00%)#2,239 |
| 51. | Brooklyn | 9 | 27,361(0.03%)#51 | 1,223,316(0.00%)#2,318 |
| 52. | Simsbury Center | 6 | 27,361(0.02%)#52 | 1,223,316(0.00%)#2,467 |
| 53. | Lakes West | 5 | 27,361(0.02%)#53 | 1,223,316(0.00%)#2,547 |
| 54. | Gaylordsville | 3 | 27,361(0.01%)#54 | 1,223,316(0.00%)#2,655 |
1
2Common Questions
What are the Top 10 Cities with the Most Immigrants from Dominican Republic in Connecticut?
Top 10 Cities with the Most Immigrants from Dominican Republic in Connecticut are:
#1
3,949
#2
3,928
#3
3,633
#4
2,278
#5
1,861
#6
1,294
#7
1,240
#8
1,024
#9
769
#10
608
What city has the Most Immigrants from Dominican Republic in Connecticut?
Bridgeport has the Most Immigrants from Dominican Republic in Connecticut with 3,949.
What is the Total Immigrants from Dominican Republic in the State of Connecticut?
Total Immigrants from Dominican Republic in Connecticut is 27,361.
What is the Total Immigrants from Dominican Republic in the United States?
Total Immigrants from Dominican Republic in the United States is 1,223,316.