Cities with the Most Immigrants from Dominican Republic in Indiana
RELATED REPORTS & OPTIONS
Dominican Republic
Indiana
Compare Cities
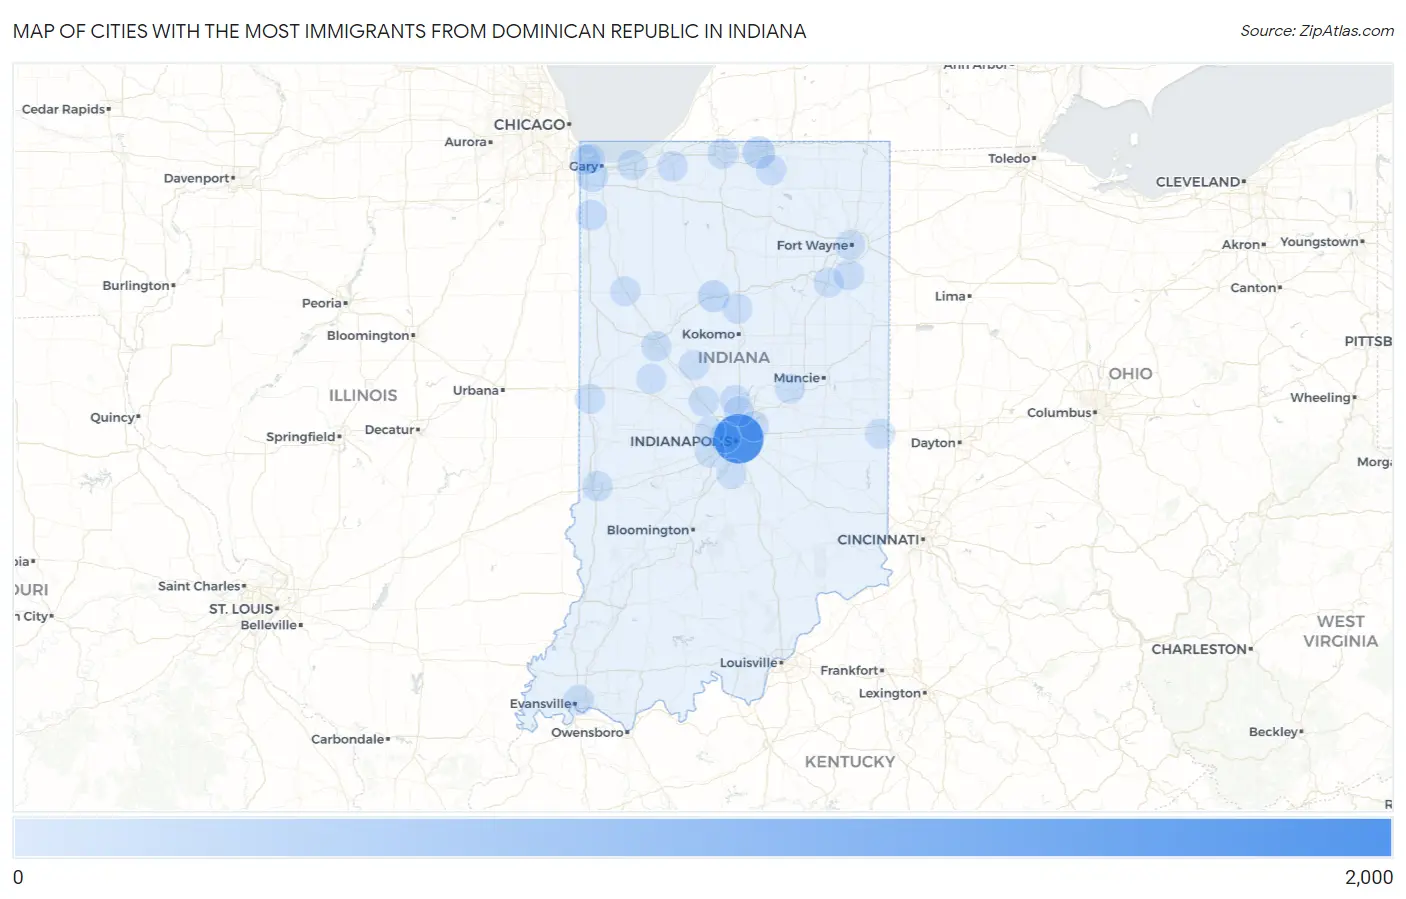
Map of Cities with the Most Immigrants from Dominican Republic in Indiana
0
2,000
Cities with the Most Immigrants from Dominican Republic in Indiana
| City | Dominican Republic | vs State | vs National | |
| 1. | Indianapolis | 1,547 | 2,421(63.90%)#1 | 1,223,316(0.13%)#75 |
| 2. | Elkhart | 163 | 2,421(6.73%)#2 | 1,223,316(0.01%)#537 |
| 3. | Logansport | 131 | 2,421(5.41%)#3 | 1,223,316(0.01%)#629 |
| 4. | Griffith | 97 | 2,421(4.01%)#4 | 1,223,316(0.01%)#751 |
| 5. | Speedway | 78 | 2,421(3.22%)#5 | 1,223,316(0.01%)#882 |
| 6. | Lowell | 48 | 2,421(1.98%)#6 | 1,223,316(0.00%)#1,176 |
| 7. | La Porte | 34 | 2,421(1.40%)#7 | 1,223,316(0.00%)#1,405 |
| 8. | Hammond | 23 | 2,421(0.95%)#8 | 1,223,316(0.00%)#1,673 |
| 9. | Westfield | 23 | 2,421(0.95%)#9 | 1,223,316(0.00%)#1,676 |
| 10. | Goshen | 22 | 2,421(0.91%)#10 | 1,223,316(0.00%)#1,706 |
| 11. | Ossian | 22 | 2,421(0.91%)#11 | 1,223,316(0.00%)#1,729 |
| 12. | South Bend | 19 | 2,421(0.78%)#12 | 1,223,316(0.00%)#1,813 |
| 13. | Lafayette | 19 | 2,421(0.78%)#13 | 1,223,316(0.00%)#1,817 |
| 14. | Lebanon | 18 | 2,421(0.74%)#14 | 1,223,316(0.00%)#1,860 |
| 15. | Terre Haute | 17 | 2,421(0.70%)#15 | 1,223,316(0.00%)#1,886 |
| 16. | Evansville | 14 | 2,421(0.58%)#16 | 1,223,316(0.00%)#2,022 |
| 17. | Chesterton | 14 | 2,421(0.58%)#17 | 1,223,316(0.00%)#2,037 |
| 18. | Lawrence | 12 | 2,421(0.50%)#18 | 1,223,316(0.00%)#2,113 |
| 19. | Carmel | 8 | 2,421(0.33%)#19 | 1,223,316(0.00%)#2,324 |
| 20. | Frankfort | 8 | 2,421(0.33%)#20 | 1,223,316(0.00%)#2,337 |
| 21. | Remington | 8 | 2,421(0.33%)#21 | 1,223,316(0.00%)#2,363 |
| 22. | Richmond | 6 | 2,421(0.25%)#22 | 1,223,316(0.00%)#2,445 |
| 23. | Brownsburg | 6 | 2,421(0.25%)#23 | 1,223,316(0.00%)#2,447 |
| 24. | Bargersville | 6 | 2,421(0.25%)#24 | 1,223,316(0.00%)#2,460 |
| 25. | Fort Wayne | 5 | 2,421(0.21%)#25 | 1,223,316(0.00%)#2,492 |
| 26. | Markle | 4 | 2,421(0.17%)#26 | 1,223,316(0.00%)#2,603 |
| 27. | Plainfield | 2 | 2,421(0.08%)#27 | 1,223,316(0.00%)#2,665 |
| 28. | Grissom Afb | 2 | 2,421(0.08%)#28 | 1,223,316(0.00%)#2,683 |
| 29. | Linden | 2 | 2,421(0.08%)#29 | 1,223,316(0.00%)#2,707 |
| 30. | Perrysville | 2 | 2,421(0.08%)#30 | 1,223,316(0.00%)#2,708 |
| 31. | East Chicago | 1 | 2,421(0.04%)#31 | 1,223,316(0.00%)#2,715 |
| 32. | Country Club Heights | 1 | 2,421(0.04%)#32 | 1,223,316(0.00%)#2,761 |
Common Questions
What are the Top 10 Cities with the Most Immigrants from Dominican Republic in Indiana?
Top 10 Cities with the Most Immigrants from Dominican Republic in Indiana are:
#1
1,547
#2
163
#3
131
#4
97
#5
78
#6
48
#7
34
#8
23
#9
23
#10
22
What city has the Most Immigrants from Dominican Republic in Indiana?
Indianapolis has the Most Immigrants from Dominican Republic in Indiana with 1,547.
What is the Total Immigrants from Dominican Republic in the State of Indiana?
Total Immigrants from Dominican Republic in Indiana is 2,421.
What is the Total Immigrants from Dominican Republic in the United States?
Total Immigrants from Dominican Republic in the United States is 1,223,316.