Chester, MA
Chester Map
Chester Overview
795
TOTAL POPULATION
333
MALE POPULATION
462
FEMALE POPULATION
72.08
MALES / 100 FEMALES
138.74
FEMALES / 100 MALES
45.1
MEDIAN AGE
3.5
AVG FAMILY SIZE
3.1
AVG HOUSEHOLD SIZE
$24,574
PER CAPITA INCOME
$80,845
AVG FAMILY INCOME
$79,167
AVG HOUSEHOLD INCOME
26.0%
WAGE / INCOME GAP [ % ]
74.0¢/ $1
WAGE / INCOME GAP [ $ ]
0.26
INEQUALITY / GINI INDEX
372
LABOR FORCE [ PEOPLE ]
63.5%
PERCENT IN LABOR FORCE
3.8%
UNEMPLOYMENT RATE
Chester Zip Codes
Chester Area Codes
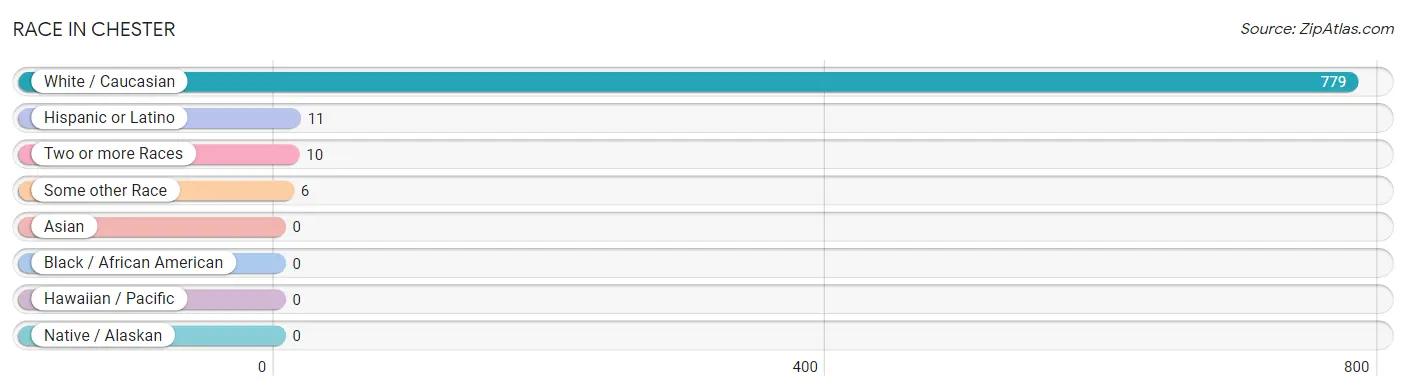
Race in Chester
The most populous races in Chester are White / Caucasian (779 | 98.0%), Hispanic or Latino (11 | 1.4%), and Two or more Races (10 | 1.3%).
| Race | # Population | % Population |
| Asian | 0 | 0.0% |
| Black / African American | 0 | 0.0% |
| Hawaiian / Pacific | 0 | 0.0% |
| Hispanic or Latino | 11 | 1.4% |
| Native / Alaskan | 0 | 0.0% |
| White / Caucasian | 779 | 98.0% |
| Two or more Races | 10 | 1.3% |
| Some other Race | 6 | 0.7% |
| Total | 795 | 100.0% |
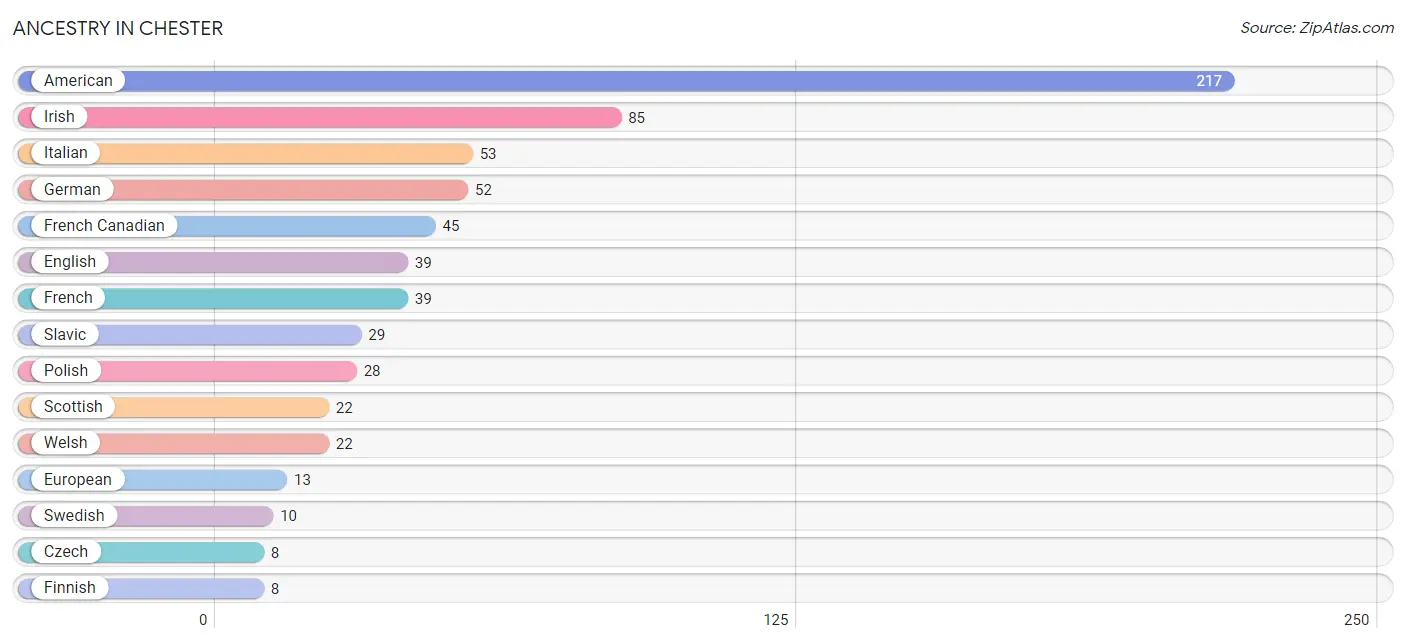
Ancestry in Chester
The most populous ancestries reported in Chester are American (217 | 27.3%), Irish (85 | 10.7%), Italian (53 | 6.7%), German (52 | 6.5%), and French Canadian (45 | 5.7%), together accounting for 56.9% of all Chester residents.
| Ancestry | # Population | % Population |
| American | 217 | 27.3% |
| British | 3 | 0.4% |
| Central American | 5 | 0.6% |
| Czech | 8 | 1.0% |
| Danish | 3 | 0.4% |
| English | 39 | 4.9% |
| European | 13 | 1.6% |
| Finnish | 8 | 1.0% |
| French | 39 | 4.9% |
| French Canadian | 45 | 5.7% |
| German | 52 | 6.5% |
| Honduran | 5 | 0.6% |
| Irish | 85 | 10.7% |
| Italian | 53 | 6.7% |
| Latvian | 3 | 0.4% |
| Polish | 28 | 3.5% |
| Puerto Rican | 6 | 0.7% |
| Russian | 3 | 0.4% |
| Scotch-Irish | 3 | 0.4% |
| Scottish | 22 | 2.8% |
| Slavic | 29 | 3.6% |
| Swedish | 10 | 1.3% |
| Welsh | 22 | 2.8% | View All 23 Rows |
Immigrants in Chester

| Immigration Origin | # Population | % Population | View All 0 Rows |
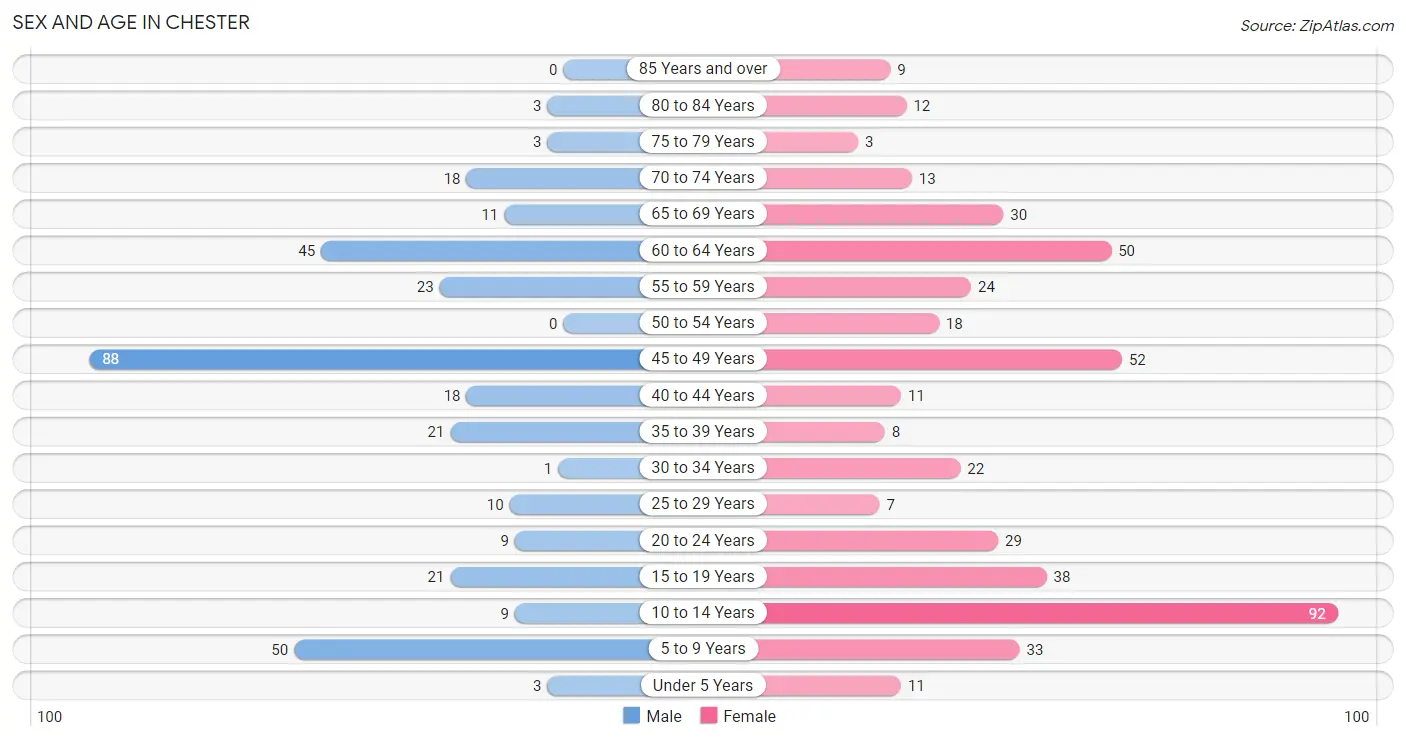
Sex and Age in Chester
Sex and Age in Chester
The most populous age groups in Chester are 45 to 49 Years (88 | 26.4%) for men and 10 to 14 Years (92 | 19.9%) for women.
| Age Bracket | Male | Female |
| Under 5 Years | 3 (0.9%) | 11 (2.4%) |
| 5 to 9 Years | 50 (15.0%) | 33 (7.1%) |
| 10 to 14 Years | 9 (2.7%) | 92 (19.9%) |
| 15 to 19 Years | 21 (6.3%) | 38 (8.2%) |
| 20 to 24 Years | 9 (2.7%) | 29 (6.3%) |
| 25 to 29 Years | 10 (3.0%) | 7 (1.5%) |
| 30 to 34 Years | 1 (0.3%) | 22 (4.8%) |
| 35 to 39 Years | 21 (6.3%) | 8 (1.7%) |
| 40 to 44 Years | 18 (5.4%) | 11 (2.4%) |
| 45 to 49 Years | 88 (26.4%) | 52 (11.3%) |
| 50 to 54 Years | 0 (0.0%) | 18 (3.9%) |
| 55 to 59 Years | 23 (6.9%) | 24 (5.2%) |
| 60 to 64 Years | 45 (13.5%) | 50 (10.8%) |
| 65 to 69 Years | 11 (3.3%) | 30 (6.5%) |
| 70 to 74 Years | 18 (5.4%) | 13 (2.8%) |
| 75 to 79 Years | 3 (0.9%) | 3 (0.6%) |
| 80 to 84 Years | 3 (0.9%) | 12 (2.6%) |
| 85 Years and over | 0 (0.0%) | 9 (1.9%) |
| Total | 333 (100.0%) | 462 (100.0%) |
Families and Households in Chester
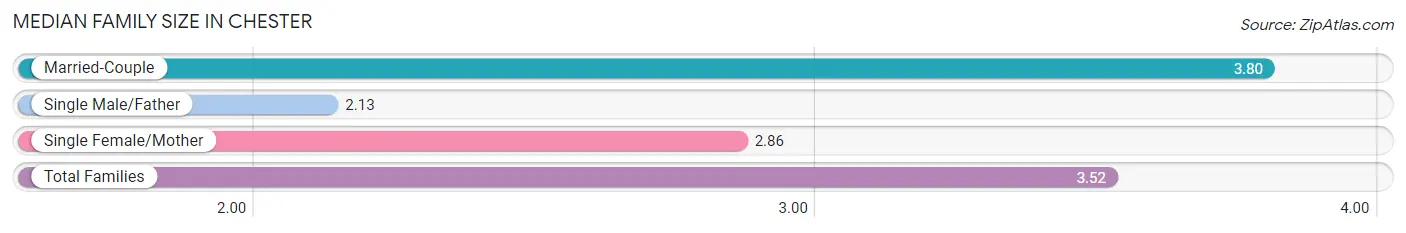
Median Family Size in Chester
The median family size in Chester is 3.52 persons per family, with married-couple families (141 | 73.8%) accounting for the largest median family size of 3.8 persons per family. On the other hand, single male/father families (8 | 4.2%) represent the smallest median family size with 2.13 persons per family.
| Family Type | # Families | Family Size |
| Married-Couple | 141 (73.8%) | 3.80 |
| Single Male/Father | 8 (4.2%) | 2.13 |
| Single Female/Mother | 42 (22.0%) | 2.86 |
| Total Families | 191 (100.0%) | 3.52 |
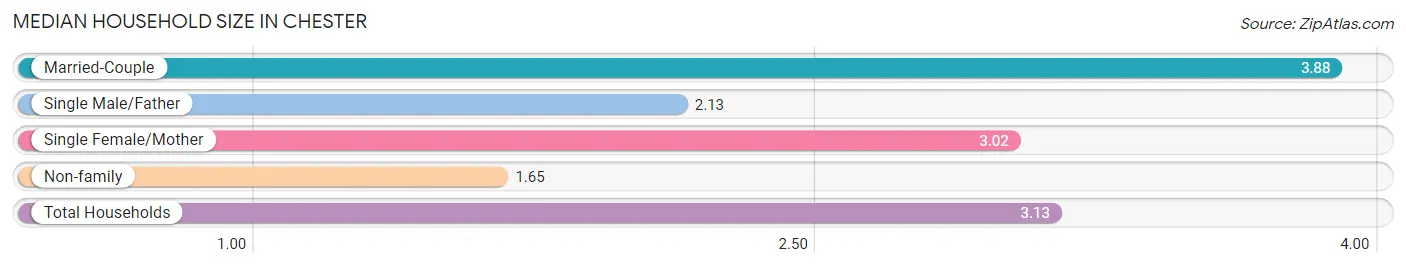
Median Household Size in Chester
The median household size in Chester is 3.13 persons per household, with married-couple households (141 | 55.5%) accounting for the largest median household size of 3.88 persons per household. non-family households (63 | 24.8%) represent the smallest median household size with 1.65 persons per household.
| Household Type | # Households | Household Size |
| Married-Couple | 141 (55.5%) | 3.88 |
| Single Male/Father | 8 (3.2%) | 2.13 |
| Single Female/Mother | 42 (16.5%) | 3.02 |
| Non-family | 63 (24.8%) | 1.65 |
| Total Households | 254 (100.0%) | 3.13 |
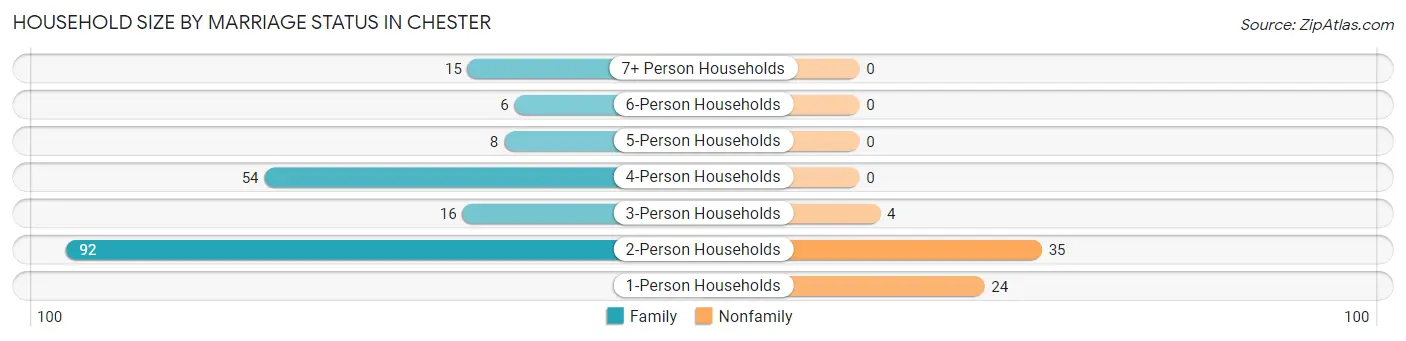
Household Size by Marriage Status in Chester
Out of a total of 254 households in Chester, 191 (75.2%) are family households, while 63 (24.8%) are nonfamily households. The most numerous type of family households are 2-person households, comprising 92, and the most common type of nonfamily households are 2-person households, comprising 35.
| Household Size | Family Households | Nonfamily Households |
| 1-Person Households | - | 24 (9.5%) |
| 2-Person Households | 92 (36.2%) | 35 (13.8%) |
| 3-Person Households | 16 (6.3%) | 4 (1.6%) |
| 4-Person Households | 54 (21.3%) | 0 (0.0%) |
| 5-Person Households | 8 (3.2%) | 0 (0.0%) |
| 6-Person Households | 6 (2.4%) | 0 (0.0%) |
| 7+ Person Households | 15 (5.9%) | 0 (0.0%) |
| Total | 191 (75.2%) | 63 (24.8%) |
Female Fertility in Chester
Fertility by Age in Chester
| Age Bracket | Women with Births | Births / 1,000 Women |
| 15 to 19 years | 0 (0.0%) | 0.0 |
| 20 to 34 years | 0 (0.0%) | 0.0 |
| 35 to 50 years | 0 (0.0%) | 0.0 |
| Total | 0 (0.0%) | 0.0 |
Fertility by Age by Marriage Status in Chester
| Age Bracket | Married | Unmarried |
| 15 to 19 years | 0 (0.0%) | 0 (0.0%) |
| 20 to 34 years | 0 (0.0%) | 0 (0.0%) |
| 35 to 50 years | 0 (0.0%) | 0 (0.0%) |
| Total | 0 (0.0%) | 0 (0.0%) |
Fertility by Education in Chester
| Educational Attainment | Women with Births | Births / 1,000 Women |
| Less than High School | 0 (0.0%) | 0.0 |
| High School Diploma | 0 (0.0%) | 0.0 |
| College or Associate's Degree | 0 (0.0%) | 0.0 |
| Bachelor's Degree | 0 (0.0%) | 0.0 |
| Graduate Degree | 0 (0.0%) | 0.0 |
| Total | 0 (0.0%) | 0.0 |
Fertility by Education by Marriage Status in Chester
| Educational Attainment | Married | Unmarried |
| Less than High School | 0 (0.0%) | 0 (0.0%) |
| High School Diploma | 0 (0.0%) | 0 (0.0%) |
| College or Associate's Degree | 0 (0.0%) | 0 (0.0%) |
| Bachelor's Degree | 0 (0.0%) | 0 (0.0%) |
| Graduate Degree | 0 (0.0%) | 0 (0.0%) |
| Total | 0 (0.0%) | 0 (0.0%) |
Income in Chester
Income Overview in Chester
Per Capita Income in Chester is $24,574, while median incomes of families and households are $80,845 and $79,167 respectively.
| Characteristic | Number | Measure |
| Per Capita Income | 795 | $24,574 |
| Median Family Income | 191 | $80,845 |
| Mean Family Income | 191 | $74,537 |
| Median Household Income | 254 | $79,167 |
| Mean Household Income | 254 | $72,793 |
| Income Deficit | 191 | $0 |
| Wage / Income Gap (%) | 795 | 25.99% |
| Wage / Income Gap ($) | 795 | 74.01¢ per $1 |
| Gini / Inequality Index | 795 | 0.26 |
Earnings by Sex in Chester
Average Earnings in Chester are $37,854, $39,861 for men and $29,500 for women, a difference of 26.0%.
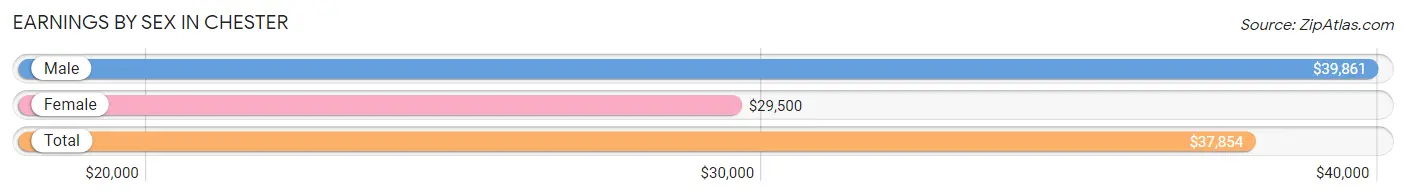
| Sex | Number | Average Earnings |
| Male | 203 (52.2%) | $39,861 |
| Female | 186 (47.8%) | $29,500 |
| Total | 389 (100.0%) | $37,854 |
Earnings by Sex by Income Bracket in Chester
The most common earnings brackets in Chester are $35,000 to $39,999 for men (51 | 25.1%) and $40,000 to $44,999 for women (34 | 18.3%).
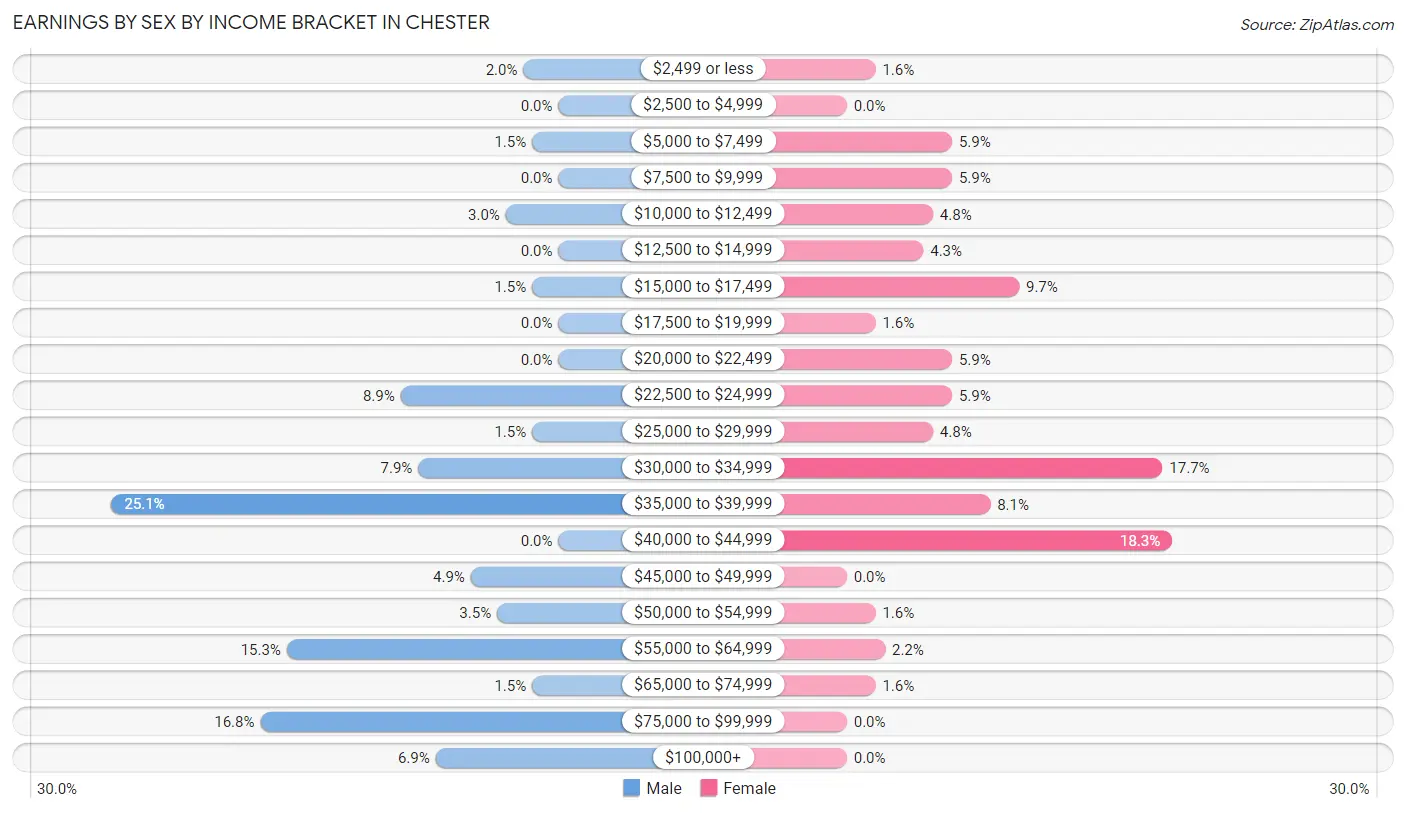
| Income | Male | Female |
| $2,499 or less | 4 (2.0%) | 3 (1.6%) |
| $2,500 to $4,999 | 0 (0.0%) | 0 (0.0%) |
| $5,000 to $7,499 | 3 (1.5%) | 11 (5.9%) |
| $7,500 to $9,999 | 0 (0.0%) | 11 (5.9%) |
| $10,000 to $12,499 | 6 (3.0%) | 9 (4.8%) |
| $12,500 to $14,999 | 0 (0.0%) | 8 (4.3%) |
| $15,000 to $17,499 | 3 (1.5%) | 18 (9.7%) |
| $17,500 to $19,999 | 0 (0.0%) | 3 (1.6%) |
| $20,000 to $22,499 | 0 (0.0%) | 11 (5.9%) |
| $22,500 to $24,999 | 18 (8.9%) | 11 (5.9%) |
| $25,000 to $29,999 | 3 (1.5%) | 9 (4.8%) |
| $30,000 to $34,999 | 16 (7.9%) | 33 (17.7%) |
| $35,000 to $39,999 | 51 (25.1%) | 15 (8.1%) |
| $40,000 to $44,999 | 0 (0.0%) | 34 (18.3%) |
| $45,000 to $49,999 | 10 (4.9%) | 0 (0.0%) |
| $50,000 to $54,999 | 7 (3.5%) | 3 (1.6%) |
| $55,000 to $64,999 | 31 (15.3%) | 4 (2.1%) |
| $65,000 to $74,999 | 3 (1.5%) | 3 (1.6%) |
| $75,000 to $99,999 | 34 (16.8%) | 0 (0.0%) |
| $100,000+ | 14 (6.9%) | 0 (0.0%) |
| Total | 203 (100.0%) | 186 (100.0%) |
Earnings by Sex by Educational Attainment in Chester
Average earnings in Chester are $48,958 for men and $25,938 for women, a difference of 47.0%. Men with an educational attainment of graduate degree enjoy the highest average annual earnings of $88,750, while those with high school diploma education earn the least with $39,778. Women with an educational attainment of high school diploma earn the most with the average annual earnings of $31,080, while those with college or associate's degree education have the smallest earnings of $23,333.
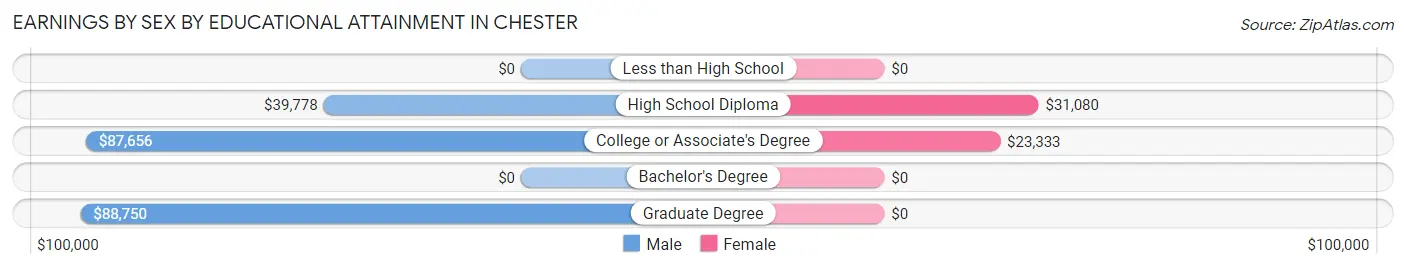
| Educational Attainment | Male Income | Female Income |
| Less than High School | - | - |
| High School Diploma | $39,778 | $31,080 |
| College or Associate's Degree | $87,656 | $23,333 |
| Bachelor's Degree | - | - |
| Graduate Degree | $88,750 | $0 |
| Total | $48,958 | $25,938 |
Family Income in Chester
Family Income Brackets in Chester
According to the Chester family income data, there are 76 families falling into the $75,000 to $99,999 income range, which is the most common income bracket and makes up 39.8% of all families.
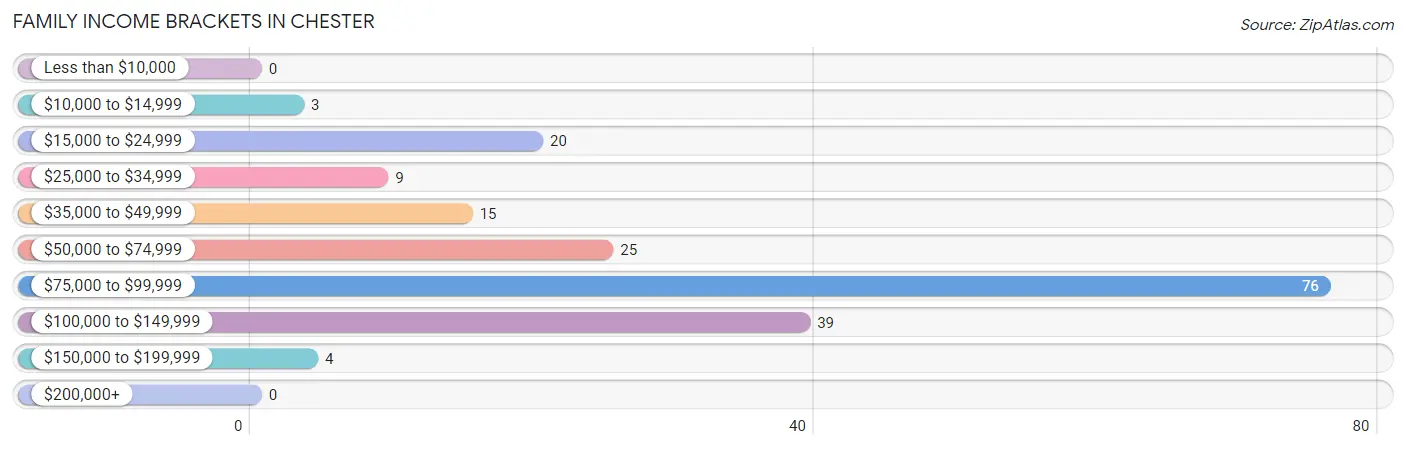
| Income Bracket | # Families | % Families |
| Less than $10,000 | 0 | 0.0% |
| $10,000 to $14,999 | 3 | 1.6% |
| $15,000 to $24,999 | 20 | 10.5% |
| $25,000 to $34,999 | 9 | 4.7% |
| $35,000 to $49,999 | 15 | 7.9% |
| $50,000 to $74,999 | 25 | 13.1% |
| $75,000 to $99,999 | 76 | 39.8% |
| $100,000 to $149,999 | 39 | 20.4% |
| $150,000 to $199,999 | 4 | 2.1% |
| $200,000+ | 0 | 0.0% |
Family Income by Famaliy Size in Chester
3-person families (15 | 7.9%) account for the highest median family income in Chester with $100,750 per family, while 3-person families (15 | 7.9%) have the highest median income of $33,583 per family member.
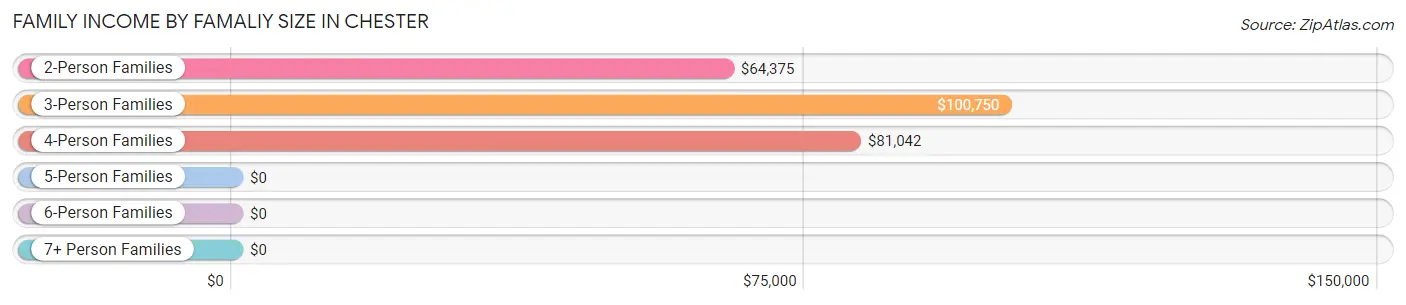
| Income Bracket | # Families | Median Income |
| 2-Person Families | 96 (50.3%) | $64,375 |
| 3-Person Families | 15 (7.9%) | $100,750 |
| 4-Person Families | 55 (28.8%) | $81,042 |
| 5-Person Families | 8 (4.2%) | $0 |
| 6-Person Families | 2 (1.1%) | $0 |
| 7+ Person Families | 15 (7.9%) | $0 |
| Total | 191 (100.0%) | $80,845 |
Family Income by Number of Earners in Chester
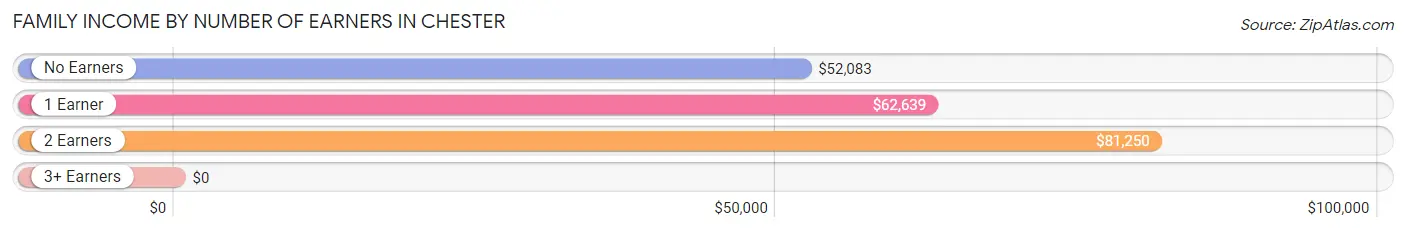
| Number of Earners | # Families | Median Income |
| No Earners | 13 (6.8%) | $52,083 |
| 1 Earner | 89 (46.6%) | $62,639 |
| 2 Earners | 71 (37.2%) | $81,250 |
| 3+ Earners | 18 (9.4%) | $0 |
| Total | 191 (100.0%) | $80,845 |
Household Income in Chester
Household Income Brackets in Chester
With 78 households falling in the category, the $75,000 to $99,999 income range is the most frequent in Chester, accounting for 30.7% of all households.
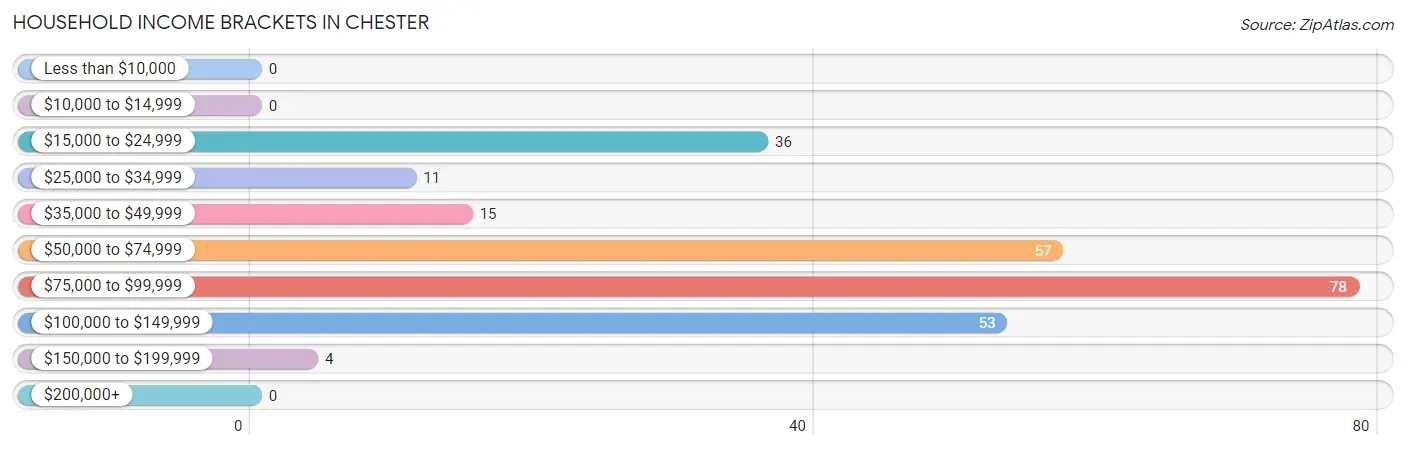
| Income Bracket | # Households | % Households |
| Less than $10,000 | 0 | 0.0% |
| $10,000 to $14,999 | 0 | 0.0% |
| $15,000 to $24,999 | 36 | 14.2% |
| $25,000 to $34,999 | 11 | 4.3% |
| $35,000 to $49,999 | 15 | 5.9% |
| $50,000 to $74,999 | 57 | 22.4% |
| $75,000 to $99,999 | 78 | 30.7% |
| $100,000 to $149,999 | 53 | 20.9% |
| $150,000 to $199,999 | 4 | 1.6% |
| $200,000+ | 0 | 0.0% |
Household Income by Householder Age in Chester
The median household income in Chester is $79,167, with the highest median household income of $81,346 found in the 45 to 64 years age bracket for the primary householder. A total of 142 households (55.9%) fall into this category. Meanwhile, the 15 to 24 years age bracket for the primary householder has the lowest median household income of $0, with 3 households (1.2%) in this group.
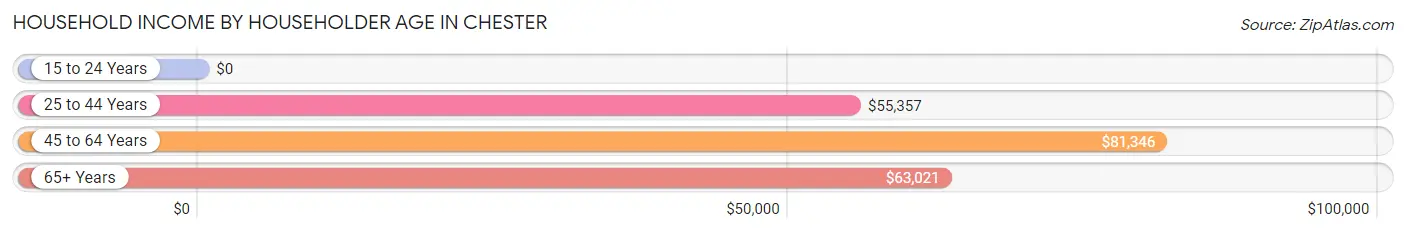
| Income Bracket | # Households | Median Income |
| 15 to 24 Years | 3 (1.2%) | $0 |
| 25 to 44 Years | 56 (22.1%) | $55,357 |
| 45 to 64 Years | 142 (55.9%) | $81,346 |
| 65+ Years | 53 (20.9%) | $63,021 |
| Total | 254 (100.0%) | $79,167 |
Poverty in Chester
Income Below Poverty by Sex and Age in Chester
With 2.7% poverty level for males and 12.8% for females among the residents of Chester, 16 and 17 year old males and under 5 year old females are the most vulnerable to poverty, with 2 males (40.0%) and 11 females (100.0%) in their respective age groups living below the poverty level.
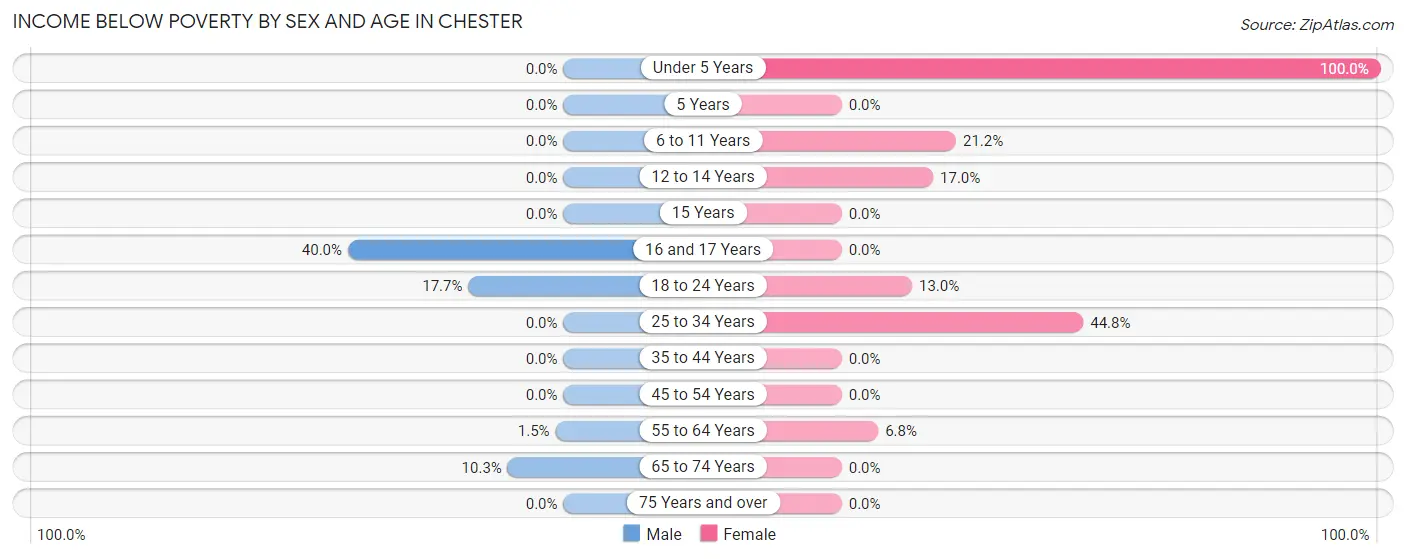
| Age Bracket | Male | Female |
| Under 5 Years | 0 (0.0%) | 11 (100.0%) |
| 5 Years | 0 (0.0%) | 0 (0.0%) |
| 6 to 11 Years | 0 (0.0%) | 14 (21.2%) |
| 12 to 14 Years | 0 (0.0%) | 10 (17.0%) |
| 15 Years | 0 (0.0%) | 0 (0.0%) |
| 16 and 17 Years | 2 (40.0%) | 0 (0.0%) |
| 18 to 24 Years | 3 (17.6%) | 6 (13.0%) |
| 25 to 34 Years | 0 (0.0%) | 13 (44.8%) |
| 35 to 44 Years | 0 (0.0%) | 0 (0.0%) |
| 45 to 54 Years | 0 (0.0%) | 0 (0.0%) |
| 55 to 64 Years | 1 (1.5%) | 5 (6.8%) |
| 65 to 74 Years | 3 (10.3%) | 0 (0.0%) |
| 75 Years and over | 0 (0.0%) | 0 (0.0%) |
| Total | 9 (2.7%) | 59 (12.8%) |
Income Above Poverty by Sex and Age in Chester
According to the poverty statistics in Chester, males aged under 5 years and females aged 15 years are the age groups that are most secure financially, with 100.0% of males and 100.0% of females in these age groups living above the poverty line.
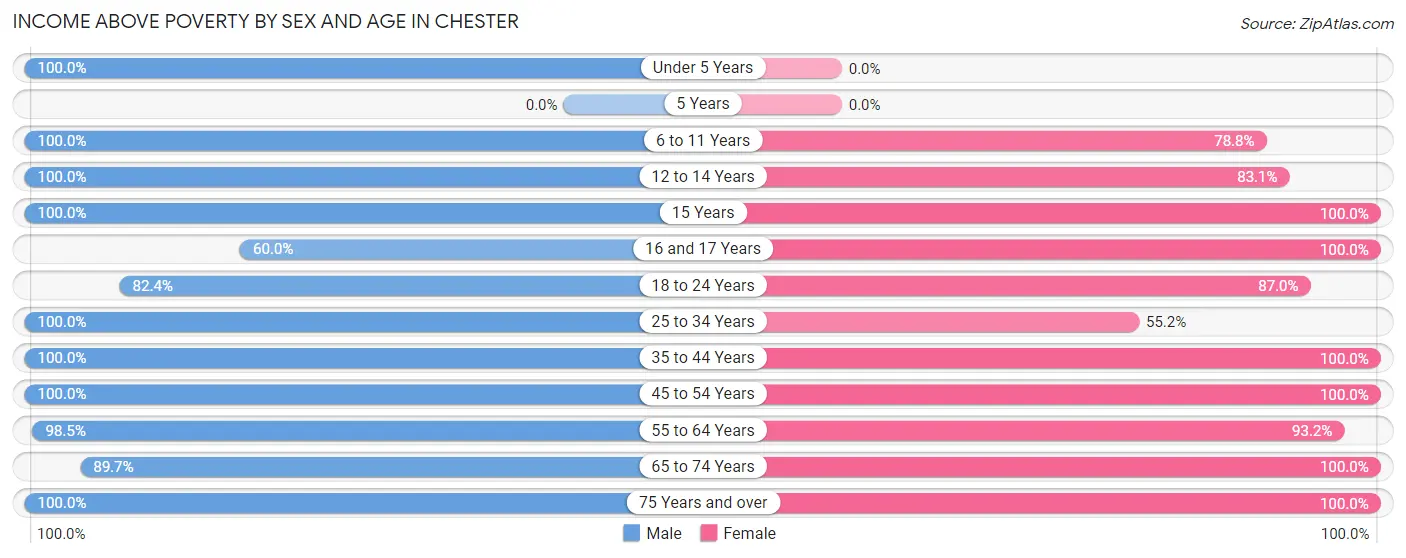
| Age Bracket | Male | Female |
| Under 5 Years | 3 (100.0%) | 0 (0.0%) |
| 5 Years | 0 (0.0%) | 0 (0.0%) |
| 6 to 11 Years | 50 (100.0%) | 52 (78.8%) |
| 12 to 14 Years | 9 (100.0%) | 49 (83.1%) |
| 15 Years | 8 (100.0%) | 3 (100.0%) |
| 16 and 17 Years | 3 (60.0%) | 18 (100.0%) |
| 18 to 24 Years | 14 (82.4%) | 40 (87.0%) |
| 25 to 34 Years | 11 (100.0%) | 16 (55.2%) |
| 35 to 44 Years | 39 (100.0%) | 19 (100.0%) |
| 45 to 54 Years | 88 (100.0%) | 70 (100.0%) |
| 55 to 64 Years | 67 (98.5%) | 69 (93.2%) |
| 65 to 74 Years | 26 (89.7%) | 43 (100.0%) |
| 75 Years and over | 6 (100.0%) | 24 (100.0%) |
| Total | 324 (97.3%) | 403 (87.2%) |
Income Below Poverty Among Married-Couple Families in Chester
The poverty statistics for married-couple families in Chester show that 0.7% or 1 of the total 141 families live below the poverty line. Families with no children have the highest poverty rate of 1.2%, comprising of 1 families. On the other hand, families with 1 or 2 children have the lowest poverty rate of 0.0%, which includes 0 families.
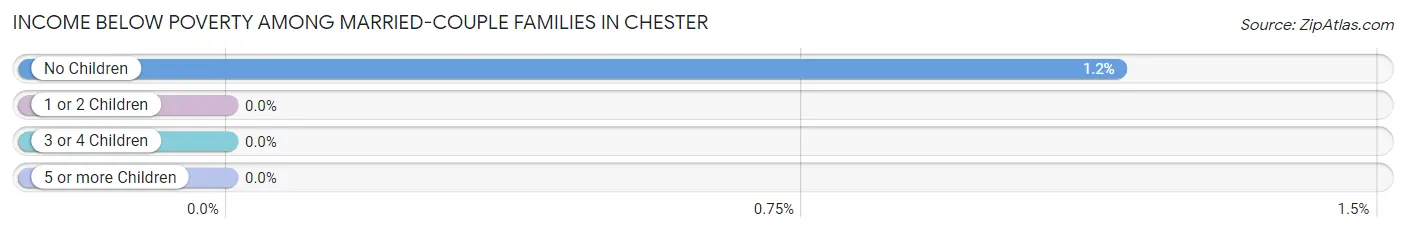
| Children | Above Poverty | Below Poverty |
| No Children | 85 (98.8%) | 1 (1.2%) |
| 1 or 2 Children | 40 (100.0%) | 0 (0.0%) |
| 3 or 4 Children | 0 (0.0%) | 0 (0.0%) |
| 5 or more Children | 15 (100.0%) | 0 (0.0%) |
| Total | 140 (99.3%) | 1 (0.7%) |
Income Below Poverty Among Single-Parent Households in Chester
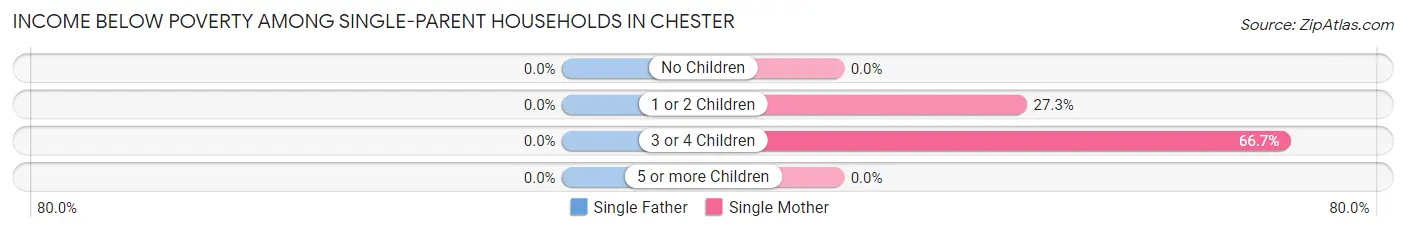
| Children | Single Father | Single Mother |
| No Children | 0 (0.0%) | 0 (0.0%) |
| 1 or 2 Children | 0 (0.0%) | 3 (27.3%) |
| 3 or 4 Children | 0 (0.0%) | 10 (66.7%) |
| 5 or more Children | 0 (0.0%) | 0 (0.0%) |
| Total | 0 (0.0%) | 13 (30.9%) |
Income Below Poverty Among Married-Couple vs Single-Parent Households in Chester
The poverty data for Chester shows that 1 of the married-couple family households (0.7%) and 13 of the single-parent households (26.0%) are living below the poverty level. Within the married-couple family households, those with no children have the highest poverty rate, with 1 households (1.2%) falling below the poverty line. Among the single-parent households, those with 3 or 4 children have the highest poverty rate, with 10 household (66.7%) living below poverty.
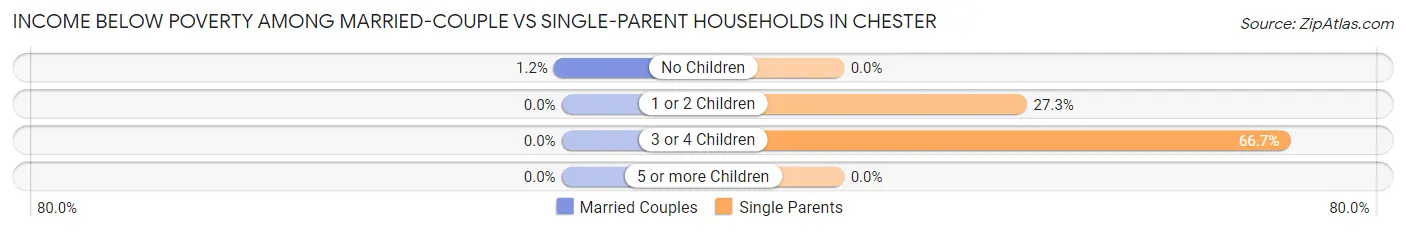
| Children | Married-Couple Families | Single-Parent Households |
| No Children | 1 (1.2%) | 0 (0.0%) |
| 1 or 2 Children | 0 (0.0%) | 3 (27.3%) |
| 3 or 4 Children | 0 (0.0%) | 10 (66.7%) |
| 5 or more Children | 0 (0.0%) | 0 (0.0%) |
| Total | 1 (0.7%) | 13 (26.0%) |
Employment Characteristics in Chester
Employment by Class of Employer in Chester
Among the 355 employed individuals in Chester, private company employees (266 | 74.9%), not-for-profit organizations (31 | 8.7%), and self-employed (incorporated) (24 | 6.8%) make up the most common classes of employment.
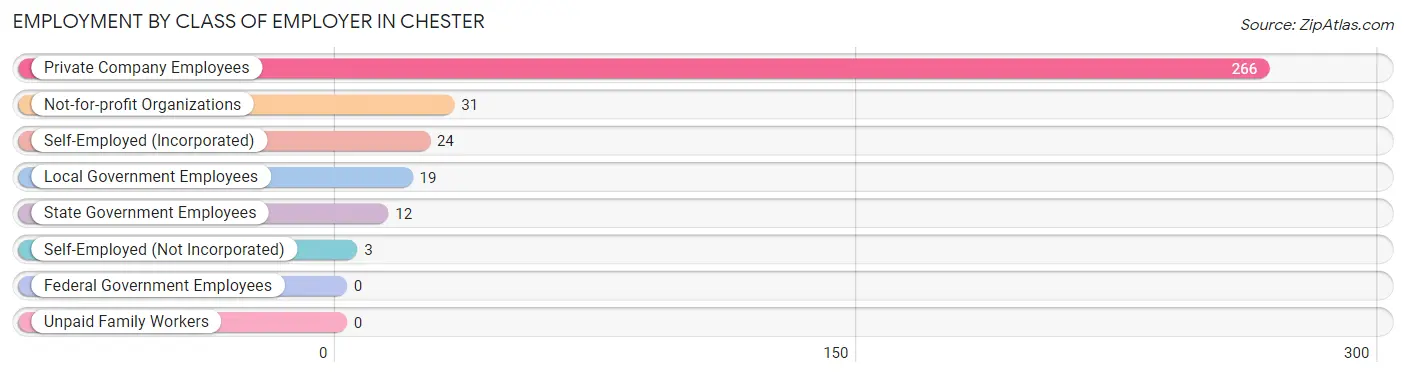
| Employer Class | # Employees | % Employees |
| Private Company Employees | 266 | 74.9% |
| Self-Employed (Incorporated) | 24 | 6.8% |
| Self-Employed (Not Incorporated) | 3 | 0.9% |
| Not-for-profit Organizations | 31 | 8.7% |
| Local Government Employees | 19 | 5.3% |
| State Government Employees | 12 | 3.4% |
| Federal Government Employees | 0 | 0.0% |
| Unpaid Family Workers | 0 | 0.0% |
| Total | 355 | 100.0% |
Employment Status by Age in Chester
According to the labor force statistics for Chester, out of the total population over 16 years of age (586), 63.5% or 372 individuals are in the labor force, with 3.8% or 14 of them unemployed. The age group with the highest labor force participation rate is 20 to 24 years, with 100.0% or 38 individuals in the labor force. Within the labor force, the 35 to 44 years age range has the highest percentage of unemployed individuals, with 6.3% or 3 of them being unemployed.
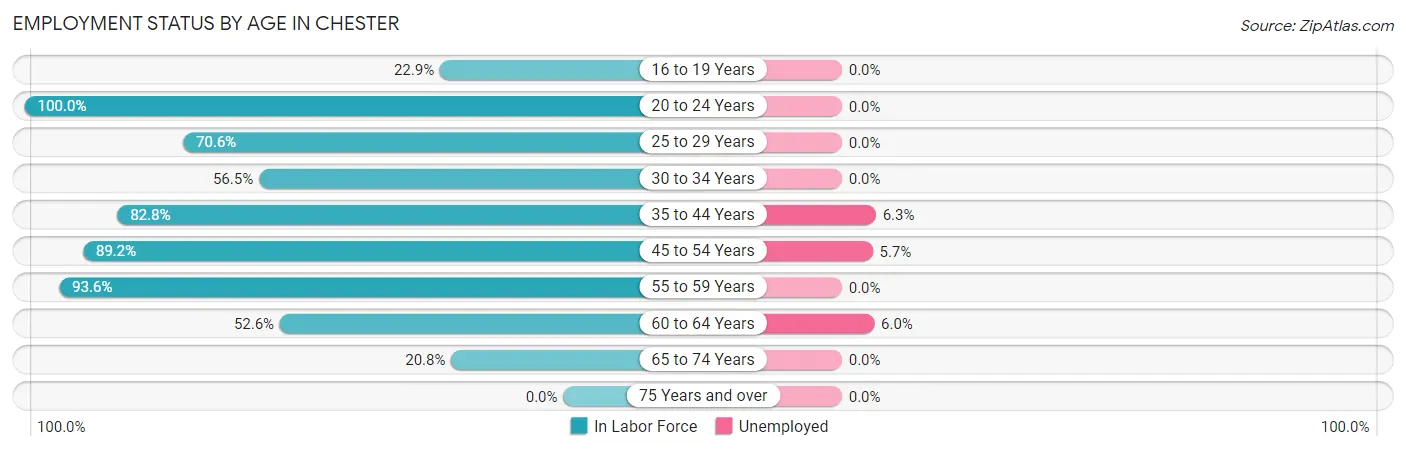
| Age Bracket | In Labor Force | Unemployed |
| 16 to 19 Years | 11 (22.9%) | 0 (0.0%) |
| 20 to 24 Years | 38 (100.0%) | 0 (0.0%) |
| 25 to 29 Years | 12 (70.6%) | 0 (0.0%) |
| 30 to 34 Years | 13 (56.5%) | 0 (0.0%) |
| 35 to 44 Years | 48 (82.8%) | 3 (6.3%) |
| 45 to 54 Years | 141 (89.2%) | 8 (5.7%) |
| 55 to 59 Years | 44 (93.6%) | 0 (0.0%) |
| 60 to 64 Years | 50 (52.6%) | 3 (6.0%) |
| 65 to 74 Years | 15 (20.8%) | 0 (0.0%) |
| 75 Years and over | 0 (0.0%) | 0 (0.0%) |
| Total | 372 (63.5%) | 14 (3.8%) |
Employment Status by Educational Attainment in Chester
According to labor force statistics for Chester, 77.4% of individuals (308) out of the total population between 25 and 64 years of age (398) are in the labor force, with 4.5% or 14 of them being unemployed. The group with the highest labor force participation rate are those with the educational attainment of bachelor's degree or higher, with 100.0% or 52 individuals in the labor force. Within the labor force, individuals with college / associate degree education have the highest percentage of unemployment, with 12.5% or 6 of them being unemployed.
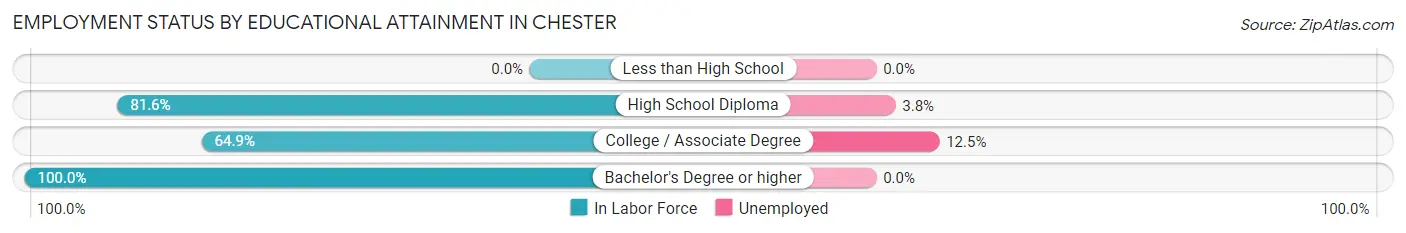
| Educational Attainment | In Labor Force | Unemployed |
| Less than High School | 0 (0.0%) | 0 (0.0%) |
| High School Diploma | 208 (81.6%) | 10 (3.8%) |
| College / Associate Degree | 48 (64.9%) | 9 (12.5%) |
| Bachelor's Degree or higher | 52 (100.0%) | 0 (0.0%) |
| Total | 308 (77.4%) | 18 (4.5%) |
Employment Occupations by Sex in Chester
Management, Business, Science and Arts Occupations
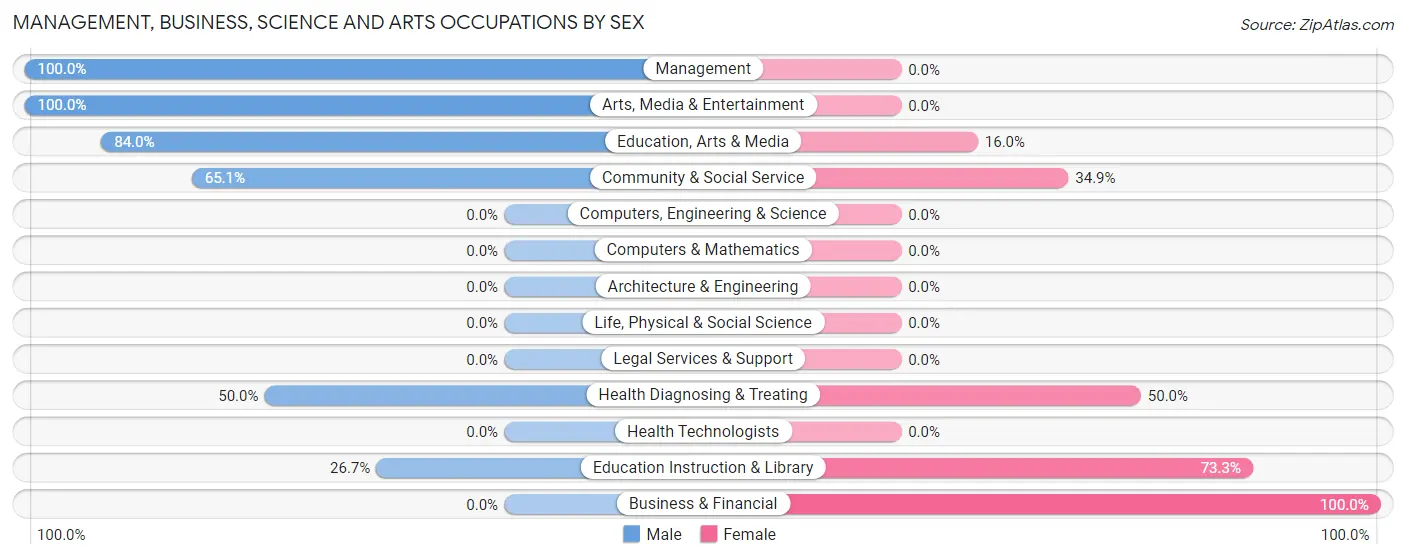
The most common Management, Business, Science and Arts occupations in Chester are Community & Social Service (43 | 12.0%), Education, Arts & Media (25 | 7.0%), Management (16 | 4.5%), Education Instruction & Library (15 | 4.2%), and Business & Financial (8 | 2.2%).
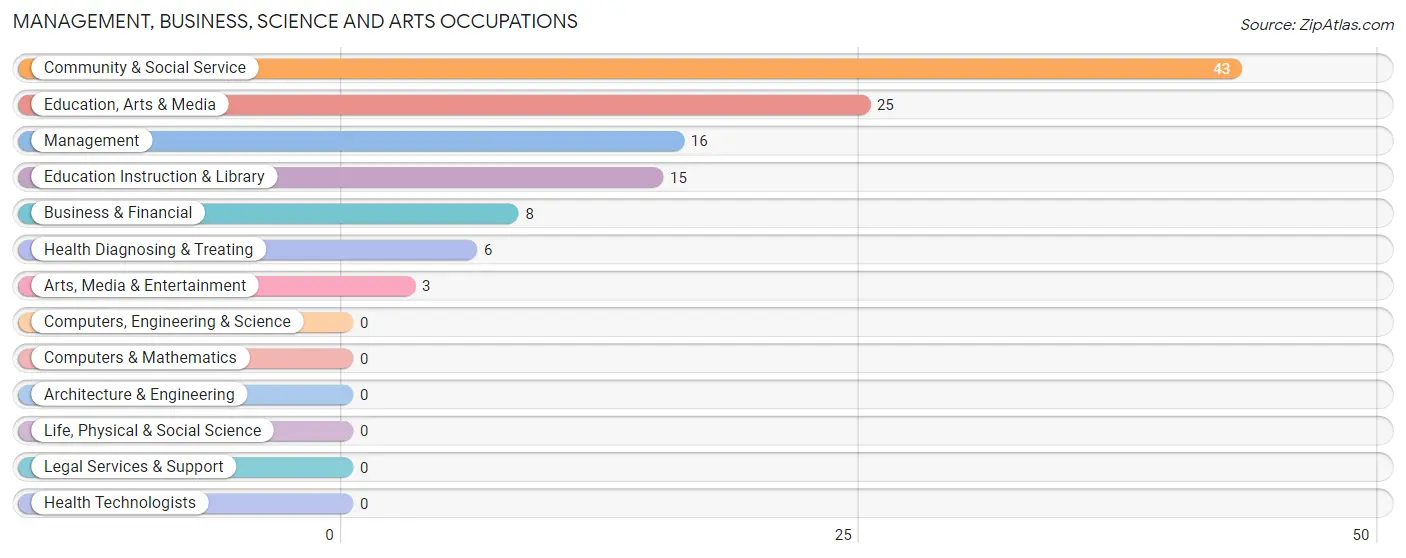
Management, Business, Science and Arts Occupations by Sex
Within the Management, Business, Science and Arts occupations in Chester, the most male-oriented occupations are Management (100.0%), Arts, Media & Entertainment (100.0%), and Education, Arts & Media (84.0%), while the most female-oriented occupations are Business & Financial (100.0%), Education Instruction & Library (73.3%), and Health Diagnosing & Treating (50.0%).
| Occupation | Male | Female |
| Management | 16 (100.0%) | 0 (0.0%) |
| Business & Financial | 0 (0.0%) | 8 (100.0%) |
| Computers, Engineering & Science | 0 (0.0%) | 0 (0.0%) |
| Computers & Mathematics | 0 (0.0%) | 0 (0.0%) |
| Architecture & Engineering | 0 (0.0%) | 0 (0.0%) |
| Life, Physical & Social Science | 0 (0.0%) | 0 (0.0%) |
| Community & Social Service | 28 (65.1%) | 15 (34.9%) |
| Education, Arts & Media | 21 (84.0%) | 4 (16.0%) |
| Legal Services & Support | 0 (0.0%) | 0 (0.0%) |
| Education Instruction & Library | 4 (26.7%) | 11 (73.3%) |
| Arts, Media & Entertainment | 3 (100.0%) | 0 (0.0%) |
| Health Diagnosing & Treating | 3 (50.0%) | 3 (50.0%) |
| Health Technologists | 0 (0.0%) | 0 (0.0%) |
| Total (Category) | 47 (64.4%) | 26 (35.6%) |
| Total (Overall) | 196 (54.7%) | 162 (45.3%) |
Services Occupations
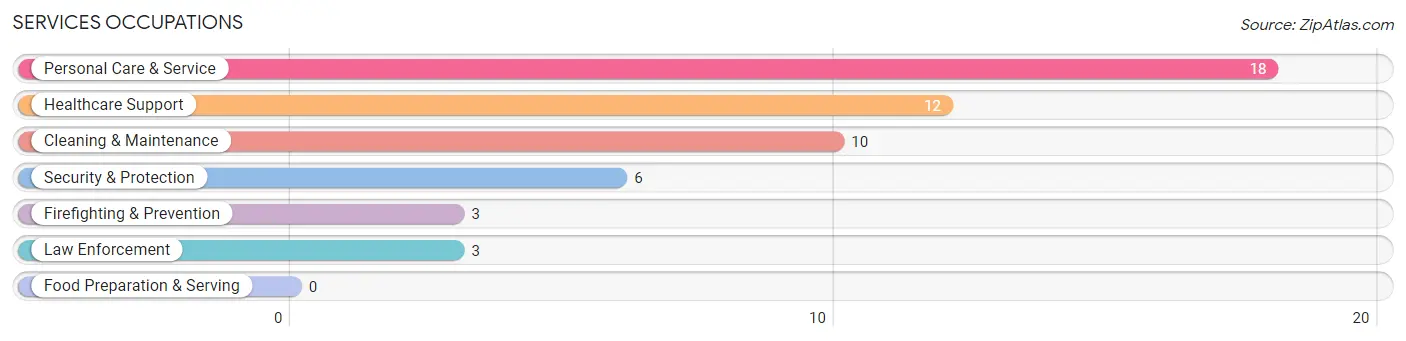
The most common Services occupations in Chester are Personal Care & Service (18 | 5.0%), Healthcare Support (12 | 3.4%), Cleaning & Maintenance (10 | 2.8%), Security & Protection (6 | 1.7%), and Firefighting & Prevention (3 | 0.8%).
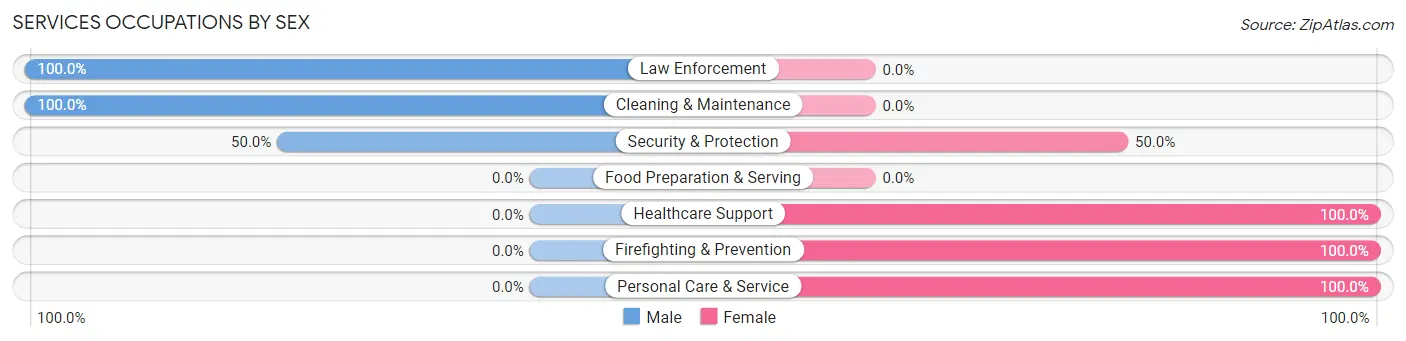
Services Occupations by Sex
Within the Services occupations in Chester, the most male-oriented occupations are Law Enforcement (100.0%), Cleaning & Maintenance (100.0%), and Security & Protection (50.0%), while the most female-oriented occupations are Healthcare Support (100.0%), Firefighting & Prevention (100.0%), and Personal Care & Service (100.0%).
| Occupation | Male | Female |
| Healthcare Support | 0 (0.0%) | 12 (100.0%) |
| Security & Protection | 3 (50.0%) | 3 (50.0%) |
| Firefighting & Prevention | 0 (0.0%) | 3 (100.0%) |
| Law Enforcement | 3 (100.0%) | 0 (0.0%) |
| Food Preparation & Serving | 0 (0.0%) | 0 (0.0%) |
| Cleaning & Maintenance | 10 (100.0%) | 0 (0.0%) |
| Personal Care & Service | 0 (0.0%) | 18 (100.0%) |
| Total (Category) | 13 (28.3%) | 33 (71.7%) |
| Total (Overall) | 196 (54.7%) | 162 (45.3%) |
Sales and Office Occupations
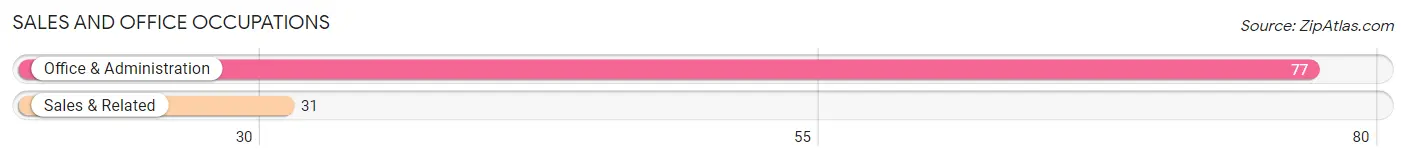
The most common Sales and Office occupations in Chester are Office & Administration (77 | 21.5%), and Sales & Related (31 | 8.7%).
Sales and Office Occupations by Sex

| Occupation | Male | Female |
| Sales & Related | 6 (19.4%) | 25 (80.6%) |
| Office & Administration | 19 (24.7%) | 58 (75.3%) |
| Total (Category) | 25 (23.2%) | 83 (76.8%) |
| Total (Overall) | 196 (54.7%) | 162 (45.3%) |
Natural Resources, Construction and Maintenance Occupations
The most common Natural Resources, Construction and Maintenance occupations in Chester are Installation, Maintenance & Repair (11 | 3.1%), and Construction & Extraction (1 | 0.3%).
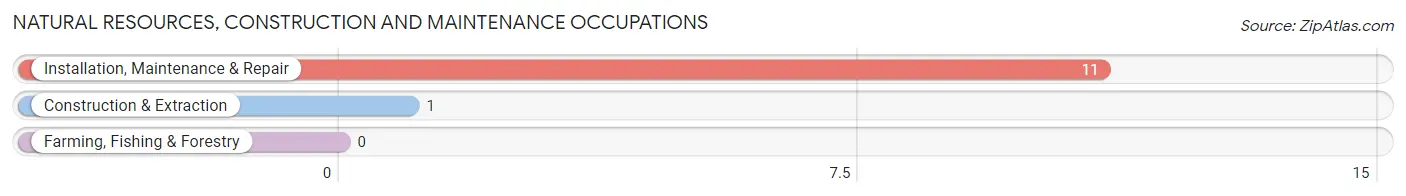
Natural Resources, Construction and Maintenance Occupations by Sex
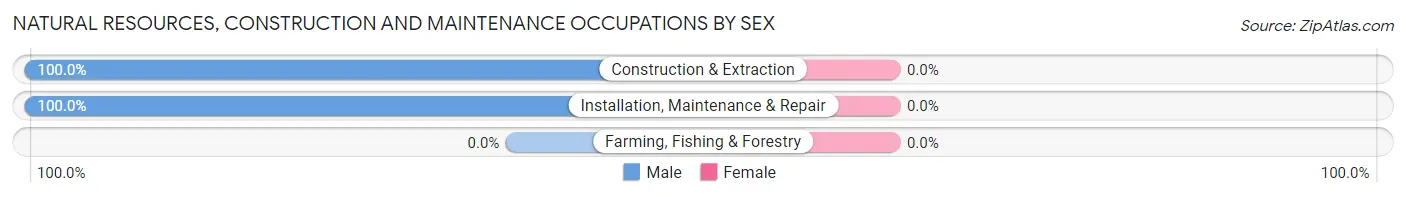
| Occupation | Male | Female |
| Farming, Fishing & Forestry | 0 (0.0%) | 0 (0.0%) |
| Construction & Extraction | 1 (100.0%) | 0 (0.0%) |
| Installation, Maintenance & Repair | 11 (100.0%) | 0 (0.0%) |
| Total (Category) | 12 (100.0%) | 0 (0.0%) |
| Total (Overall) | 196 (54.7%) | 162 (45.3%) |
Production, Transportation and Moving Occupations
The most common Production, Transportation and Moving occupations in Chester are Production (66 | 18.4%), Material Moving (49 | 13.7%), and Transportation (4 | 1.1%).
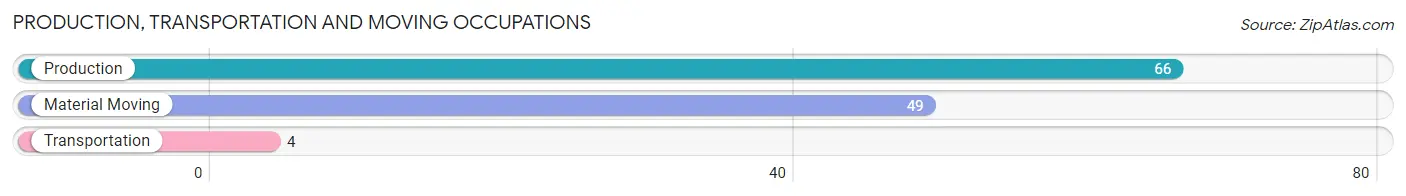
Production, Transportation and Moving Occupations by Sex
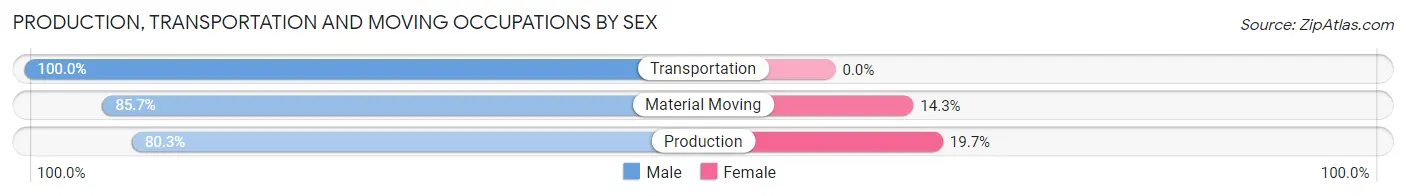
| Occupation | Male | Female |
| Production | 53 (80.3%) | 13 (19.7%) |
| Transportation | 4 (100.0%) | 0 (0.0%) |
| Material Moving | 42 (85.7%) | 7 (14.3%) |
| Total (Category) | 99 (83.2%) | 20 (16.8%) |
| Total (Overall) | 196 (54.7%) | 162 (45.3%) |
Employment Industries by Sex in Chester
Employment Industries in Chester
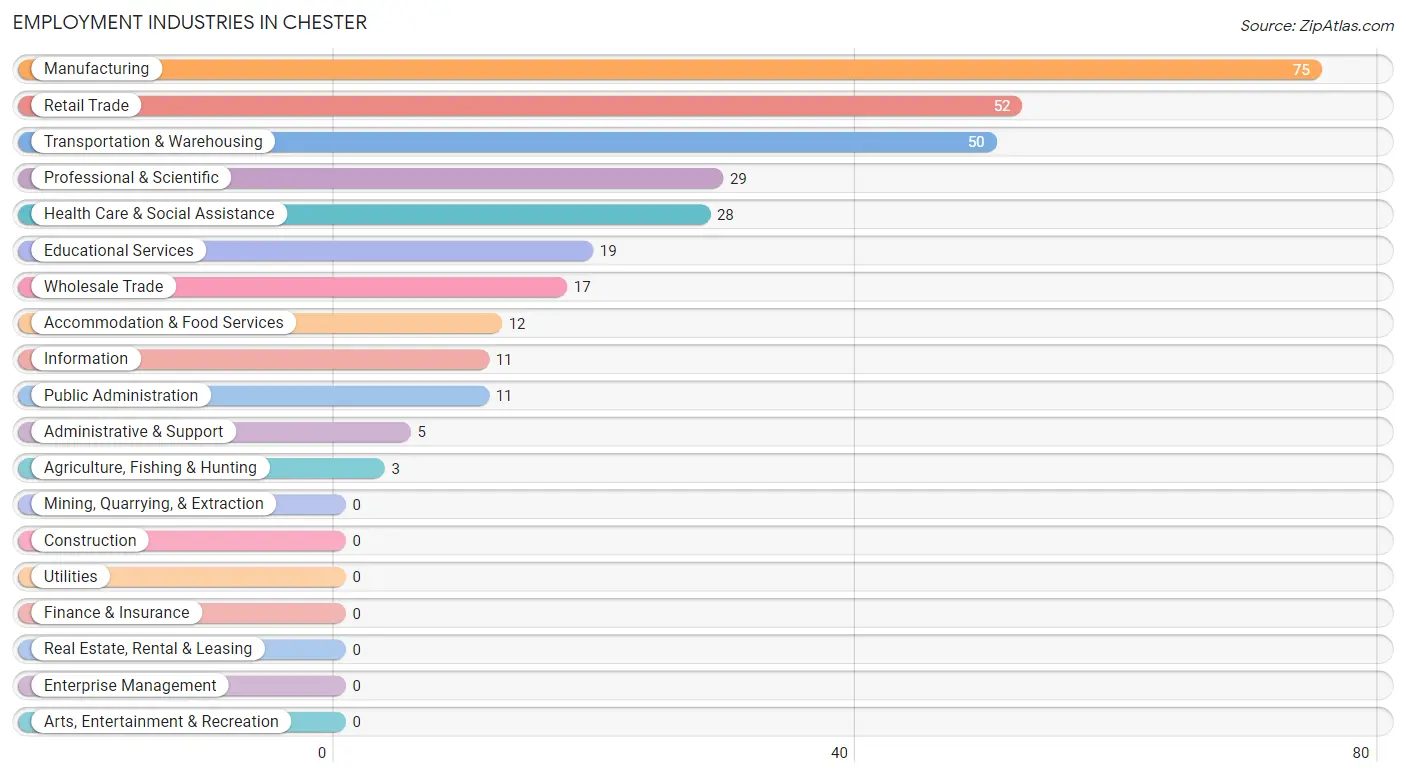
The major employment industries in Chester include Manufacturing (75 | 20.9%), Retail Trade (52 | 14.5%), Transportation & Warehousing (50 | 14.0%), Professional & Scientific (29 | 8.1%), and Health Care & Social Assistance (28 | 7.8%).
Employment Industries by Sex in Chester
The Chester industries that see more men than women are Agriculture, Fishing & Hunting (100.0%), Wholesale Trade (100.0%), and Administrative & Support (100.0%), whereas the industries that tend to have a higher number of women are Professional & Scientific (100.0%), Educational Services (78.9%), and Health Care & Social Assistance (78.6%).
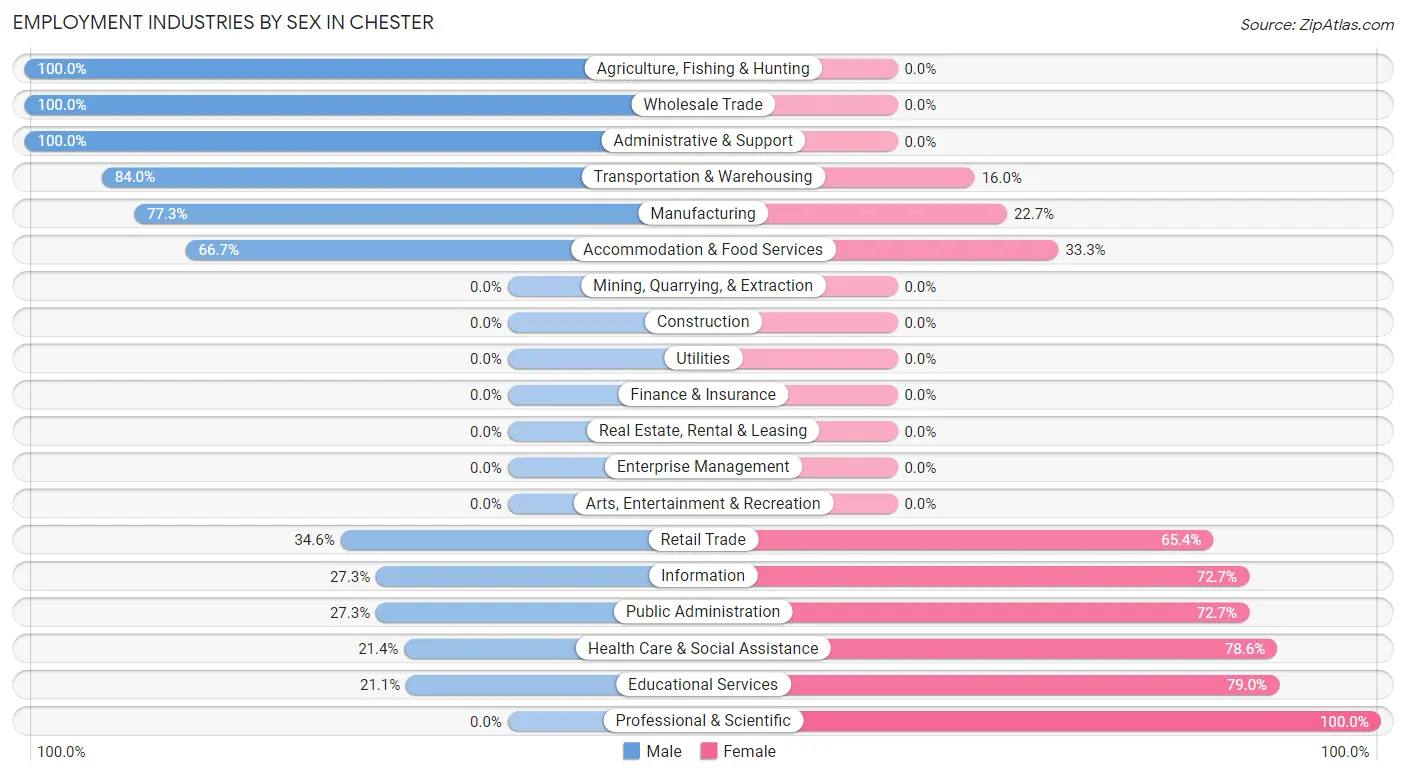
| Industry | Male | Female |
| Agriculture, Fishing & Hunting | 3 (100.0%) | 0 (0.0%) |
| Mining, Quarrying, & Extraction | 0 (0.0%) | 0 (0.0%) |
| Construction | 0 (0.0%) | 0 (0.0%) |
| Manufacturing | 58 (77.3%) | 17 (22.7%) |
| Wholesale Trade | 17 (100.0%) | 0 (0.0%) |
| Retail Trade | 18 (34.6%) | 34 (65.4%) |
| Transportation & Warehousing | 42 (84.0%) | 8 (16.0%) |
| Utilities | 0 (0.0%) | 0 (0.0%) |
| Information | 3 (27.3%) | 8 (72.7%) |
| Finance & Insurance | 0 (0.0%) | 0 (0.0%) |
| Real Estate, Rental & Leasing | 0 (0.0%) | 0 (0.0%) |
| Professional & Scientific | 0 (0.0%) | 29 (100.0%) |
| Enterprise Management | 0 (0.0%) | 0 (0.0%) |
| Administrative & Support | 5 (100.0%) | 0 (0.0%) |
| Educational Services | 4 (21.0%) | 15 (78.9%) |
| Health Care & Social Assistance | 6 (21.4%) | 22 (78.6%) |
| Arts, Entertainment & Recreation | 0 (0.0%) | 0 (0.0%) |
| Accommodation & Food Services | 8 (66.7%) | 4 (33.3%) |
| Public Administration | 3 (27.3%) | 8 (72.7%) |
| Total | 196 (54.7%) | 162 (45.3%) |
Education in Chester
School Enrollment in Chester
The most common levels of schooling among the 253 students in Chester are high school (94 | 37.1%), elementary school (92 | 36.4%), and middle school (49 | 19.4%).
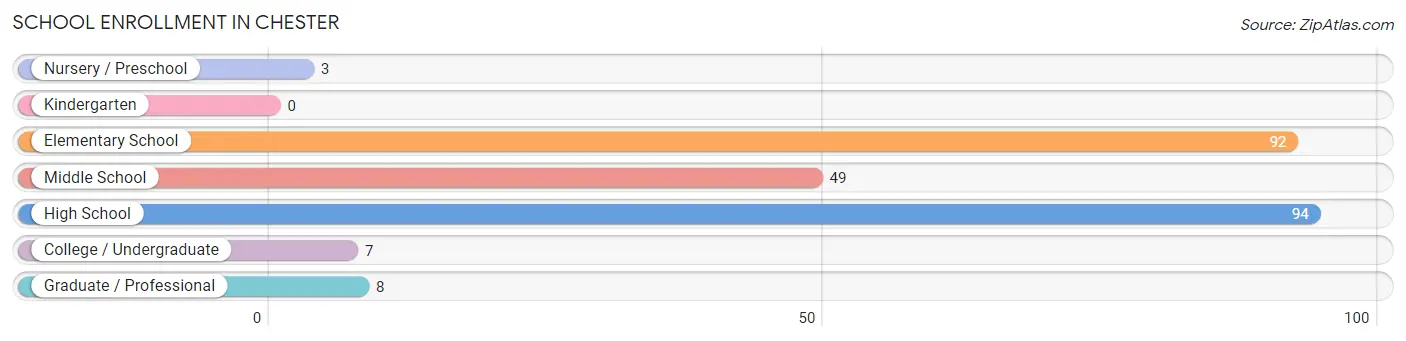
| School Level | # Students | % Students |
| Nursery / Preschool | 3 | 1.2% |
| Kindergarten | 0 | 0.0% |
| Elementary School | 92 | 36.4% |
| Middle School | 49 | 19.4% |
| High School | 94 | 37.1% |
| College / Undergraduate | 7 | 2.8% |
| Graduate / Professional | 8 | 3.2% |
| Total | 253 | 100.0% |
School Enrollment by Age by Funding Source in Chester
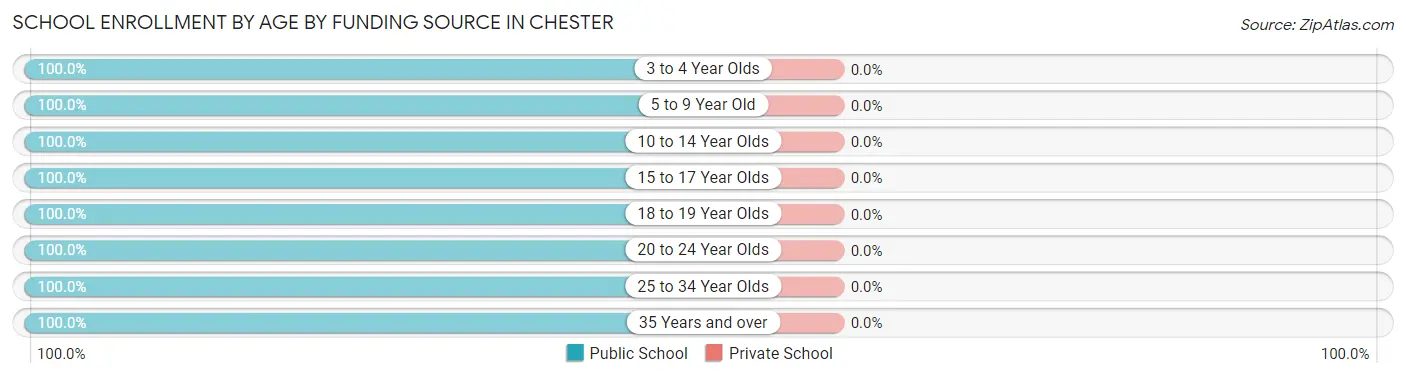
| Age Bracket | Public School | Private School |
| 3 to 4 Year Olds | 3 (100.0%) | 0 (0.0%) |
| 5 to 9 Year Old | 83 (100.0%) | 0 (0.0%) |
| 10 to 14 Year Olds | 101 (100.0%) | 0 (0.0%) |
| 15 to 17 Year Olds | 34 (100.0%) | 0 (0.0%) |
| 18 to 19 Year Olds | 17 (100.0%) | 0 (0.0%) |
| 20 to 24 Year Olds | 3 (100.0%) | 0 (0.0%) |
| 25 to 34 Year Olds | 4 (100.0%) | 0 (0.0%) |
| 35 Years and over | 8 (100.0%) | 0 (0.0%) |
| Total | 253 (100.0%) | 0 (0.0%) |
Educational Attainment by Field of Study in Chester
Computers & mathematics (24 | 35.3%), bio, nature & agricultural (15 | 22.1%), visual & performing arts (9 | 13.2%), social sciences (4 | 5.9%), and engineering (4 | 5.9%) are the most common fields of study among 68 individuals in Chester who have obtained a bachelor's degree or higher.
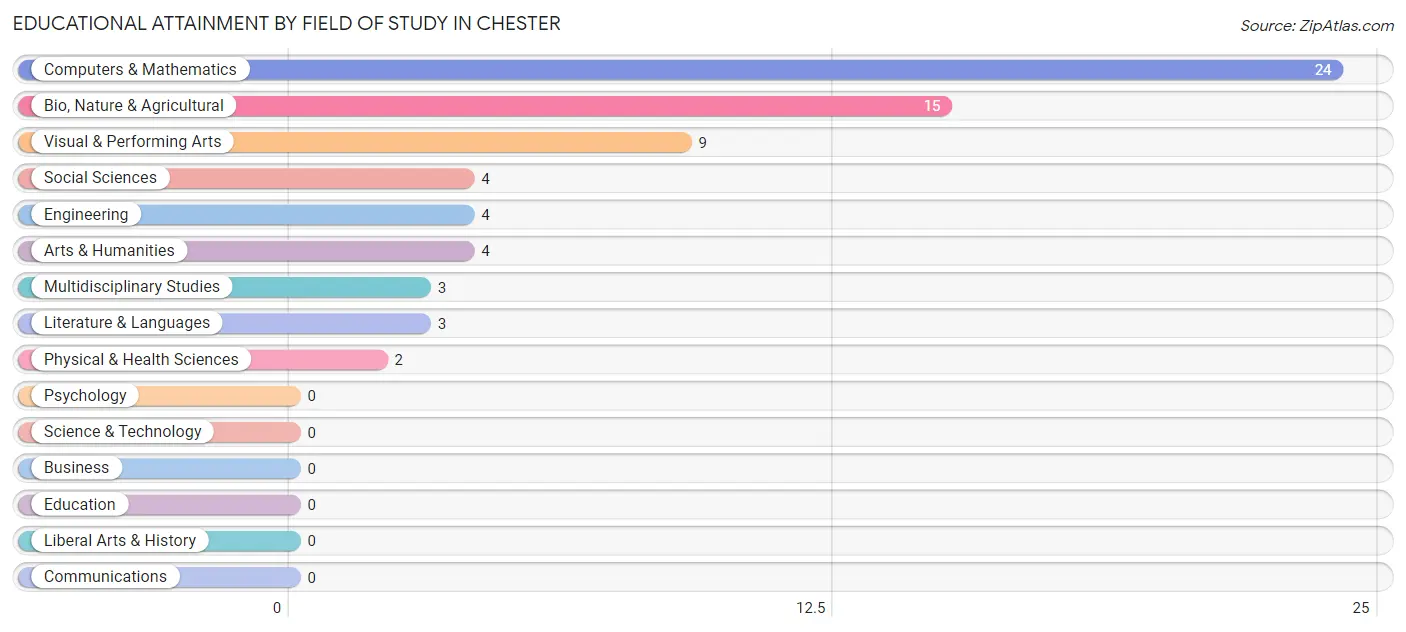
| Field of Study | # Graduates | % Graduates |
| Computers & Mathematics | 24 | 35.3% |
| Bio, Nature & Agricultural | 15 | 22.1% |
| Physical & Health Sciences | 2 | 2.9% |
| Psychology | 0 | 0.0% |
| Social Sciences | 4 | 5.9% |
| Engineering | 4 | 5.9% |
| Multidisciplinary Studies | 3 | 4.4% |
| Science & Technology | 0 | 0.0% |
| Business | 0 | 0.0% |
| Education | 0 | 0.0% |
| Literature & Languages | 3 | 4.4% |
| Liberal Arts & History | 0 | 0.0% |
| Visual & Performing Arts | 9 | 13.2% |
| Communications | 0 | 0.0% |
| Arts & Humanities | 4 | 5.9% |
| Total | 68 | 100.0% |
Transportation & Commute in Chester
Vehicle Availability by Sex in Chester
The most prevalent vehicle ownership categories in Chester are males with 2 vehicles (113, accounting for 57.7%) and females with 2 vehicles (81, making up 71.1%).
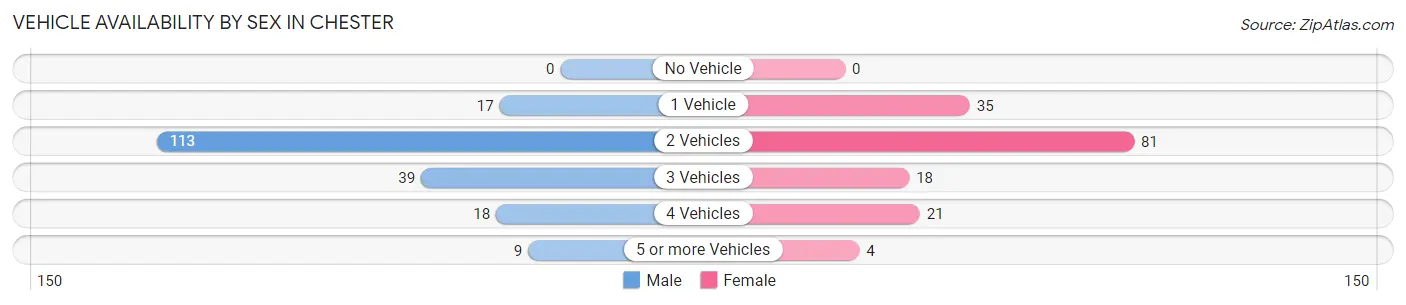
| Vehicles Available | Male | Female |
| No Vehicle | 0 (0.0%) | 0 (0.0%) |
| 1 Vehicle | 17 (8.7%) | 35 (22.0%) |
| 2 Vehicles | 113 (57.7%) | 81 (50.9%) |
| 3 Vehicles | 39 (19.9%) | 18 (11.3%) |
| 4 Vehicles | 18 (9.2%) | 21 (13.2%) |
| 5 or more Vehicles | 9 (4.6%) | 4 (2.5%) |
| Total | 196 (100.0%) | 159 (100.0%) |
Commute Time in Chester
The most frequently occuring commute durations in Chester are 40 to 44 minutes (89 commuters, 25.3%), 30 to 34 minutes (71 commuters, 20.2%), and 25 to 29 minutes (46 commuters, 13.1%).
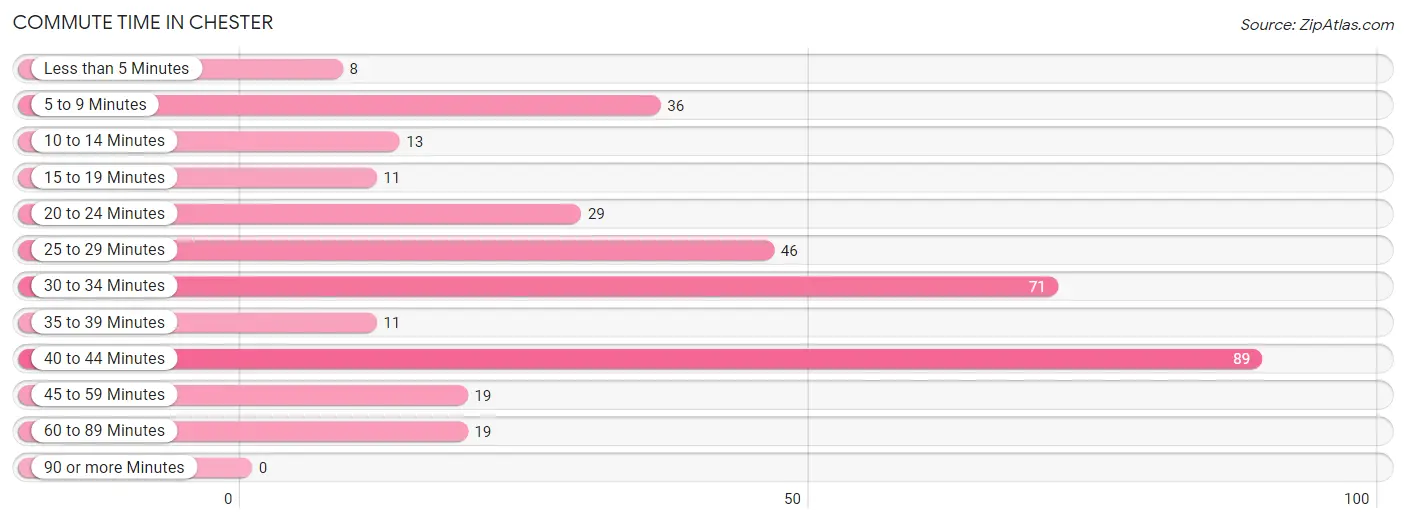
| Commute Time | # Commuters | % Commuters |
| Less than 5 Minutes | 8 | 2.3% |
| 5 to 9 Minutes | 36 | 10.2% |
| 10 to 14 Minutes | 13 | 3.7% |
| 15 to 19 Minutes | 11 | 3.1% |
| 20 to 24 Minutes | 29 | 8.2% |
| 25 to 29 Minutes | 46 | 13.1% |
| 30 to 34 Minutes | 71 | 20.2% |
| 35 to 39 Minutes | 11 | 3.1% |
| 40 to 44 Minutes | 89 | 25.3% |
| 45 to 59 Minutes | 19 | 5.4% |
| 60 to 89 Minutes | 19 | 5.4% |
| 90 or more Minutes | 0 | 0.0% |
Commute Time by Sex in Chester
The most common commute times in Chester are 25 to 29 minutes (46 commuters, 23.5%) for males and 40 to 44 minutes (48 commuters, 30.8%) for females.
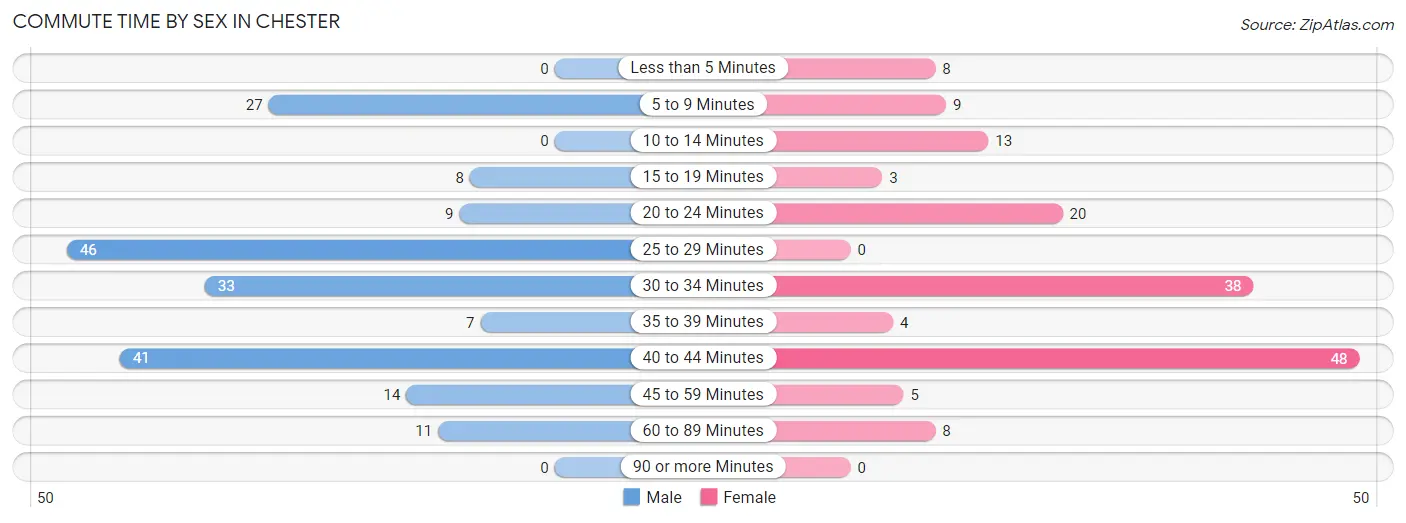
| Commute Time | Male | Female |
| Less than 5 Minutes | 0 (0.0%) | 8 (5.1%) |
| 5 to 9 Minutes | 27 (13.8%) | 9 (5.8%) |
| 10 to 14 Minutes | 0 (0.0%) | 13 (8.3%) |
| 15 to 19 Minutes | 8 (4.1%) | 3 (1.9%) |
| 20 to 24 Minutes | 9 (4.6%) | 20 (12.8%) |
| 25 to 29 Minutes | 46 (23.5%) | 0 (0.0%) |
| 30 to 34 Minutes | 33 (16.8%) | 38 (24.4%) |
| 35 to 39 Minutes | 7 (3.6%) | 4 (2.6%) |
| 40 to 44 Minutes | 41 (20.9%) | 48 (30.8%) |
| 45 to 59 Minutes | 14 (7.1%) | 5 (3.2%) |
| 60 to 89 Minutes | 11 (5.6%) | 8 (5.1%) |
| 90 or more Minutes | 0 (0.0%) | 0 (0.0%) |
Time of Departure to Work by Sex in Chester
The most frequent times of departure to work in Chester are 5:30 AM to 5:59 AM (50, 25.5%) for males and 7:00 AM to 7:29 AM (30, 19.2%) for females.
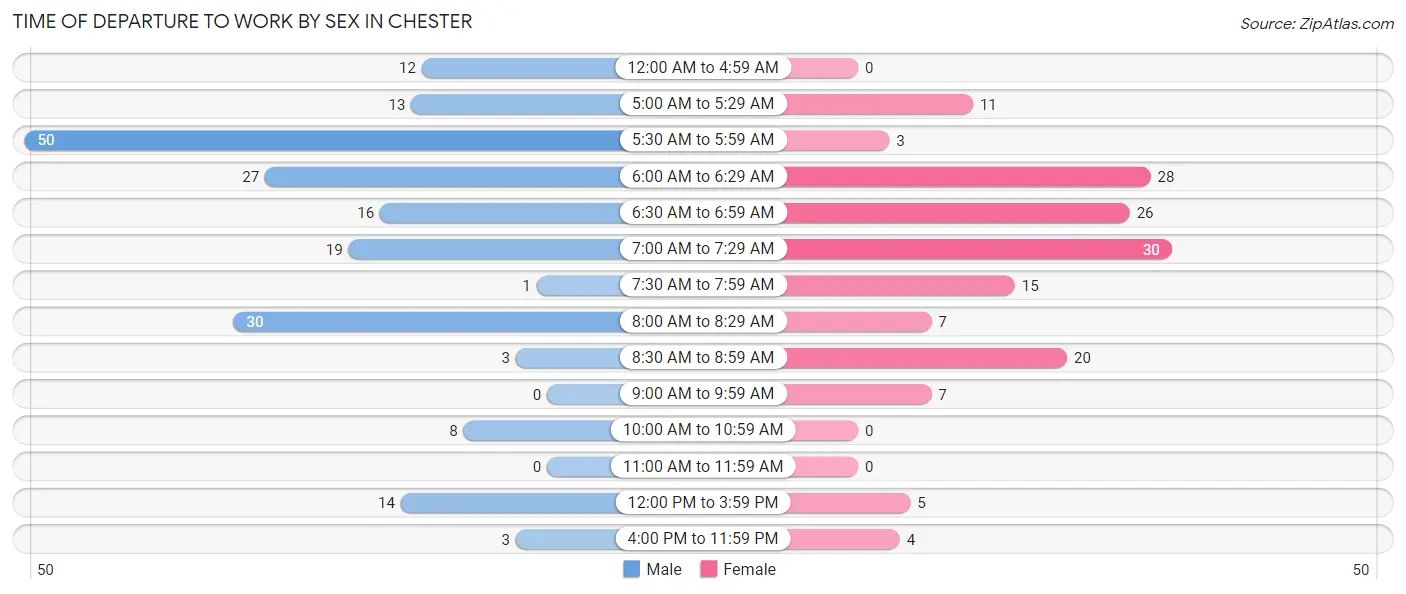
| Time of Departure | Male | Female |
| 12:00 AM to 4:59 AM | 12 (6.1%) | 0 (0.0%) |
| 5:00 AM to 5:29 AM | 13 (6.6%) | 11 (7.0%) |
| 5:30 AM to 5:59 AM | 50 (25.5%) | 3 (1.9%) |
| 6:00 AM to 6:29 AM | 27 (13.8%) | 28 (17.9%) |
| 6:30 AM to 6:59 AM | 16 (8.2%) | 26 (16.7%) |
| 7:00 AM to 7:29 AM | 19 (9.7%) | 30 (19.2%) |
| 7:30 AM to 7:59 AM | 1 (0.5%) | 15 (9.6%) |
| 8:00 AM to 8:29 AM | 30 (15.3%) | 7 (4.5%) |
| 8:30 AM to 8:59 AM | 3 (1.5%) | 20 (12.8%) |
| 9:00 AM to 9:59 AM | 0 (0.0%) | 7 (4.5%) |
| 10:00 AM to 10:59 AM | 8 (4.1%) | 0 (0.0%) |
| 11:00 AM to 11:59 AM | 0 (0.0%) | 0 (0.0%) |
| 12:00 PM to 3:59 PM | 14 (7.1%) | 5 (3.2%) |
| 4:00 PM to 11:59 PM | 3 (1.5%) | 4 (2.6%) |
| Total | 196 (100.0%) | 156 (100.0%) |
Housing Occupancy in Chester
Occupancy by Ownership in Chester
Of the total 254 dwellings in Chester, owner-occupied units account for 163 (64.2%), while renter-occupied units make up 91 (35.8%).
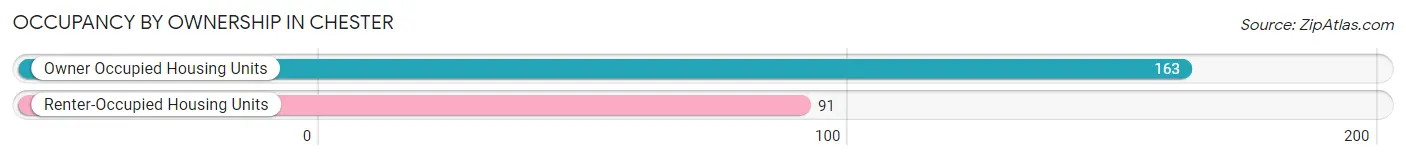
| Occupancy | # Housing Units | % Housing Units |
| Owner Occupied Housing Units | 163 | 64.2% |
| Renter-Occupied Housing Units | 91 | 35.8% |
| Total Occupied Housing Units | 254 | 100.0% |
Occupancy by Household Size in Chester
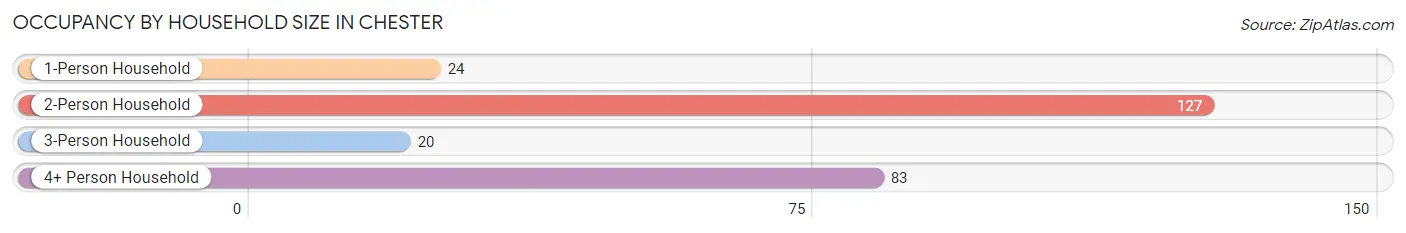
| Household Size | # Housing Units | % Housing Units |
| 1-Person Household | 24 | 9.5% |
| 2-Person Household | 127 | 50.0% |
| 3-Person Household | 20 | 7.9% |
| 4+ Person Household | 83 | 32.7% |
| Total Housing Units | 254 | 100.0% |
Occupancy by Ownership by Household Size in Chester
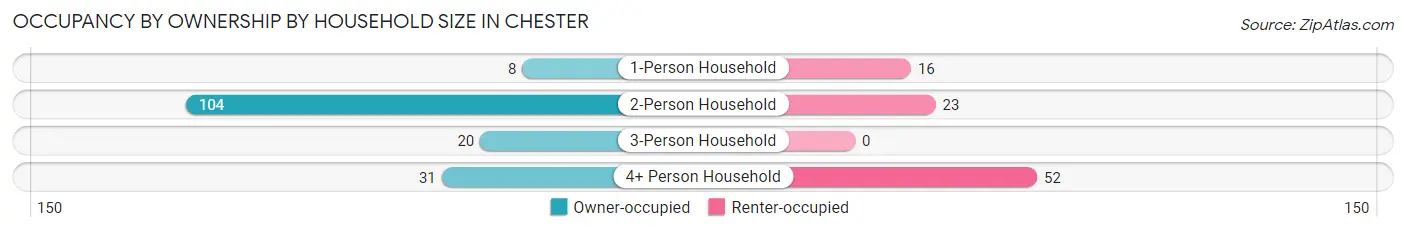
| Household Size | Owner-occupied | Renter-occupied |
| 1-Person Household | 8 (33.3%) | 16 (66.7%) |
| 2-Person Household | 104 (81.9%) | 23 (18.1%) |
| 3-Person Household | 20 (100.0%) | 0 (0.0%) |
| 4+ Person Household | 31 (37.3%) | 52 (62.6%) |
| Total Housing Units | 163 (64.2%) | 91 (35.8%) |
Occupancy by Educational Attainment in Chester
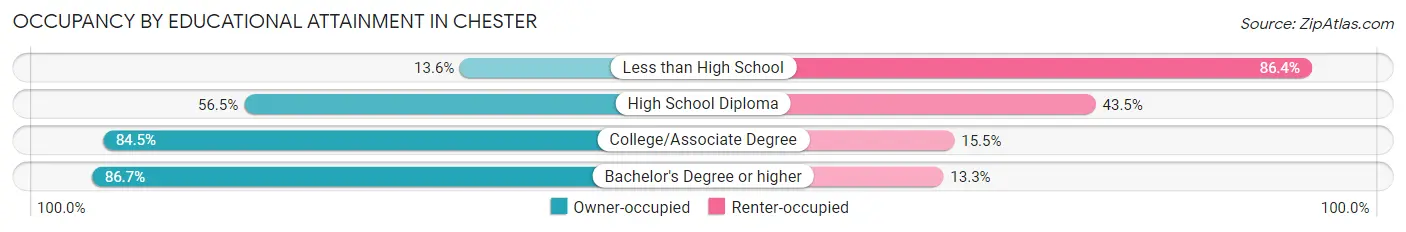
| Household Size | Owner-occupied | Renter-occupied |
| Less than High School | 3 (13.6%) | 19 (86.4%) |
| High School Diploma | 74 (56.5%) | 57 (43.5%) |
| College/Associate Degree | 60 (84.5%) | 11 (15.5%) |
| Bachelor's Degree or higher | 26 (86.7%) | 4 (13.3%) |
Occupancy by Age of Householder in Chester
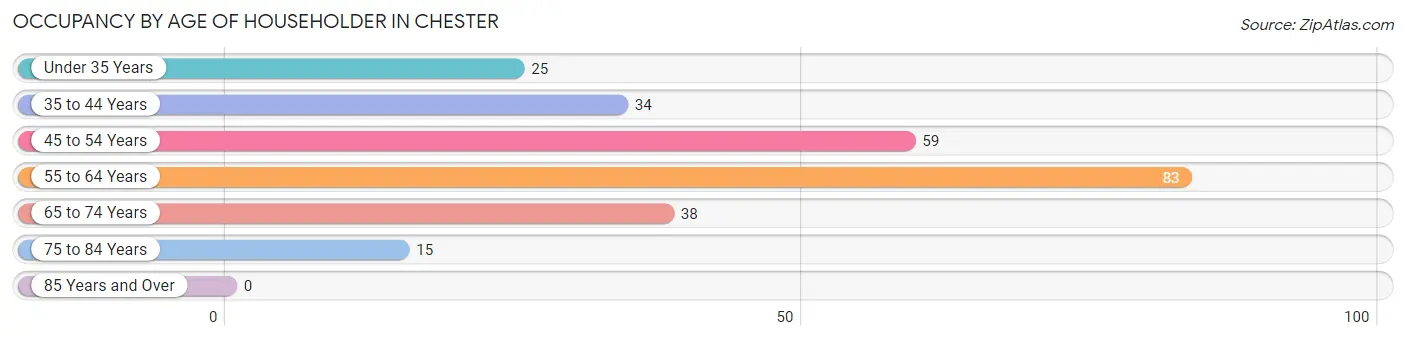
| Age Bracket | # Households | % Households |
| Under 35 Years | 25 | 9.8% |
| 35 to 44 Years | 34 | 13.4% |
| 45 to 54 Years | 59 | 23.2% |
| 55 to 64 Years | 83 | 32.7% |
| 65 to 74 Years | 38 | 15.0% |
| 75 to 84 Years | 15 | 5.9% |
| 85 Years and Over | 0 | 0.0% |
| Total | 254 | 100.0% |
Housing Finances in Chester
Median Income by Occupancy in Chester
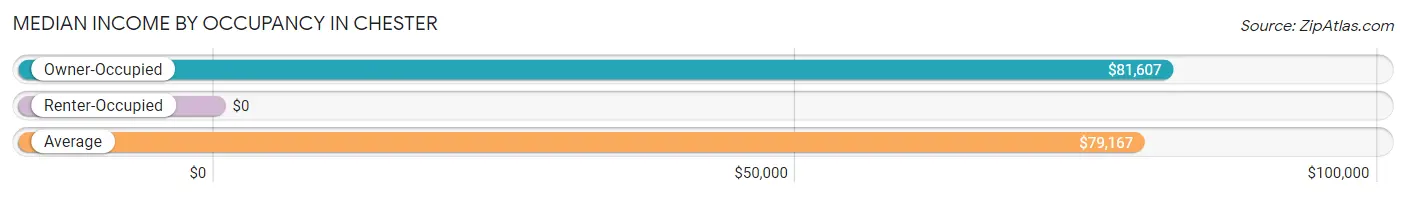
| Occupancy Type | # Households | Median Income |
| Owner-Occupied | 163 (64.2%) | $81,607 |
| Renter-Occupied | 91 (35.8%) | $0 |
| Average | 254 (100.0%) | $79,167 |
Occupancy by Householder Income Bracket in Chester
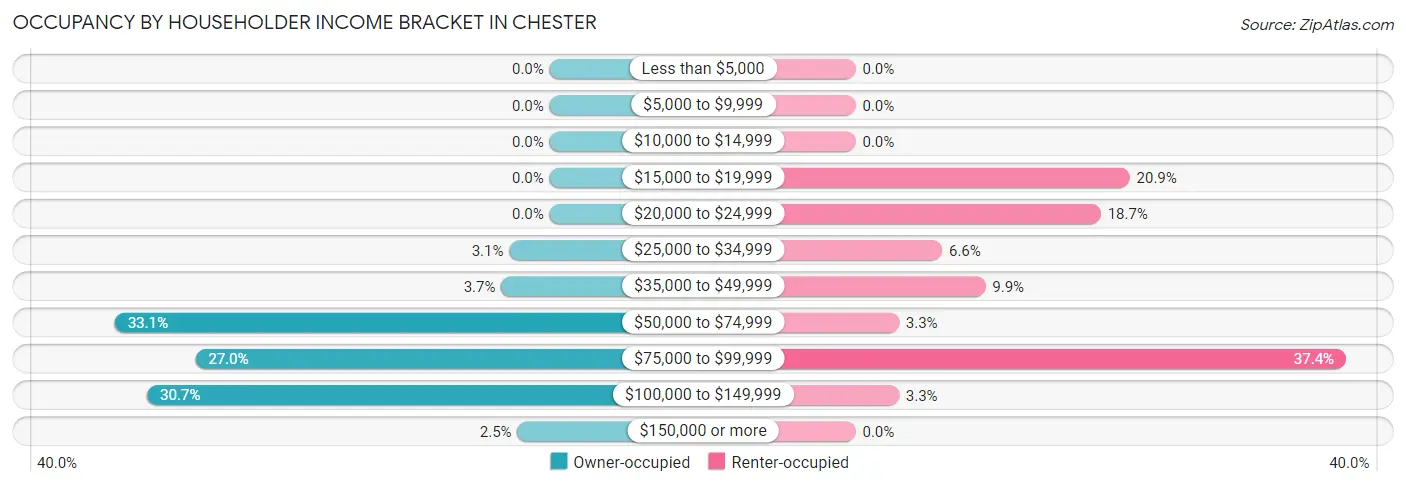
| Income Bracket | Owner-occupied | Renter-occupied |
| Less than $5,000 | 0 (0.0%) | 0 (0.0%) |
| $5,000 to $9,999 | 0 (0.0%) | 0 (0.0%) |
| $10,000 to $14,999 | 0 (0.0%) | 0 (0.0%) |
| $15,000 to $19,999 | 0 (0.0%) | 19 (20.9%) |
| $20,000 to $24,999 | 0 (0.0%) | 17 (18.7%) |
| $25,000 to $34,999 | 5 (3.1%) | 6 (6.6%) |
| $35,000 to $49,999 | 6 (3.7%) | 9 (9.9%) |
| $50,000 to $74,999 | 54 (33.1%) | 3 (3.3%) |
| $75,000 to $99,999 | 44 (27.0%) | 34 (37.4%) |
| $100,000 to $149,999 | 50 (30.7%) | 3 (3.3%) |
| $150,000 or more | 4 (2.5%) | 0 (0.0%) |
| Total | 163 (100.0%) | 91 (100.0%) |
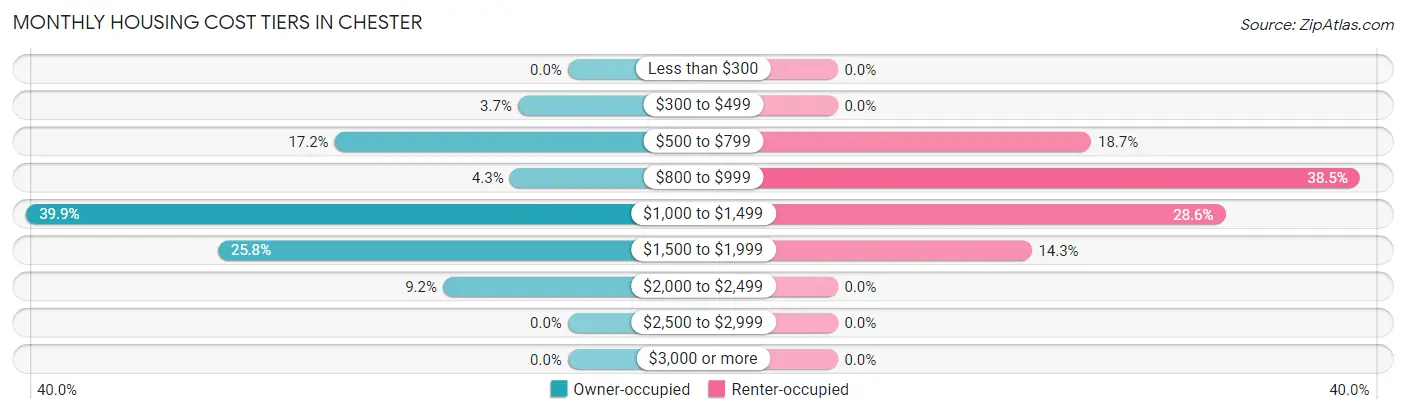
Monthly Housing Cost Tiers in Chester
| Monthly Cost | Owner-occupied | Renter-occupied |
| Less than $300 | 0 (0.0%) | 0 (0.0%) |
| $300 to $499 | 6 (3.7%) | 0 (0.0%) |
| $500 to $799 | 28 (17.2%) | 17 (18.7%) |
| $800 to $999 | 7 (4.3%) | 35 (38.5%) |
| $1,000 to $1,499 | 65 (39.9%) | 26 (28.6%) |
| $1,500 to $1,999 | 42 (25.8%) | 13 (14.3%) |
| $2,000 to $2,499 | 15 (9.2%) | 0 (0.0%) |
| $2,500 to $2,999 | 0 (0.0%) | 0 (0.0%) |
| $3,000 or more | 0 (0.0%) | 0 (0.0%) |
| Total | 163 (100.0%) | 91 (100.0%) |
Physical Housing Characteristics in Chester
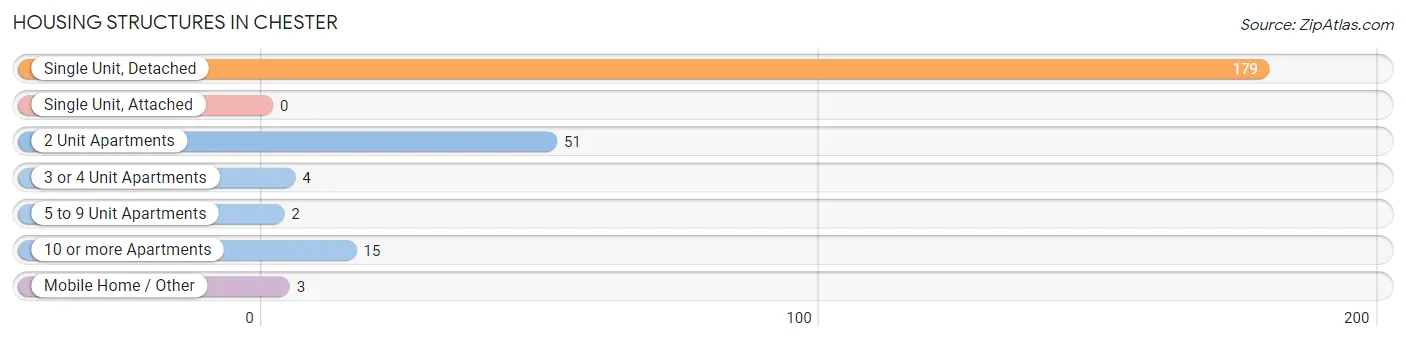
Housing Structures in Chester
| Structure Type | # Housing Units | % Housing Units |
| Single Unit, Detached | 179 | 70.5% |
| Single Unit, Attached | 0 | 0.0% |
| 2 Unit Apartments | 51 | 20.1% |
| 3 or 4 Unit Apartments | 4 | 1.6% |
| 5 to 9 Unit Apartments | 2 | 0.8% |
| 10 or more Apartments | 15 | 5.9% |
| Mobile Home / Other | 3 | 1.2% |
| Total | 254 | 100.0% |
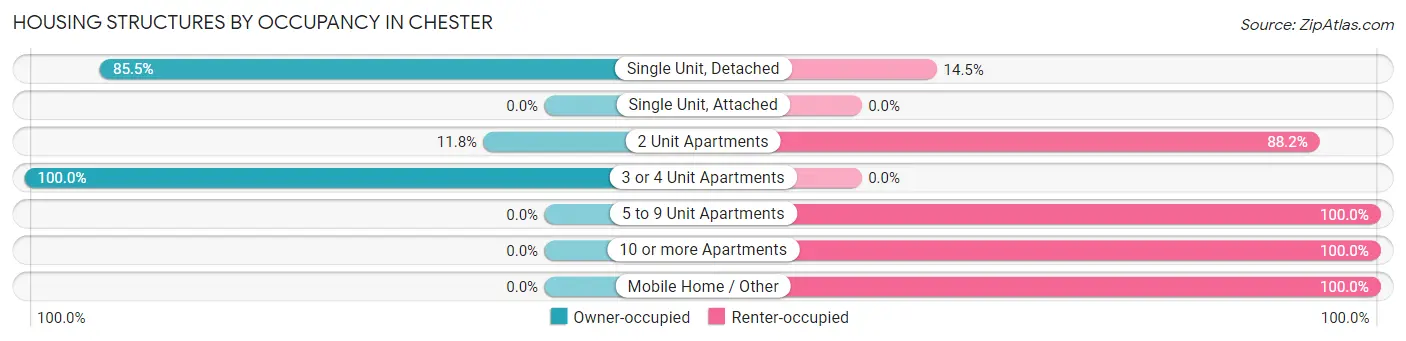
Housing Structures by Occupancy in Chester
| Structure Type | Owner-occupied | Renter-occupied |
| Single Unit, Detached | 153 (85.5%) | 26 (14.5%) |
| Single Unit, Attached | 0 (0.0%) | 0 (0.0%) |
| 2 Unit Apartments | 6 (11.8%) | 45 (88.2%) |
| 3 or 4 Unit Apartments | 4 (100.0%) | 0 (0.0%) |
| 5 to 9 Unit Apartments | 0 (0.0%) | 2 (100.0%) |
| 10 or more Apartments | 0 (0.0%) | 15 (100.0%) |
| Mobile Home / Other | 0 (0.0%) | 3 (100.0%) |
| Total | 163 (64.2%) | 91 (35.8%) |
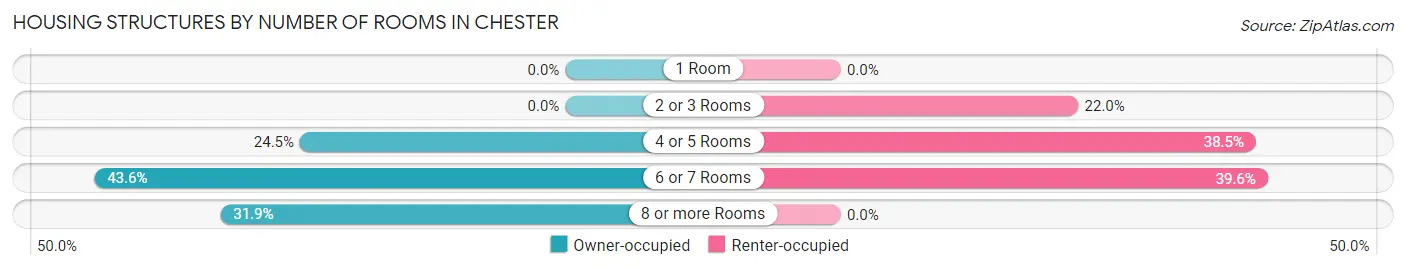
Housing Structures by Number of Rooms in Chester
| Number of Rooms | Owner-occupied | Renter-occupied |
| 1 Room | 0 (0.0%) | 0 (0.0%) |
| 2 or 3 Rooms | 0 (0.0%) | 20 (22.0%) |
| 4 or 5 Rooms | 40 (24.5%) | 35 (38.5%) |
| 6 or 7 Rooms | 71 (43.6%) | 36 (39.6%) |
| 8 or more Rooms | 52 (31.9%) | 0 (0.0%) |
| Total | 163 (100.0%) | 91 (100.0%) |
Housing Structure by Heating Type in Chester
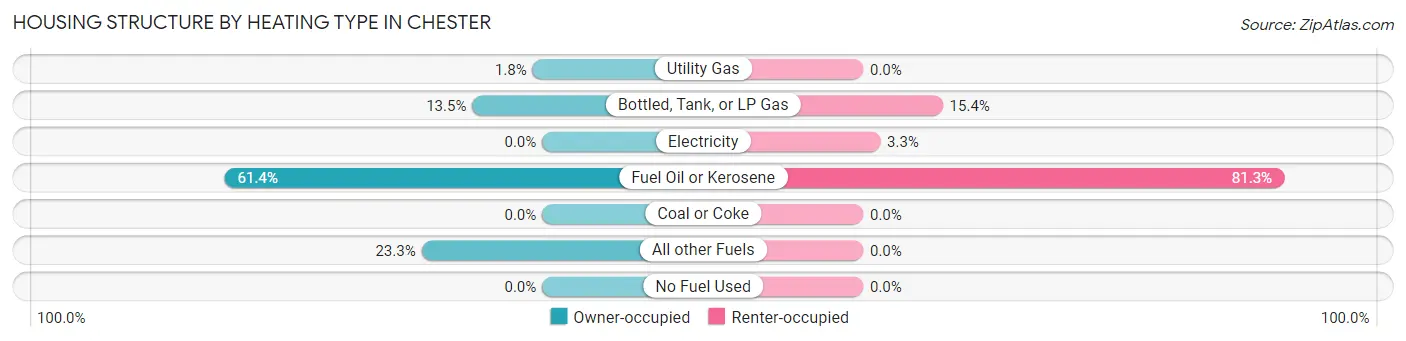
| Heating Type | Owner-occupied | Renter-occupied |
| Utility Gas | 3 (1.8%) | 0 (0.0%) |
| Bottled, Tank, or LP Gas | 22 (13.5%) | 14 (15.4%) |
| Electricity | 0 (0.0%) | 3 (3.3%) |
| Fuel Oil or Kerosene | 100 (61.4%) | 74 (81.3%) |
| Coal or Coke | 0 (0.0%) | 0 (0.0%) |
| All other Fuels | 38 (23.3%) | 0 (0.0%) |
| No Fuel Used | 0 (0.0%) | 0 (0.0%) |
| Total | 163 (100.0%) | 91 (100.0%) |
Household Vehicle Usage in Chester
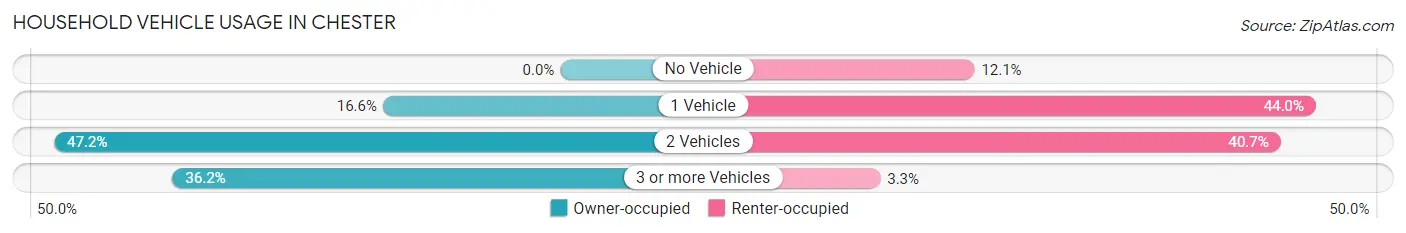
| Vehicles per Household | Owner-occupied | Renter-occupied |
| No Vehicle | 0 (0.0%) | 11 (12.1%) |
| 1 Vehicle | 27 (16.6%) | 40 (44.0%) |
| 2 Vehicles | 77 (47.2%) | 37 (40.7%) |
| 3 or more Vehicles | 59 (36.2%) | 3 (3.3%) |
| Total | 163 (100.0%) | 91 (100.0%) |
Real Estate & Mortgages in Chester
Real Estate and Mortgage Overview in Chester
| Characteristic | Without Mortgage | With Mortgage |
| Housing Units | 35 | 128 |
| Median Property Value | - | - |
| Median Household Income | $100,250 | $4 |
| Monthly Housing Costs | $704 | $0 |
| Real Estate Taxes | $3,773 | $0 |
Property Value by Mortgage Status in Chester
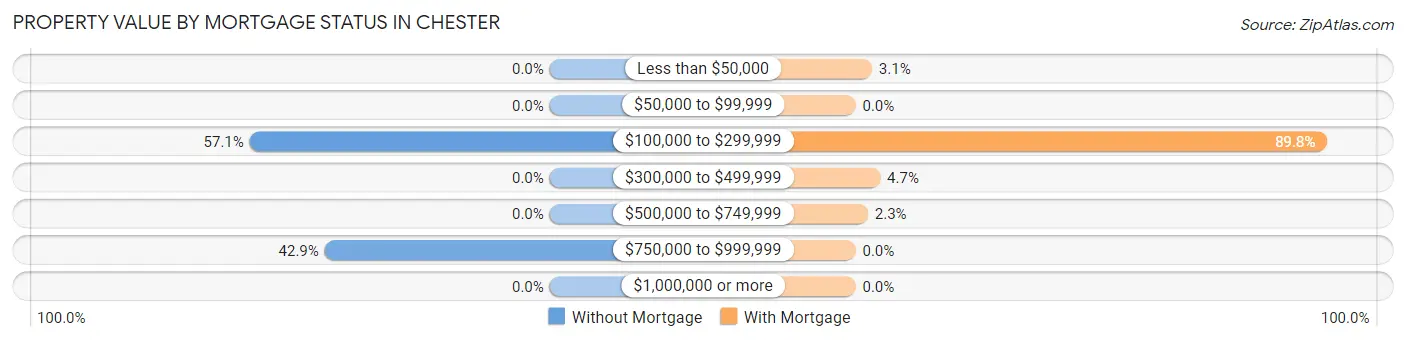
| Property Value | Without Mortgage | With Mortgage |
| Less than $50,000 | 0 (0.0%) | 4 (3.1%) |
| $50,000 to $99,999 | 0 (0.0%) | 0 (0.0%) |
| $100,000 to $299,999 | 20 (57.1%) | 115 (89.8%) |
| $300,000 to $499,999 | 0 (0.0%) | 6 (4.7%) |
| $500,000 to $749,999 | 0 (0.0%) | 3 (2.3%) |
| $750,000 to $999,999 | 15 (42.9%) | 0 (0.0%) |
| $1,000,000 or more | 0 (0.0%) | 0 (0.0%) |
| Total | 35 (100.0%) | 128 (100.0%) |
Household Income by Mortgage Status in Chester
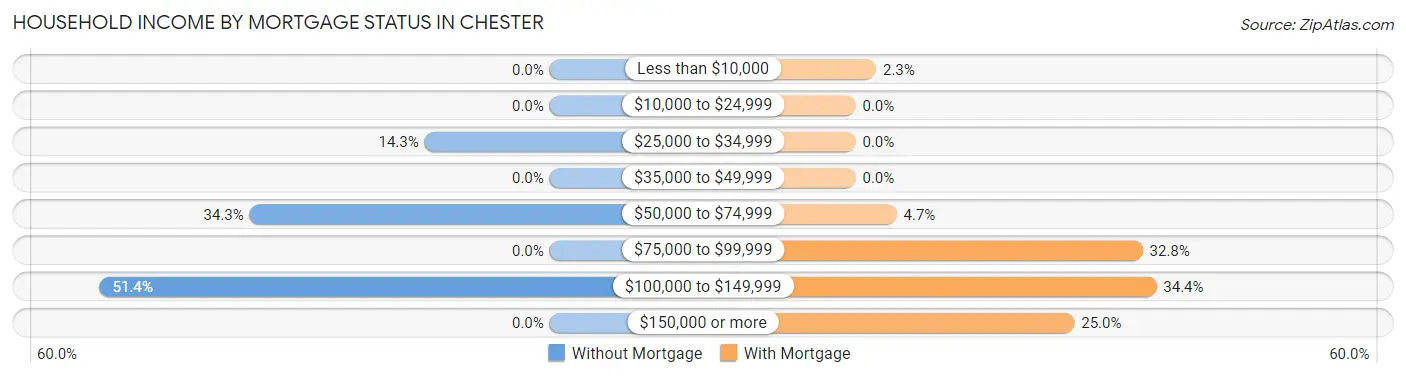
| Household Income | Without Mortgage | With Mortgage |
| Less than $10,000 | 0 (0.0%) | 3 (2.3%) |
| $10,000 to $24,999 | 0 (0.0%) | 0 (0.0%) |
| $25,000 to $34,999 | 5 (14.3%) | 0 (0.0%) |
| $35,000 to $49,999 | 0 (0.0%) | 0 (0.0%) |
| $50,000 to $74,999 | 12 (34.3%) | 6 (4.7%) |
| $75,000 to $99,999 | 0 (0.0%) | 42 (32.8%) |
| $100,000 to $149,999 | 18 (51.4%) | 44 (34.4%) |
| $150,000 or more | 0 (0.0%) | 32 (25.0%) |
| Total | 35 (100.0%) | 128 (100.0%) |
Property Value to Household Income Ratio in Chester
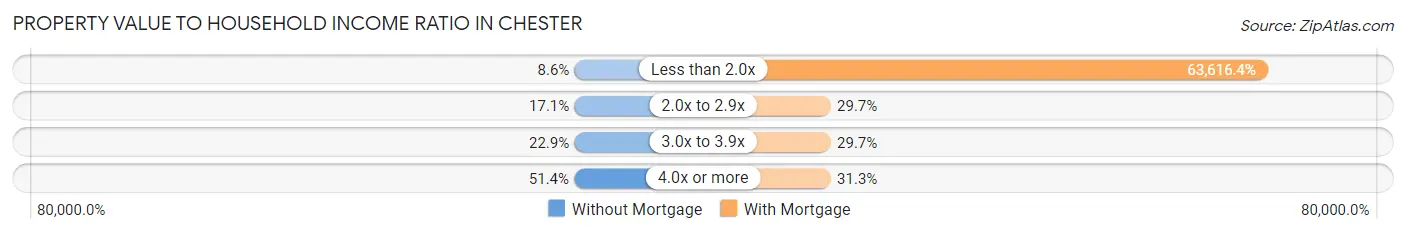
| Value-to-Income Ratio | Without Mortgage | With Mortgage |
| Less than 2.0x | 3 (8.6%) | 81,429 (63,616.4%) |
| 2.0x to 2.9x | 6 (17.1%) | 38 (29.7%) |
| 3.0x to 3.9x | 8 (22.9%) | 38 (29.7%) |
| 4.0x or more | 18 (51.4%) | 40 (31.2%) |
| Total | 35 (100.0%) | 128 (100.0%) |
Real Estate Taxes by Mortgage Status in Chester
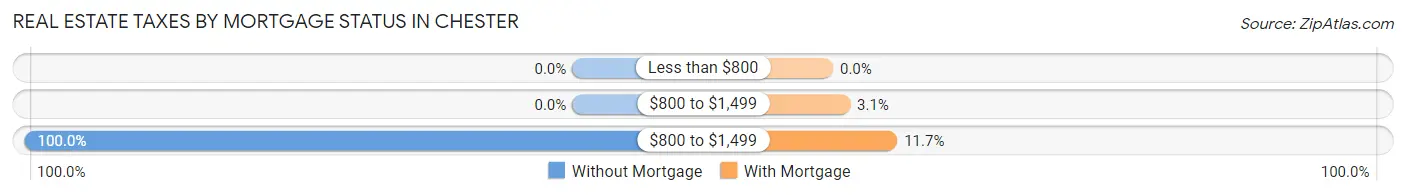
| Property Taxes | Without Mortgage | With Mortgage |
| Less than $800 | 0 (0.0%) | 0 (0.0%) |
| $800 to $1,499 | 0 (0.0%) | 4 (3.1%) |
| $800 to $1,499 | 35 (100.0%) | 15 (11.7%) |
| Total | 35 (100.0%) | 128 (100.0%) |
Health & Disability in Chester
Health Insurance Coverage by Age in Chester
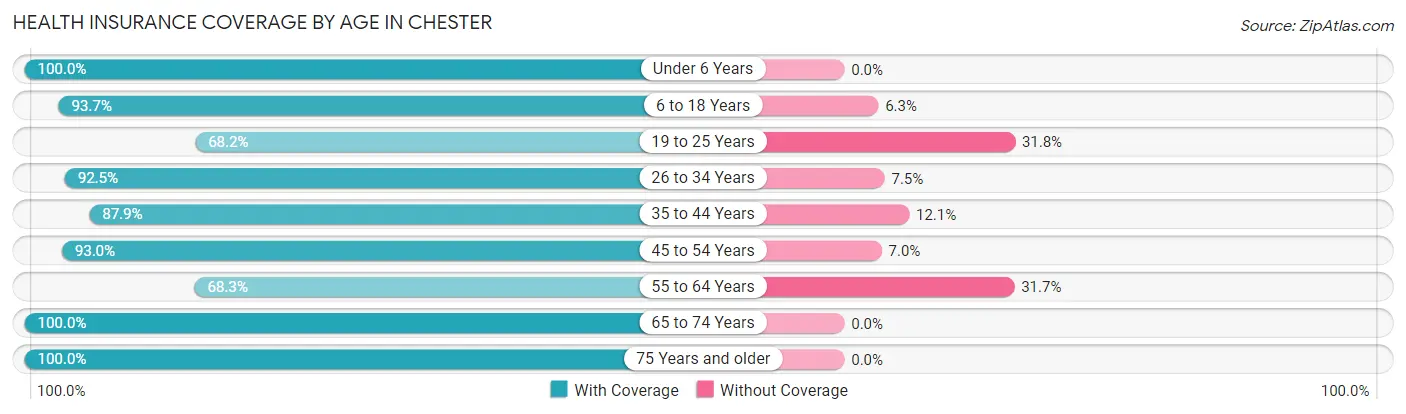
| Age Bracket | With Coverage | Without Coverage |
| Under 6 Years | 14 (100.0%) | 0 (0.0%) |
| 6 to 18 Years | 222 (93.7%) | 15 (6.3%) |
| 19 to 25 Years | 30 (68.2%) | 14 (31.8%) |
| 26 to 34 Years | 37 (92.5%) | 3 (7.5%) |
| 35 to 44 Years | 51 (87.9%) | 7 (12.1%) |
| 45 to 54 Years | 147 (93.0%) | 11 (7.0%) |
| 55 to 64 Years | 97 (68.3%) | 45 (31.7%) |
| 65 to 74 Years | 72 (100.0%) | 0 (0.0%) |
| 75 Years and older | 30 (100.0%) | 0 (0.0%) |
| Total | 700 (88.0%) | 95 (11.9%) |
Health Insurance Coverage by Citizenship Status in Chester
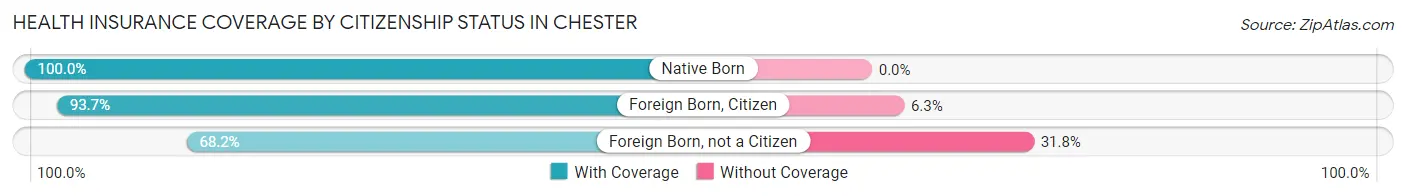
| Citizenship Status | With Coverage | Without Coverage |
| Native Born | 14 (100.0%) | 0 (0.0%) |
| Foreign Born, Citizen | 222 (93.7%) | 15 (6.3%) |
| Foreign Born, not a Citizen | 30 (68.2%) | 14 (31.8%) |
Health Insurance Coverage by Household Income in Chester
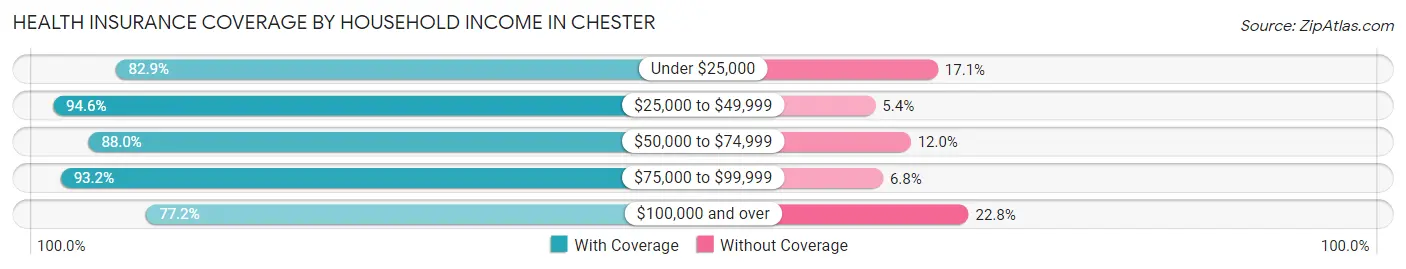
| Household Income | With Coverage | Without Coverage |
| Under $25,000 | 68 (82.9%) | 14 (17.1%) |
| $25,000 to $49,999 | 53 (94.6%) | 3 (5.4%) |
| $50,000 to $74,999 | 103 (88.0%) | 14 (12.0%) |
| $75,000 to $99,999 | 344 (93.2%) | 25 (6.8%) |
| $100,000 and over | 132 (77.2%) | 39 (22.8%) |
Public vs Private Health Insurance Coverage by Age in Chester
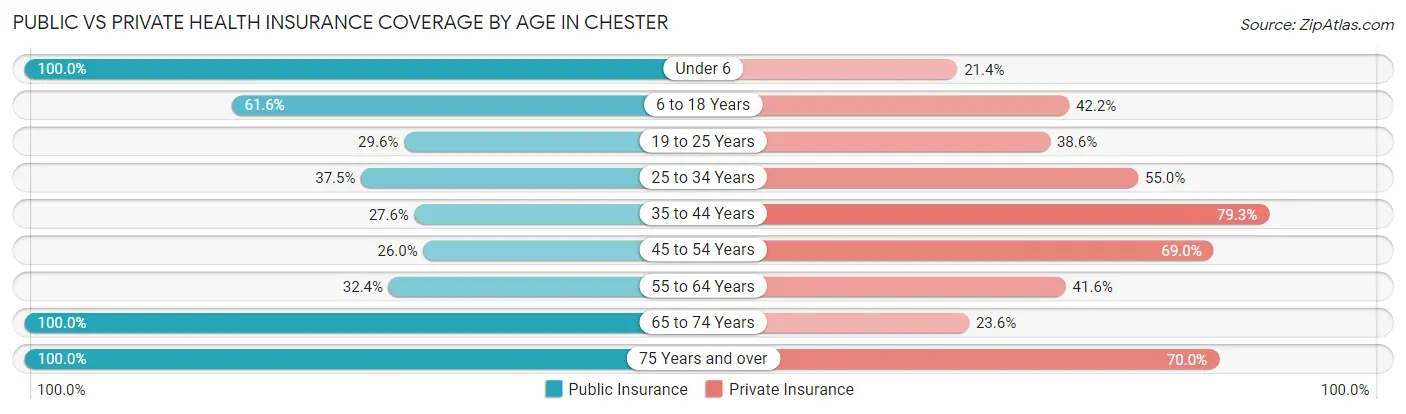
| Age Bracket | Public Insurance | Private Insurance |
| Under 6 | 14 (100.0%) | 3 (21.4%) |
| 6 to 18 Years | 146 (61.6%) | 100 (42.2%) |
| 19 to 25 Years | 13 (29.5%) | 17 (38.6%) |
| 25 to 34 Years | 15 (37.5%) | 22 (55.0%) |
| 35 to 44 Years | 16 (27.6%) | 46 (79.3%) |
| 45 to 54 Years | 41 (26.0%) | 109 (69.0%) |
| 55 to 64 Years | 46 (32.4%) | 59 (41.5%) |
| 65 to 74 Years | 72 (100.0%) | 17 (23.6%) |
| 75 Years and over | 30 (100.0%) | 21 (70.0%) |
| Total | 393 (49.4%) | 394 (49.6%) |
Disability Status by Sex by Age in Chester
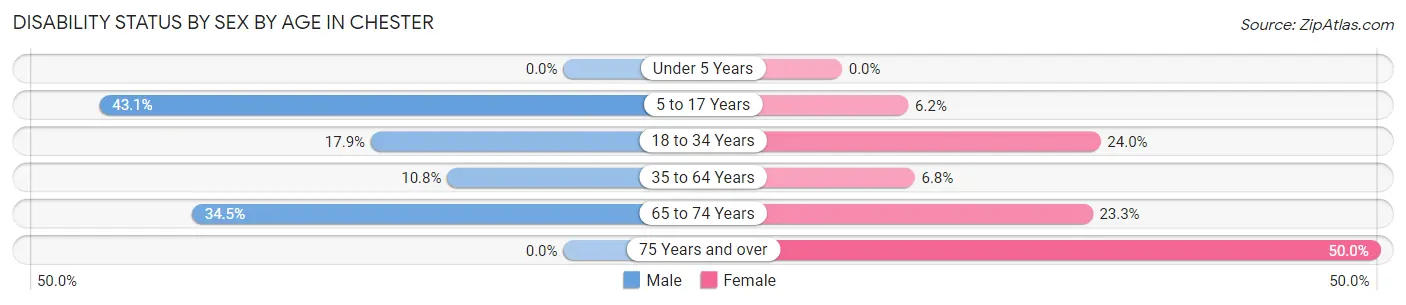
| Age Bracket | Male | Female |
| Under 5 Years | 0 (0.0%) | 0 (0.0%) |
| 5 to 17 Years | 31 (43.1%) | 9 (6.2%) |
| 18 to 34 Years | 5 (17.9%) | 18 (24.0%) |
| 35 to 64 Years | 21 (10.8%) | 11 (6.8%) |
| 65 to 74 Years | 10 (34.5%) | 10 (23.3%) |
| 75 Years and over | 0 (0.0%) | 12 (50.0%) |
Disability Class by Sex by Age in Chester
Disability Class: Hearing Difficulty
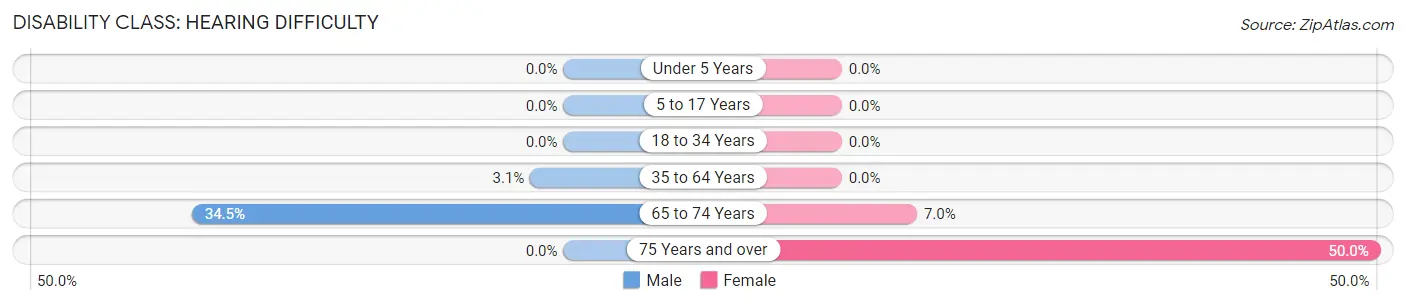
| Age Bracket | Male | Female |
| Under 5 Years | 0 (0.0%) | 0 (0.0%) |
| 5 to 17 Years | 0 (0.0%) | 0 (0.0%) |
| 18 to 34 Years | 0 (0.0%) | 0 (0.0%) |
| 35 to 64 Years | 6 (3.1%) | 0 (0.0%) |
| 65 to 74 Years | 10 (34.5%) | 3 (7.0%) |
| 75 Years and over | 0 (0.0%) | 12 (50.0%) |
Disability Class: Vision Difficulty
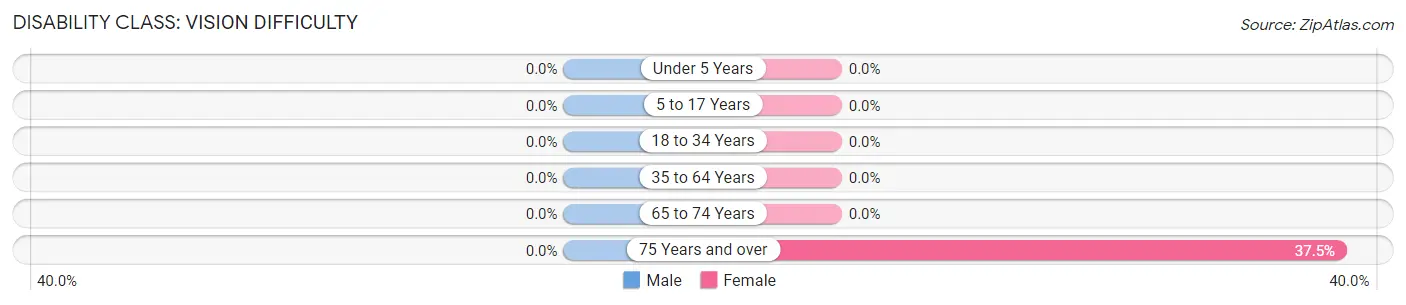
| Age Bracket | Male | Female |
| Under 5 Years | 0 (0.0%) | 0 (0.0%) |
| 5 to 17 Years | 0 (0.0%) | 0 (0.0%) |
| 18 to 34 Years | 0 (0.0%) | 0 (0.0%) |
| 35 to 64 Years | 0 (0.0%) | 0 (0.0%) |
| 65 to 74 Years | 0 (0.0%) | 0 (0.0%) |
| 75 Years and over | 0 (0.0%) | 9 (37.5%) |
Disability Class: Cognitive Difficulty
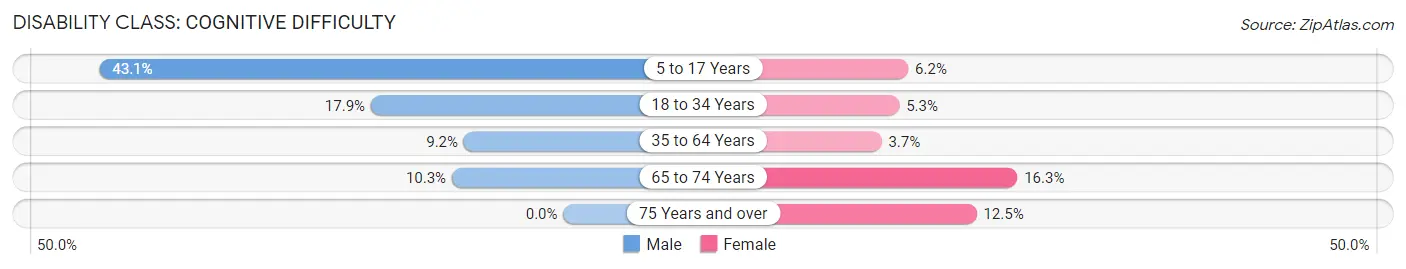
| Age Bracket | Male | Female |
| 5 to 17 Years | 31 (43.1%) | 9 (6.2%) |
| 18 to 34 Years | 5 (17.9%) | 4 (5.3%) |
| 35 to 64 Years | 18 (9.2%) | 6 (3.7%) |
| 65 to 74 Years | 3 (10.3%) | 7 (16.3%) |
| 75 Years and over | 0 (0.0%) | 3 (12.5%) |
Disability Class: Ambulatory Difficulty
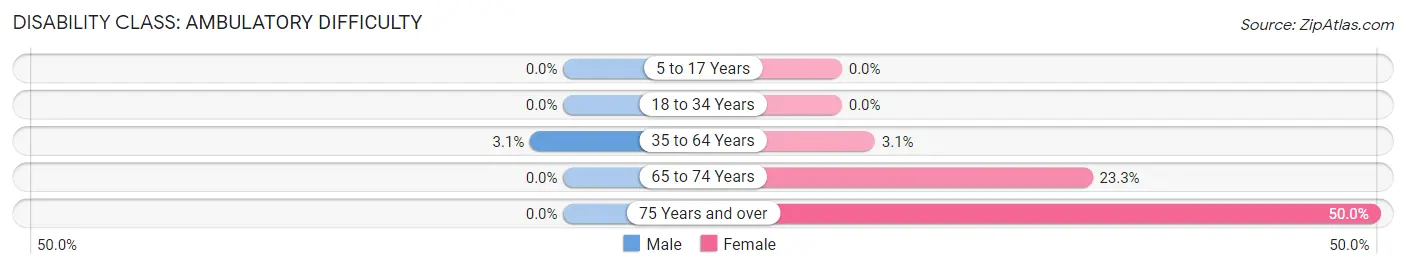
| Age Bracket | Male | Female |
| 5 to 17 Years | 0 (0.0%) | 0 (0.0%) |
| 18 to 34 Years | 0 (0.0%) | 0 (0.0%) |
| 35 to 64 Years | 6 (3.1%) | 5 (3.1%) |
| 65 to 74 Years | 0 (0.0%) | 10 (23.3%) |
| 75 Years and over | 0 (0.0%) | 12 (50.0%) |
Disability Class: Self-Care Difficulty
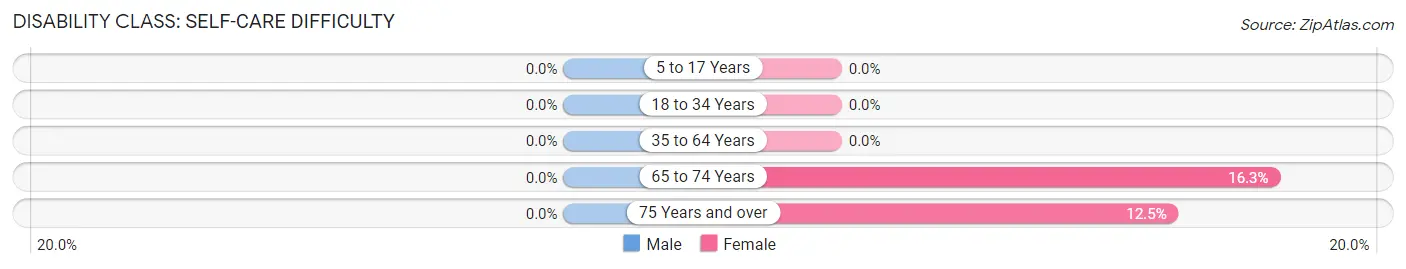
| Age Bracket | Male | Female |
| 5 to 17 Years | 0 (0.0%) | 0 (0.0%) |
| 18 to 34 Years | 0 (0.0%) | 0 (0.0%) |
| 35 to 64 Years | 0 (0.0%) | 0 (0.0%) |
| 65 to 74 Years | 0 (0.0%) | 7 (16.3%) |
| 75 Years and over | 0 (0.0%) | 3 (12.5%) |
Technology Access in Chester
Computing Device Access in Chester
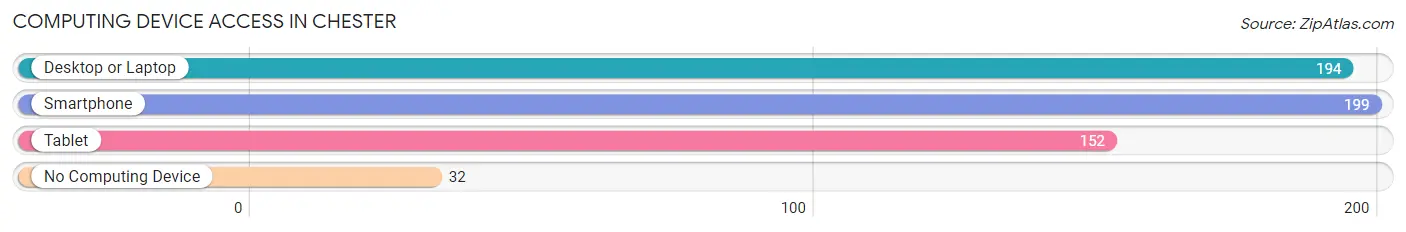
| Device Type | # Households | % Households |
| Desktop or Laptop | 194 | 76.4% |
| Smartphone | 199 | 78.3% |
| Tablet | 152 | 59.8% |
| No Computing Device | 32 | 12.6% |
| Total | 254 | 100.0% |
Internet Access in Chester
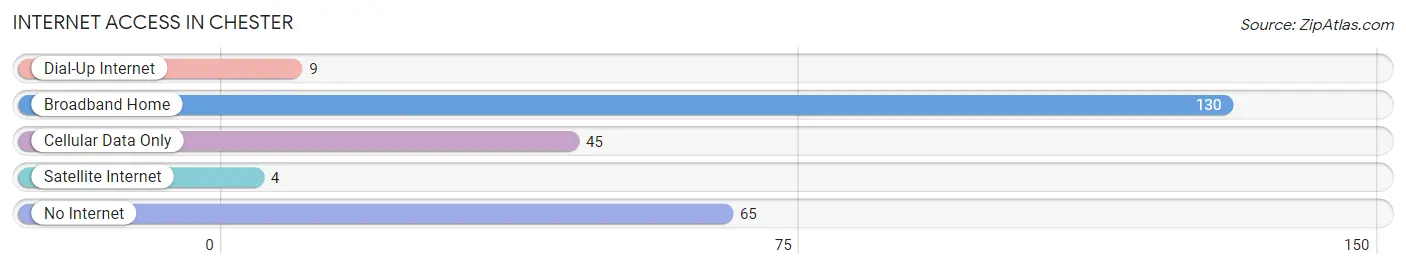
| Internet Type | # Households | % Households |
| Dial-Up Internet | 9 | 3.5% |
| Broadband Home | 130 | 51.2% |
| Cellular Data Only | 45 | 17.7% |
| Satellite Internet | 4 | 1.6% |
| No Internet | 65 | 25.6% |
| Total | 254 | 100.0% |
Chester Summary
Chester, Massachusetts is a small town located in the western part of the state, in Hampden County. It is bordered by the towns of Huntington, Blandford, Russell, Middlefield, and Becket. The town has a population of 1,945 people, according to the 2010 census.
Geography
Chester is located in the western part of Hampden County, in the foothills of the Berkshires. The town is situated on the eastern side of the Westfield River, which runs through the center of town. The town is mostly rural, with a few small villages scattered throughout. The highest point in town is the summit of East Mountain, which rises to 1,717 feet above sea level. The town is mostly forested, with some open fields and meadows.
History
Chester was first settled in 1735, and was officially incorporated in 1783. The town was named after the town of Chester in England. The town was originally an agricultural community, with many of the early settlers being farmers. The town was also home to several mills, which were powered by the Westfield River.
In the late 19th century, the town began to experience a period of growth, as the railroad was extended through the area. This allowed for the development of several small industries, such as a paper mill and a sawmill. The town also became a popular summer resort destination, as many wealthy families from Boston and New York began to build summer homes in the area.
Economy
Today, Chester is a mostly rural community, with a few small businesses located in the town. The town is home to several small farms, which produce a variety of crops, including corn, hay, and apples. The town is also home to several small businesses, such as a sawmill, a paper mill, and a few small retail stores.
Demographics
According to the 2010 census, the population of Chester was 1,945 people. The racial makeup of the town was 97.3% White, 0.7% African American, 0.3% Native American, 0.3% Asian, 0.2% from other races, and 1.2% from two or more races. Hispanic or Latino of any race were 1.2% of the population.
The median household income in Chester was $50,938, and the median family income was $60,625. The per capita income for the town was $25,945. About 8.2% of families and 10.2% of the population were below the poverty line, including 14.2% of those under age 18 and 5.2% of those age 65 or over.
Common Questions
What is the Total Population of Chester?
Total Population of Chester is 795.
What is the Total Male Population of Chester?
Total Male Population of Chester is 333.
What is the Total Female Population of Chester?
Total Female Population of Chester is 462.
What is the Ratio of Males per 100 Females in Chester?
There are 72.08 Males per 100 Females in Chester.
What is the Ratio of Females per 100 Males in Chester?
There are 138.74 Females per 100 Males in Chester.
What is the Median Population Age in Chester?
Median Population Age in Chester is 45.1 Years.
What is the Average Family Size in Chester
Average Family Size in Chester is 3.5 People.
What is the Average Household Size in Chester
Average Household Size in Chester is 3.1 People.
What is Per Capita Income in Chester?
Per Capita income in Chester is $24,574.
What is the Median Family Income in Chester?
Median Family Income in Chester is $80,845.
What is the Median Household income in Chester?
Median Household Income in Chester is $79,167.
What is Income or Wage Gap in Chester?
Income or Wage Gap in Chester is 26.0%.
Women in Chester earn 74.0 cents for every dollar earned by a man.
What is Inequality or Gini Index in Chester?
Inequality or Gini Index in Chester is 0.26.
How Large is the Labor Force in Chester?
There are 372 People in the Labor Forcein in Chester.
What is the Percentage of People in the Labor Force in Chester?
63.5% of People are in the Labor Force in Chester.
What is the Unemployment Rate in Chester?
Unemployment Rate in Chester is 3.8%.