Cities with the Highest Percentage of Single Mothers in Ohio
RELATED REPORTS & OPTIONS
Most Single Mothers
Ohio
Compare Cities
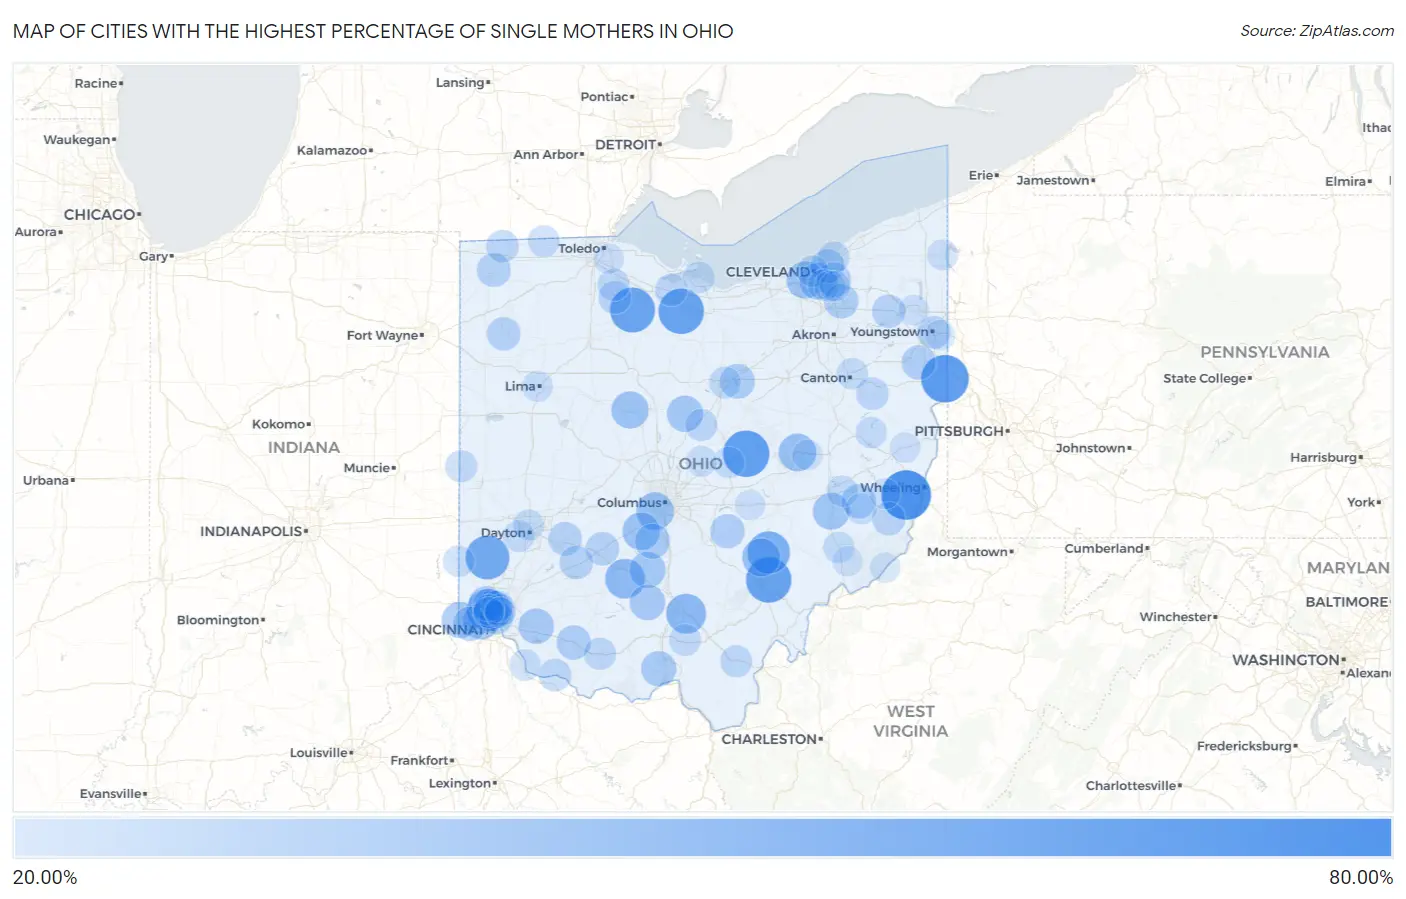
Map of Cities with the Highest Percentage of Single Mothers in Ohio
0.00%
80.00%
Cities with the Highest Percentage of Single Mothers in Ohio
| City | % Single Mothers | vs State | vs National | |
| 1. | Glencoe | 75.86% | 12.56%(+63.3)#1 | 11.49%(+64.4)#132 |
| 2. | Negley | 70.37% | 12.56%(+57.8)#2 | 11.49%(+58.9)#162 |
| 3. | Bladensburg | 67.44% | 12.56%(+54.9)#3 | 11.49%(+56.0)#180 |
| 4. | Flat Rock | 65.45% | 12.56%(+52.9)#4 | 11.49%(+54.0)#196 |
| 5. | Millfield | 64.89% | 12.56%(+52.3)#5 | 11.49%(+53.4)#204 |
| 6. | Kansas | 64.15% | 12.56%(+51.6)#6 | 11.49%(+52.7)#213 |
| 7. | South Mount Vernon | 61.49% | 12.56%(+48.9)#7 | 11.49%(+50.0)#232 |
| 8. | West Elkton | 60.61% | 12.56%(+48.0)#8 | 11.49%(+49.1)#244 |
| 9. | Rendville | 57.14% | 12.56%(+44.6)#9 | 11.49%(+45.7)#274 |
| 10. | Skyline Acres | 55.42% | 12.56%(+42.9)#10 | 11.49%(+43.9)#305 |
| 11. | Richmond Dale | 50.33% | 12.56%(+37.8)#11 | 11.49%(+38.8)#403 |
| 12. | Good Hope | 50.00% | 12.56%(+37.4)#12 | 11.49%(+38.5)#417 |
| 13. | Pleasant Hills | 47.60% | 12.56%(+35.0)#13 | 11.49%(+36.1)#513 |
| 14. | Hemlock | 45.90% | 12.56%(+33.3)#14 | 11.49%(+34.4)#553 |
| 15. | Canal Lewisville | 44.95% | 12.56%(+32.4)#15 | 11.49%(+33.5)#586 |
| 16. | Urbancrest | 44.72% | 12.56%(+32.2)#16 | 11.49%(+33.2)#596 |
| 17. | Derby | 44.44% | 12.56%(+31.9)#17 | 11.49%(+33.0)#606 |
| 18. | New Bloomington | 43.56% | 12.56%(+31.0)#18 | 11.49%(+32.1)#646 |
| 19. | Linndale | 43.24% | 12.56%(+30.7)#19 | 11.49%(+31.8)#665 |
| 20. | West Logan | 42.74% | 12.56%(+30.2)#20 | 11.49%(+31.2)#694 |
| 21. | Pleasant City | 42.24% | 12.56%(+29.7)#21 | 11.49%(+30.7)#720 |
| 22. | Cheviot | 41.76% | 12.56%(+29.2)#22 | 11.49%(+30.3)#752 |
| 23. | Cuyahoga Heights | 41.55% | 12.56%(+29.0)#23 | 11.49%(+30.1)#758 |
| 24. | Elizabethtown | 41.33% | 12.56%(+28.8)#24 | 11.49%(+29.8)#769 |
| 25. | Mount Gilead | 41.02% | 12.56%(+28.5)#25 | 11.49%(+29.5)#782 |
| 26. | Clarksburg | 40.82% | 12.56%(+28.3)#26 | 11.49%(+29.3)#797 |
| 27. | Bourneville | 39.60% | 12.56%(+27.0)#27 | 11.49%(+28.1)#863 |
| 28. | Owensville | 39.06% | 12.56%(+26.5)#28 | 11.49%(+27.6)#896 |
| 29. | Mcdermott | 38.81% | 12.56%(+26.2)#29 | 11.49%(+27.3)#909 |
| 30. | Darbyville | 38.60% | 12.56%(+26.0)#30 | 11.49%(+27.1)#923 |
| 31. | Mount Healthy Heights | 37.83% | 12.56%(+25.3)#31 | 11.49%(+26.3)#991 |
| 32. | Mifflin | 37.70% | 12.56%(+25.1)#32 | 11.49%(+26.2)#997 |
| 33. | Warrensville Heights | 36.74% | 12.56%(+24.2)#33 | 11.49%(+25.3)#1,076 |
| 34. | Twinsburg Heights | 36.70% | 12.56%(+24.1)#34 | 11.49%(+25.2)#1,080 |
| 35. | Quaker City | 36.70% | 12.56%(+24.1)#35 | 11.49%(+25.2)#1,081 |
| 36. | Sardinia | 36.39% | 12.56%(+23.8)#36 | 11.49%(+24.9)#1,104 |
| 37. | Washingtonville | 36.32% | 12.56%(+23.8)#37 | 11.49%(+24.8)#1,118 |
| 38. | West Rushville | 36.23% | 12.56%(+23.7)#38 | 11.49%(+24.7)#1,127 |
| 39. | Addyston | 36.07% | 12.56%(+23.5)#39 | 11.49%(+24.6)#1,131 |
| 40. | East Cleveland | 35.69% | 12.56%(+23.1)#40 | 11.49%(+24.2)#1,175 |
| 41. | Pulaski | 35.29% | 12.56%(+22.7)#41 | 11.49%(+23.8)#1,223 |
| 42. | Elmwood Place | 35.23% | 12.56%(+22.7)#42 | 11.49%(+23.7)#1,230 |
| 43. | Jeffersonville | 34.63% | 12.56%(+22.1)#43 | 11.49%(+23.1)#1,283 |
| 44. | Wilberforce | 34.59% | 12.56%(+22.0)#44 | 11.49%(+23.1)#1,287 |
| 45. | Melrose | 34.52% | 12.56%(+22.0)#45 | 11.49%(+23.0)#1,292 |
| 46. | Port William | 34.25% | 12.56%(+21.7)#46 | 11.49%(+22.8)#1,318 |
| 47. | Windham | 34.01% | 12.56%(+21.4)#47 | 11.49%(+22.5)#1,340 |
| 48. | Beallsville | 33.64% | 12.56%(+21.1)#48 | 11.49%(+22.2)#1,376 |
| 49. | Youngstown | 33.20% | 12.56%(+20.6)#49 | 11.49%(+21.7)#1,463 |
| 50. | Bradner | 32.67% | 12.56%(+20.1)#50 | 11.49%(+21.2)#1,514 |
| 51. | East Alliance | 32.50% | 12.56%(+19.9)#51 | 11.49%(+21.0)#1,545 |
| 52. | Higginsport | 32.00% | 12.56%(+19.4)#52 | 11.49%(+20.5)#1,620 |
| 53. | Alvordton | 31.71% | 12.56%(+19.1)#53 | 11.49%(+20.2)#1,659 |
| 54. | Malvern | 31.59% | 12.56%(+19.0)#54 | 11.49%(+20.1)#1,668 |
| 55. | New Burlington | 31.49% | 12.56%(+18.9)#55 | 11.49%(+20.0)#1,688 |
| 56. | Vickery | 31.03% | 12.56%(+18.5)#56 | 11.49%(+19.5)#1,766 |
| 57. | Chesterville | 30.95% | 12.56%(+18.4)#57 | 11.49%(+19.5)#1,779 |
| 58. | Seaman | 30.92% | 12.56%(+18.4)#58 | 11.49%(+19.4)#1,785 |
| 59. | Pemberville | 30.90% | 12.56%(+18.3)#59 | 11.49%(+19.4)#1,791 |
| 60. | Rio Grande | 30.72% | 12.56%(+18.2)#60 | 11.49%(+19.2)#1,821 |
| 61. | Lincoln Heights | 30.29% | 12.56%(+17.7)#61 | 11.49%(+18.8)#1,892 |
| 62. | Union City | 30.23% | 12.56%(+17.7)#62 | 11.49%(+18.7)#1,897 |
| 63. | Lockland | 30.19% | 12.56%(+17.6)#63 | 11.49%(+18.7)#1,904 |
| 64. | Euclid | 30.19% | 12.56%(+17.6)#64 | 11.49%(+18.7)#1,905 |
| 65. | Madison Place | 30.18% | 12.56%(+17.6)#65 | 11.49%(+18.7)#1,909 |
| 66. | New Springfield | 30.14% | 12.56%(+17.6)#66 | 11.49%(+18.6)#1,916 |
| 67. | Beaver | 30.10% | 12.56%(+17.5)#67 | 11.49%(+18.6)#1,922 |
| 68. | Sandusky | 29.87% | 12.56%(+17.3)#68 | 11.49%(+18.4)#1,973 |
| 69. | Lyons | 29.79% | 12.56%(+17.2)#69 | 11.49%(+18.3)#1,989 |
| 70. | Cleveland | 29.69% | 12.56%(+17.1)#70 | 11.49%(+18.2)#2,006 |
| 71. | Woodlawn | 29.52% | 12.56%(+17.0)#71 | 11.49%(+18.0)#2,037 |
| 72. | Drexel | 29.41% | 12.56%(+16.9)#72 | 11.49%(+17.9)#2,053 |
| 73. | Old Washington | 29.41% | 12.56%(+16.9)#73 | 11.49%(+17.9)#2,055 |
| 74. | College Corner | 29.21% | 12.56%(+16.7)#74 | 11.49%(+17.7)#2,092 |
| 75. | Dexter City | 29.17% | 12.56%(+16.6)#75 | 11.49%(+17.7)#2,103 |
| 76. | Garfield Heights | 29.16% | 12.56%(+16.6)#76 | 11.49%(+17.7)#2,105 |
| 77. | Bowerston | 29.11% | 12.56%(+16.6)#77 | 11.49%(+17.6)#2,113 |
| 78. | Utica | 29.05% | 12.56%(+16.5)#78 | 11.49%(+17.6)#2,123 |
| 79. | Canton | 29.04% | 12.56%(+16.5)#79 | 11.49%(+17.6)#2,125 |
| 80. | Moscow | 29.03% | 12.56%(+16.5)#80 | 11.49%(+17.5)#2,127 |
| 81. | Batesville | 28.57% | 12.56%(+16.0)#81 | 11.49%(+17.1)#2,224 |
| 82. | Maple Heights | 28.26% | 12.56%(+15.7)#82 | 11.49%(+16.8)#2,290 |
| 83. | Dayton | 28.24% | 12.56%(+15.7)#83 | 11.49%(+16.7)#2,297 |
| 84. | Mount Healthy | 28.10% | 12.56%(+15.5)#84 | 11.49%(+16.6)#2,329 |
| 85. | Hartford Croton | 28.00% | 12.56%(+15.4)#85 | 11.49%(+16.5)#2,348 |
| 86. | Lima | 27.82% | 12.56%(+15.3)#86 | 11.49%(+16.3)#2,393 |
| 87. | North College Hill | 27.64% | 12.56%(+15.1)#87 | 11.49%(+16.2)#2,430 |
| 88. | Andover | 27.45% | 12.56%(+14.9)#88 | 11.49%(+16.0)#2,476 |
| 89. | Petersburg | 27.43% | 12.56%(+14.9)#89 | 11.49%(+15.9)#2,484 |
| 90. | Bethesda | 27.24% | 12.56%(+14.7)#90 | 11.49%(+15.8)#2,553 |
| 91. | West Lafayette | 27.19% | 12.56%(+14.6)#91 | 11.49%(+15.7)#2,563 |
| 92. | Hopedale | 27.12% | 12.56%(+14.6)#92 | 11.49%(+15.6)#2,582 |
| 93. | Arlington Heights | 26.82% | 12.56%(+14.3)#93 | 11.49%(+15.3)#2,660 |
| 94. | Bedford Heights | 26.76% | 12.56%(+14.2)#94 | 11.49%(+15.3)#2,671 |
| 95. | Warren | 26.73% | 12.56%(+14.2)#95 | 11.49%(+15.2)#2,681 |
| 96. | Walbridge | 26.67% | 12.56%(+14.1)#96 | 11.49%(+15.2)#2,692 |
| 97. | Brownsville | 26.58% | 12.56%(+14.0)#97 | 11.49%(+15.1)#2,722 |
| 98. | Campbell | 26.33% | 12.56%(+13.8)#98 | 11.49%(+14.8)#2,779 |
| 99. | Lower Salem | 26.32% | 12.56%(+13.8)#99 | 11.49%(+14.8)#2,786 |
| 100. | Matamoras | 25.97% | 12.56%(+13.4)#100 | 11.49%(+14.5)#2,877 |
Common Questions
What are the Top 10 Cities with the Highest Percentage of Single Mothers in Ohio?
Top 10 Cities with the Highest Percentage of Single Mothers in Ohio are:
#1
75.86%
#2
70.37%
#3
67.44%
#4
65.45%
#5
64.89%
#6
64.15%
#7
60.61%
#8
57.14%
#9
55.42%
#10
50.33%
What city has the Highest Percentage of Single Mothers in Ohio?
Glencoe has the Highest Percentage of Single Mothers in Ohio with 75.86%.
What is the Percentage of Single Mothers in the State of Ohio?
Percentage of Single Mothers in Ohio is 12.56%.
What is the Percentage of Single Mothers in the United States?
Percentage of Single Mothers in the United States is 11.49%.