Cities with the Highest Percentage of Single Mothers in New Jersey
RELATED REPORTS & OPTIONS
Most Single Mothers
New Jersey
Compare Cities
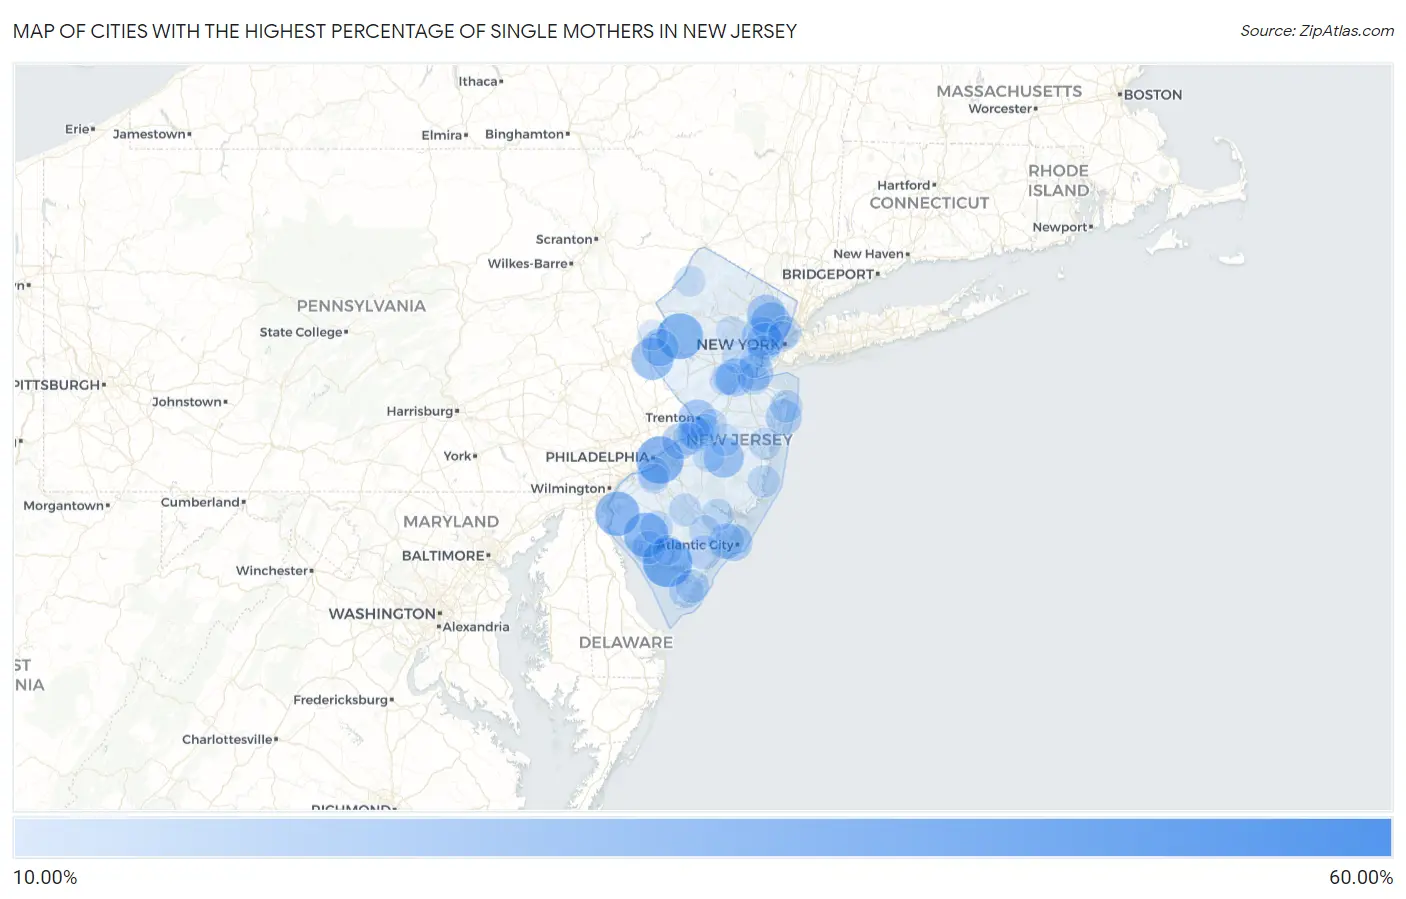
Map of Cities with the Highest Percentage of Single Mothers in New Jersey
0.00%
60.00%
Cities with the Highest Percentage of Single Mothers in New Jersey
| City | % Single Mothers | vs State | vs National | |
| 1. | Pluckemin | 56.32% | 10.10%(+46.2)#1 | 11.49%(+44.8)#289 |
| 2. | Mizpah | 46.15% | 10.10%(+36.0)#2 | 11.49%(+34.7)#544 |
| 3. | Penns Grove Borough | 44.94% | 10.10%(+34.8)#3 | 11.49%(+33.5)#588 |
| 4. | Port Norris | 41.48% | 10.10%(+31.4)#4 | 11.49%(+30.0)#763 |
| 5. | Camden | 38.57% | 10.10%(+28.5)#5 | 11.49%(+27.1)#927 |
| 6. | Anderson | 36.87% | 10.10%(+26.8)#6 | 11.49%(+25.4)#1,060 |
| 7. | Bridgeton | 34.91% | 10.10%(+24.8)#7 | 11.49%(+23.4)#1,264 |
| 8. | Salem | 34.77% | 10.10%(+24.7)#8 | 11.49%(+23.3)#1,275 |
| 9. | Finesville | 31.58% | 10.10%(+21.5)#9 | 11.49%(+20.1)#1,670 |
| 10. | Rutgers University-Busch Campus | 31.00% | 10.10%(+20.9)#10 | 11.49%(+19.5)#1,773 |
| 11. | Wrightstown Borough | 30.84% | 10.10%(+20.7)#11 | 11.49%(+19.4)#1,802 |
| 12. | Pine Hill Borough | 29.79% | 10.10%(+19.7)#12 | 11.49%(+18.3)#1,988 |
| 13. | Country Lake Estates | 29.22% | 10.10%(+19.1)#13 | 11.49%(+17.7)#2,090 |
| 14. | Passaic | 28.99% | 10.10%(+18.9)#14 | 11.49%(+17.5)#2,137 |
| 15. | Swedesboro Borough | 28.57% | 10.10%(+18.5)#15 | 11.49%(+17.1)#2,197 |
| 16. | East Orange | 27.15% | 10.10%(+17.0)#16 | 11.49%(+15.7)#2,576 |
| 17. | Trenton | 26.92% | 10.10%(+16.8)#17 | 11.49%(+15.4)#2,632 |
| 18. | Shiloh Borough | 26.67% | 10.10%(+16.6)#18 | 11.49%(+15.2)#2,694 |
| 19. | Woodlynne Borough | 26.66% | 10.10%(+16.6)#19 | 11.49%(+15.2)#2,706 |
| 20. | Paterson | 26.61% | 10.10%(+16.5)#20 | 11.49%(+15.1)#2,714 |
| 21. | New Brunswick | 26.60% | 10.10%(+16.5)#21 | 11.49%(+15.1)#2,715 |
| 22. | Stewartsville | 25.41% | 10.10%(+15.3)#22 | 11.49%(+13.9)#3,007 |
| 23. | Atlantic City | 25.24% | 10.10%(+15.1)#23 | 11.49%(+13.7)#3,059 |
| 24. | Perth Amboy | 24.80% | 10.10%(+14.7)#24 | 11.49%(+13.3)#3,212 |
| 25. | Newark | 24.79% | 10.10%(+14.7)#25 | 11.49%(+13.3)#3,216 |
| 26. | Cologne | 24.38% | 10.10%(+14.3)#26 | 11.49%(+12.9)#3,332 |
| 27. | Asbury Park | 23.80% | 10.10%(+13.7)#27 | 11.49%(+12.3)#3,524 |
| 28. | Beverly | 23.73% | 10.10%(+13.6)#28 | 11.49%(+12.2)#3,542 |
| 29. | West Wildwood Borough | 23.70% | 10.10%(+13.6)#29 | 11.49%(+12.2)#3,552 |
| 30. | Lawnside Borough | 23.69% | 10.10%(+13.6)#30 | 11.49%(+12.2)#3,557 |
| 31. | Pleasantville | 23.44% | 10.10%(+13.3)#31 | 11.49%(+12.0)#3,650 |
| 32. | Prospect Park Borough | 22.91% | 10.10%(+12.8)#32 | 11.49%(+11.4)#3,849 |
| 33. | Woodbine Borough | 22.81% | 10.10%(+12.7)#33 | 11.49%(+11.3)#3,889 |
| 34. | Keasbey | 21.73% | 10.10%(+11.6)#34 | 11.49%(+10.2)#4,365 |
| 35. | Paulsboro Borough | 21.69% | 10.10%(+11.6)#35 | 11.49%(+10.2)#4,376 |
| 36. | Roebling | 21.61% | 10.10%(+11.5)#36 | 11.49%(+10.1)#4,410 |
| 37. | Sussex Borough | 21.48% | 10.10%(+11.4)#37 | 11.49%(+9.99)#4,468 |
| 38. | Corbin City | 21.16% | 10.10%(+11.1)#38 | 11.49%(+9.68)#4,606 |
| 39. | East Newark Borough | 21.07% | 10.10%(+11.0)#39 | 11.49%(+9.58)#4,656 |
| 40. | Whitesboro | 20.97% | 10.10%(+10.9)#40 | 11.49%(+9.48)#4,713 |
| 41. | Hi Nella Borough | 20.68% | 10.10%(+10.6)#41 | 11.49%(+9.19)#4,856 |
| 42. | Cape May Court House | 20.58% | 10.10%(+10.5)#42 | 11.49%(+9.10)#4,891 |
| 43. | Frenchtown Borough | 20.48% | 10.10%(+10.4)#43 | 11.49%(+8.99)#4,947 |
| 44. | Ringoes | 20.30% | 10.10%(+10.2)#44 | 11.49%(+8.81)#5,057 |
| 45. | Woodbury | 20.27% | 10.10%(+10.2)#45 | 11.49%(+8.79)#5,070 |
| 46. | Cedarville | 20.15% | 10.10%(+10.0)#46 | 11.49%(+8.66)#5,146 |
| 47. | Florence | 20.07% | 10.10%(+9.97)#47 | 11.49%(+8.58)#5,181 |
| 48. | Merchantville Borough | 19.98% | 10.10%(+9.87)#48 | 11.49%(+8.49)#5,280 |
| 49. | Westville Borough | 19.96% | 10.10%(+9.86)#49 | 11.49%(+8.48)#5,287 |
| 50. | Rosenhayn | 19.89% | 10.10%(+9.78)#50 | 11.49%(+8.40)#5,317 |
| 51. | Guttenberg | 19.67% | 10.10%(+9.56)#51 | 11.49%(+8.18)#5,427 |
| 52. | Deal Borough | 19.44% | 10.10%(+9.34)#52 | 11.49%(+7.96)#5,571 |
| 53. | Collings Lakes | 19.42% | 10.10%(+9.32)#53 | 11.49%(+7.93)#5,586 |
| 54. | Long Branch | 19.40% | 10.10%(+9.30)#54 | 11.49%(+7.91)#5,601 |
| 55. | Oceanville | 19.24% | 10.10%(+9.14)#55 | 11.49%(+7.76)#5,686 |
| 56. | Waretown | 19.22% | 10.10%(+9.11)#56 | 11.49%(+7.73)#5,714 |
| 57. | Voorhees | 19.21% | 10.10%(+9.11)#57 | 11.49%(+7.73)#5,718 |
| 58. | New Vernon | 19.13% | 10.10%(+9.02)#58 | 11.49%(+7.64)#5,761 |
| 59. | Egg Harbor City | 19.10% | 10.10%(+9.00)#59 | 11.49%(+7.62)#5,779 |
| 60. | New Egypt | 18.86% | 10.10%(+8.75)#60 | 11.49%(+7.37)#5,934 |
| 61. | South Toms River Borough | 18.72% | 10.10%(+8.61)#61 | 11.49%(+7.23)#6,041 |
| 62. | Leisure Village | 18.67% | 10.10%(+8.56)#62 | 11.49%(+7.18)#6,068 |
| 63. | Burlington | 18.53% | 10.10%(+8.43)#63 | 11.49%(+7.04)#6,141 |
| 64. | South Amboy | 18.48% | 10.10%(+8.38)#64 | 11.49%(+7.00)#6,175 |
| 65. | Pemberton Heights | 18.48% | 10.10%(+8.37)#65 | 11.49%(+6.99)#6,181 |
| 66. | Groveville | 18.47% | 10.10%(+8.36)#66 | 11.49%(+6.98)#6,187 |
| 67. | Mays Landing | 18.43% | 10.10%(+8.33)#67 | 11.49%(+6.95)#6,211 |
| 68. | Lake Hiawatha | 18.43% | 10.10%(+8.32)#68 | 11.49%(+6.94)#6,215 |
| 69. | Freehold Borough | 18.29% | 10.10%(+8.18)#69 | 11.49%(+6.80)#6,311 |
| 70. | Plainfield | 18.19% | 10.10%(+8.08)#70 | 11.49%(+6.70)#6,359 |
| 71. | Dividing Creek | 17.98% | 10.10%(+7.87)#71 | 11.49%(+6.49)#6,521 |
| 72. | Newport | 17.95% | 10.10%(+7.84)#72 | 11.49%(+6.46)#6,534 |
| 73. | Elizabeth | 17.92% | 10.10%(+7.82)#73 | 11.49%(+6.43)#6,558 |
| 74. | Lodi Borough | 17.55% | 10.10%(+7.45)#74 | 11.49%(+6.06)#6,823 |
| 75. | Avenel | 17.48% | 10.10%(+7.38)#75 | 11.49%(+6.00)#6,875 |
| 76. | Helmetta Borough | 17.48% | 10.10%(+7.37)#76 | 11.49%(+5.99)#6,879 |
| 77. | Laurel Heights | 17.46% | 10.10%(+7.36)#77 | 11.49%(+5.97)#6,889 |
| 78. | Lindenwold Borough | 17.45% | 10.10%(+7.35)#78 | 11.49%(+5.96)#6,895 |
| 79. | Six Mile Run | 17.42% | 10.10%(+7.31)#79 | 11.49%(+5.93)#6,921 |
| 80. | Haledon Borough | 17.39% | 10.10%(+7.29)#80 | 11.49%(+5.91)#6,932 |
| 81. | Roselle Borough | 17.36% | 10.10%(+7.26)#81 | 11.49%(+5.88)#6,964 |
| 82. | Ampere North | 17.14% | 10.10%(+7.04)#82 | 11.49%(+5.66)#7,152 |
| 83. | Crandon Lakes | 17.14% | 10.10%(+7.04)#83 | 11.49%(+5.66)#7,155 |
| 84. | Lakehurst Borough | 17.09% | 10.10%(+6.98)#84 | 11.49%(+5.60)#7,202 |
| 85. | Elmwood Park Borough | 17.07% | 10.10%(+6.96)#85 | 11.49%(+5.58)#7,220 |
| 86. | Washington Borough | 16.77% | 10.10%(+6.66)#86 | 11.49%(+5.28)#7,440 |
| 87. | Neptune City Borough | 16.72% | 10.10%(+6.62)#87 | 11.49%(+5.23)#7,468 |
| 88. | Landing | 16.71% | 10.10%(+6.60)#88 | 11.49%(+5.22)#7,481 |
| 89. | Vauxhall | 16.70% | 10.10%(+6.59)#89 | 11.49%(+5.21)#7,490 |
| 90. | Brainards | 16.67% | 10.10%(+6.56)#90 | 11.49%(+5.18)#7,553 |
| 91. | Morristown | 16.66% | 10.10%(+6.55)#91 | 11.49%(+5.17)#7,583 |
| 92. | Brooklawn Borough | 16.63% | 10.10%(+6.53)#92 | 11.49%(+5.15)#7,594 |
| 93. | Somerdale Borough | 16.62% | 10.10%(+6.52)#93 | 11.49%(+5.13)#7,600 |
| 94. | Wharton Borough | 16.52% | 10.10%(+6.42)#94 | 11.49%(+5.03)#7,659 |
| 95. | Ocean Gate Borough | 16.42% | 10.10%(+6.31)#95 | 11.49%(+4.93)#7,731 |
| 96. | Union City | 16.30% | 10.10%(+6.20)#96 | 11.49%(+4.82)#7,819 |
| 97. | Oak Valley | 16.19% | 10.10%(+6.08)#97 | 11.49%(+4.70)#7,916 |
| 98. | Laurel Lake | 16.07% | 10.10%(+5.97)#98 | 11.49%(+4.58)#8,016 |
| 99. | Bordentown | 15.98% | 10.10%(+5.88)#99 | 11.49%(+4.50)#8,097 |
| 100. | Audubon Park Borough | 15.96% | 10.10%(+5.86)#100 | 11.49%(+4.48)#8,110 |
Common Questions
What are the Top 10 Cities with the Highest Percentage of Single Mothers in New Jersey?
Top 10 Cities with the Highest Percentage of Single Mothers in New Jersey are:
#1
41.48%
#2
38.57%
#3
36.87%
#4
34.91%
#5
34.77%
#6
31.58%
#7
29.22%
#8
28.99%
#9
27.15%
#10
26.92%
What city has the Highest Percentage of Single Mothers in New Jersey?
Port Norris has the Highest Percentage of Single Mothers in New Jersey with 41.48%.
What is the Percentage of Single Mothers in the State of New Jersey?
Percentage of Single Mothers in New Jersey is 10.10%.
What is the Percentage of Single Mothers in the United States?
Percentage of Single Mothers in the United States is 11.49%.