Cities with the Highest Percentage of Single Mothers in Colorado
RELATED REPORTS & OPTIONS
Most Single Mothers
Colorado
Compare Cities
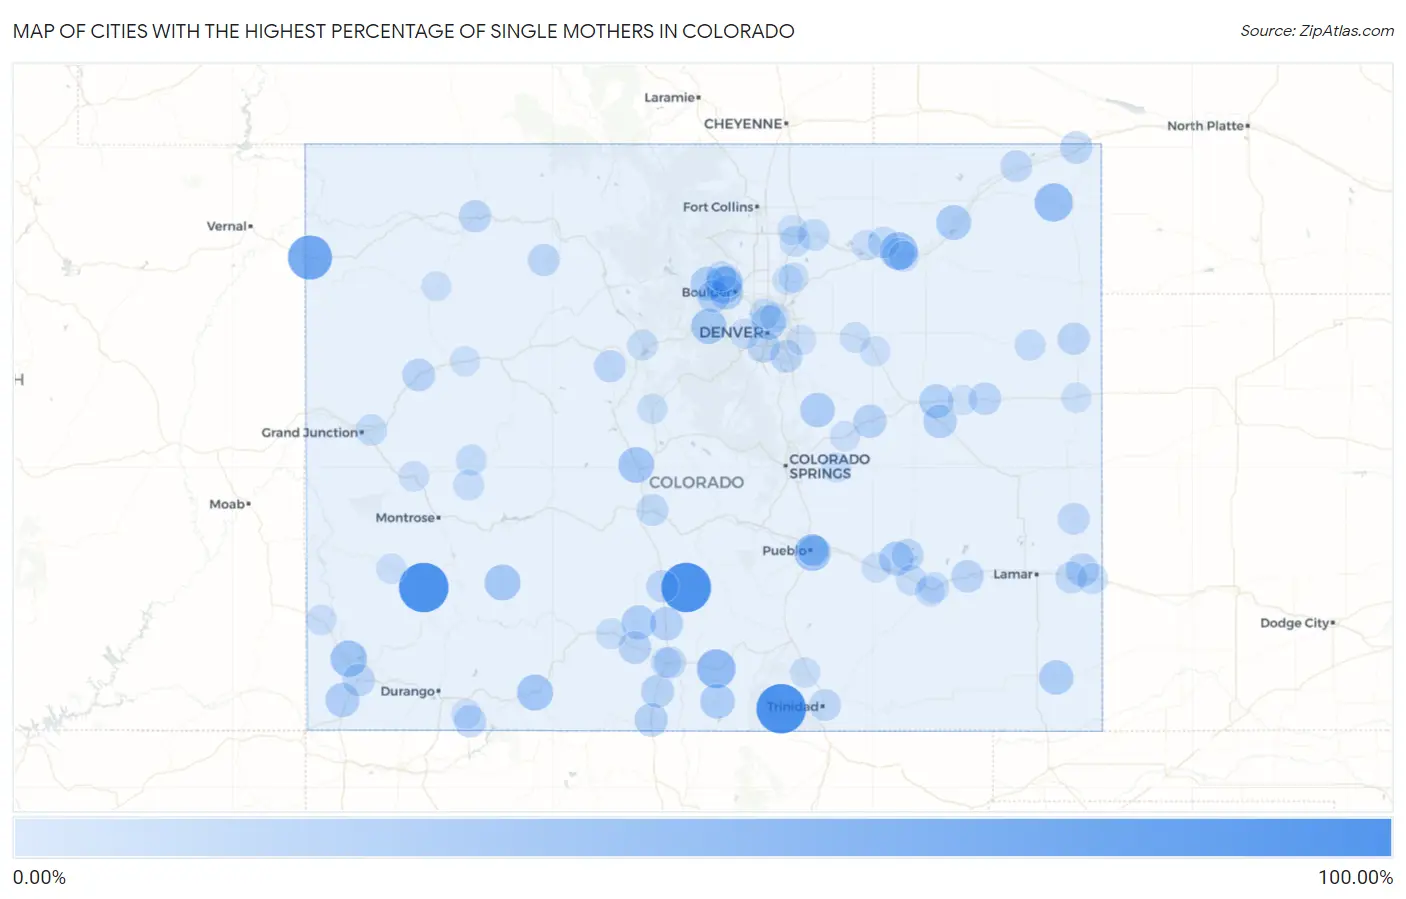
Map of Cities with the Highest Percentage of Single Mothers in Colorado
0.00%
100.00%
Cities with the Highest Percentage of Single Mothers in Colorado
| City | % Single Mothers | vs State | vs National | |
| 1. | Crestone | 100.00% | 8.95%(+91.1)#1 | 11.49%(+88.5)#64 |
| 2. | Weston | 100.00% | 8.95%(+91.1)#2 | 11.49%(+88.5)#68 |
| 3. | Sawpit | 100.00% | 8.95%(+91.1)#3 | 11.49%(+88.5)#76 |
| 4. | Dinosaur | 75.24% | 8.95%(+66.3)#4 | 11.49%(+63.8)#135 |
| 5. | Arapahoe | 55.56% | 8.95%(+46.6)#5 | 11.49%(+44.1)#303 |
| 6. | Fort Garland | 50.29% | 8.95%(+41.3)#6 | 11.49%(+38.8)#404 |
| 7. | Paoli | 47.83% | 8.95%(+38.9)#7 | 11.49%(+36.3)#505 |
| 8. | Morgan Heights | 46.34% | 8.95%(+37.4)#8 | 11.49%(+34.9)#538 |
| 9. | Sunshine | 41.94% | 8.95%(+33.0)#9 | 11.49%(+30.4)#743 |
| 10. | Salt Creek | 41.46% | 8.95%(+32.5)#10 | 11.49%(+30.0)#764 |
| 11. | Lewis | 40.00% | 8.95%(+31.1)#11 | 11.49%(+28.5)#845 |
| 12. | Pagosa Springs | 38.42% | 8.95%(+29.5)#12 | 11.49%(+26.9)#943 |
| 13. | Lake City | 37.89% | 8.95%(+28.9)#13 | 11.49%(+26.4)#980 |
| 14. | Buena Vista | 37.42% | 8.95%(+28.5)#14 | 11.49%(+25.9)#1,021 |
| 15. | Central City | 34.92% | 8.95%(+26.0)#15 | 11.49%(+23.4)#1,262 |
| 16. | Merino | 33.33% | 8.95%(+24.4)#16 | 11.49%(+21.8)#1,420 |
| 17. | San Luis | 32.54% | 8.95%(+23.6)#17 | 11.49%(+21.1)#1,531 |
| 18. | Elbert | 31.67% | 8.95%(+22.7)#18 | 11.49%(+20.2)#1,660 |
| 19. | Vilas | 31.43% | 8.95%(+22.5)#19 | 11.49%(+19.9)#1,702 |
| 20. | North Washington | 31.03% | 8.95%(+22.1)#20 | 11.49%(+19.5)#1,767 |
| 21. | Center | 30.63% | 8.95%(+21.7)#21 | 11.49%(+19.1)#1,840 |
| 22. | Crowley | 30.56% | 8.95%(+21.6)#22 | 11.49%(+19.1)#1,848 |
| 23. | Towaoc | 30.34% | 8.95%(+21.4)#23 | 11.49%(+18.9)#1,878 |
| 24. | Ward | 30.00% | 8.95%(+21.1)#24 | 11.49%(+18.5)#1,955 |
| 25. | Genoa | 29.63% | 8.95%(+20.7)#25 | 11.49%(+18.1)#2,021 |
| 26. | Tall Timber | 29.01% | 8.95%(+20.1)#26 | 11.49%(+17.5)#2,131 |
| 27. | Hooper | 27.27% | 8.95%(+18.3)#27 | 11.49%(+15.8)#2,536 |
| 28. | Hugo | 27.17% | 8.95%(+18.2)#28 | 11.49%(+15.7)#2,569 |
| 29. | Antonito | 26.92% | 8.95%(+18.0)#29 | 11.49%(+15.4)#2,635 |
| 30. | Simla | 26.71% | 8.95%(+17.8)#30 | 11.49%(+15.2)#2,684 |
| 31. | La Jara | 25.93% | 8.95%(+17.0)#31 | 11.49%(+14.4)#2,889 |
| 32. | Hartman | 25.00% | 8.95%(+16.1)#32 | 11.49%(+13.5)#3,172 |
| 33. | Monte Vista | 24.37% | 8.95%(+15.4)#33 | 11.49%(+12.9)#3,335 |
| 34. | St Ann Highlands | 24.16% | 8.95%(+15.2)#34 | 11.49%(+12.7)#3,410 |
| 35. | Parachute | 23.91% | 8.95%(+15.0)#35 | 11.49%(+12.4)#3,491 |
| 36. | Dove Valley | 23.51% | 8.95%(+14.6)#36 | 11.49%(+12.0)#3,622 |
| 37. | Sheridan | 23.30% | 8.95%(+14.4)#37 | 11.49%(+11.8)#3,698 |
| 38. | Las Animas | 23.14% | 8.95%(+14.2)#38 | 11.49%(+11.7)#3,758 |
| 39. | Cortez | 22.85% | 8.95%(+13.9)#39 | 11.49%(+11.4)#3,873 |
| 40. | Flagler | 22.70% | 8.95%(+13.7)#40 | 11.49%(+11.2)#3,940 |
| 41. | Southern Ute | 22.58% | 8.95%(+13.6)#41 | 11.49%(+11.1)#3,972 |
| 42. | Julesburg | 22.49% | 8.95%(+13.5)#42 | 11.49%(+11.0)#4,013 |
| 43. | Craig | 22.38% | 8.95%(+13.4)#43 | 11.49%(+10.9)#4,051 |
| 44. | Idalia | 22.22% | 8.95%(+13.3)#44 | 11.49%(+10.7)#4,142 |
| 45. | Moffat | 22.22% | 8.95%(+13.3)#45 | 11.49%(+10.7)#4,144 |
| 46. | Phippsburg | 21.97% | 8.95%(+13.0)#46 | 11.49%(+10.5)#4,244 |
| 47. | Ordway | 21.21% | 8.95%(+12.3)#47 | 11.49%(+9.72)#4,585 |
| 48. | Red Cliff | 21.21% | 8.95%(+12.3)#48 | 11.49%(+9.72)#4,589 |
| 49. | Alamosa East | 20.87% | 8.95%(+11.9)#49 | 11.49%(+9.38)#4,758 |
| 50. | Salida | 20.63% | 8.95%(+11.7)#50 | 11.49%(+9.15)#4,869 |
| 51. | Trinidad | 20.31% | 8.95%(+11.4)#51 | 11.49%(+8.82)#5,051 |
| 52. | Log Lane Village | 20.10% | 8.95%(+11.2)#52 | 11.49%(+8.61)#5,168 |
| 53. | Crook | 20.00% | 8.95%(+11.1)#53 | 11.49%(+8.51)#5,263 |
| 54. | Sheridan Lake | 20.00% | 8.95%(+11.1)#54 | 11.49%(+8.51)#5,269 |
| 55. | Granada | 19.75% | 8.95%(+10.8)#55 | 11.49%(+8.26)#5,392 |
| 56. | Kersey | 19.54% | 8.95%(+10.6)#56 | 11.49%(+8.06)#5,501 |
| 57. | Lazy Acres | 18.91% | 8.95%(+9.96)#57 | 11.49%(+7.42)#5,895 |
| 58. | Weldona | 18.42% | 8.95%(+9.47)#58 | 11.49%(+6.93)#6,222 |
| 59. | Pueblo | 18.31% | 8.95%(+9.36)#59 | 11.49%(+6.82)#6,297 |
| 60. | Four Square Mile | 18.08% | 8.95%(+9.13)#60 | 11.49%(+6.59)#6,451 |
| 61. | Blende | 18.02% | 8.95%(+9.07)#61 | 11.49%(+6.54)#6,489 |
| 62. | Clifton | 18.02% | 8.95%(+9.07)#62 | 11.49%(+6.54)#6,490 |
| 63. | Briggsdale | 17.95% | 8.95%(+9.00)#63 | 11.49%(+6.46)#6,542 |
| 64. | Federal Heights | 17.12% | 8.95%(+8.17)#64 | 11.49%(+5.63)#7,180 |
| 65. | Evans | 16.92% | 8.95%(+7.97)#65 | 11.49%(+5.43)#7,324 |
| 66. | Holly | 16.88% | 8.95%(+7.93)#66 | 11.49%(+5.40)#7,350 |
| 67. | Paonia | 16.67% | 8.95%(+7.72)#67 | 11.49%(+5.18)#7,501 |
| 68. | North La Junta | 16.67% | 8.95%(+7.72)#68 | 11.49%(+5.18)#7,521 |
| 69. | Joes | 16.67% | 8.95%(+7.72)#69 | 11.49%(+5.18)#7,563 |
| 70. | Park Center | 16.62% | 8.95%(+7.67)#70 | 11.49%(+5.13)#7,598 |
| 71. | Crawford | 16.30% | 8.95%(+7.35)#71 | 11.49%(+4.82)#7,817 |
| 72. | Rocky Ford | 16.13% | 8.95%(+7.18)#72 | 11.49%(+4.64)#7,966 |
| 73. | Del Norte | 15.80% | 8.95%(+6.85)#73 | 11.49%(+4.32)#8,243 |
| 74. | Silverthorne | 15.70% | 8.95%(+6.75)#74 | 11.49%(+4.22)#8,352 |
| 75. | Fort Morgan | 15.63% | 8.95%(+6.68)#75 | 11.49%(+4.14)#8,411 |
| 76. | Byers | 15.58% | 8.95%(+6.63)#76 | 11.49%(+4.10)#8,463 |
| 77. | Alamosa | 15.31% | 8.95%(+6.36)#77 | 11.49%(+3.82)#8,722 |
| 78. | Delta | 14.98% | 8.95%(+6.03)#78 | 11.49%(+3.49)#9,029 |
| 79. | Aguilar | 14.68% | 8.95%(+5.73)#79 | 11.49%(+3.19)#9,307 |
| 80. | Fort Lupton | 14.62% | 8.95%(+5.67)#80 | 11.49%(+3.13)#9,354 |
| 81. | West Pleasant View | 14.51% | 8.95%(+5.56)#81 | 11.49%(+3.03)#9,459 |
| 82. | Dove Creek | 14.41% | 8.95%(+5.46)#82 | 11.49%(+2.92)#9,541 |
| 83. | Jamestown | 14.29% | 8.95%(+5.34)#83 | 11.49%(+2.80)#9,664 |
| 84. | Orchard | 14.29% | 8.95%(+5.34)#84 | 11.49%(+2.80)#9,689 |
| 85. | Calhan | 14.15% | 8.95%(+5.20)#85 | 11.49%(+2.66)#9,805 |
| 86. | Norwood | 14.08% | 8.95%(+5.13)#86 | 11.49%(+2.60)#9,880 |
| 87. | La Junta | 13.95% | 8.95%(+5.00)#87 | 11.49%(+2.46)#10,001 |
| 88. | Fairplay | 13.83% | 8.95%(+4.88)#88 | 11.49%(+2.34)#10,115 |
| 89. | Ignacio | 13.74% | 8.95%(+4.79)#89 | 11.49%(+2.25)#10,214 |
| 90. | Aristocrat Ranchettes | 13.73% | 8.95%(+4.78)#90 | 11.49%(+2.24)#10,229 |
| 91. | Fowler | 13.64% | 8.95%(+4.69)#91 | 11.49%(+2.15)#10,315 |
| 92. | Deer Trail | 13.57% | 8.95%(+4.62)#92 | 11.49%(+2.08)#10,377 |
| 93. | Burlington | 13.43% | 8.95%(+4.48)#93 | 11.49%(+1.94)#10,516 |
| 94. | Greeley | 13.43% | 8.95%(+4.48)#94 | 11.49%(+1.94)#10,518 |
| 95. | Derby | 13.38% | 8.95%(+4.43)#95 | 11.49%(+1.89)#10,563 |
| 96. | Aurora | 13.37% | 8.95%(+4.42)#96 | 11.49%(+1.89)#10,569 |
| 97. | Ellicott | 13.31% | 8.95%(+4.36)#97 | 11.49%(+1.83)#10,643 |
| 98. | Silt | 13.27% | 8.95%(+4.32)#98 | 11.49%(+1.78)#10,677 |
| 99. | Arriba | 13.11% | 8.95%(+4.17)#99 | 11.49%(+1.63)#10,842 |
| 100. | Meeker | 13.02% | 8.95%(+4.07)#100 | 11.49%(+1.53)#10,962 |
Common Questions
What are the Top 10 Cities with the Highest Percentage of Single Mothers in Colorado?
Top 10 Cities with the Highest Percentage of Single Mothers in Colorado are:
#1
100.00%
#2
100.00%
#3
100.00%
#4
75.24%
#5
50.29%
#6
47.83%
#7
46.34%
#8
41.94%
#9
41.46%
#10
40.00%
What city has the Highest Percentage of Single Mothers in Colorado?
Crestone has the Highest Percentage of Single Mothers in Colorado with 100.00%.
What is the Percentage of Single Mothers in the State of Colorado?
Percentage of Single Mothers in Colorado is 8.95%.
What is the Percentage of Single Mothers in the United States?
Percentage of Single Mothers in the United States is 11.49%.