Cities with the Highest Percentage of Population with a Degree in Science and Engineering in Florida
RELATED REPORTS & OPTIONS
Science and Engineering
Florida
Compare Cities
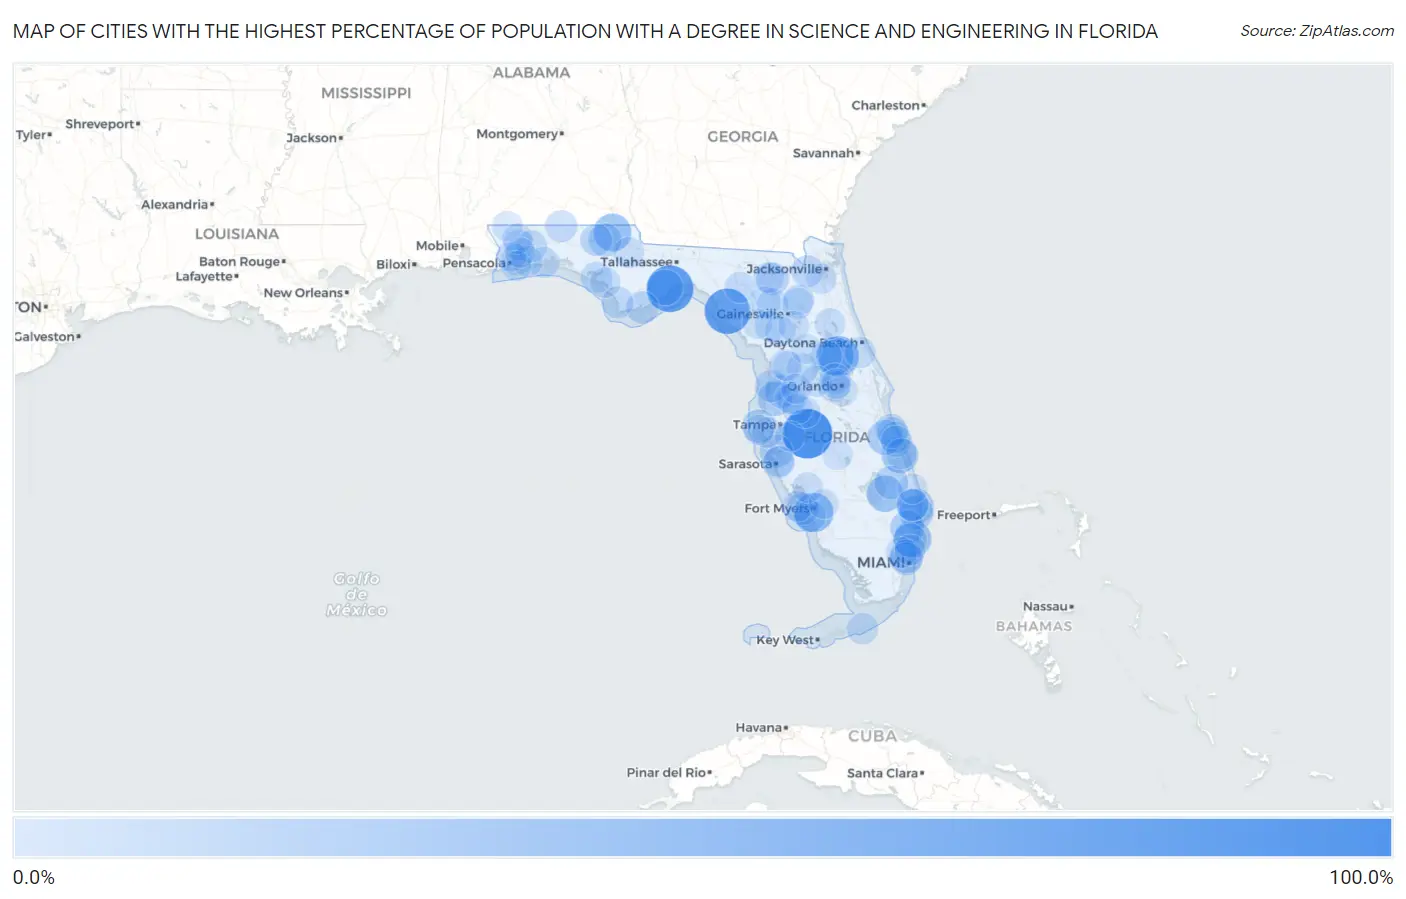
Map of Cities with the Highest Percentage of Population with a Degree in Science and Engineering in Florida
0.0%
100.0%
Cities with the Highest Percentage of Population with a Degree in Science and Engineering in Florida
| City | % Graduates | vs State | vs National | |
| 1. | Bradley Junction | 100.0% | 10.9%(+89.1)#1 | 9.8%(+90.2)#17 |
| 2. | Panacea | 88.3% | 10.9%(+77.5)#2 | 9.8%(+78.5)#223 |
| 3. | Steinhatchee | 83.1% | 10.9%(+72.2)#3 | 9.8%(+73.3)#235 |
| 4. | Lake Mack Forest Hills | 60.7% | 10.9%(+49.8)#4 | 9.8%(+50.9)#394 |
| 5. | Page Park | 56.0% | 10.9%(+45.1)#5 | 9.8%(+46.2)#460 |
| 6. | Lake Kathryn | 51.6% | 10.9%(+40.7)#6 | 9.8%(+41.8)#524 |
| 7. | Jacob City | 50.0% | 10.9%(+39.1)#7 | 9.8%(+40.2)#577 |
| 8. | Lazy Lake | 48.9% | 10.9%(+38.0)#8 | 9.8%(+39.1)#645 |
| 9. | Canal Point | 44.2% | 10.9%(+33.3)#9 | 9.8%(+34.4)#777 |
| 10. | Fort Pierce North | 43.8% | 10.9%(+32.9)#10 | 9.8%(+34.0)#785 |
| 11. | Sopchoppy | 42.1% | 10.9%(+31.3)#11 | 9.8%(+32.4)#864 |
| 12. | Cloud Lake | 38.5% | 10.9%(+27.6)#12 | 9.8%(+28.7)#1,050 |
| 13. | Fellsmere | 37.6% | 10.9%(+26.7)#13 | 9.8%(+27.8)#1,080 |
| 14. | Rainbow Lakes Estates | 35.7% | 10.9%(+24.8)#14 | 9.8%(+25.9)#1,186 |
| 15. | Quail Ridge | 35.6% | 10.9%(+24.7)#15 | 9.8%(+25.8)#1,200 |
| 16. | San Castle | 35.5% | 10.9%(+24.7)#16 | 9.8%(+25.7)#1,204 |
| 17. | Watergate | 35.1% | 10.9%(+24.2)#17 | 9.8%(+25.3)#1,235 |
| 18. | Indiantown | 32.5% | 10.9%(+21.7)#18 | 9.8%(+22.7)#1,443 |
| 19. | Harbor Bluffs | 31.8% | 10.9%(+20.9)#19 | 9.8%(+22.0)#1,495 |
| 20. | Washington Park | 31.6% | 10.9%(+20.8)#20 | 9.8%(+21.8)#1,505 |
| 21. | Garden Grove | 31.2% | 10.9%(+20.3)#21 | 9.8%(+21.4)#1,553 |
| 22. | Westview | 31.2% | 10.9%(+20.3)#22 | 9.8%(+21.4)#1,554 |
| 23. | Ellenton | 31.1% | 10.9%(+20.2)#23 | 9.8%(+21.3)#1,562 |
| 24. | Chipley | 31.0% | 10.9%(+20.1)#24 | 9.8%(+21.2)#1,575 |
| 25. | Gladeview | 29.9% | 10.9%(+19.0)#25 | 9.8%(+20.1)#1,696 |
| 26. | Watertown | 29.0% | 10.9%(+18.2)#26 | 9.8%(+19.3)#1,799 |
| 27. | Hurlburt Field | 28.8% | 10.9%(+17.9)#27 | 9.8%(+19.0)#1,835 |
| 28. | Eastpoint | 28.6% | 10.9%(+17.7)#28 | 9.8%(+18.8)#1,844 |
| 29. | Royal Palm Estates | 28.6% | 10.9%(+17.7)#29 | 9.8%(+18.8)#1,847 |
| 30. | Matlacha Isles Matlacha Shores | 28.3% | 10.9%(+17.4)#30 | 9.8%(+18.5)#1,933 |
| 31. | Weeki Wachee Gardens | 27.8% | 10.9%(+17.0)#31 | 9.8%(+18.1)#1,972 |
| 32. | Micco | 27.3% | 10.9%(+16.4)#32 | 9.8%(+17.5)#2,035 |
| 33. | Pinecraft | 26.9% | 10.9%(+16.1)#33 | 9.8%(+17.1)#2,106 |
| 34. | Baldwin | 26.3% | 10.9%(+15.4)#34 | 9.8%(+16.5)#2,176 |
| 35. | Bonifay | 26.1% | 10.9%(+15.2)#35 | 9.8%(+16.3)#2,218 |
| 36. | Gotha | 25.8% | 10.9%(+14.9)#36 | 9.8%(+16.0)#2,276 |
| 37. | Kensington Park | 25.5% | 10.9%(+14.7)#37 | 9.8%(+15.7)#2,314 |
| 38. | Paxton | 25.5% | 10.9%(+14.6)#38 | 9.8%(+15.7)#2,326 |
| 39. | Harlem Heights | 25.2% | 10.9%(+14.3)#39 | 9.8%(+15.4)#2,367 |
| 40. | Lake Belvedere Estates | 25.0% | 10.9%(+14.1)#40 | 9.8%(+15.2)#2,380 |
| 41. | Port St Joe | 24.8% | 10.9%(+13.9)#41 | 9.8%(+15.0)#2,520 |
| 42. | Harold | 24.7% | 10.9%(+13.8)#42 | 9.8%(+14.9)#2,533 |
| 43. | Spring Ridge | 24.6% | 10.9%(+13.7)#43 | 9.8%(+14.8)#2,542 |
| 44. | Wabasso | 24.4% | 10.9%(+13.6)#44 | 9.8%(+14.6)#2,572 |
| 45. | Pretty Bayou | 23.8% | 10.9%(+12.9)#45 | 9.8%(+14.0)#2,704 |
| 46. | Key Colony Beach | 23.6% | 10.9%(+12.7)#46 | 9.8%(+13.8)#2,732 |
| 47. | Cinco Bayou | 23.2% | 10.9%(+12.3)#47 | 9.8%(+13.4)#2,845 |
| 48. | Pittman | 23.1% | 10.9%(+12.2)#48 | 9.8%(+13.3)#2,890 |
| 49. | Groveland | 22.8% | 10.9%(+12.0)#49 | 9.8%(+13.1)#2,940 |
| 50. | Coleman | 22.7% | 10.9%(+11.9)#50 | 9.8%(+12.9)#2,961 |
| 51. | High Springs | 22.7% | 10.9%(+11.8)#51 | 9.8%(+12.9)#2,985 |
| 52. | Samsula Spruce Creek | 22.7% | 10.9%(+11.8)#52 | 9.8%(+12.9)#2,988 |
| 53. | Inverness Highlands North | 22.5% | 10.9%(+11.6)#53 | 9.8%(+12.7)#3,040 |
| 54. | Roseland | 22.4% | 10.9%(+11.6)#54 | 9.8%(+12.7)#3,046 |
| 55. | Gifford | 22.4% | 10.9%(+11.6)#55 | 9.8%(+12.7)#3,050 |
| 56. | Waldo | 22.2% | 10.9%(+11.4)#56 | 9.8%(+12.4)#3,084 |
| 57. | Kathleen | 22.1% | 10.9%(+11.3)#57 | 9.8%(+12.3)#3,145 |
| 58. | Mayo | 22.1% | 10.9%(+11.2)#58 | 9.8%(+12.3)#3,149 |
| 59. | Garcon Point | 22.1% | 10.9%(+11.2)#59 | 9.8%(+12.3)#3,158 |
| 60. | Palm Springs North | 22.1% | 10.9%(+11.2)#60 | 9.8%(+12.3)#3,159 |
| 61. | Point Baker | 22.1% | 10.9%(+11.2)#61 | 9.8%(+12.3)#3,162 |
| 62. | Bronson | 22.0% | 10.9%(+11.2)#62 | 9.8%(+12.2)#3,172 |
| 63. | Williston | 22.0% | 10.9%(+11.1)#63 | 9.8%(+12.2)#3,177 |
| 64. | Pembroke Park | 21.6% | 10.9%(+10.8)#64 | 9.8%(+11.9)#3,278 |
| 65. | Lealman | 21.6% | 10.9%(+10.7)#65 | 9.8%(+11.8)#3,307 |
| 66. | Pomona Park | 21.4% | 10.9%(+10.6)#66 | 9.8%(+11.6)#3,335 |
| 67. | Pineland | 21.4% | 10.9%(+10.5)#67 | 9.8%(+11.6)#3,376 |
| 68. | Altha | 21.3% | 10.9%(+10.4)#68 | 9.8%(+11.5)#3,408 |
| 69. | Lake City | 21.3% | 10.9%(+10.4)#69 | 9.8%(+11.5)#3,412 |
| 70. | South Apopka | 21.2% | 10.9%(+10.3)#70 | 9.8%(+11.4)#3,440 |
| 71. | Hampton | 21.1% | 10.9%(+10.2)#71 | 9.8%(+11.3)#3,470 |
| 72. | St Lucie Village | 21.0% | 10.9%(+10.1)#72 | 9.8%(+11.2)#3,491 |
| 73. | Tropical Park | 20.8% | 10.9%(+9.93)#73 | 9.8%(+11.0)#3,547 |
| 74. | Mcintosh | 20.7% | 10.9%(+9.82)#74 | 9.8%(+10.9)#3,582 |
| 75. | Callaway | 20.7% | 10.9%(+9.81)#75 | 9.8%(+10.9)#3,587 |
| 76. | Desoto Lakes | 20.6% | 10.9%(+9.77)#76 | 9.8%(+10.9)#3,602 |
| 77. | Holley | 20.6% | 10.9%(+9.68)#77 | 9.8%(+10.8)#3,634 |
| 78. | Whitfield Cdp Santa Rosa County | 20.5% | 10.9%(+9.64)#78 | 9.8%(+10.7)#3,646 |
| 79. | Old Miakka | 20.4% | 10.9%(+9.57)#79 | 9.8%(+10.7)#3,672 |
| 80. | St Leo | 20.0% | 10.9%(+9.13)#80 | 9.8%(+10.2)#3,777 |
| 81. | San Antonio | 19.6% | 10.9%(+8.78)#81 | 9.8%(+9.87)#3,981 |
| 82. | Ferry Pass | 19.6% | 10.9%(+8.76)#82 | 9.8%(+9.84)#3,989 |
| 83. | Cleveland | 19.6% | 10.9%(+8.70)#83 | 9.8%(+9.79)#4,002 |
| 84. | Crystal Springs | 19.5% | 10.9%(+8.64)#84 | 9.8%(+9.73)#4,028 |
| 85. | Bellair Meadowbrook Terrace | 19.4% | 10.9%(+8.54)#85 | 9.8%(+9.63)#4,067 |
| 86. | Indian Shores | 19.3% | 10.9%(+8.43)#86 | 9.8%(+9.52)#4,107 |
| 87. | Allentown | 19.2% | 10.9%(+8.38)#87 | 9.8%(+9.47)#4,125 |
| 88. | Balm | 19.1% | 10.9%(+8.24)#88 | 9.8%(+9.33)#4,176 |
| 89. | Oriole Beach | 19.1% | 10.9%(+8.23)#89 | 9.8%(+9.32)#4,182 |
| 90. | Pine Castle | 19.0% | 10.9%(+8.16)#90 | 9.8%(+9.24)#4,219 |
| 91. | Chiefland | 18.9% | 10.9%(+8.05)#91 | 9.8%(+9.14)#4,256 |
| 92. | Bagdad | 18.9% | 10.9%(+7.99)#92 | 9.8%(+9.08)#4,287 |
| 93. | Inverness | 18.8% | 10.9%(+7.95)#93 | 9.8%(+9.03)#4,307 |
| 94. | Olga | 18.8% | 10.9%(+7.93)#94 | 9.8%(+9.02)#4,317 |
| 95. | Limestone Creek | 18.7% | 10.9%(+7.85)#95 | 9.8%(+8.94)#4,370 |
| 96. | Sebring | 18.7% | 10.9%(+7.83)#96 | 9.8%(+8.92)#4,376 |
| 97. | Silver Springs Shores | 18.6% | 10.9%(+7.73)#97 | 9.8%(+8.81)#4,422 |
| 98. | Ridge Manor | 18.5% | 10.9%(+7.66)#98 | 9.8%(+8.74)#4,450 |
| 99. | Century | 18.5% | 10.9%(+7.65)#99 | 9.8%(+8.74)#4,455 |
| 100. | Pine Hills | 18.5% | 10.9%(+7.64)#100 | 9.8%(+8.73)#4,476 |
Common Questions
What are the Top 10 Cities with the Highest Percentage of Population with a Degree in Science and Engineering in Florida?
Top 10 Cities with the Highest Percentage of Population with a Degree in Science and Engineering in Florida are:
#1
100.0%
#2
88.3%
#3
83.1%
#4
60.7%
#5
56.0%
#6
51.6%
#7
50.0%
#8
48.9%
#9
44.2%
#10
43.8%
What city has the Highest Percentage of Population with a Degree in Science and Engineering in Florida?
Bradley Junction has the Highest Percentage of Population with a Degree in Science and Engineering in Florida with 100.0%.
What is the Percentage of Population with a Degree in Science and Engineering in the State of Florida?
Percentage of Population with a Degree in Science and Engineering in Florida is 10.9%.
What is the Percentage of Population with a Degree in Science and Engineering in the United States?
Percentage of Population with a Degree in Science and Engineering in the United States is 9.8%.