Cities with the Highest Percentage of Population with a Degree in Science and Engineering in Indiana
RELATED REPORTS & OPTIONS
Science and Engineering
Indiana
Compare Cities
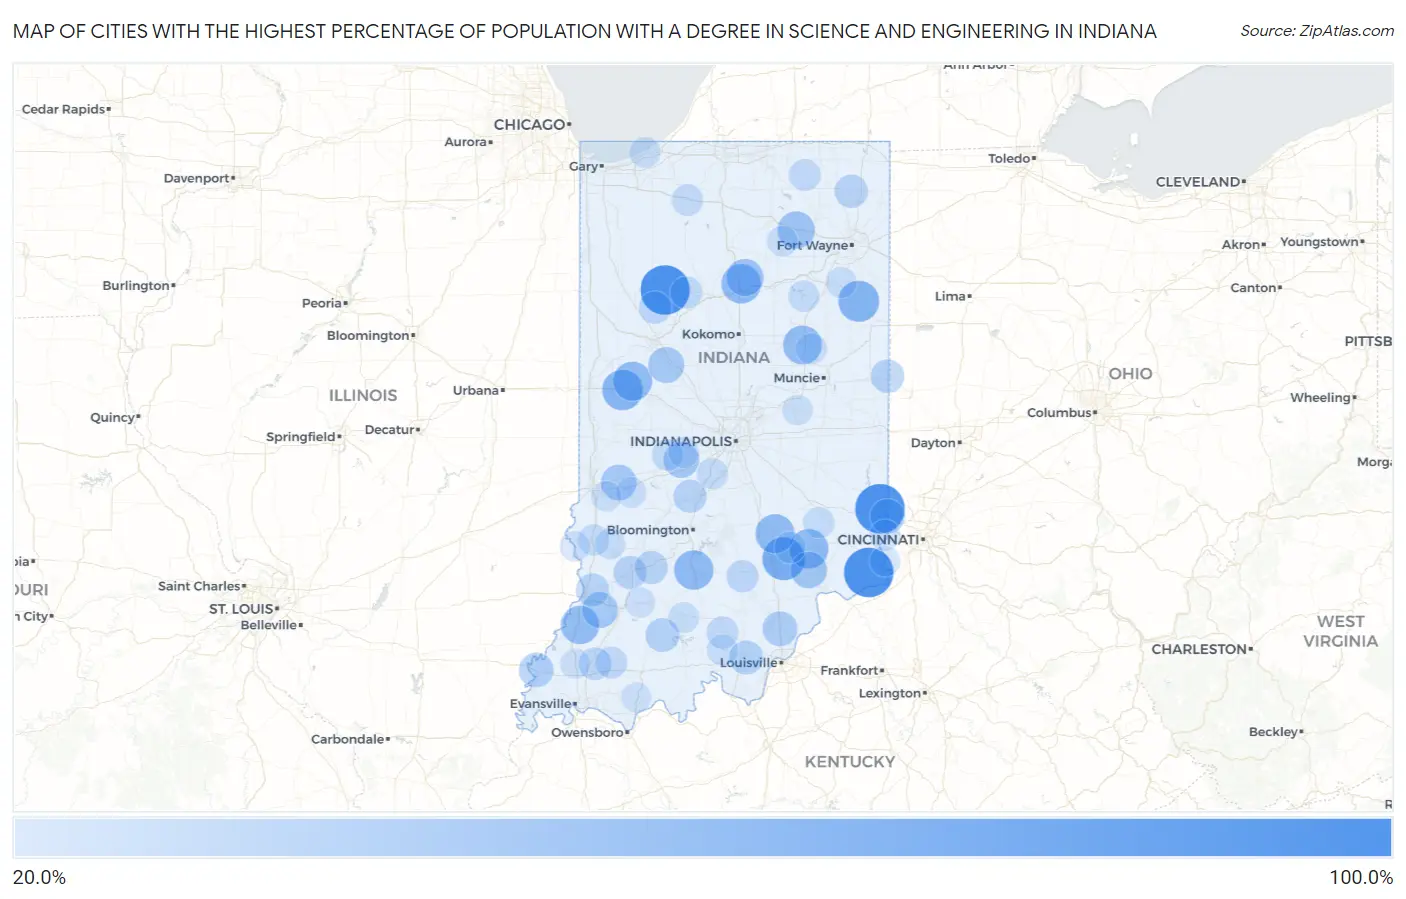
Map of Cities with the Highest Percentage of Population with a Degree in Science and Engineering in Indiana
0.0%
100.0%
Cities with the Highest Percentage of Population with a Degree in Science and Engineering in Indiana
| City | % Graduates | vs State | vs National | |
| 1. | Waverly | 100.0% | 12.7%(+87.3)#1 | 9.8%(+90.2)#14 |
| 2. | Bethel | 100.0% | 12.7%(+87.3)#2 | 9.8%(+90.2)#47 |
| 3. | Tocsin | 100.0% | 12.7%(+87.3)#3 | 9.8%(+90.2)#49 |
| 4. | Bowling Green | 100.0% | 12.7%(+87.3)#4 | 9.8%(+90.2)#50 |
| 5. | Norway | 100.0% | 12.7%(+87.3)#5 | 9.8%(+90.2)#63 |
| 6. | Shipshewana Lake | 100.0% | 12.7%(+87.3)#6 | 9.8%(+90.2)#65 |
| 7. | New Trenton | 100.0% | 12.7%(+87.3)#7 | 9.8%(+90.2)#66 |
| 8. | Abington | 100.0% | 12.7%(+87.3)#8 | 9.8%(+90.2)#67 |
| 9. | Groveland | 100.0% | 12.7%(+87.3)#9 | 9.8%(+90.2)#87 |
| 10. | Cory | 100.0% | 12.7%(+87.3)#10 | 9.8%(+90.2)#98 |
| 11. | Wildwood | 100.0% | 12.7%(+87.3)#11 | 9.8%(+90.2)#109 |
| 12. | East Enterprise | 100.0% | 12.7%(+87.3)#12 | 9.8%(+90.2)#116 |
| 13. | Willow Branch | 100.0% | 12.7%(+87.3)#13 | 9.8%(+90.2)#118 |
| 14. | Boxley | 100.0% | 12.7%(+87.3)#14 | 9.8%(+90.2)#135 |
| 15. | Bippus | 100.0% | 12.7%(+87.3)#15 | 9.8%(+90.2)#136 |
| 16. | Burrows | 100.0% | 12.7%(+87.3)#16 | 9.8%(+90.2)#137 |
| 17. | Hobbs | 100.0% | 12.7%(+87.3)#17 | 9.8%(+90.2)#141 |
| 18. | Tunnelton | 100.0% | 12.7%(+87.3)#18 | 9.8%(+90.2)#160 |
| 19. | Eckerty | 100.0% | 12.7%(+87.3)#19 | 9.8%(+90.2)#167 |
| 20. | London | 100.0% | 12.7%(+87.3)#20 | 9.8%(+90.2)#169 |
| 21. | Linnsburg | 100.0% | 12.7%(+87.3)#21 | 9.8%(+90.2)#193 |
| 22. | Paris Crossing | 100.0% | 12.7%(+87.3)#22 | 9.8%(+90.2)#199 |
| 23. | Lake Bruce | 85.7% | 12.7%(+73.0)#23 | 9.8%(+75.9)#227 |
| 24. | Grammer | 83.9% | 12.7%(+71.3)#24 | 9.8%(+74.1)#231 |
| 25. | Johnson | 81.8% | 12.7%(+69.1)#25 | 9.8%(+72.0)#237 |
| 26. | Newbern | 78.0% | 12.7%(+65.3)#26 | 9.8%(+68.2)#252 |
| 27. | Hayden | 74.0% | 12.7%(+61.4)#27 | 9.8%(+64.3)#285 |
| 28. | Arcola | 68.0% | 12.7%(+55.3)#28 | 9.8%(+58.2)#317 |
| 29. | Vera Cruz | 66.7% | 12.7%(+54.0)#29 | 9.8%(+56.9)#345 |
| 30. | Hillsboro | 65.2% | 12.7%(+52.5)#30 | 9.8%(+55.4)#355 |
| 31. | Mexico | 61.2% | 12.7%(+48.6)#31 | 9.8%(+51.4)#388 |
| 32. | Butlerville | 60.4% | 12.7%(+47.7)#32 | 9.8%(+50.6)#398 |
| 33. | Oolitic | 60.3% | 12.7%(+47.6)#33 | 9.8%(+50.5)#399 |
| 34. | Elizabethtown | 60.0% | 12.7%(+47.3)#34 | 9.8%(+50.2)#403 |
| 35. | Wingate | 60.0% | 12.7%(+47.3)#35 | 9.8%(+50.2)#404 |
| 36. | Fowlerton | 58.8% | 12.7%(+46.2)#36 | 9.8%(+49.0)#427 |
| 37. | Decker | 57.1% | 12.7%(+44.5)#37 | 9.8%(+47.4)#443 |
| 38. | Larwill | 52.9% | 12.7%(+40.2)#38 | 9.8%(+43.1)#509 |
| 39. | Denver | 52.8% | 12.7%(+40.1)#39 | 9.8%(+43.0)#510 |
| 40. | St. Anthony | 52.0% | 12.7%(+39.3)#40 | 9.8%(+42.2)#521 |
| 41. | Dupont | 50.0% | 12.7%(+37.3)#41 | 9.8%(+40.2)#569 |
| 42. | Brownsville | 50.0% | 12.7%(+37.3)#42 | 9.8%(+40.2)#584 |
| 43. | Lake Of The Woods | 48.6% | 12.7%(+36.0)#43 | 9.8%(+38.9)#649 |
| 44. | Spencerville | 48.6% | 12.7%(+35.9)#44 | 9.8%(+38.8)#652 |
| 45. | Stockwell | 48.0% | 12.7%(+35.3)#45 | 9.8%(+38.2)#675 |
| 46. | Monroe City | 47.5% | 12.7%(+34.8)#46 | 9.8%(+37.7)#687 |
| 47. | Staunton | 47.1% | 12.7%(+34.4)#47 | 9.8%(+37.3)#700 |
| 48. | Stilesville | 47.1% | 12.7%(+34.4)#48 | 9.8%(+37.3)#701 |
| 49. | Pleasant Mills | 45.2% | 12.7%(+32.6)#49 | 9.8%(+35.5)#740 |
| 50. | Chain-O-Lakes | 43.8% | 12.7%(+31.1)#50 | 9.8%(+34.0)#786 |
| 51. | Memphis | 43.4% | 12.7%(+30.8)#51 | 9.8%(+33.7)#808 |
| 52. | West Harrison | 42.9% | 12.7%(+30.2)#52 | 9.8%(+33.1)#828 |
| 53. | Griffin | 42.9% | 12.7%(+30.2)#53 | 9.8%(+33.1)#838 |
| 54. | Lake Cicott | 41.0% | 12.7%(+28.4)#54 | 9.8%(+31.2)#911 |
| 55. | Merriam | 40.7% | 12.7%(+28.1)#55 | 9.8%(+31.0)#919 |
| 56. | Crandall | 40.0% | 12.7%(+27.3)#56 | 9.8%(+30.2)#959 |
| 57. | Dubois | 39.7% | 12.7%(+27.1)#57 | 9.8%(+30.0)#984 |
| 58. | Union City | 38.6% | 12.7%(+25.9)#58 | 9.8%(+28.8)#1,037 |
| 59. | Corunna | 38.1% | 12.7%(+25.4)#59 | 9.8%(+28.3)#1,067 |
| 60. | Paragon | 37.5% | 12.7%(+24.8)#60 | 9.8%(+27.7)#1,088 |
| 61. | Elnora | 37.5% | 12.7%(+24.8)#61 | 9.8%(+27.7)#1,089 |
| 62. | Bruceville | 37.5% | 12.7%(+24.8)#62 | 9.8%(+27.7)#1,090 |
| 63. | Scotland | 37.5% | 12.7%(+24.8)#63 | 9.8%(+27.7)#1,110 |
| 64. | Mackey | 35.3% | 12.7%(+22.6)#64 | 9.8%(+25.5)#1,222 |
| 65. | Chalmers | 35.1% | 12.7%(+22.5)#65 | 9.8%(+25.4)#1,230 |
| 66. | Vallonia | 34.3% | 12.7%(+21.6)#66 | 9.8%(+24.5)#1,276 |
| 67. | Burnettsville | 33.3% | 12.7%(+20.7)#67 | 9.8%(+23.6)#1,330 |
| 68. | Hardinsburg | 33.3% | 12.7%(+20.7)#68 | 9.8%(+23.6)#1,358 |
| 69. | Spurgeon | 33.3% | 12.7%(+20.7)#69 | 9.8%(+23.6)#1,363 |
| 70. | Lakewood | 33.2% | 12.7%(+20.6)#70 | 9.8%(+23.4)#1,417 |
| 71. | Topeka | 32.6% | 12.7%(+19.9)#71 | 9.8%(+22.8)#1,440 |
| 72. | Celestine | 31.8% | 12.7%(+19.1)#72 | 9.8%(+22.0)#1,498 |
| 73. | Hamlet | 31.7% | 12.7%(+19.0)#73 | 9.8%(+21.9)#1,501 |
| 74. | Paxton | 31.6% | 12.7%(+18.9)#74 | 9.8%(+21.8)#1,509 |
| 75. | Ardmore | 31.5% | 12.7%(+18.8)#75 | 9.8%(+21.7)#1,527 |
| 76. | Fillmore | 31.0% | 12.7%(+18.4)#76 | 9.8%(+21.3)#1,569 |
| 77. | Mount Etna | 30.8% | 12.7%(+18.1)#77 | 9.8%(+21.0)#1,602 |
| 78. | Country Squire Lakes | 30.7% | 12.7%(+18.0)#78 | 9.8%(+20.9)#1,611 |
| 79. | Millhousen | 30.4% | 12.7%(+17.8)#79 | 9.8%(+20.7)#1,630 |
| 80. | Union Mills | 30.4% | 12.7%(+17.8)#80 | 9.8%(+20.7)#1,631 |
| 81. | Sullivan | 30.3% | 12.7%(+17.6)#81 | 9.8%(+20.5)#1,643 |
| 82. | Brooklyn | 29.7% | 12.7%(+17.0)#82 | 9.8%(+19.9)#1,715 |
| 83. | Greendale | 29.5% | 12.7%(+16.9)#83 | 9.8%(+19.8)#1,735 |
| 84. | Matthews | 29.3% | 12.7%(+16.6)#84 | 9.8%(+19.5)#1,767 |
| 85. | Amo | 29.3% | 12.7%(+16.6)#85 | 9.8%(+19.5)#1,768 |
| 86. | Town Of Pines | 29.2% | 12.7%(+16.5)#86 | 9.8%(+19.4)#1,775 |
| 87. | Milltown | 29.2% | 12.7%(+16.5)#87 | 9.8%(+19.4)#1,781 |
| 88. | Uniondale | 29.2% | 12.7%(+16.5)#88 | 9.8%(+19.4)#1,789 |
| 89. | Dugger | 29.0% | 12.7%(+16.4)#89 | 9.8%(+19.3)#1,806 |
| 90. | West Baden Springs | 28.6% | 12.7%(+15.9)#90 | 9.8%(+18.8)#1,859 |
| 91. | Sidney | 28.6% | 12.7%(+15.9)#91 | 9.8%(+18.8)#1,892 |
| 92. | Rising Sun | 28.3% | 12.7%(+15.7)#92 | 9.8%(+18.6)#1,921 |
| 93. | Center Point | 27.9% | 12.7%(+15.2)#93 | 9.8%(+18.1)#1,968 |
| 94. | Markleville | 27.3% | 12.7%(+14.6)#94 | 9.8%(+17.5)#2,042 |
| 95. | Riley | 27.3% | 12.7%(+14.6)#95 | 9.8%(+17.5)#2,045 |
| 96. | Merom | 27.3% | 12.7%(+14.6)#96 | 9.8%(+17.5)#2,062 |
| 97. | Antioch | 27.1% | 12.7%(+14.5)#97 | 9.8%(+17.3)#2,077 |
| 98. | Chrisney | 26.7% | 12.7%(+14.0)#98 | 9.8%(+16.9)#2,132 |
| 99. | Cannelburg | 26.7% | 12.7%(+14.0)#99 | 9.8%(+16.9)#2,140 |
| 100. | Fort Branch | 26.6% | 12.7%(+14.0)#100 | 9.8%(+16.9)#2,147 |
Common Questions
What are the Top 10 Cities with the Highest Percentage of Population with a Degree in Science and Engineering in Indiana?
Top 10 Cities with the Highest Percentage of Population with a Degree in Science and Engineering in Indiana are:
#1
100.0%
#2
100.0%
#3
100.0%
#4
74.0%
#5
66.7%
#6
65.2%
#7
61.2%
#8
60.4%
#9
60.3%
#10
60.0%
What city has the Highest Percentage of Population with a Degree in Science and Engineering in Indiana?
Norway has the Highest Percentage of Population with a Degree in Science and Engineering in Indiana with 100.0%.
What is the Percentage of Population with a Degree in Science and Engineering in the State of Indiana?
Percentage of Population with a Degree in Science and Engineering in Indiana is 12.7%.
What is the Percentage of Population with a Degree in Science and Engineering in the United States?
Percentage of Population with a Degree in Science and Engineering in the United States is 9.8%.