Cities with the Highest Percentage of Population with a Degree in Science and Engineering in Idaho
RELATED REPORTS & OPTIONS
Science and Engineering
Idaho
Compare Cities
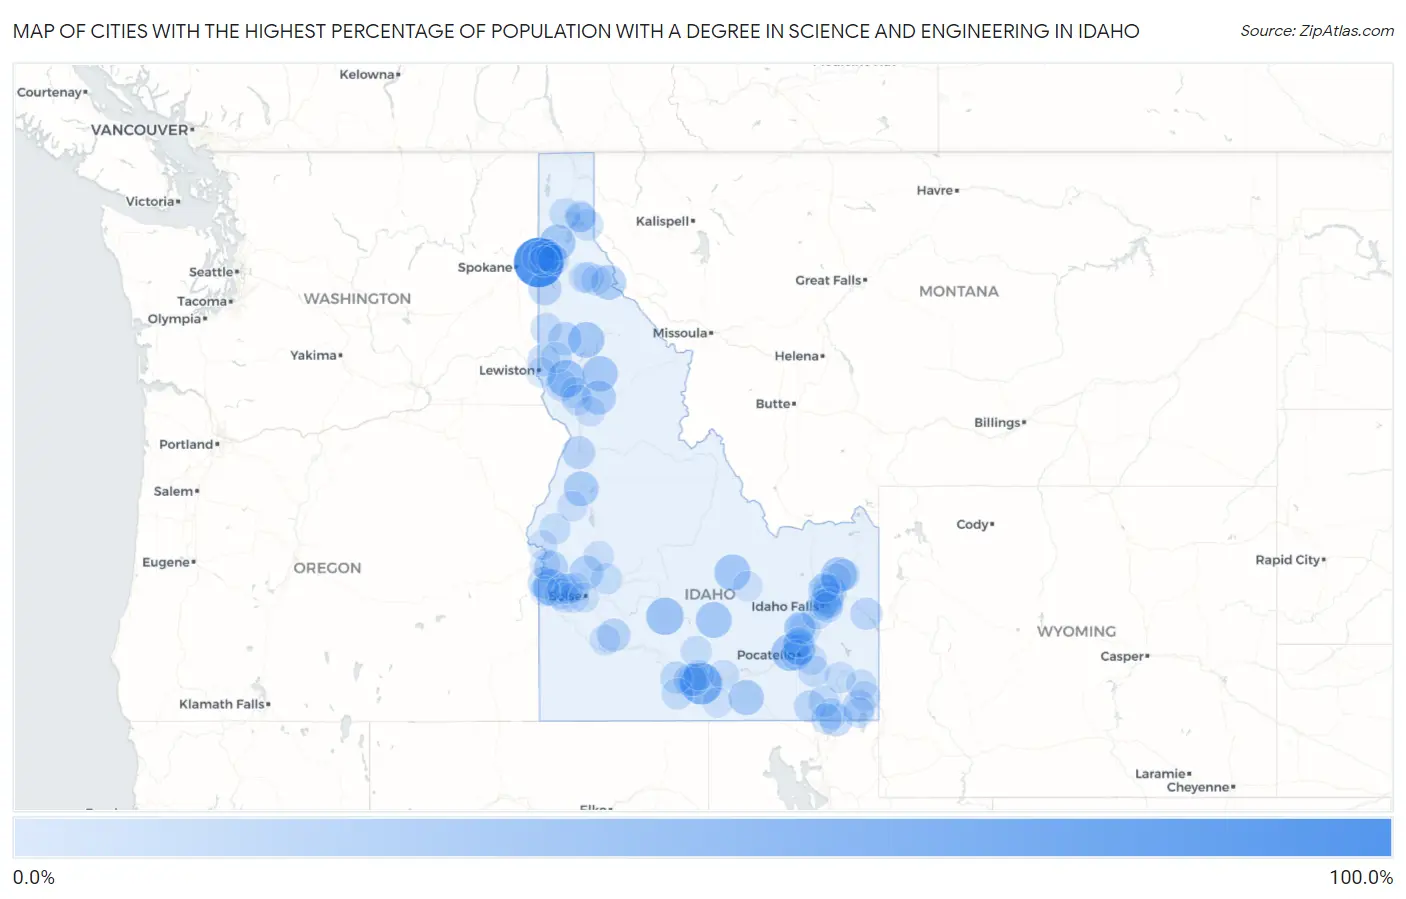
Map of Cities with the Highest Percentage of Population with a Degree in Science and Engineering in Idaho
0.0%
100.0%
Cities with the Highest Percentage of Population with a Degree in Science and Engineering in Idaho
| City | % Graduates | vs State | vs National | |
| 1. | State Line | 100.0% | 11.8%(+88.2)#1 | 9.8%(+90.2)#206 |
| 2. | Murtaugh | 61.9% | 11.8%(+50.1)#2 | 9.8%(+52.1)#382 |
| 3. | Letha | 50.0% | 11.8%(+38.2)#3 | 9.8%(+40.2)#549 |
| 4. | Reubens | 42.9% | 11.8%(+31.0)#4 | 9.8%(+33.1)#841 |
| 5. | Fairfield | 42.4% | 11.8%(+30.6)#5 | 9.8%(+32.6)#857 |
| 6. | Arbon Valley | 40.0% | 11.8%(+28.2)#6 | 9.8%(+30.2)#944 |
| 7. | Notus | 39.1% | 11.8%(+27.3)#7 | 9.8%(+29.3)#999 |
| 8. | Mackay | 36.6% | 11.8%(+24.8)#8 | 9.8%(+26.9)#1,136 |
| 9. | Elk River | 36.4% | 11.8%(+24.5)#9 | 9.8%(+26.6)#1,152 |
| 10. | Carey | 36.1% | 11.8%(+24.3)#10 | 9.8%(+26.3)#1,163 |
| 11. | Athol | 35.3% | 11.8%(+23.5)#11 | 9.8%(+25.5)#1,212 |
| 12. | Sugar City | 34.6% | 11.8%(+22.8)#12 | 9.8%(+24.8)#1,265 |
| 13. | Weippe | 34.2% | 11.8%(+22.4)#13 | 9.8%(+24.4)#1,279 |
| 14. | Malta | 32.4% | 11.8%(+20.5)#14 | 9.8%(+22.6)#1,456 |
| 15. | New Meadows | 31.2% | 11.8%(+19.4)#15 | 9.8%(+21.5)#1,547 |
| 16. | Mullan | 30.1% | 11.8%(+18.3)#16 | 9.8%(+20.4)#1,654 |
| 17. | Tyhee | 29.8% | 11.8%(+18.0)#17 | 9.8%(+20.1)#1,699 |
| 18. | Stites | 28.6% | 11.8%(+16.8)#18 | 9.8%(+18.8)#1,885 |
| 19. | Horseshoe Bend | 26.7% | 11.8%(+14.9)#19 | 9.8%(+16.9)#2,126 |
| 20. | New Plymouth | 24.8% | 11.8%(+13.0)#20 | 9.8%(+15.1)#2,508 |
| 21. | Deary | 24.3% | 11.8%(+12.5)#21 | 9.8%(+14.5)#2,587 |
| 22. | Rigby | 23.9% | 11.8%(+12.1)#22 | 9.8%(+14.1)#2,671 |
| 23. | Mountain Home | 23.1% | 11.8%(+11.3)#23 | 9.8%(+13.3)#2,866 |
| 24. | Worley | 23.1% | 11.8%(+11.3)#24 | 9.8%(+13.3)#2,886 |
| 25. | Hauser | 22.5% | 11.8%(+10.7)#25 | 9.8%(+12.7)#3,030 |
| 26. | Riggins | 22.5% | 11.8%(+10.7)#26 | 9.8%(+12.7)#3,036 |
| 27. | Franklin | 21.7% | 11.8%(+9.85)#27 | 9.8%(+11.9)#3,272 |
| 28. | Rathdrum | 21.5% | 11.8%(+9.72)#28 | 9.8%(+11.8)#3,312 |
| 29. | Kimberly | 21.3% | 11.8%(+9.48)#29 | 9.8%(+11.5)#3,402 |
| 30. | Hansen | 20.6% | 11.8%(+8.80)#30 | 9.8%(+10.8)#3,607 |
| 31. | Bloomington | 20.0% | 11.8%(+8.18)#31 | 9.8%(+10.2)#3,854 |
| 32. | Ucon | 19.3% | 11.8%(+7.48)#32 | 9.8%(+9.52)#4,110 |
| 33. | Irwin | 19.2% | 11.8%(+7.41)#33 | 9.8%(+9.45)#4,144 |
| 34. | Malad City | 19.1% | 11.8%(+7.32)#34 | 9.8%(+9.36)#4,169 |
| 35. | Parma | 19.1% | 11.8%(+7.26)#35 | 9.8%(+9.29)#4,186 |
| 36. | Genesee | 18.9% | 11.8%(+7.07)#36 | 9.8%(+9.11)#4,274 |
| 37. | Filer | 18.5% | 11.8%(+6.70)#37 | 9.8%(+8.74)#4,453 |
| 38. | Teton | 18.5% | 11.8%(+6.66)#38 | 9.8%(+8.70)#4,484 |
| 39. | Winchester | 17.6% | 11.8%(+5.83)#39 | 9.8%(+7.87)#4,882 |
| 40. | Lewisville | 17.1% | 11.8%(+5.32)#40 | 9.8%(+7.36)#5,136 |
| 41. | Chubbuck | 17.0% | 11.8%(+5.16)#41 | 9.8%(+7.19)#5,235 |
| 42. | Hollister | 16.7% | 11.8%(+4.85)#42 | 9.8%(+6.89)#5,411 |
| 43. | Oxford | 16.7% | 11.8%(+4.85)#43 | 9.8%(+6.89)#5,497 |
| 44. | Caldwell | 16.3% | 11.8%(+4.52)#44 | 9.8%(+6.56)#5,644 |
| 45. | Potlatch | 16.3% | 11.8%(+4.48)#45 | 9.8%(+6.52)#5,668 |
| 46. | Clark Fork | 16.1% | 11.8%(+4.31)#46 | 9.8%(+6.35)#5,764 |
| 47. | Blackfoot | 16.1% | 11.8%(+4.27)#47 | 9.8%(+6.31)#5,798 |
| 48. | Riverside | 15.9% | 11.8%(+4.07)#48 | 9.8%(+6.11)#5,921 |
| 49. | Mccammon | 15.9% | 11.8%(+4.04)#49 | 9.8%(+6.08)#5,948 |
| 50. | Moreland | 15.7% | 11.8%(+3.88)#50 | 9.8%(+5.92)#6,062 |
| 51. | Shelley | 15.6% | 11.8%(+3.74)#51 | 9.8%(+5.78)#6,160 |
| 52. | Idaho City | 15.4% | 11.8%(+3.56)#52 | 9.8%(+5.60)#6,280 |
| 53. | Midvale | 15.4% | 11.8%(+3.56)#53 | 9.8%(+5.60)#6,299 |
| 54. | Kellogg | 15.2% | 11.8%(+3.36)#54 | 9.8%(+5.40)#6,462 |
| 55. | Lincoln | 15.2% | 11.8%(+3.34)#55 | 9.8%(+5.37)#6,472 |
| 56. | Sandpoint | 15.0% | 11.8%(+3.22)#56 | 9.8%(+5.26)#6,563 |
| 57. | Hope | 15.0% | 11.8%(+3.18)#57 | 9.8%(+5.22)#6,615 |
| 58. | Grace | 14.9% | 11.8%(+3.03)#58 | 9.8%(+5.07)#6,728 |
| 59. | Dietrich | 14.7% | 11.8%(+2.89)#59 | 9.8%(+4.92)#6,834 |
| 60. | Juliaetta | 14.5% | 11.8%(+2.73)#60 | 9.8%(+4.76)#6,946 |
| 61. | Preston | 14.5% | 11.8%(+2.71)#61 | 9.8%(+4.75)#6,958 |
| 62. | Pocatello | 14.4% | 11.8%(+2.56)#62 | 9.8%(+4.60)#7,085 |
| 63. | Ferdinand | 14.3% | 11.8%(+2.47)#63 | 9.8%(+4.50)#7,219 |
| 64. | Idaho Falls | 14.1% | 11.8%(+2.32)#64 | 9.8%(+4.36)#7,333 |
| 65. | Cottonwood | 14.1% | 11.8%(+2.31)#65 | 9.8%(+4.35)#7,342 |
| 66. | Mountain Home Afb | 13.6% | 11.8%(+1.81)#66 | 9.8%(+3.84)#7,791 |
| 67. | Inkom | 13.6% | 11.8%(+1.75)#67 | 9.8%(+3.79)#7,833 |
| 68. | Hayden | 13.6% | 11.8%(+1.74)#68 | 9.8%(+3.78)#7,843 |
| 69. | Georgetown | 13.5% | 11.8%(+1.69)#69 | 9.8%(+3.73)#7,895 |
| 70. | Weston | 13.2% | 11.8%(+1.39)#70 | 9.8%(+3.43)#8,223 |
| 71. | Osburn | 13.2% | 11.8%(+1.37)#71 | 9.8%(+3.41)#8,237 |
| 72. | Iona | 13.0% | 11.8%(+1.19)#72 | 9.8%(+3.23)#8,452 |
| 73. | Eden | 12.9% | 11.8%(+1.08)#73 | 9.8%(+3.12)#8,583 |
| 74. | Montpelier | 12.9% | 11.8%(+1.07)#74 | 9.8%(+3.11)#8,599 |
| 75. | Paul | 12.8% | 11.8%(+0.946)#75 | 9.8%(+2.98)#8,723 |
| 76. | Middleton | 12.6% | 11.8%(+0.815)#76 | 9.8%(+2.85)#8,851 |
| 77. | Dalton Gardens | 12.5% | 11.8%(+0.712)#77 | 9.8%(+2.75)#8,952 |
| 78. | Crouch | 12.5% | 11.8%(+0.680)#78 | 9.8%(+2.72)#9,044 |
| 79. | St Charles | 12.5% | 11.8%(+0.680)#79 | 9.8%(+2.72)#9,059 |
| 80. | Rexburg | 12.4% | 11.8%(+0.602)#80 | 9.8%(+2.64)#9,144 |
| 81. | Avimor | 12.3% | 11.8%(+0.522)#81 | 9.8%(+2.56)#9,223 |
| 82. | Council | 12.2% | 11.8%(+0.375)#82 | 9.8%(+2.41)#9,403 |
| 83. | Pinehurst | 12.0% | 11.8%(+0.202)#83 | 9.8%(+2.24)#9,622 |
| 84. | Meridian | 12.0% | 11.8%(+0.138)#84 | 9.8%(+2.18)#9,708 |
| 85. | Grangeville | 11.9% | 11.8%(+0.068)#85 | 9.8%(+2.11)#9,813 |
| 86. | Fort Hall | 11.8% | 11.8%(+0.001)#86 | 9.8%(+2.04)#9,898 |
| 87. | Post Falls | 11.8% | 11.8%(-0.014)#87 | 9.8%(+2.02)#9,917 |
| 88. | Ammon | 11.8% | 11.8%(-0.037)#88 | 9.8%(+2.00)#9,936 |
| 89. | Eagle | 11.5% | 11.8%(-0.330)#89 | 9.8%(+1.71)#10,341 |
| 90. | East Hope | 11.3% | 11.8%(-0.516)#90 | 9.8%(+1.52)#10,622 |
| 91. | Fruitland | 11.3% | 11.8%(-0.530)#91 | 9.8%(+1.51)#10,635 |
| 92. | Moore | 11.1% | 11.8%(-0.709)#92 | 9.8%(+1.33)#10,955 |
| 93. | Nampa | 11.0% | 11.8%(-0.782)#93 | 9.8%(+1.26)#11,054 |
| 94. | Boise City | 10.7% | 11.8%(-1.14)#94 | 9.8%(+0.896)#11,585 |
| 95. | Star | 10.7% | 11.8%(-1.14)#95 | 9.8%(+0.895)#11,587 |
| 96. | Wilder | 10.7% | 11.8%(-1.15)#96 | 9.8%(+0.885)#11,601 |
| 97. | Lewiston | 10.6% | 11.8%(-1.18)#97 | 9.8%(+0.860)#11,642 |
| 98. | Weiser | 10.5% | 11.8%(-1.32)#98 | 9.8%(+0.714)#11,876 |
| 99. | Oakley | 10.5% | 11.8%(-1.36)#99 | 9.8%(+0.684)#11,915 |
| 100. | Menan | 10.4% | 11.8%(-1.45)#100 | 9.8%(+0.589)#12,078 |
Common Questions
What are the Top 10 Cities with the Highest Percentage of Population with a Degree in Science and Engineering in Idaho?
Top 10 Cities with the Highest Percentage of Population with a Degree in Science and Engineering in Idaho are:
#1
100.0%
#2
61.9%
#3
42.9%
#4
42.4%
#5
40.0%
#6
39.1%
#7
36.6%
#8
36.4%
#9
36.1%
#10
35.3%
What city has the Highest Percentage of Population with a Degree in Science and Engineering in Idaho?
State Line has the Highest Percentage of Population with a Degree in Science and Engineering in Idaho with 100.0%.
What is the Percentage of Population with a Degree in Science and Engineering in the State of Idaho?
Percentage of Population with a Degree in Science and Engineering in Idaho is 11.8%.
What is the Percentage of Population with a Degree in Science and Engineering in the United States?
Percentage of Population with a Degree in Science and Engineering in the United States is 9.8%.