Zip Codes with the Highest Percentage of Population with a Degree in Science and Engineering in Glenview, IL
RELATED REPORTS & OPTIONS
Science and Engineering
Glenview
Compare Zip Codes
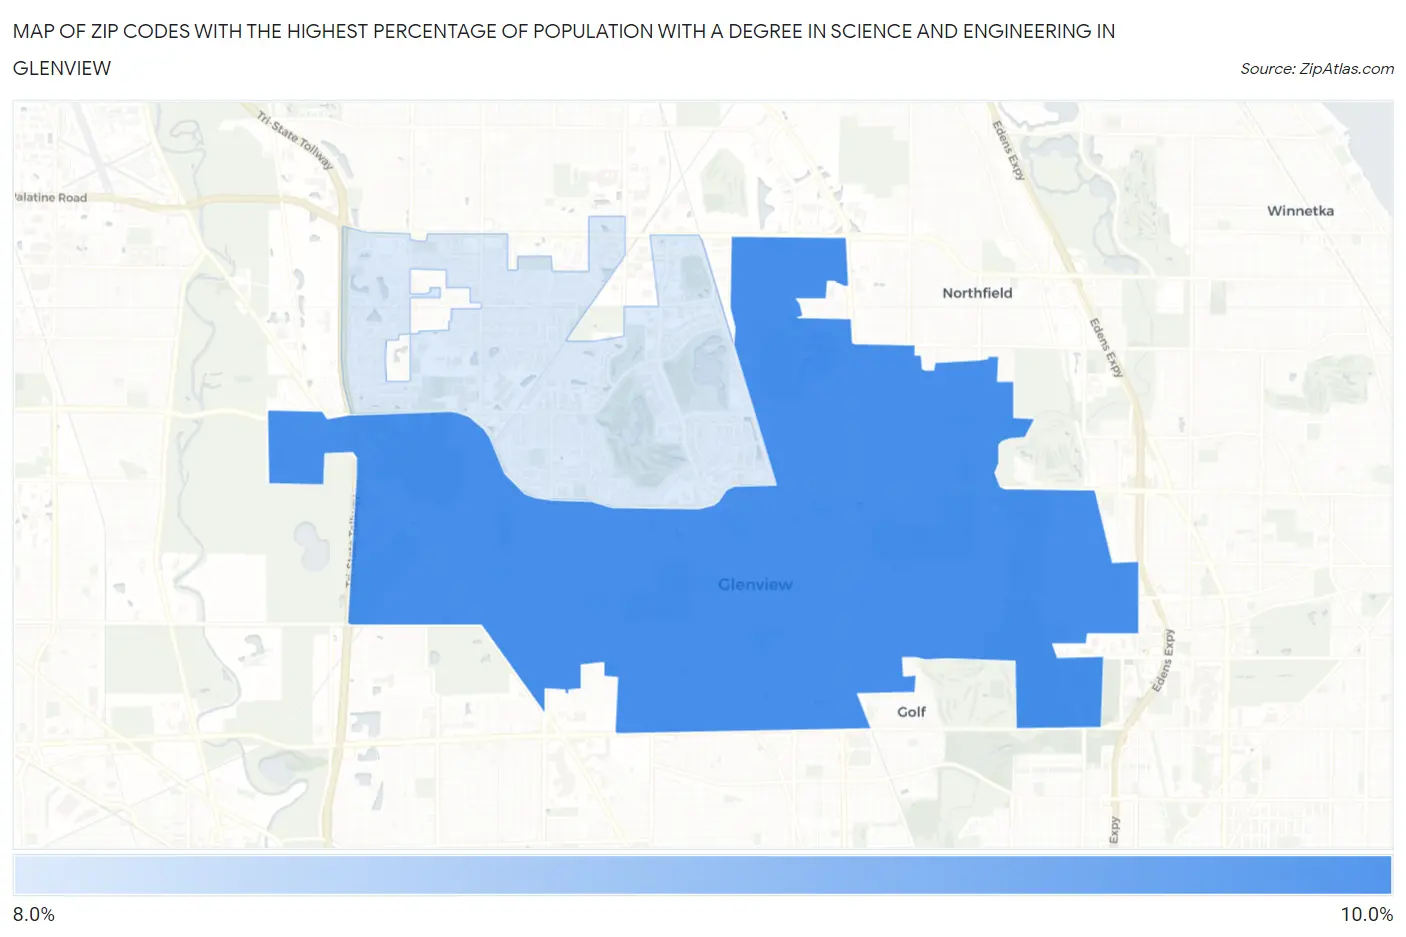
Map of Zip Codes with the Highest Percentage of Population with a Degree in Science and Engineering in Glenview
0.0%
10.0%
Zip Codes with the Highest Percentage of Population with a Degree in Science and Engineering in Glenview, IL
| Zip Code | % Graduates | vs State | vs National | |
| 1. | 60025 | 8.8% | 9.8%(-1.03)#845 | 9.8%(-0.974)#17,782 |
| 2. | 60026 | 8.1% | 9.8%(-1.71)#906 | 9.8%(-1.65)#19,356 |
1
Common Questions
What are the Top Zip Codes with the Highest Percentage of Population with a Degree in Science and Engineering in Glenview, IL?
Top Zip Codes with the Highest Percentage of Population with a Degree in Science and Engineering in Glenview, IL are:
What zip code has the Highest Percentage of Population with a Degree in Science and Engineering in Glenview, IL?
60025 has the Highest Percentage of Population with a Degree in Science and Engineering in Glenview, IL with 8.8%.
What is the Percentage of Population with a Degree in Science and Engineering in Glenview, IL?
Percentage of Population with a Degree in Science and Engineering in Glenview is 9.0%.
What is the Percentage of Population with a Degree in Science and Engineering in Illinois?
Percentage of Population with a Degree in Science and Engineering in Illinois is 9.8%.
What is the Percentage of Population with a Degree in Science and Engineering in the United States?
Percentage of Population with a Degree in Science and Engineering in the United States is 9.8%.