McLeansboro, IL
McLeansboro Map
McLeansboro Overview
2,794
TOTAL POPULATION
1,301
MALE POPULATION
1,493
FEMALE POPULATION
87.14
MALES / 100 FEMALES
114.76
FEMALES / 100 MALES
39.5
MEDIAN AGE
3.0
AVG FAMILY SIZE
2.3
AVG HOUSEHOLD SIZE
$24,857
PER CAPITA INCOME
$64,022
AVG FAMILY INCOME
$44,871
AVG HOUSEHOLD INCOME
29.6%
WAGE / INCOME GAP [ % ]
70.4¢/ $1
WAGE / INCOME GAP [ $ ]
0.42
INEQUALITY / GINI INDEX
1,164
LABOR FORCE [ PEOPLE ]
52.8%
PERCENT IN LABOR FORCE
1.2%
UNEMPLOYMENT RATE
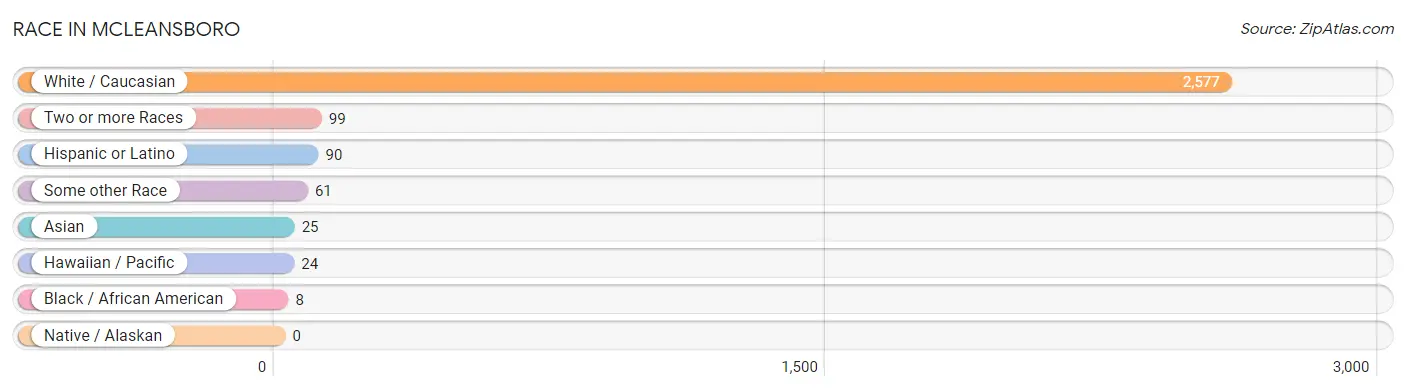
Race in McLeansboro
The most populous races in McLeansboro are White / Caucasian (2,577 | 92.2%), Two or more Races (99 | 3.5%), and Hispanic or Latino (90 | 3.2%).
| Race | # Population | % Population |
| Asian | 25 | 0.9% |
| Black / African American | 8 | 0.3% |
| Hawaiian / Pacific | 24 | 0.9% |
| Hispanic or Latino | 90 | 3.2% |
| Native / Alaskan | 0 | 0.0% |
| White / Caucasian | 2,577 | 92.2% |
| Two or more Races | 99 | 3.5% |
| Some other Race | 61 | 2.2% |
| Total | 2,794 | 100.0% |
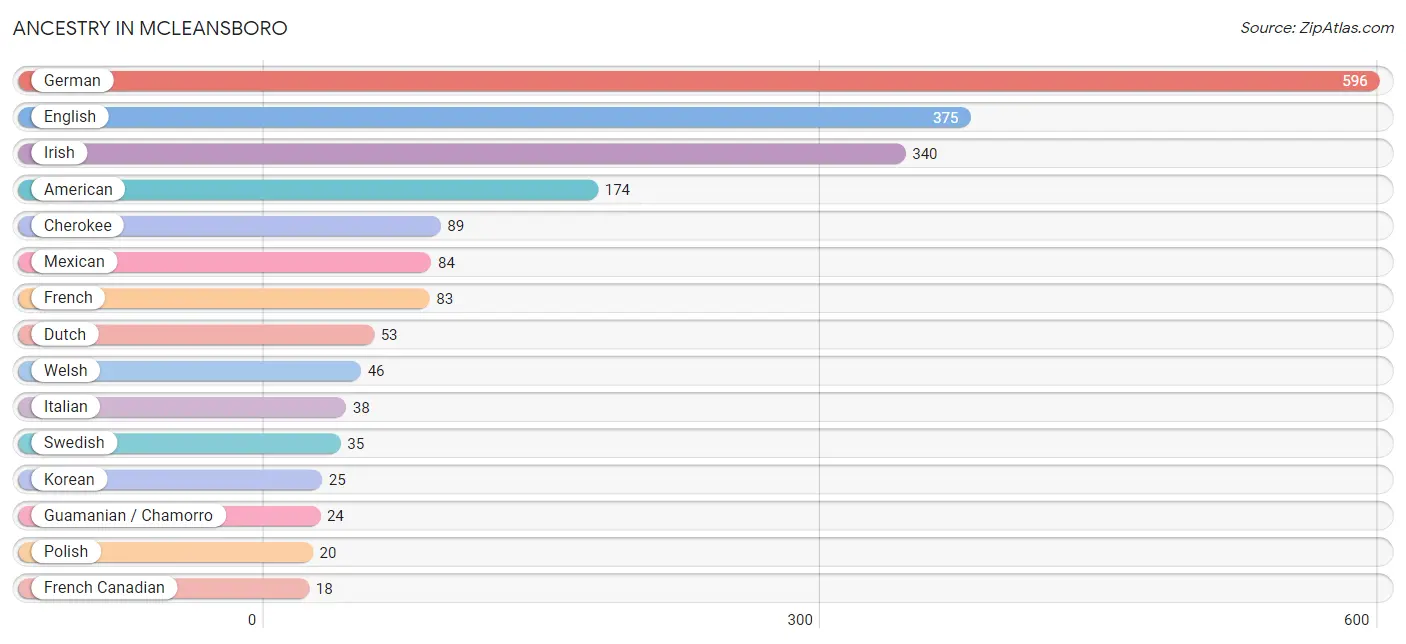
Ancestry in McLeansboro
The most populous ancestries reported in McLeansboro are German (596 | 21.3%), English (375 | 13.4%), Irish (340 | 12.2%), American (174 | 6.2%), and Cherokee (89 | 3.2%), together accounting for 56.3% of all McLeansboro residents.
| Ancestry | # Population | % Population |
| American | 174 | 6.2% |
| Belgian | 14 | 0.5% |
| Blackfeet | 10 | 0.4% |
| Cherokee | 89 | 3.2% |
| Cuban | 6 | 0.2% |
| Czech | 10 | 0.4% |
| Dutch | 53 | 1.9% |
| English | 375 | 13.4% |
| European | 8 | 0.3% |
| French | 83 | 3.0% |
| French Canadian | 18 | 0.6% |
| German | 596 | 21.3% |
| Guamanian / Chamorro | 24 | 0.9% |
| Irish | 340 | 12.2% |
| Italian | 38 | 1.4% |
| Korean | 25 | 0.9% |
| Mexican | 84 | 3.0% |
| Polish | 20 | 0.7% |
| Portuguese | 10 | 0.4% |
| Scotch-Irish | 14 | 0.5% |
| Swedish | 35 | 1.3% |
| Welsh | 46 | 1.7% | View All 22 Rows |
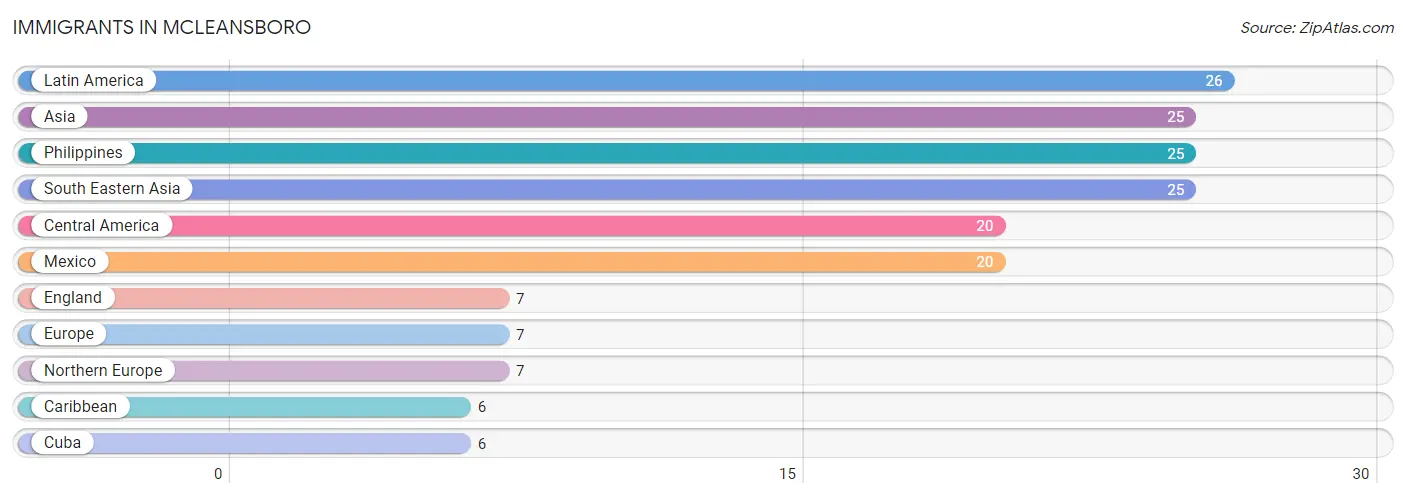
Immigrants in McLeansboro
The most numerous immigrant groups reported in McLeansboro came from Latin America (26 | 0.9%), Asia (25 | 0.9%), Philippines (25 | 0.9%), South Eastern Asia (25 | 0.9%), and Central America (20 | 0.7%), together accounting for 4.3% of all McLeansboro residents.
| Immigration Origin | # Population | % Population |
| Asia | 25 | 0.9% |
| Caribbean | 6 | 0.2% |
| Central America | 20 | 0.7% |
| Cuba | 6 | 0.2% |
| England | 7 | 0.3% |
| Europe | 7 | 0.3% |
| Latin America | 26 | 0.9% |
| Mexico | 20 | 0.7% |
| Northern Europe | 7 | 0.3% |
| Philippines | 25 | 0.9% |
| South Eastern Asia | 25 | 0.9% | View All 11 Rows |
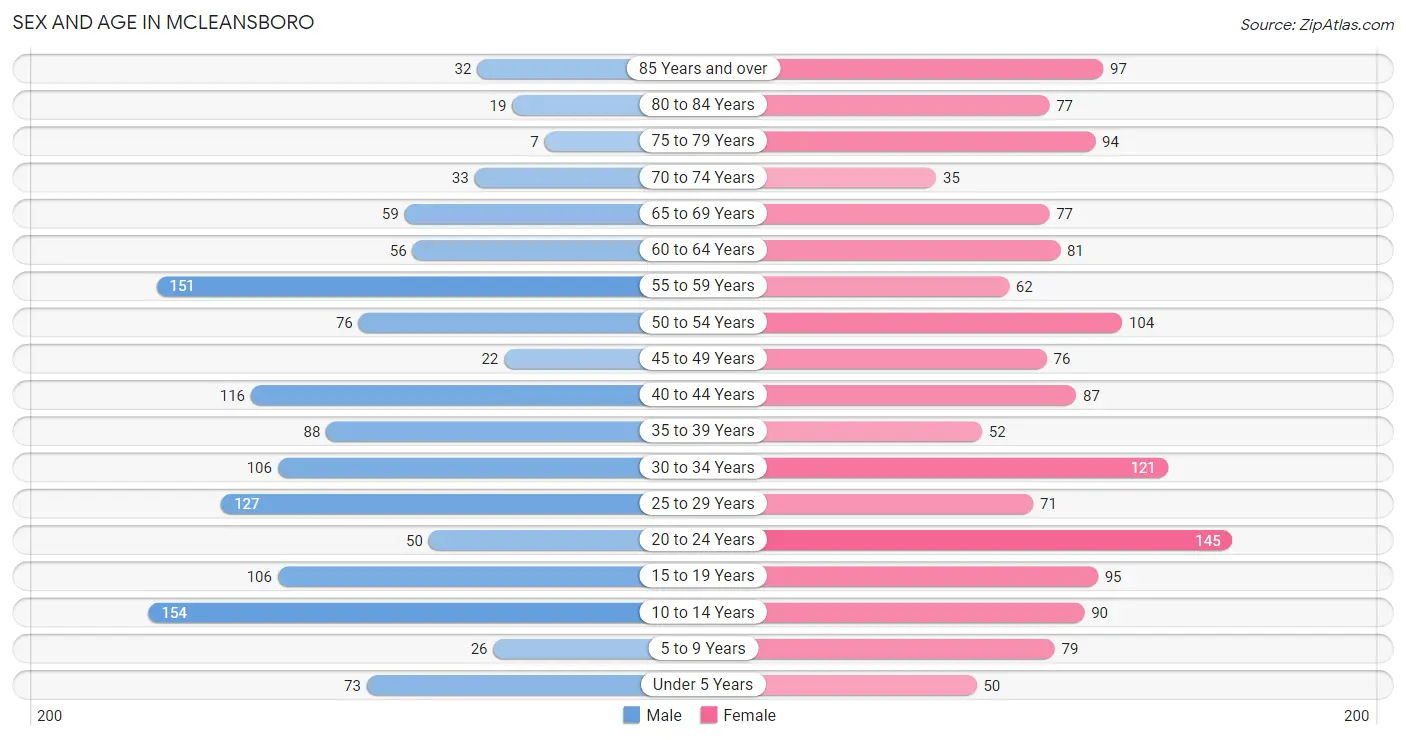
Sex and Age in McLeansboro
Sex and Age in McLeansboro
The most populous age groups in McLeansboro are 10 to 14 Years (154 | 11.8%) for men and 20 to 24 Years (145 | 9.7%) for women.
| Age Bracket | Male | Female |
| Under 5 Years | 73 (5.6%) | 50 (3.4%) |
| 5 to 9 Years | 26 (2.0%) | 79 (5.3%) |
| 10 to 14 Years | 154 (11.8%) | 90 (6.0%) |
| 15 to 19 Years | 106 (8.2%) | 95 (6.4%) |
| 20 to 24 Years | 50 (3.8%) | 145 (9.7%) |
| 25 to 29 Years | 127 (9.8%) | 71 (4.8%) |
| 30 to 34 Years | 106 (8.2%) | 121 (8.1%) |
| 35 to 39 Years | 88 (6.8%) | 52 (3.5%) |
| 40 to 44 Years | 116 (8.9%) | 87 (5.8%) |
| 45 to 49 Years | 22 (1.7%) | 76 (5.1%) |
| 50 to 54 Years | 76 (5.8%) | 104 (7.0%) |
| 55 to 59 Years | 151 (11.6%) | 62 (4.2%) |
| 60 to 64 Years | 56 (4.3%) | 81 (5.4%) |
| 65 to 69 Years | 59 (4.5%) | 77 (5.2%) |
| 70 to 74 Years | 33 (2.5%) | 35 (2.3%) |
| 75 to 79 Years | 7 (0.5%) | 94 (6.3%) |
| 80 to 84 Years | 19 (1.5%) | 77 (5.2%) |
| 85 Years and over | 32 (2.5%) | 97 (6.5%) |
| Total | 1,301 (100.0%) | 1,493 (100.0%) |
Families and Households in McLeansboro
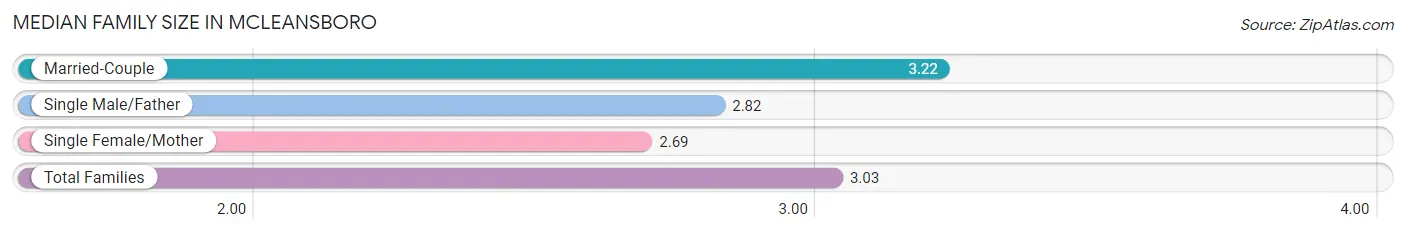
Median Family Size in McLeansboro
The median family size in McLeansboro is 3.03 persons per family, with married-couple families (384 | 61.0%) accounting for the largest median family size of 3.22 persons per family. On the other hand, single female/mother families (161 | 25.6%) represent the smallest median family size with 2.69 persons per family.
| Family Type | # Families | Family Size |
| Married-Couple | 384 (61.0%) | 3.22 |
| Single Male/Father | 85 (13.5%) | 2.82 |
| Single Female/Mother | 161 (25.6%) | 2.69 |
| Total Families | 630 (100.0%) | 3.03 |
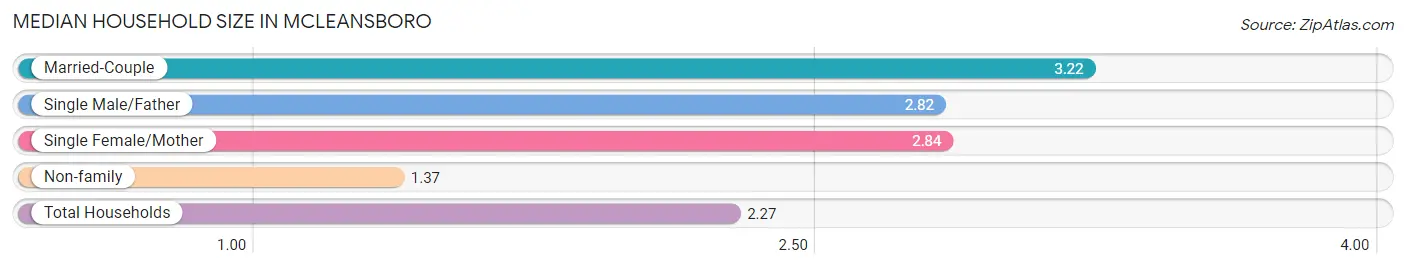
Median Household Size in McLeansboro
The median household size in McLeansboro is 2.27 persons per household, with married-couple households (384 | 32.3%) accounting for the largest median household size of 3.22 persons per household. non-family households (559 | 47.0%) represent the smallest median household size with 1.37 persons per household.
| Household Type | # Households | Household Size |
| Married-Couple | 384 (32.3%) | 3.22 |
| Single Male/Father | 85 (7.1%) | 2.82 |
| Single Female/Mother | 161 (13.5%) | 2.84 |
| Non-family | 559 (47.0%) | 1.37 |
| Total Households | 1,189 (100.0%) | 2.27 |
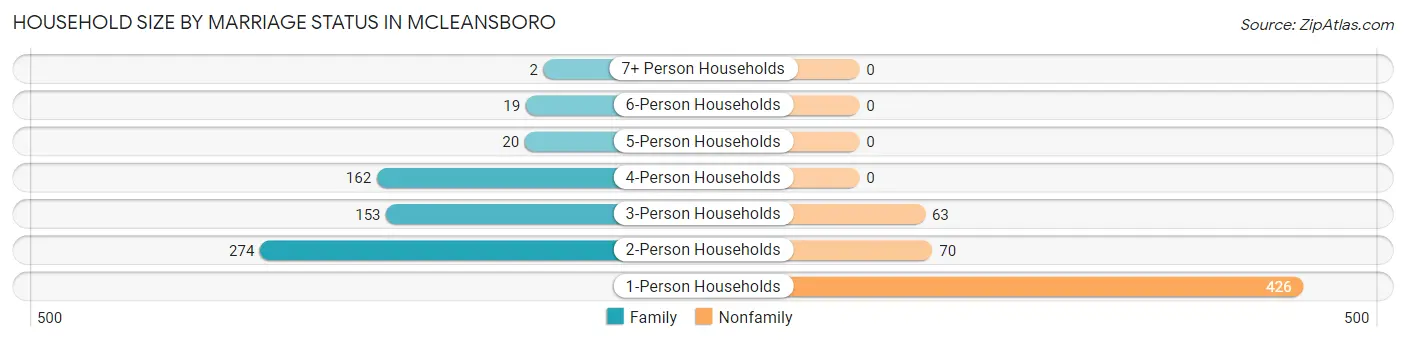
Household Size by Marriage Status in McLeansboro
Out of a total of 1,189 households in McLeansboro, 630 (53.0%) are family households, while 559 (47.0%) are nonfamily households. The most numerous type of family households are 2-person households, comprising 274, and the most common type of nonfamily households are 1-person households, comprising 426.
| Household Size | Family Households | Nonfamily Households |
| 1-Person Households | - | 426 (35.8%) |
| 2-Person Households | 274 (23.0%) | 70 (5.9%) |
| 3-Person Households | 153 (12.9%) | 63 (5.3%) |
| 4-Person Households | 162 (13.6%) | 0 (0.0%) |
| 5-Person Households | 20 (1.7%) | 0 (0.0%) |
| 6-Person Households | 19 (1.6%) | 0 (0.0%) |
| 7+ Person Households | 2 (0.2%) | 0 (0.0%) |
| Total | 630 (53.0%) | 559 (47.0%) |
Female Fertility in McLeansboro
Fertility by Age in McLeansboro
Average fertility rate in McLeansboro is 10.0 births per 1,000 women. Women in the age bracket of 35 to 50 years have the highest fertility rate with 25.0 births per 1,000 women. Women in the age bracket of 35 to 50 years acount for 85.7% of all women with births.
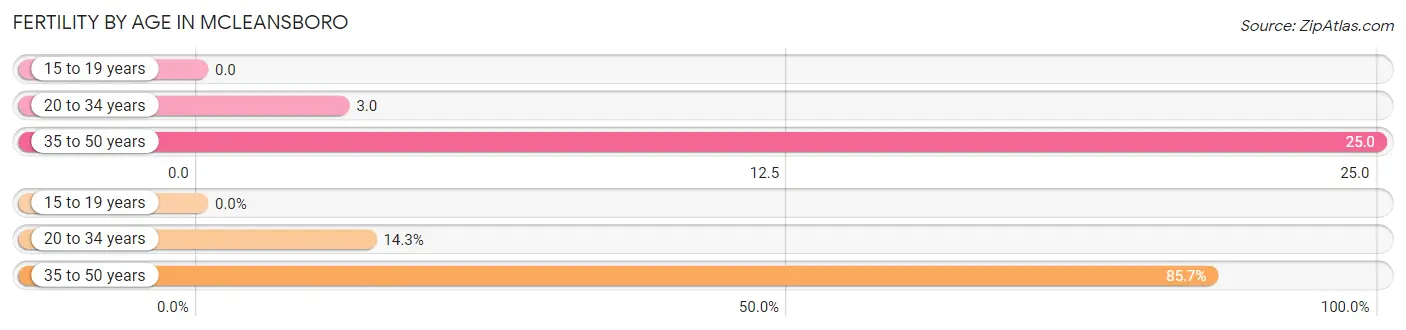
| Age Bracket | Women with Births | Births / 1,000 Women |
| 15 to 19 years | 0 (0.0%) | 0.0 |
| 20 to 34 years | 1 (14.3%) | 3.0 |
| 35 to 50 years | 6 (85.7%) | 25.0 |
| Total | 7 (100.0%) | 10.0 |
Fertility by Age by Marriage Status in McLeansboro
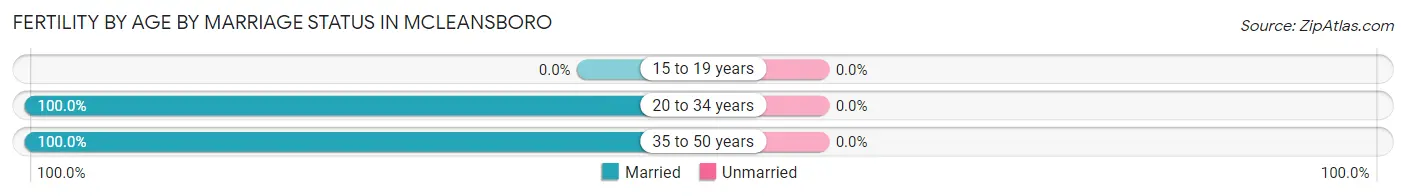
| Age Bracket | Married | Unmarried |
| 15 to 19 years | 0 (0.0%) | 0 (0.0%) |
| 20 to 34 years | 1 (100.0%) | 0 (0.0%) |
| 35 to 50 years | 6 (100.0%) | 0 (0.0%) |
| Total | 7 (100.0%) | 0 (0.0%) |
Fertility by Education in McLeansboro
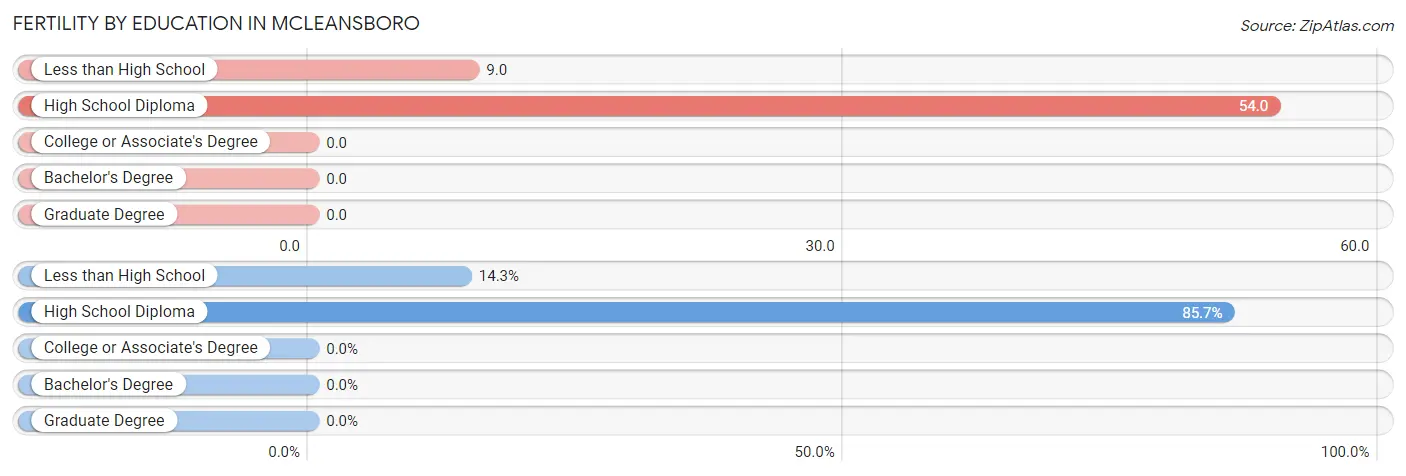
| Educational Attainment | Women with Births | Births / 1,000 Women |
| Less than High School | 1 (14.3%) | 9.0 |
| High School Diploma | 6 (85.7%) | 54.0 |
| College or Associate's Degree | 0 (0.0%) | 0.0 |
| Bachelor's Degree | 0 (0.0%) | 0.0 |
| Graduate Degree | 0 (0.0%) | 0.0 |
| Total | 7 (100.0%) | 10.0 |
Fertility by Education by Marriage Status in McLeansboro
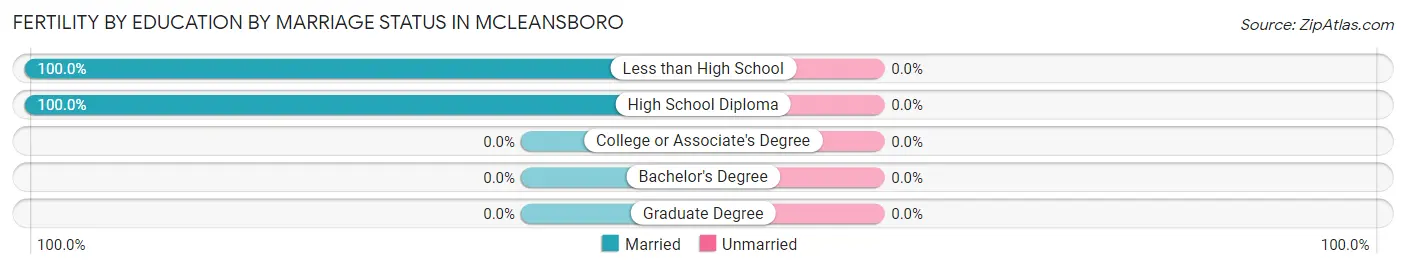
| Educational Attainment | Married | Unmarried |
| Less than High School | 1 (100.0%) | 0 (0.0%) |
| High School Diploma | 6 (100.0%) | 0 (0.0%) |
| College or Associate's Degree | 0 (0.0%) | 0 (0.0%) |
| Bachelor's Degree | 0 (0.0%) | 0 (0.0%) |
| Graduate Degree | 0 (0.0%) | 0 (0.0%) |
| Total | 7 (100.0%) | 0 (0.0%) |
Income in McLeansboro
Income Overview in McLeansboro
Per Capita Income in McLeansboro is $24,857, while median incomes of families and households are $64,022 and $44,871 respectively.
| Characteristic | Number | Measure |
| Per Capita Income | 2,794 | $24,857 |
| Median Family Income | 630 | $64,022 |
| Mean Family Income | 630 | $75,173 |
| Median Household Income | 1,189 | $44,871 |
| Mean Household Income | 1,189 | $56,086 |
| Income Deficit | 630 | $0 |
| Wage / Income Gap (%) | 2,794 | 29.61% |
| Wage / Income Gap ($) | 2,794 | 70.39¢ per $1 |
| Gini / Inequality Index | 2,794 | 0.42 |
Earnings by Sex in McLeansboro
Average Earnings in McLeansboro are $28,914, $38,798 for men and $27,308 for women, a difference of 29.6%.
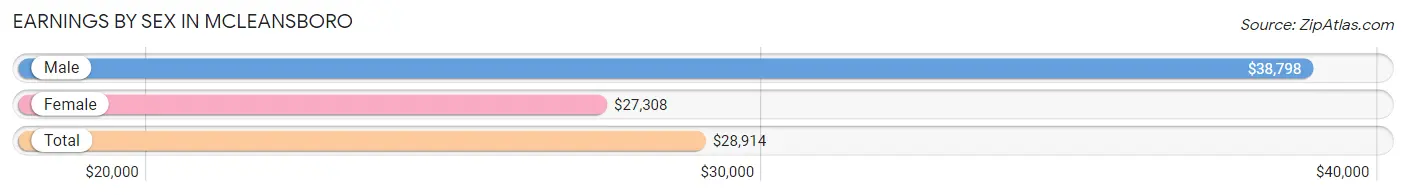
| Sex | Number | Average Earnings |
| Male | 671 (54.9%) | $38,798 |
| Female | 550 (45.1%) | $27,308 |
| Total | 1,221 (100.0%) | $28,914 |
Earnings by Sex by Income Bracket in McLeansboro
The most common earnings brackets in McLeansboro are $20,000 to $22,499 for men (105 | 15.7%) and $25,000 to $29,999 for women (129 | 23.4%).
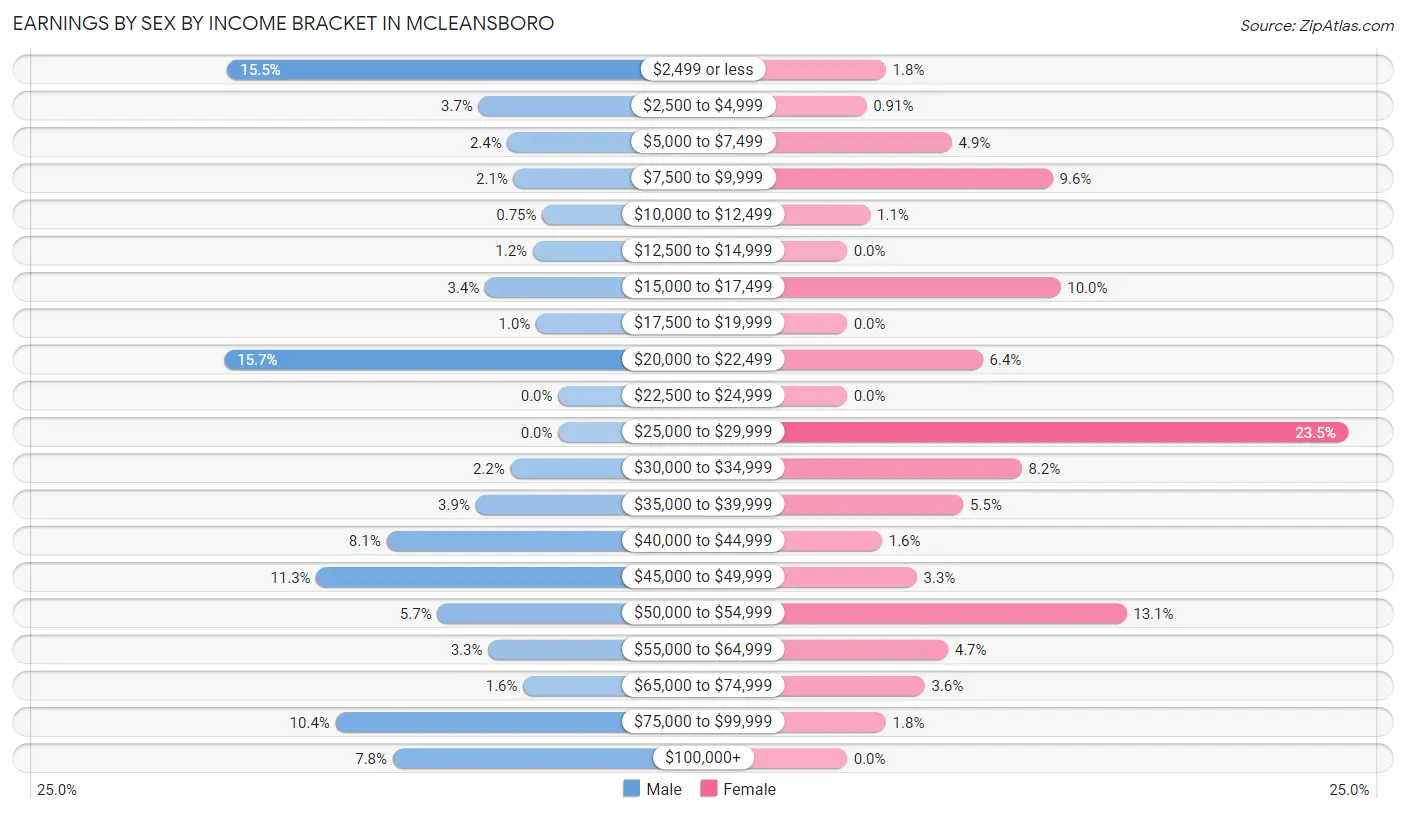
| Income | Male | Female |
| $2,499 or less | 104 (15.5%) | 10 (1.8%) |
| $2,500 to $4,999 | 25 (3.7%) | 5 (0.9%) |
| $5,000 to $7,499 | 16 (2.4%) | 27 (4.9%) |
| $7,500 to $9,999 | 14 (2.1%) | 53 (9.6%) |
| $10,000 to $12,499 | 5 (0.7%) | 6 (1.1%) |
| $12,500 to $14,999 | 8 (1.2%) | 0 (0.0%) |
| $15,000 to $17,499 | 23 (3.4%) | 55 (10.0%) |
| $17,500 to $19,999 | 7 (1.0%) | 0 (0.0%) |
| $20,000 to $22,499 | 105 (15.7%) | 35 (6.4%) |
| $22,500 to $24,999 | 0 (0.0%) | 0 (0.0%) |
| $25,000 to $29,999 | 0 (0.0%) | 129 (23.4%) |
| $30,000 to $34,999 | 15 (2.2%) | 45 (8.2%) |
| $35,000 to $39,999 | 26 (3.9%) | 30 (5.4%) |
| $40,000 to $44,999 | 54 (8.1%) | 9 (1.6%) |
| $45,000 to $49,999 | 76 (11.3%) | 18 (3.3%) |
| $50,000 to $54,999 | 38 (5.7%) | 72 (13.1%) |
| $55,000 to $64,999 | 22 (3.3%) | 26 (4.7%) |
| $65,000 to $74,999 | 11 (1.6%) | 20 (3.6%) |
| $75,000 to $99,999 | 70 (10.4%) | 10 (1.8%) |
| $100,000+ | 52 (7.7%) | 0 (0.0%) |
| Total | 671 (100.0%) | 550 (100.0%) |
Earnings by Sex by Educational Attainment in McLeansboro
Average earnings in McLeansboro are $43,912 for men and $33,242 for women, a difference of 24.3%. Men with an educational attainment of high school diploma enjoy the highest average annual earnings of $45,679, while those with college or associate's degree education earn the least with $21,578. Women with an educational attainment of graduate degree earn the most with the average annual earnings of $51,667, while those with high school diploma education have the smallest earnings of $26,546.
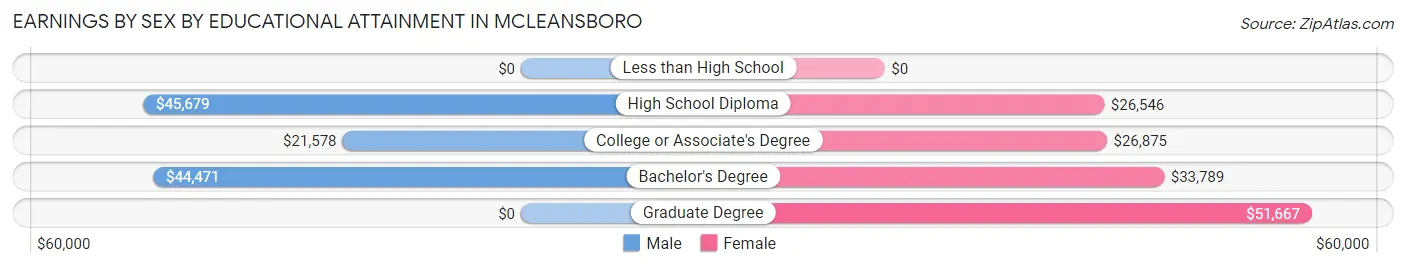
| Educational Attainment | Male Income | Female Income |
| Less than High School | - | - |
| High School Diploma | $45,679 | $26,546 |
| College or Associate's Degree | $21,578 | $26,875 |
| Bachelor's Degree | $44,471 | $33,789 |
| Graduate Degree | - | - |
| Total | $43,912 | $33,242 |
Family Income in McLeansboro
Family Income Brackets in McLeansboro
According to the McLeansboro family income data, there are 189 families falling into the $50,000 to $74,999 income range, which is the most common income bracket and makes up 30.0% of all families.
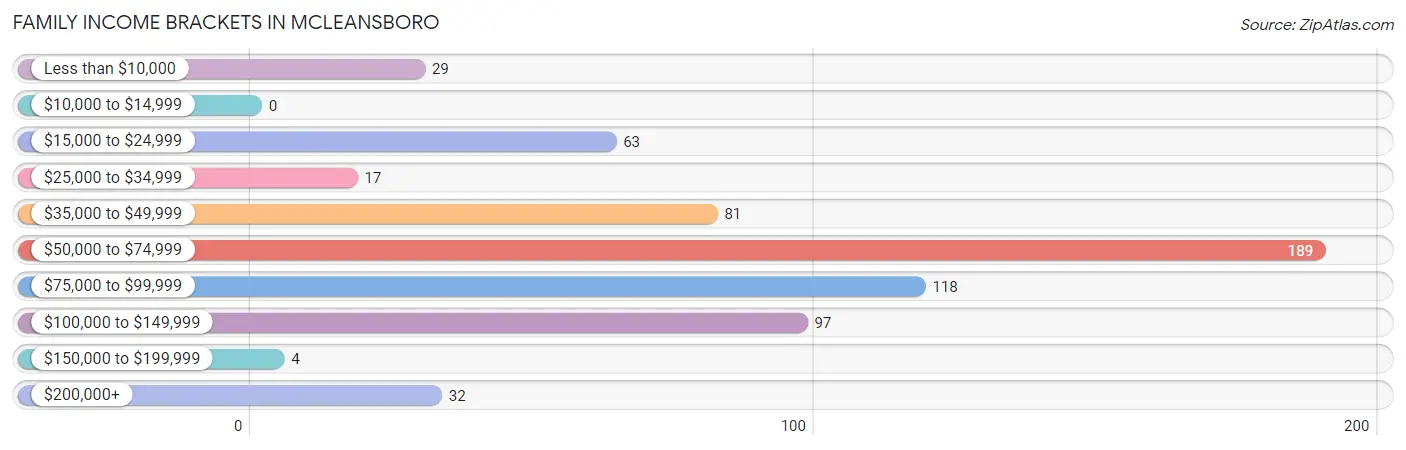
| Income Bracket | # Families | % Families |
| Less than $10,000 | 29 | 4.6% |
| $10,000 to $14,999 | 0 | 0.0% |
| $15,000 to $24,999 | 63 | 10.0% |
| $25,000 to $34,999 | 17 | 2.7% |
| $35,000 to $49,999 | 81 | 12.9% |
| $50,000 to $74,999 | 189 | 30.0% |
| $75,000 to $99,999 | 118 | 18.7% |
| $100,000 to $149,999 | 97 | 15.4% |
| $150,000 to $199,999 | 4 | 0.6% |
| $200,000+ | 32 | 5.1% |
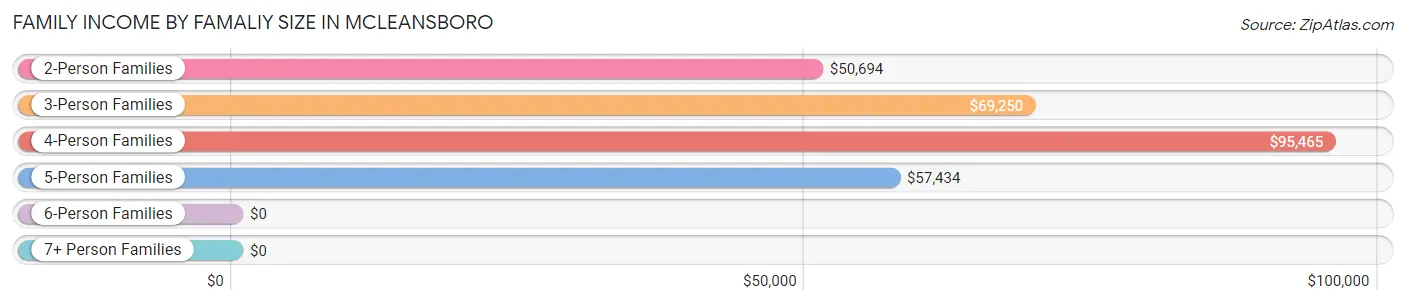
Family Income by Famaliy Size in McLeansboro
4-person families (162 | 25.7%) account for the highest median family income in McLeansboro with $95,465 per family, while 2-person families (274 | 43.5%) have the highest median income of $25,347 per family member.
| Income Bracket | # Families | Median Income |
| 2-Person Families | 274 (43.5%) | $50,694 |
| 3-Person Families | 153 (24.3%) | $69,250 |
| 4-Person Families | 162 (25.7%) | $95,465 |
| 5-Person Families | 39 (6.2%) | $57,434 |
| 6-Person Families | 0 (0.0%) | $0 |
| 7+ Person Families | 2 (0.3%) | $0 |
| Total | 630 (100.0%) | $64,022 |
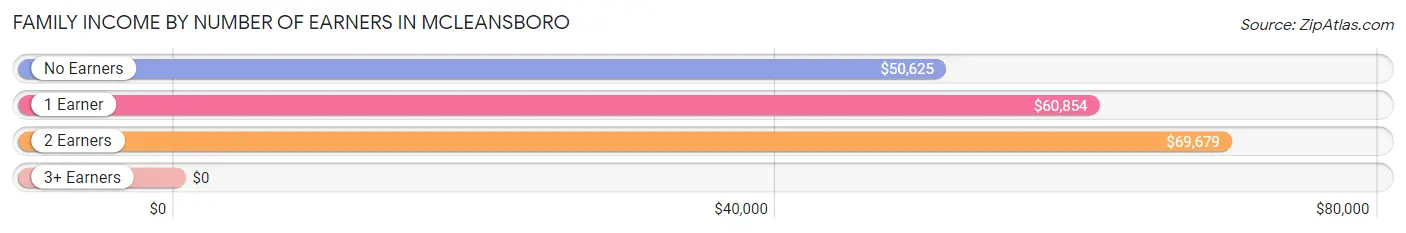
Family Income by Number of Earners in McLeansboro
| Number of Earners | # Families | Median Income |
| No Earners | 65 (10.3%) | $50,625 |
| 1 Earner | 286 (45.4%) | $60,854 |
| 2 Earners | 255 (40.5%) | $69,679 |
| 3+ Earners | 24 (3.8%) | $0 |
| Total | 630 (100.0%) | $64,022 |
Household Income in McLeansboro
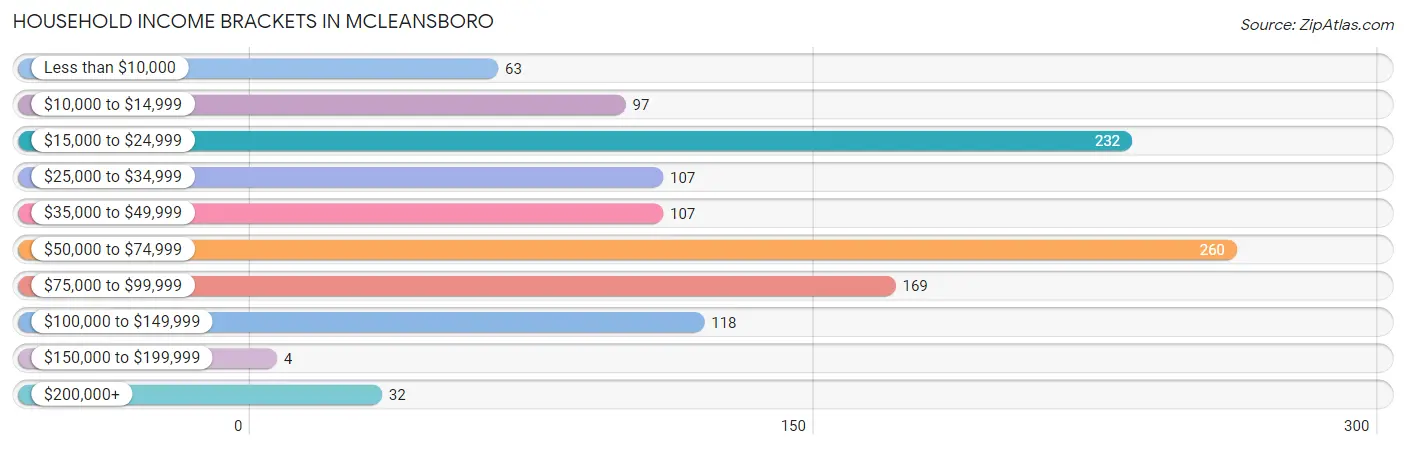
Household Income Brackets in McLeansboro
With 260 households falling in the category, the $50,000 to $74,999 income range is the most frequent in McLeansboro, accounting for 21.9% of all households. In contrast, only 4 households (0.3%) fall into the $150,000 to $199,999 income bracket, making it the least populous group.
| Income Bracket | # Households | % Households |
| Less than $10,000 | 63 | 5.3% |
| $10,000 to $14,999 | 97 | 8.2% |
| $15,000 to $24,999 | 232 | 19.5% |
| $25,000 to $34,999 | 107 | 9.0% |
| $35,000 to $49,999 | 107 | 9.0% |
| $50,000 to $74,999 | 260 | 21.9% |
| $75,000 to $99,999 | 169 | 14.2% |
| $100,000 to $149,999 | 118 | 9.9% |
| $150,000 to $199,999 | 4 | 0.3% |
| $200,000+ | 32 | 2.7% |
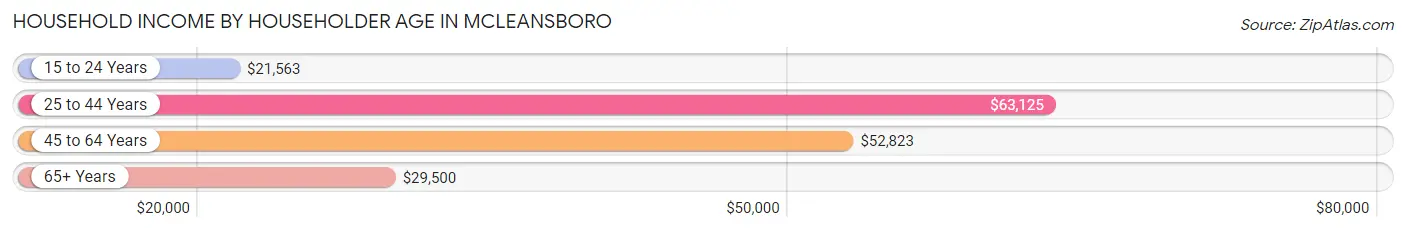
Household Income by Householder Age in McLeansboro
The median household income in McLeansboro is $44,871, with the highest median household income of $63,125 found in the 25 to 44 years age bracket for the primary householder. A total of 377 households (31.7%) fall into this category. Meanwhile, the 15 to 24 years age bracket for the primary householder has the lowest median household income of $21,563, with 31 households (2.6%) in this group.
| Income Bracket | # Households | Median Income |
| 15 to 24 Years | 31 (2.6%) | $21,563 |
| 25 to 44 Years | 377 (31.7%) | $63,125 |
| 45 to 64 Years | 355 (29.9%) | $52,823 |
| 65+ Years | 426 (35.8%) | $29,500 |
| Total | 1,189 (100.0%) | $44,871 |
Poverty in McLeansboro
Income Below Poverty by Sex and Age in McLeansboro
With 13.2% poverty level for males and 22.8% for females among the residents of McLeansboro, 55 to 64 year old males and 15 year old females are the most vulnerable to poverty, with 84 males (41.4%) and 69 females (79.3%) in their respective age groups living below the poverty level.
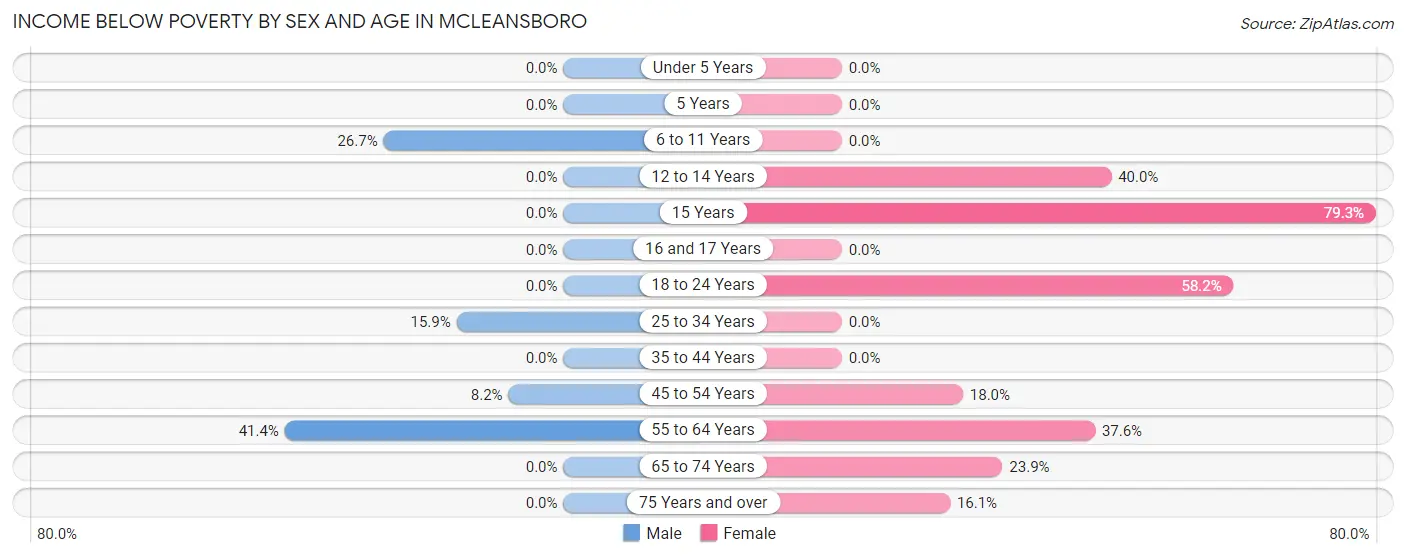
| Age Bracket | Male | Female |
| Under 5 Years | 0 (0.0%) | 0 (0.0%) |
| 5 Years | 0 (0.0%) | 0 (0.0%) |
| 6 to 11 Years | 39 (26.7%) | 0 (0.0%) |
| 12 to 14 Years | 0 (0.0%) | 26 (40.0%) |
| 15 Years | 0 (0.0%) | 69 (79.3%) |
| 16 and 17 Years | 0 (0.0%) | 0 (0.0%) |
| 18 to 24 Years | 0 (0.0%) | 89 (58.2%) |
| 25 to 34 Years | 36 (15.9%) | 0 (0.0%) |
| 35 to 44 Years | 0 (0.0%) | 0 (0.0%) |
| 45 to 54 Years | 8 (8.2%) | 32 (18.0%) |
| 55 to 64 Years | 84 (41.4%) | 53 (37.6%) |
| 65 to 74 Years | 0 (0.0%) | 26 (23.8%) |
| 75 Years and over | 0 (0.0%) | 40 (16.1%) |
| Total | 167 (13.2%) | 335 (22.8%) |
Income Above Poverty by Sex and Age in McLeansboro
According to the poverty statistics in McLeansboro, males aged under 5 years and females aged under 5 years are the age groups that are most secure financially, with 100.0% of males and 100.0% of females in these age groups living above the poverty line.
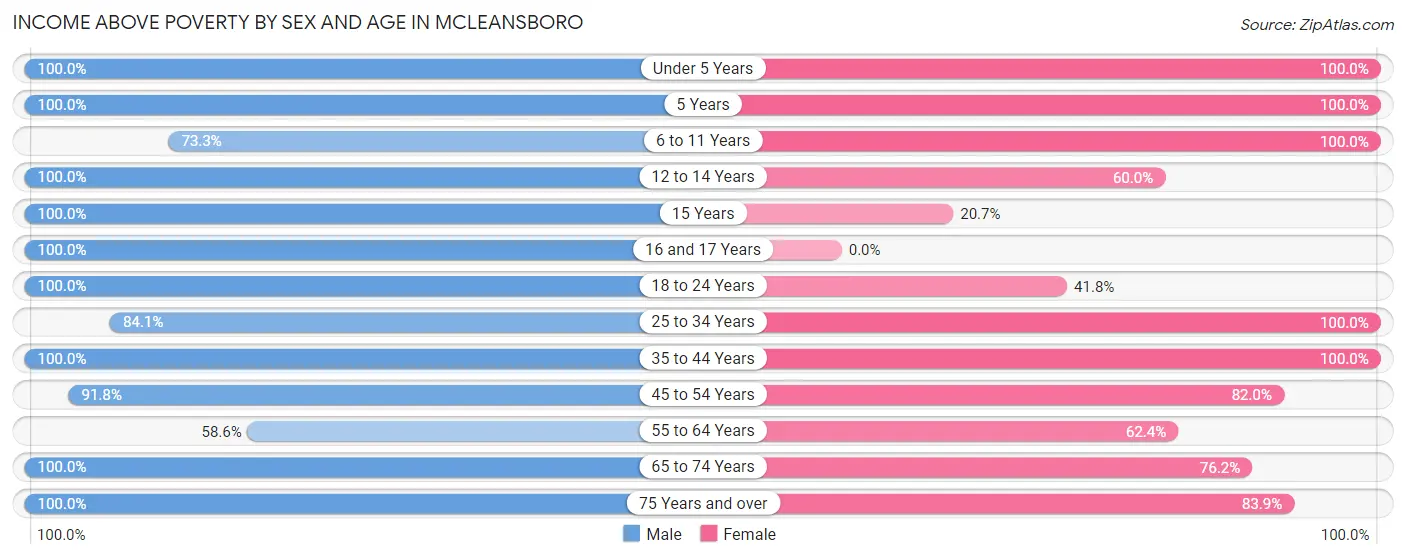
| Age Bracket | Male | Female |
| Under 5 Years | 73 (100.0%) | 50 (100.0%) |
| 5 Years | 1 (100.0%) | 25 (100.0%) |
| 6 to 11 Years | 107 (73.3%) | 79 (100.0%) |
| 12 to 14 Years | 33 (100.0%) | 39 (60.0%) |
| 15 Years | 30 (100.0%) | 18 (20.7%) |
| 16 and 17 Years | 37 (100.0%) | 0 (0.0%) |
| 18 to 24 Years | 89 (100.0%) | 64 (41.8%) |
| 25 to 34 Years | 191 (84.1%) | 192 (100.0%) |
| 35 to 44 Years | 204 (100.0%) | 139 (100.0%) |
| 45 to 54 Years | 90 (91.8%) | 146 (82.0%) |
| 55 to 64 Years | 119 (58.6%) | 88 (62.4%) |
| 65 to 74 Years | 90 (100.0%) | 83 (76.1%) |
| 75 Years and over | 30 (100.0%) | 209 (83.9%) |
| Total | 1,094 (86.8%) | 1,132 (77.2%) |
Income Below Poverty Among Married-Couple Families in McLeansboro
The poverty statistics for married-couple families in McLeansboro show that 1.8% or 7 of the total 384 families live below the poverty line. Families with no children have the highest poverty rate of 3.6%, comprising of 7 families. On the other hand, families with 1 or 2 children have the lowest poverty rate of 0.0%, which includes 0 families.
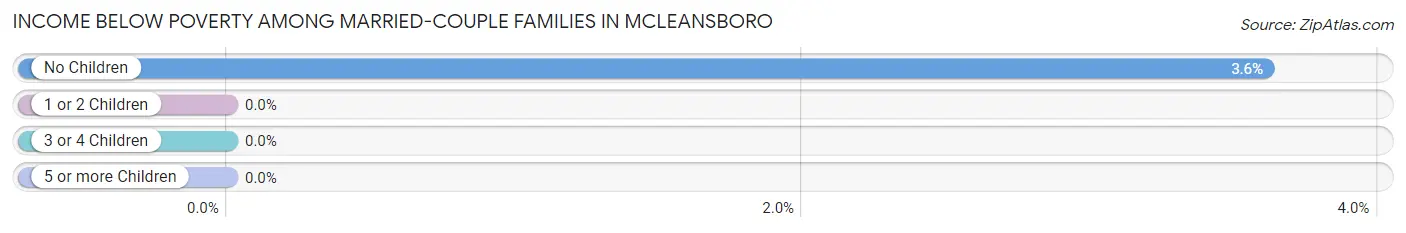
| Children | Above Poverty | Below Poverty |
| No Children | 187 (96.4%) | 7 (3.6%) |
| 1 or 2 Children | 187 (100.0%) | 0 (0.0%) |
| 3 or 4 Children | 1 (100.0%) | 0 (0.0%) |
| 5 or more Children | 2 (100.0%) | 0 (0.0%) |
| Total | 377 (98.2%) | 7 (1.8%) |
Income Below Poverty Among Single-Parent Households in McLeansboro
According to the poverty data in McLeansboro, 44.7% or 38 single-father households and 24.8% or 40 single-mother households are living below the poverty line. Among single-father households, those with 1 or 2 children have the highest poverty rate, with 38 households (64.4%) experiencing poverty. Likewise, among single-mother households, those with no children have the highest poverty rate, with 40 households (31.8%) falling below the poverty line.
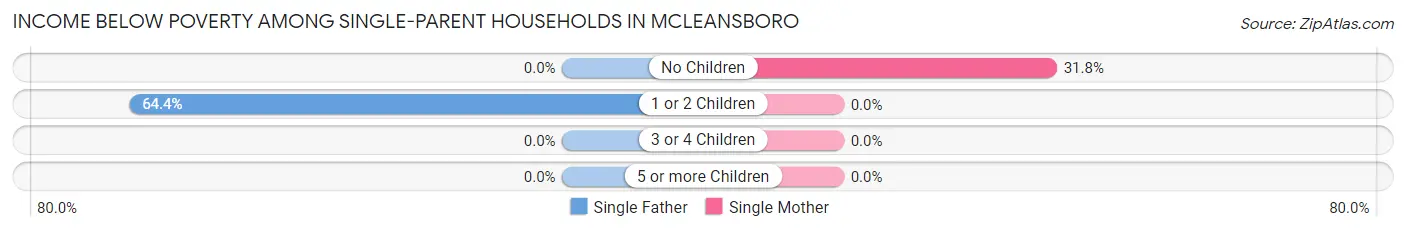
| Children | Single Father | Single Mother |
| No Children | 0 (0.0%) | 40 (31.8%) |
| 1 or 2 Children | 38 (64.4%) | 0 (0.0%) |
| 3 or 4 Children | 0 (0.0%) | 0 (0.0%) |
| 5 or more Children | 0 (0.0%) | 0 (0.0%) |
| Total | 38 (44.7%) | 40 (24.8%) |
Income Below Poverty Among Married-Couple vs Single-Parent Households in McLeansboro
The poverty data for McLeansboro shows that 7 of the married-couple family households (1.8%) and 78 of the single-parent households (31.7%) are living below the poverty level. Within the married-couple family households, those with no children have the highest poverty rate, with 7 households (3.6%) falling below the poverty line. Among the single-parent households, those with 1 or 2 children have the highest poverty rate, with 38 household (50.7%) living below poverty.
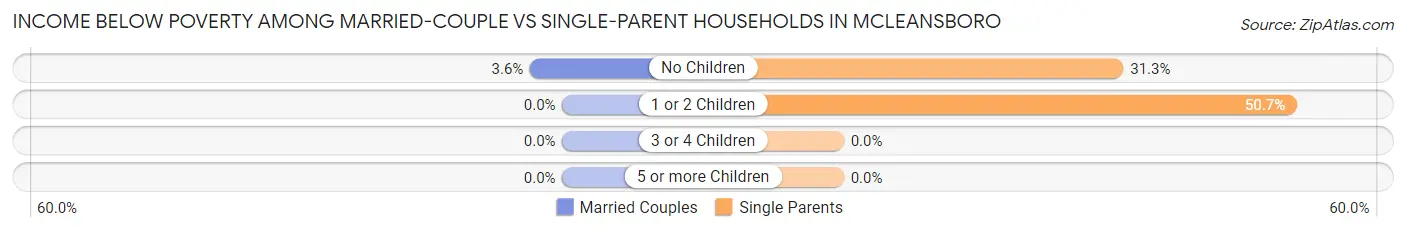
| Children | Married-Couple Families | Single-Parent Households |
| No Children | 7 (3.6%) | 40 (31.2%) |
| 1 or 2 Children | 0 (0.0%) | 38 (50.7%) |
| 3 or 4 Children | 0 (0.0%) | 0 (0.0%) |
| 5 or more Children | 0 (0.0%) | 0 (0.0%) |
| Total | 7 (1.8%) | 78 (31.7%) |
Employment Characteristics in McLeansboro
Employment by Class of Employer in McLeansboro
Among the 1,075 employed individuals in McLeansboro, private company employees (835 | 77.7%), local government employees (98 | 9.1%), and not-for-profit organizations (91 | 8.5%) make up the most common classes of employment.
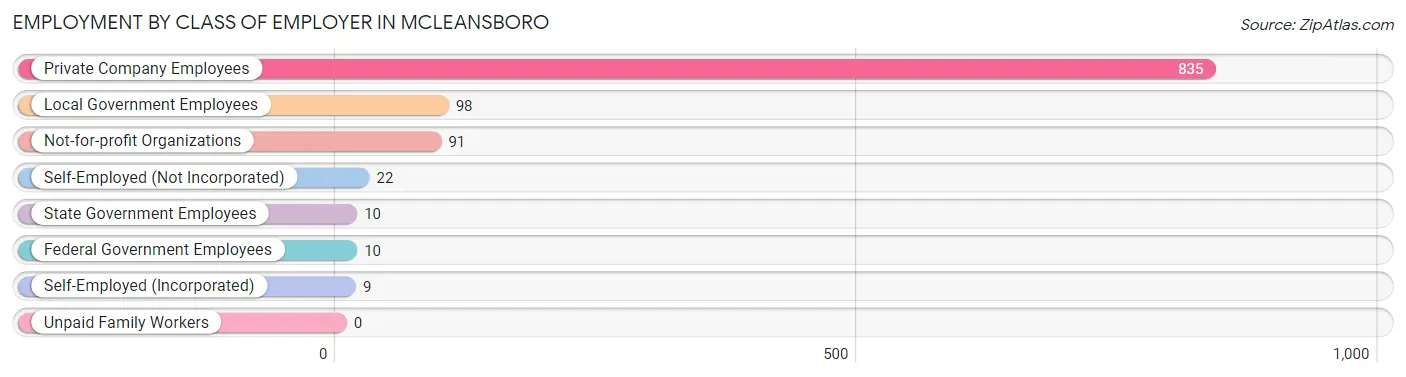
| Employer Class | # Employees | % Employees |
| Private Company Employees | 835 | 77.7% |
| Self-Employed (Incorporated) | 9 | 0.8% |
| Self-Employed (Not Incorporated) | 22 | 2.1% |
| Not-for-profit Organizations | 91 | 8.5% |
| Local Government Employees | 98 | 9.1% |
| State Government Employees | 10 | 0.9% |
| Federal Government Employees | 10 | 0.9% |
| Unpaid Family Workers | 0 | 0.0% |
| Total | 1,075 | 100.0% |
Employment Status by Age in McLeansboro
According to the labor force statistics for McLeansboro, out of the total population over 16 years of age (2,205), 52.8% or 1,164 individuals are in the labor force, with 1.2% or 14 of them unemployed. The age group with the highest labor force participation rate is 16 to 19 years, with 100.0% or 84 individuals in the labor force. Within the labor force, the 60 to 64 years age range has the highest percentage of unemployed individuals, with 45.2% or 14 of them being unemployed.
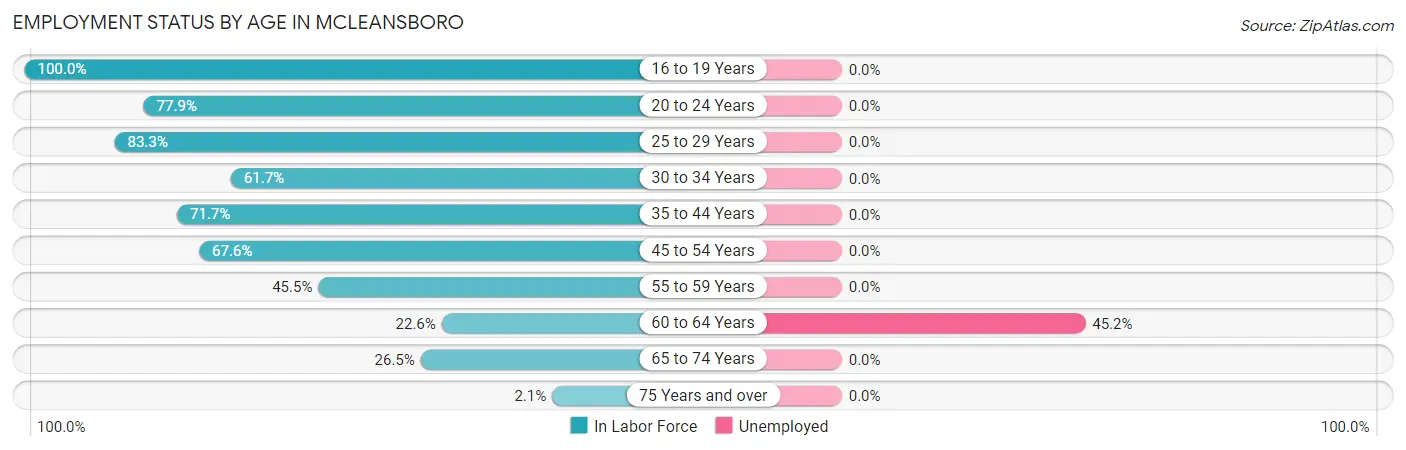
| Age Bracket | In Labor Force | Unemployed |
| 16 to 19 Years | 84 (100.0%) | 0 (0.0%) |
| 20 to 24 Years | 152 (77.9%) | 0 (0.0%) |
| 25 to 29 Years | 165 (83.3%) | 0 (0.0%) |
| 30 to 34 Years | 140 (61.7%) | 0 (0.0%) |
| 35 to 44 Years | 246 (71.7%) | 0 (0.0%) |
| 45 to 54 Years | 188 (67.6%) | 0 (0.0%) |
| 55 to 59 Years | 97 (45.5%) | 0 (0.0%) |
| 60 to 64 Years | 31 (22.6%) | 14 (45.2%) |
| 65 to 74 Years | 54 (26.5%) | 0 (0.0%) |
| 75 Years and over | 7 (2.1%) | 0 (0.0%) |
| Total | 1,164 (52.8%) | 14 (1.2%) |
Employment Status by Educational Attainment in McLeansboro
According to labor force statistics for McLeansboro, 62.1% of individuals (867) out of the total population between 25 and 64 years of age (1,396) are in the labor force, with 1.6% or 14 of them being unemployed. The group with the highest labor force participation rate are those with the educational attainment of bachelor's degree or higher, with 73.8% or 194 individuals in the labor force. Within the labor force, individuals with college / associate degree education have the highest percentage of unemployment, with 2.5% or 9 of them being unemployed.
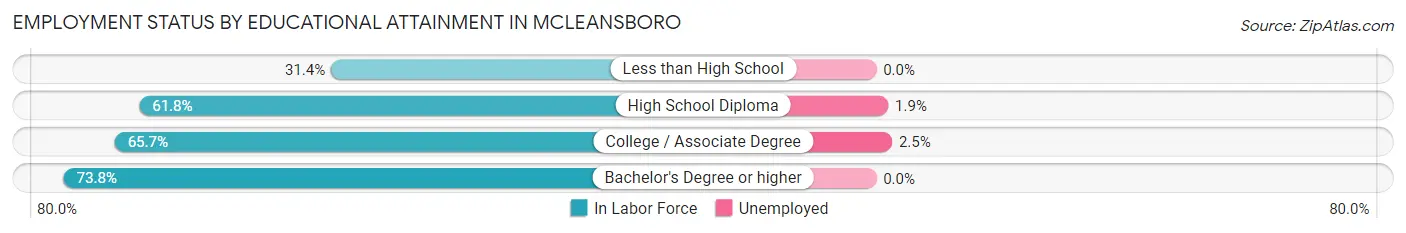
| Educational Attainment | In Labor Force | Unemployed |
| Less than High School | 50 (31.4%) | 0 (0.0%) |
| High School Diploma | 267 (61.8%) | 8 (1.9%) |
| College / Associate Degree | 356 (65.7%) | 14 (2.5%) |
| Bachelor's Degree or higher | 194 (73.8%) | 0 (0.0%) |
| Total | 867 (62.1%) | 22 (1.6%) |
Employment Occupations by Sex in McLeansboro
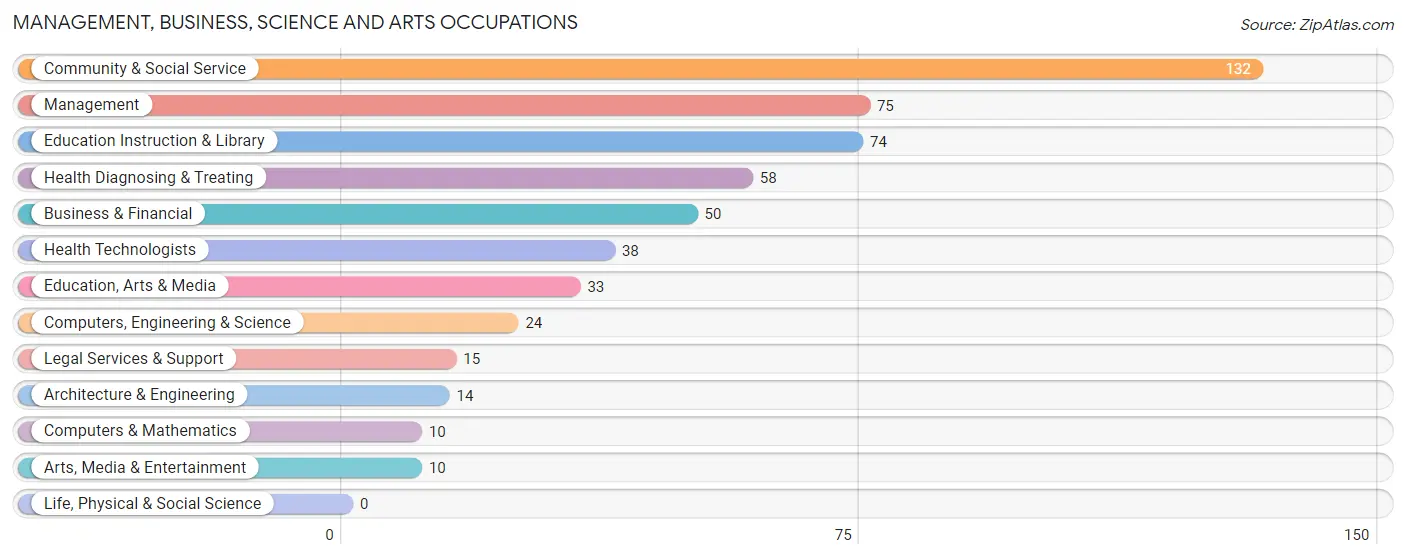
Management, Business, Science and Arts Occupations
The most common Management, Business, Science and Arts occupations in McLeansboro are Community & Social Service (132 | 11.5%), Management (75 | 6.5%), Education Instruction & Library (74 | 6.4%), Health Diagnosing & Treating (58 | 5.0%), and Business & Financial (50 | 4.3%).
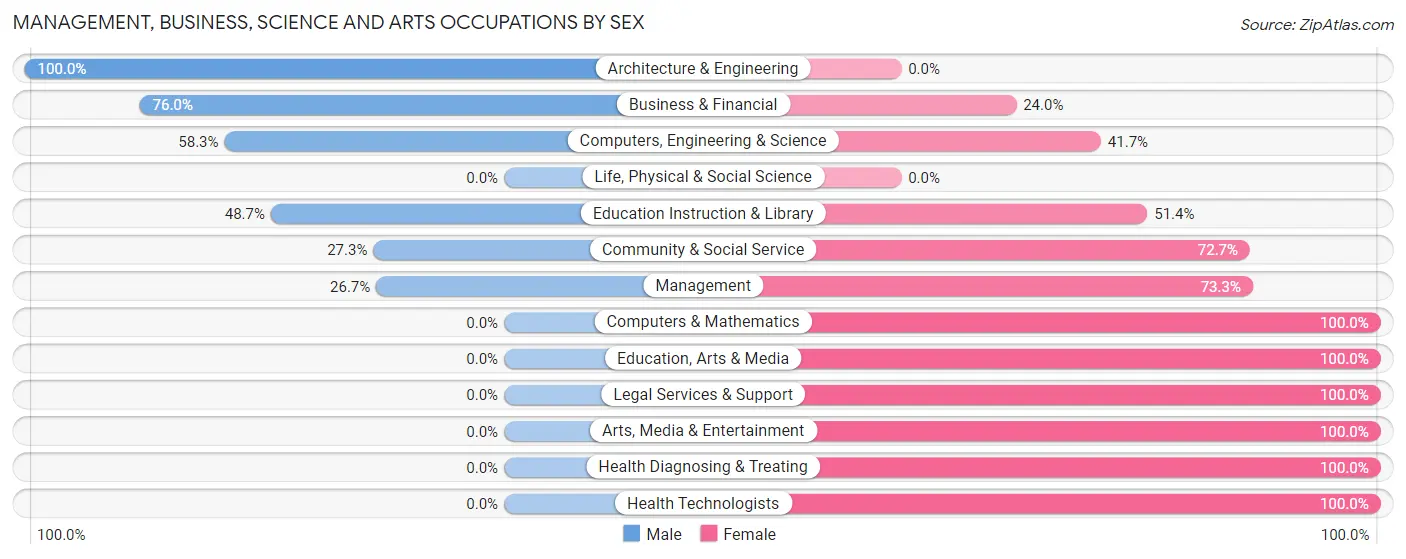
Management, Business, Science and Arts Occupations by Sex
Within the Management, Business, Science and Arts occupations in McLeansboro, the most male-oriented occupations are Architecture & Engineering (100.0%), Business & Financial (76.0%), and Computers, Engineering & Science (58.3%), while the most female-oriented occupations are Computers & Mathematics (100.0%), Education, Arts & Media (100.0%), and Legal Services & Support (100.0%).
| Occupation | Male | Female |
| Management | 20 (26.7%) | 55 (73.3%) |
| Business & Financial | 38 (76.0%) | 12 (24.0%) |
| Computers, Engineering & Science | 14 (58.3%) | 10 (41.7%) |
| Computers & Mathematics | 0 (0.0%) | 10 (100.0%) |
| Architecture & Engineering | 14 (100.0%) | 0 (0.0%) |
| Life, Physical & Social Science | 0 (0.0%) | 0 (0.0%) |
| Community & Social Service | 36 (27.3%) | 96 (72.7%) |
| Education, Arts & Media | 0 (0.0%) | 33 (100.0%) |
| Legal Services & Support | 0 (0.0%) | 15 (100.0%) |
| Education Instruction & Library | 36 (48.6%) | 38 (51.3%) |
| Arts, Media & Entertainment | 0 (0.0%) | 10 (100.0%) |
| Health Diagnosing & Treating | 0 (0.0%) | 58 (100.0%) |
| Health Technologists | 0 (0.0%) | 38 (100.0%) |
| Total (Category) | 108 (31.9%) | 231 (68.1%) |
| Total (Overall) | 657 (57.1%) | 493 (42.9%) |
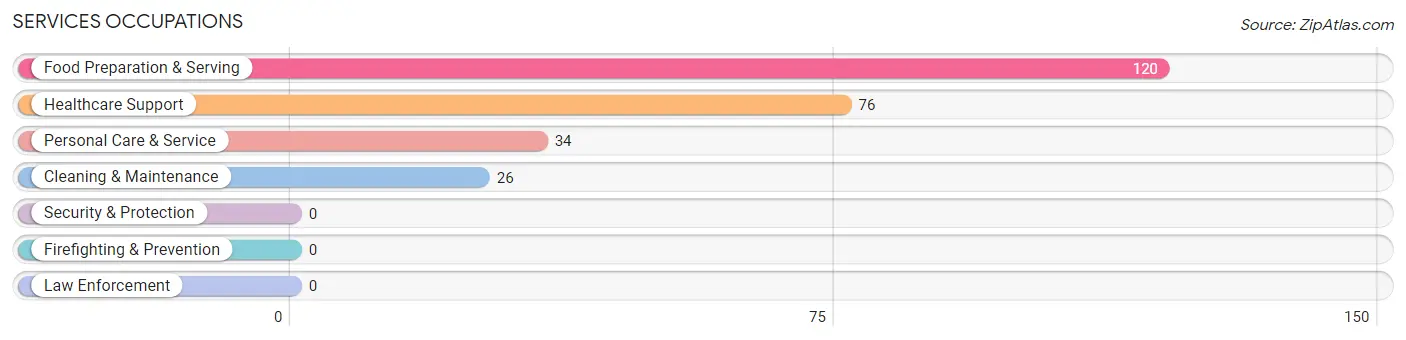
Services Occupations
The most common Services occupations in McLeansboro are Food Preparation & Serving (120 | 10.4%), Healthcare Support (76 | 6.6%), Personal Care & Service (34 | 3.0%), and Cleaning & Maintenance (26 | 2.3%).
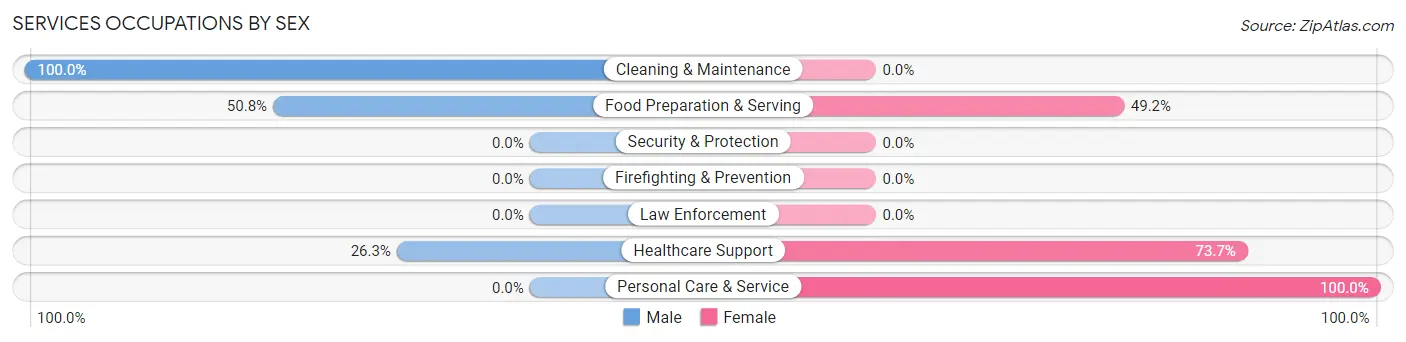
Services Occupations by Sex
Within the Services occupations in McLeansboro, the most male-oriented occupations are Cleaning & Maintenance (100.0%), Food Preparation & Serving (50.8%), and Healthcare Support (26.3%), while the most female-oriented occupations are Personal Care & Service (100.0%), Healthcare Support (73.7%), and Food Preparation & Serving (49.2%).
| Occupation | Male | Female |
| Healthcare Support | 20 (26.3%) | 56 (73.7%) |
| Security & Protection | 0 (0.0%) | 0 (0.0%) |
| Firefighting & Prevention | 0 (0.0%) | 0 (0.0%) |
| Law Enforcement | 0 (0.0%) | 0 (0.0%) |
| Food Preparation & Serving | 61 (50.8%) | 59 (49.2%) |
| Cleaning & Maintenance | 26 (100.0%) | 0 (0.0%) |
| Personal Care & Service | 0 (0.0%) | 34 (100.0%) |
| Total (Category) | 107 (41.8%) | 149 (58.2%) |
| Total (Overall) | 657 (57.1%) | 493 (42.9%) |
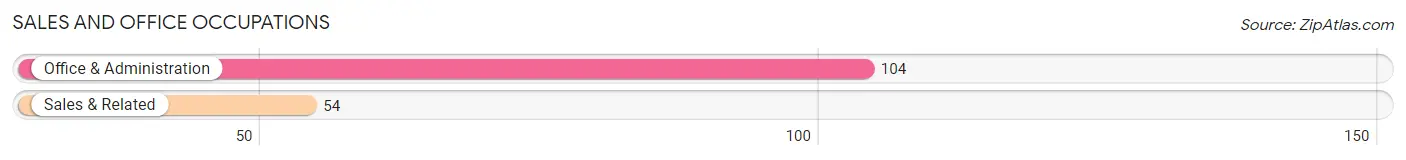
Sales and Office Occupations
The most common Sales and Office occupations in McLeansboro are Office & Administration (104 | 9.0%), and Sales & Related (54 | 4.7%).
Sales and Office Occupations by Sex
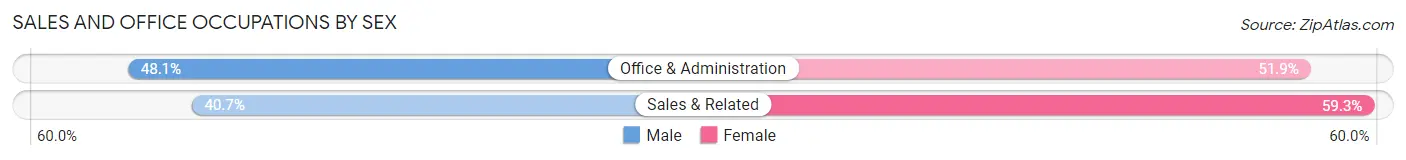
| Occupation | Male | Female |
| Sales & Related | 22 (40.7%) | 32 (59.3%) |
| Office & Administration | 50 (48.1%) | 54 (51.9%) |
| Total (Category) | 72 (45.6%) | 86 (54.4%) |
| Total (Overall) | 657 (57.1%) | 493 (42.9%) |
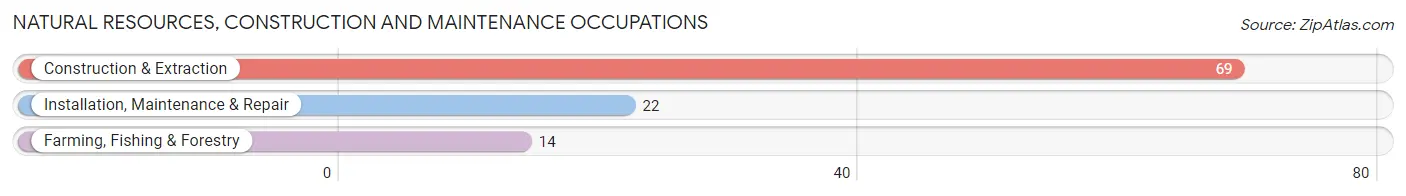
Natural Resources, Construction and Maintenance Occupations
The most common Natural Resources, Construction and Maintenance occupations in McLeansboro are Construction & Extraction (69 | 6.0%), Installation, Maintenance & Repair (22 | 1.9%), and Farming, Fishing & Forestry (14 | 1.2%).
Natural Resources, Construction and Maintenance Occupations by Sex
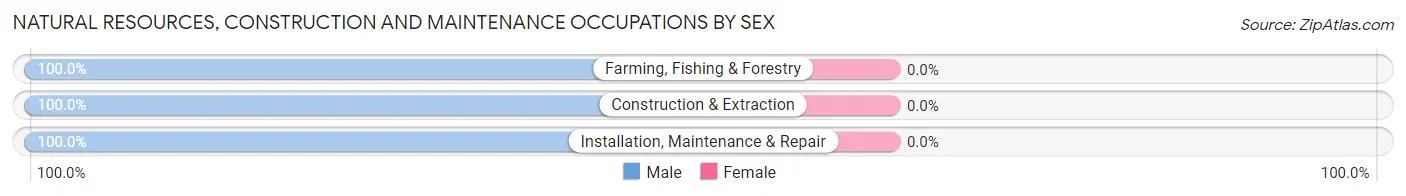
| Occupation | Male | Female |
| Farming, Fishing & Forestry | 14 (100.0%) | 0 (0.0%) |
| Construction & Extraction | 69 (100.0%) | 0 (0.0%) |
| Installation, Maintenance & Repair | 22 (100.0%) | 0 (0.0%) |
| Total (Category) | 105 (100.0%) | 0 (0.0%) |
| Total (Overall) | 657 (57.1%) | 493 (42.9%) |
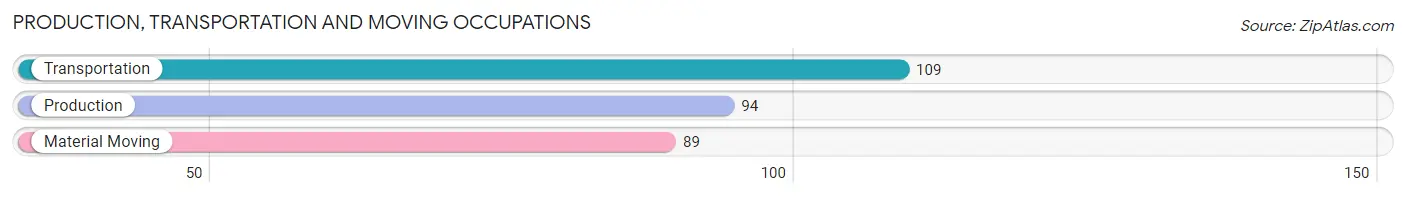
Production, Transportation and Moving Occupations
The most common Production, Transportation and Moving occupations in McLeansboro are Transportation (109 | 9.5%), Production (94 | 8.2%), and Material Moving (89 | 7.7%).
Production, Transportation and Moving Occupations by Sex
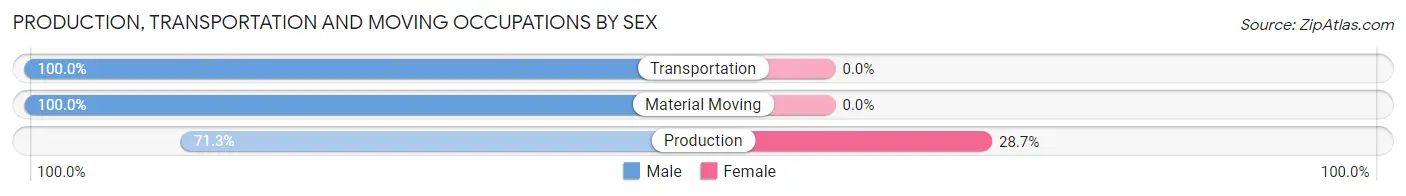
| Occupation | Male | Female |
| Production | 67 (71.3%) | 27 (28.7%) |
| Transportation | 109 (100.0%) | 0 (0.0%) |
| Material Moving | 89 (100.0%) | 0 (0.0%) |
| Total (Category) | 265 (90.7%) | 27 (9.2%) |
| Total (Overall) | 657 (57.1%) | 493 (42.9%) |
Employment Industries by Sex in McLeansboro
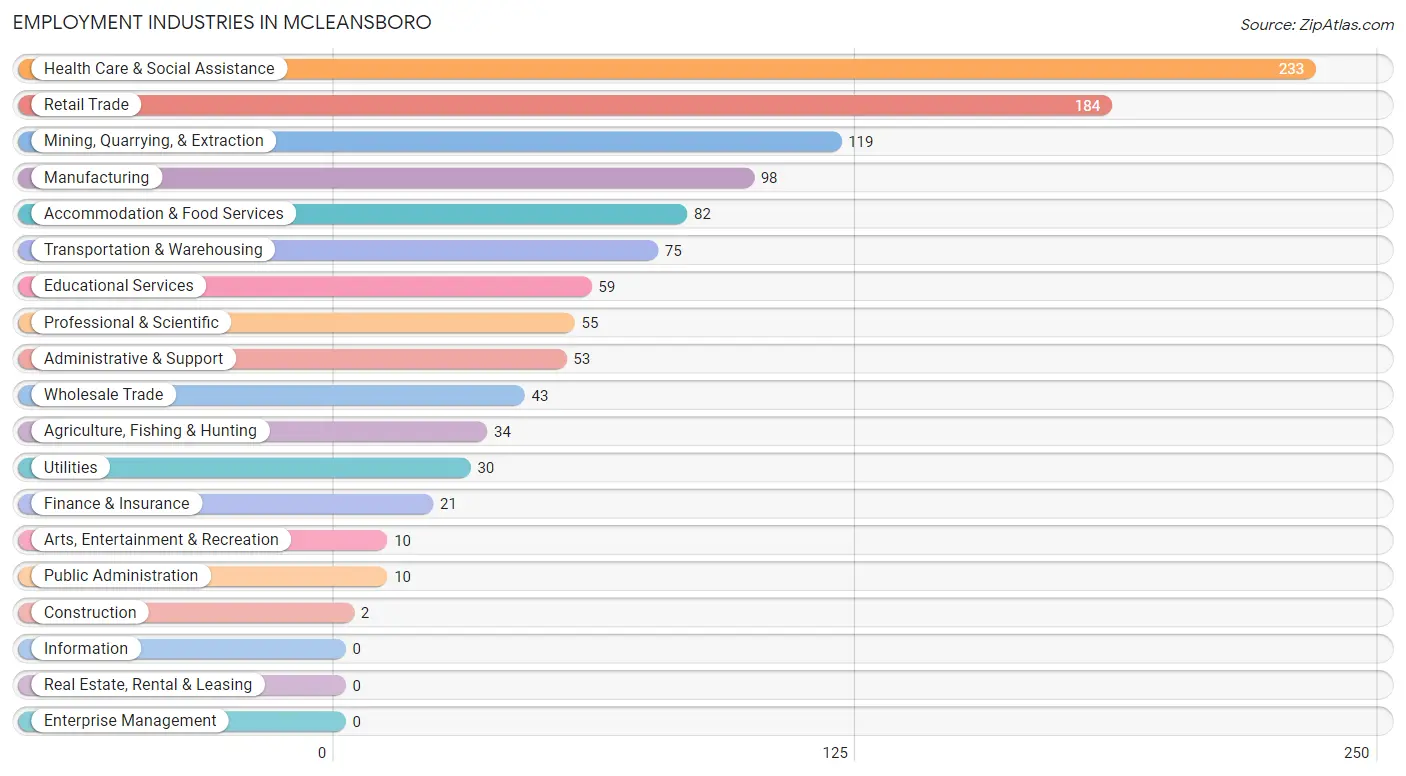
Employment Industries in McLeansboro
The major employment industries in McLeansboro include Health Care & Social Assistance (233 | 20.3%), Retail Trade (184 | 16.0%), Mining, Quarrying, & Extraction (119 | 10.3%), Manufacturing (98 | 8.5%), and Accommodation & Food Services (82 | 7.1%).
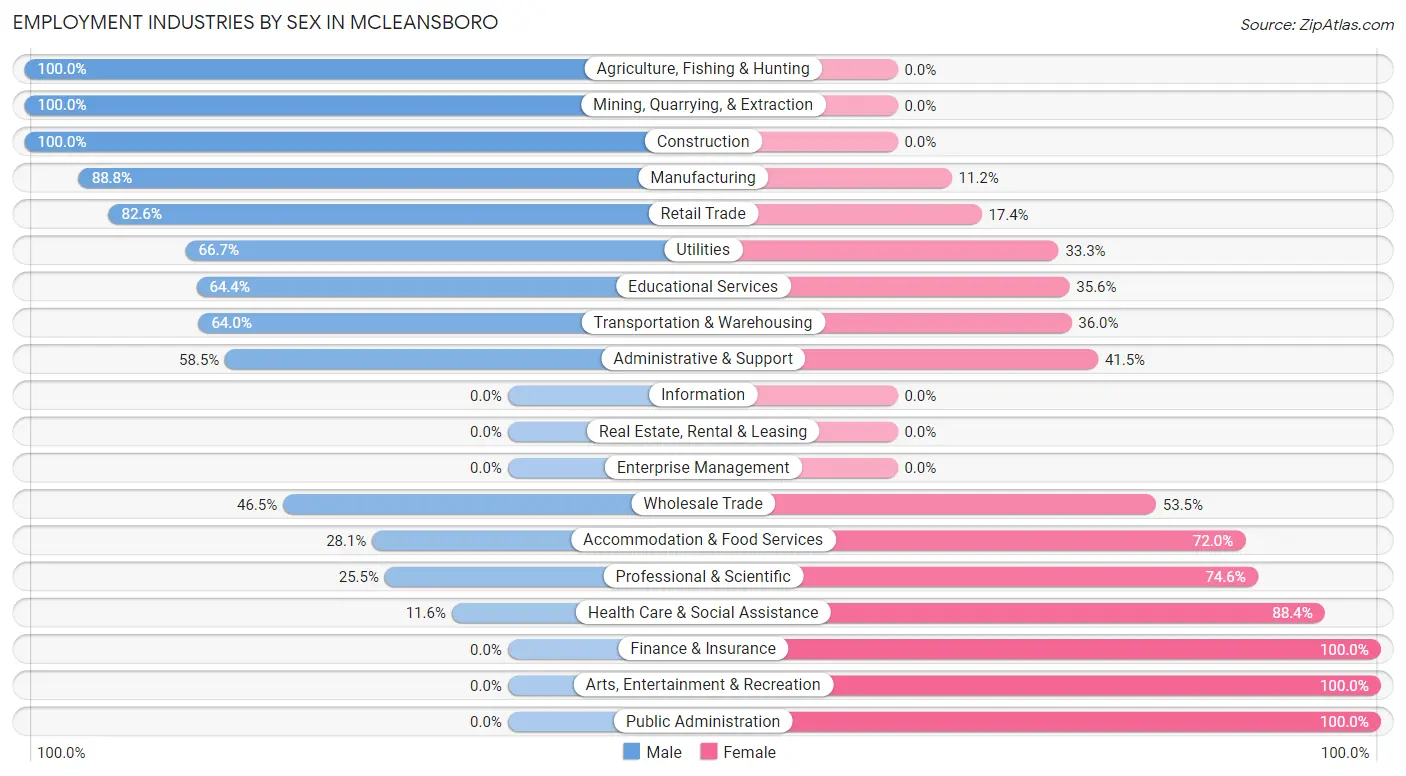
Employment Industries by Sex in McLeansboro
The McLeansboro industries that see more men than women are Agriculture, Fishing & Hunting (100.0%), Mining, Quarrying, & Extraction (100.0%), and Construction (100.0%), whereas the industries that tend to have a higher number of women are Finance & Insurance (100.0%), Arts, Entertainment & Recreation (100.0%), and Public Administration (100.0%).
| Industry | Male | Female |
| Agriculture, Fishing & Hunting | 34 (100.0%) | 0 (0.0%) |
| Mining, Quarrying, & Extraction | 119 (100.0%) | 0 (0.0%) |
| Construction | 2 (100.0%) | 0 (0.0%) |
| Manufacturing | 87 (88.8%) | 11 (11.2%) |
| Wholesale Trade | 20 (46.5%) | 23 (53.5%) |
| Retail Trade | 152 (82.6%) | 32 (17.4%) |
| Transportation & Warehousing | 48 (64.0%) | 27 (36.0%) |
| Utilities | 20 (66.7%) | 10 (33.3%) |
| Information | 0 (0.0%) | 0 (0.0%) |
| Finance & Insurance | 0 (0.0%) | 21 (100.0%) |
| Real Estate, Rental & Leasing | 0 (0.0%) | 0 (0.0%) |
| Professional & Scientific | 14 (25.5%) | 41 (74.6%) |
| Enterprise Management | 0 (0.0%) | 0 (0.0%) |
| Administrative & Support | 31 (58.5%) | 22 (41.5%) |
| Educational Services | 38 (64.4%) | 21 (35.6%) |
| Health Care & Social Assistance | 27 (11.6%) | 206 (88.4%) |
| Arts, Entertainment & Recreation | 0 (0.0%) | 10 (100.0%) |
| Accommodation & Food Services | 23 (28.1%) | 59 (72.0%) |
| Public Administration | 0 (0.0%) | 10 (100.0%) |
| Total | 657 (57.1%) | 493 (42.9%) |
Education in McLeansboro
School Enrollment in McLeansboro
The most common levels of schooling among the 750 students in McLeansboro are high school (240 | 32.0%), middle school (189 | 25.2%), and college / undergraduate (149 | 19.9%).
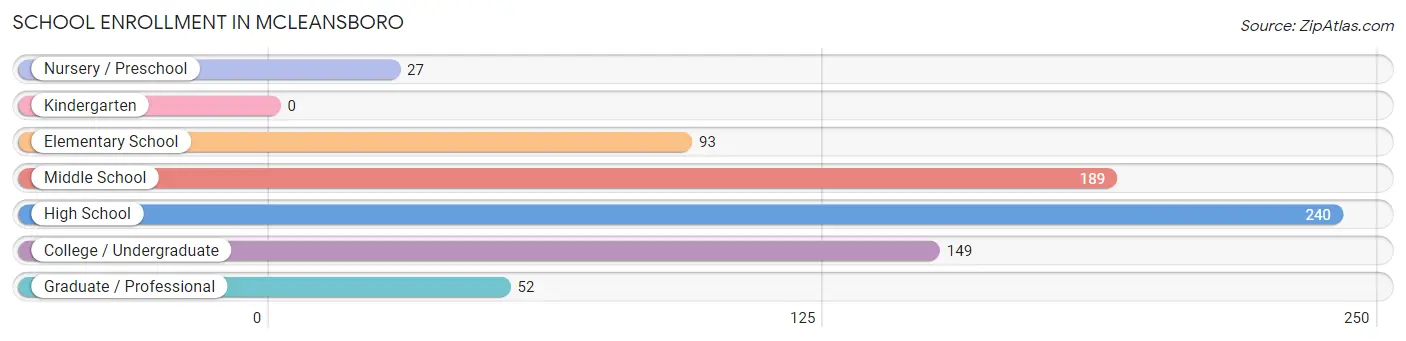
| School Level | # Students | % Students |
| Nursery / Preschool | 27 | 3.6% |
| Kindergarten | 0 | 0.0% |
| Elementary School | 93 | 12.4% |
| Middle School | 189 | 25.2% |
| High School | 240 | 32.0% |
| College / Undergraduate | 149 | 19.9% |
| Graduate / Professional | 52 | 6.9% |
| Total | 750 | 100.0% |
School Enrollment by Age by Funding Source in McLeansboro
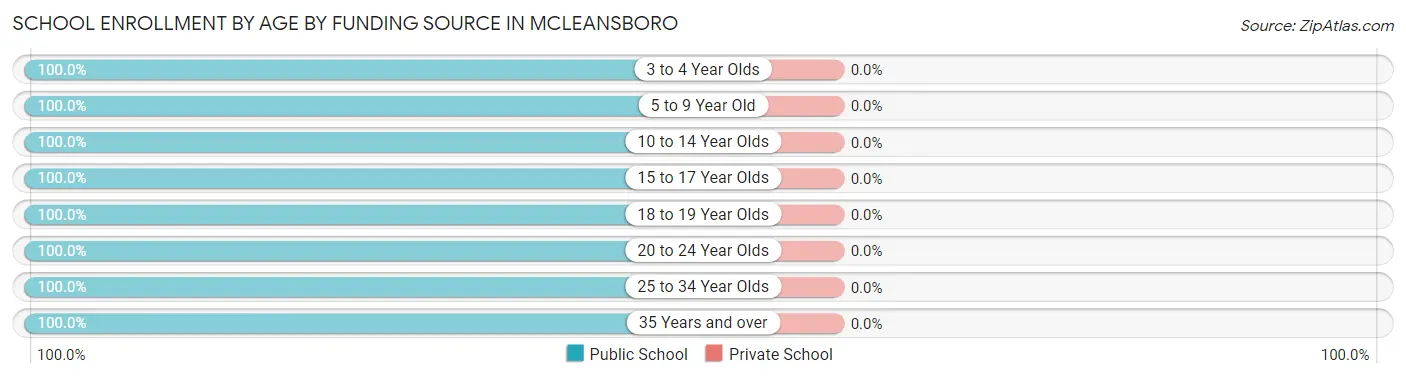
| Age Bracket | Public School | Private School |
| 3 to 4 Year Olds | 2 (100.0%) | 0 (0.0%) |
| 5 to 9 Year Old | 103 (100.0%) | 0 (0.0%) |
| 10 to 14 Year Olds | 243 (100.0%) | 0 (0.0%) |
| 15 to 17 Year Olds | 154 (100.0%) | 0 (0.0%) |
| 18 to 19 Year Olds | 47 (100.0%) | 0 (0.0%) |
| 20 to 24 Year Olds | 72 (100.0%) | 0 (0.0%) |
| 25 to 34 Year Olds | 42 (100.0%) | 0 (0.0%) |
| 35 Years and over | 87 (100.0%) | 0 (0.0%) |
| Total | 750 (100.0%) | 0 (0.0%) |
Educational Attainment by Field of Study in McLeansboro
Education (84 | 23.9%), science & technology (68 | 19.3%), arts & humanities (60 | 17.1%), business (58 | 16.5%), and multidisciplinary studies (32 | 9.1%) are the most common fields of study among 352 individuals in McLeansboro who have obtained a bachelor's degree or higher.
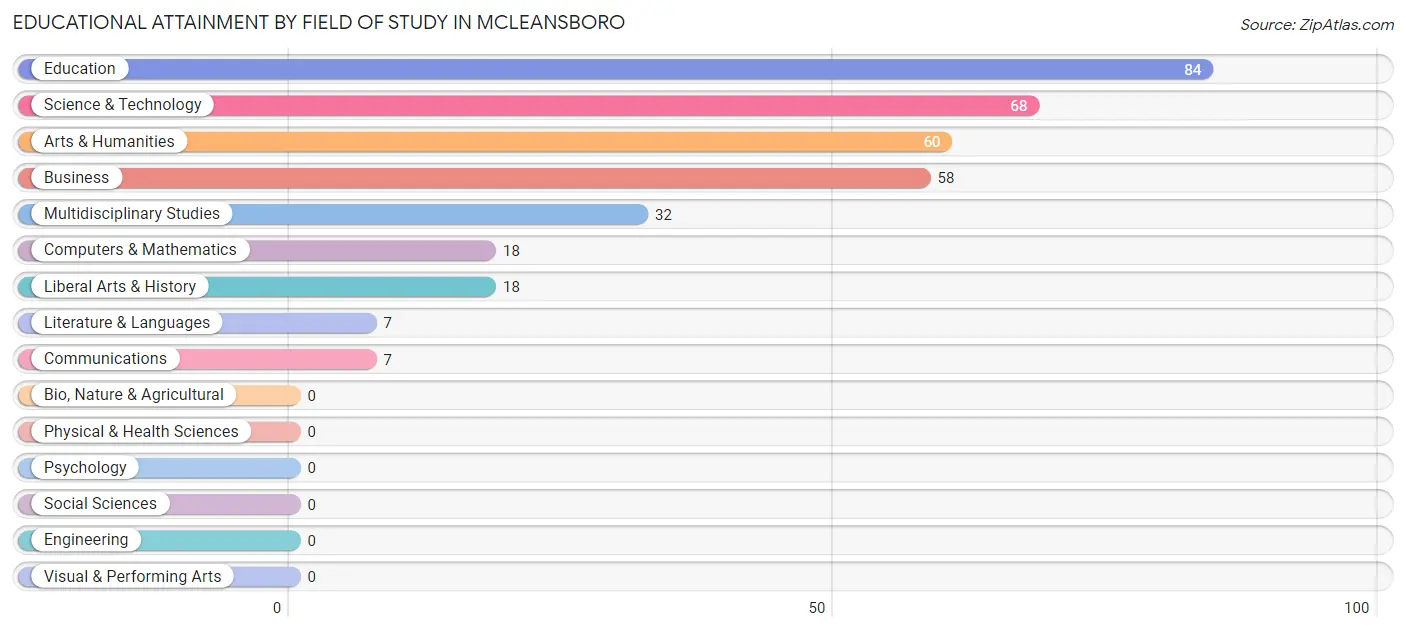
| Field of Study | # Graduates | % Graduates |
| Computers & Mathematics | 18 | 5.1% |
| Bio, Nature & Agricultural | 0 | 0.0% |
| Physical & Health Sciences | 0 | 0.0% |
| Psychology | 0 | 0.0% |
| Social Sciences | 0 | 0.0% |
| Engineering | 0 | 0.0% |
| Multidisciplinary Studies | 32 | 9.1% |
| Science & Technology | 68 | 19.3% |
| Business | 58 | 16.5% |
| Education | 84 | 23.9% |
| Literature & Languages | 7 | 2.0% |
| Liberal Arts & History | 18 | 5.1% |
| Visual & Performing Arts | 0 | 0.0% |
| Communications | 7 | 2.0% |
| Arts & Humanities | 60 | 17.1% |
| Total | 352 | 100.0% |
Transportation & Commute in McLeansboro
Vehicle Availability by Sex in McLeansboro
The most prevalent vehicle ownership categories in McLeansboro are males with 2 vehicles (256, accounting for 44.0%) and females with 2 vehicles (277, making up 51.9%).
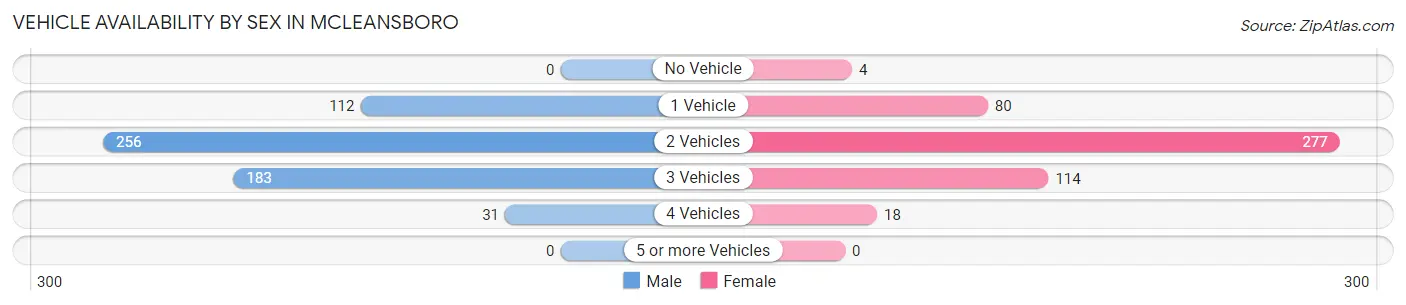
| Vehicles Available | Male | Female |
| No Vehicle | 0 (0.0%) | 4 (0.8%) |
| 1 Vehicle | 112 (19.2%) | 80 (16.2%) |
| 2 Vehicles | 256 (44.0%) | 277 (56.2%) |
| 3 Vehicles | 183 (31.4%) | 114 (23.1%) |
| 4 Vehicles | 31 (5.3%) | 18 (3.6%) |
| 5 or more Vehicles | 0 (0.0%) | 0 (0.0%) |
| Total | 582 (100.0%) | 493 (100.0%) |
Commute Time in McLeansboro
The most frequently occuring commute durations in McLeansboro are 5 to 9 minutes (189 commuters, 18.1%), 30 to 34 minutes (186 commuters, 17.8%), and less than 5 minutes (141 commuters, 13.5%).
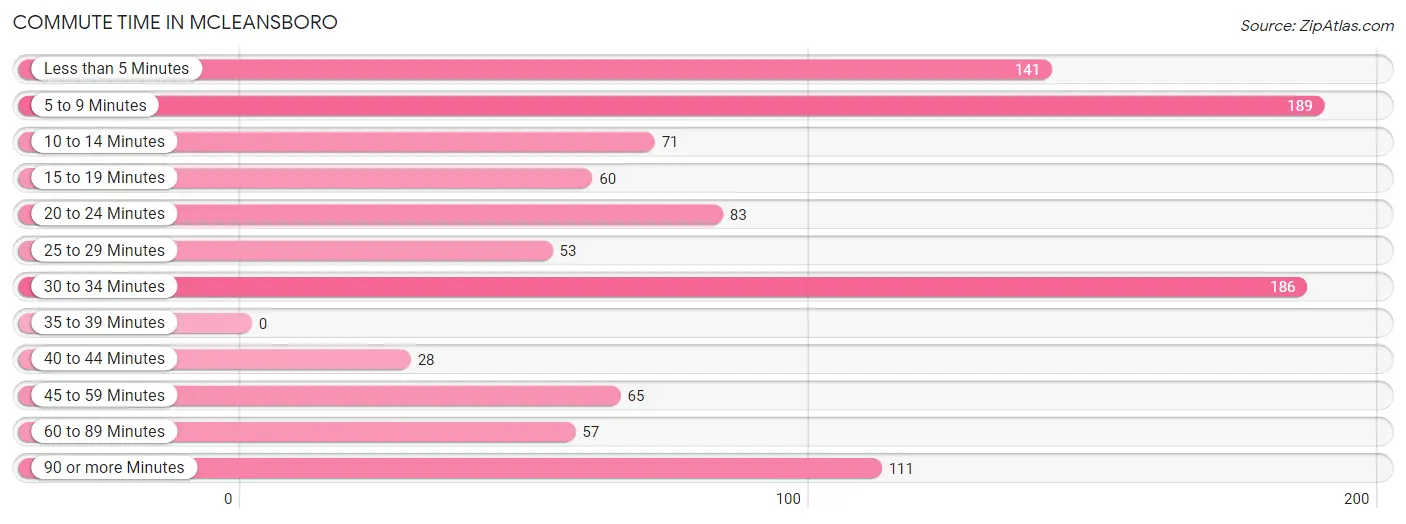
| Commute Time | # Commuters | % Commuters |
| Less than 5 Minutes | 141 | 13.5% |
| 5 to 9 Minutes | 189 | 18.1% |
| 10 to 14 Minutes | 71 | 6.8% |
| 15 to 19 Minutes | 60 | 5.8% |
| 20 to 24 Minutes | 83 | 8.0% |
| 25 to 29 Minutes | 53 | 5.1% |
| 30 to 34 Minutes | 186 | 17.8% |
| 35 to 39 Minutes | 0 | 0.0% |
| 40 to 44 Minutes | 28 | 2.7% |
| 45 to 59 Minutes | 65 | 6.2% |
| 60 to 89 Minutes | 57 | 5.5% |
| 90 or more Minutes | 111 | 10.6% |
Commute Time by Sex in McLeansboro
The most common commute times in McLeansboro are less than 5 minutes (108 commuters, 18.9%) for males and 5 to 9 minutes (137 commuters, 29.1%) for females.
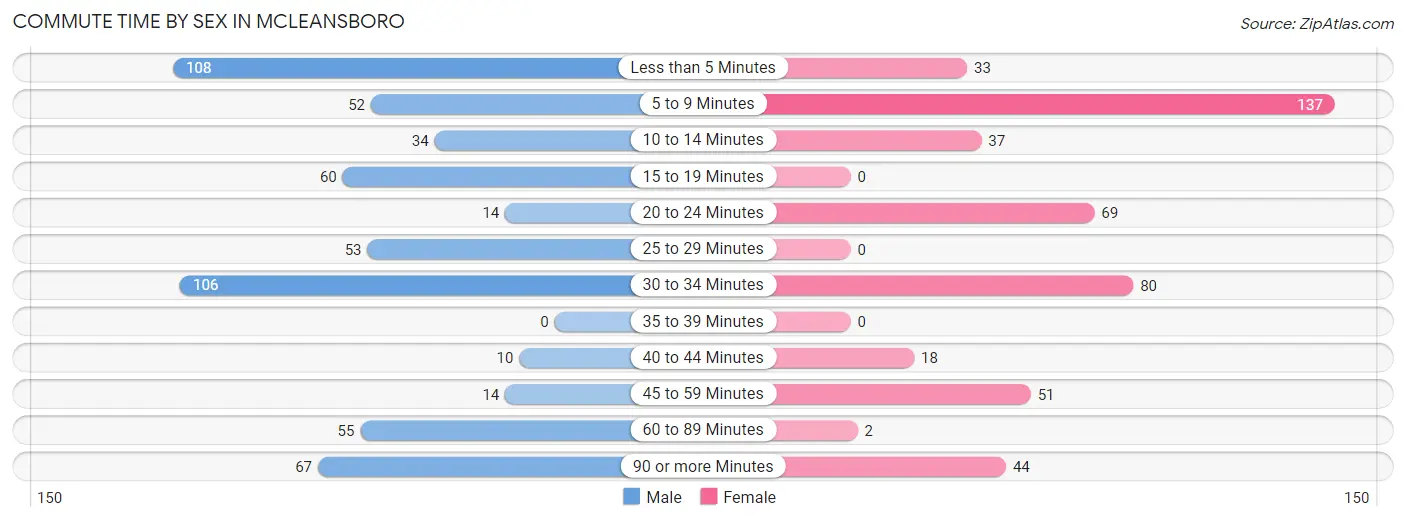
| Commute Time | Male | Female |
| Less than 5 Minutes | 108 (18.9%) | 33 (7.0%) |
| 5 to 9 Minutes | 52 (9.1%) | 137 (29.1%) |
| 10 to 14 Minutes | 34 (5.9%) | 37 (7.9%) |
| 15 to 19 Minutes | 60 (10.5%) | 0 (0.0%) |
| 20 to 24 Minutes | 14 (2.4%) | 69 (14.6%) |
| 25 to 29 Minutes | 53 (9.2%) | 0 (0.0%) |
| 30 to 34 Minutes | 106 (18.5%) | 80 (17.0%) |
| 35 to 39 Minutes | 0 (0.0%) | 0 (0.0%) |
| 40 to 44 Minutes | 10 (1.8%) | 18 (3.8%) |
| 45 to 59 Minutes | 14 (2.4%) | 51 (10.8%) |
| 60 to 89 Minutes | 55 (9.6%) | 2 (0.4%) |
| 90 or more Minutes | 67 (11.7%) | 44 (9.3%) |
Time of Departure to Work by Sex in McLeansboro
The most frequent times of departure to work in McLeansboro are 7:00 AM to 7:29 AM (123, 21.5%) for males and 12:00 AM to 4:59 AM (83, 17.6%) for females.
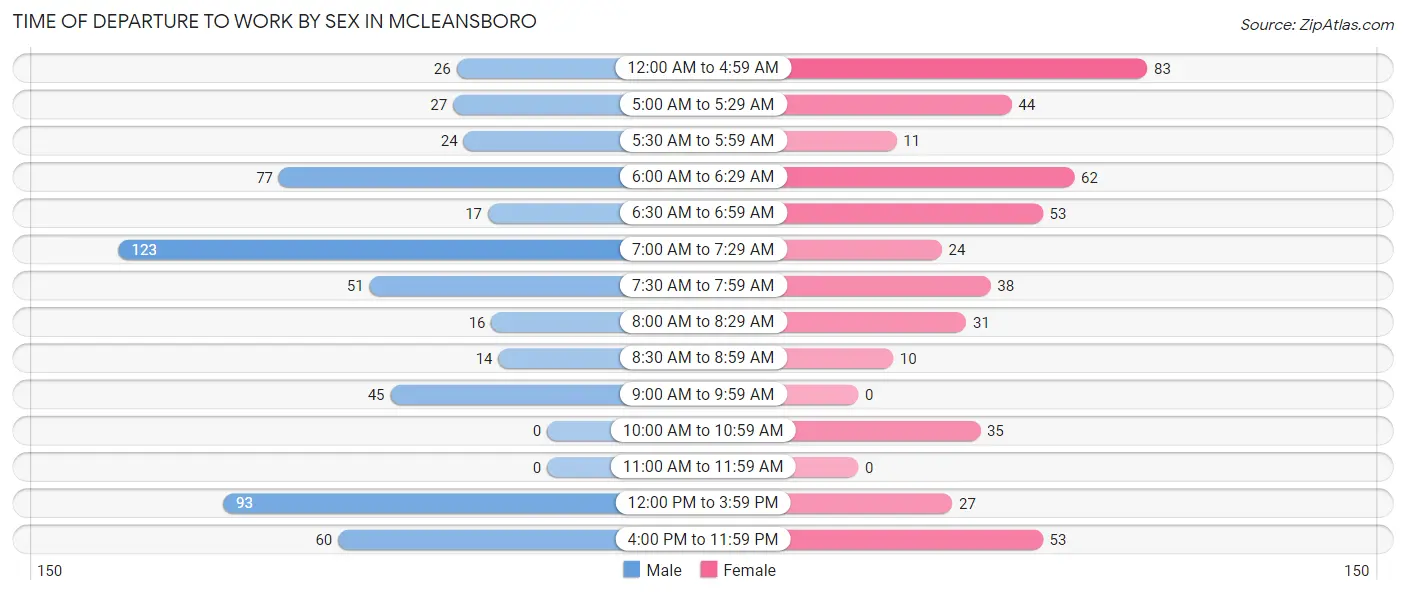
| Time of Departure | Male | Female |
| 12:00 AM to 4:59 AM | 26 (4.5%) | 83 (17.6%) |
| 5:00 AM to 5:29 AM | 27 (4.7%) | 44 (9.3%) |
| 5:30 AM to 5:59 AM | 24 (4.2%) | 11 (2.3%) |
| 6:00 AM to 6:29 AM | 77 (13.4%) | 62 (13.2%) |
| 6:30 AM to 6:59 AM | 17 (3.0%) | 53 (11.3%) |
| 7:00 AM to 7:29 AM | 123 (21.5%) | 24 (5.1%) |
| 7:30 AM to 7:59 AM | 51 (8.9%) | 38 (8.1%) |
| 8:00 AM to 8:29 AM | 16 (2.8%) | 31 (6.6%) |
| 8:30 AM to 8:59 AM | 14 (2.4%) | 10 (2.1%) |
| 9:00 AM to 9:59 AM | 45 (7.9%) | 0 (0.0%) |
| 10:00 AM to 10:59 AM | 0 (0.0%) | 35 (7.4%) |
| 11:00 AM to 11:59 AM | 0 (0.0%) | 0 (0.0%) |
| 12:00 PM to 3:59 PM | 93 (16.2%) | 27 (5.7%) |
| 4:00 PM to 11:59 PM | 60 (10.5%) | 53 (11.3%) |
| Total | 573 (100.0%) | 471 (100.0%) |
Housing Occupancy in McLeansboro
Occupancy by Ownership in McLeansboro
Of the total 1,189 dwellings in McLeansboro, owner-occupied units account for 749 (63.0%), while renter-occupied units make up 440 (37.0%).
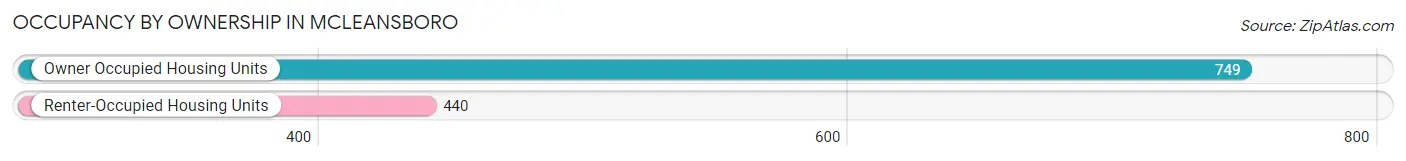
| Occupancy | # Housing Units | % Housing Units |
| Owner Occupied Housing Units | 749 | 63.0% |
| Renter-Occupied Housing Units | 440 | 37.0% |
| Total Occupied Housing Units | 1,189 | 100.0% |
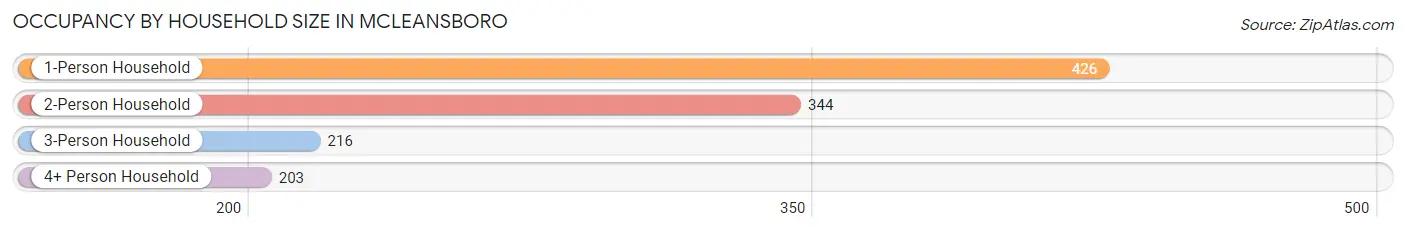
Occupancy by Household Size in McLeansboro
| Household Size | # Housing Units | % Housing Units |
| 1-Person Household | 426 | 35.8% |
| 2-Person Household | 344 | 28.9% |
| 3-Person Household | 216 | 18.2% |
| 4+ Person Household | 203 | 17.1% |
| Total Housing Units | 1,189 | 100.0% |
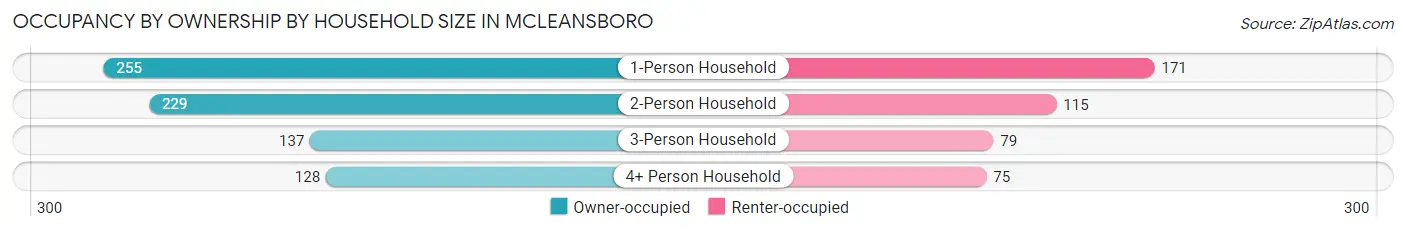
Occupancy by Ownership by Household Size in McLeansboro
| Household Size | Owner-occupied | Renter-occupied |
| 1-Person Household | 255 (59.9%) | 171 (40.1%) |
| 2-Person Household | 229 (66.6%) | 115 (33.4%) |
| 3-Person Household | 137 (63.4%) | 79 (36.6%) |
| 4+ Person Household | 128 (63.0%) | 75 (36.9%) |
| Total Housing Units | 749 (63.0%) | 440 (37.0%) |
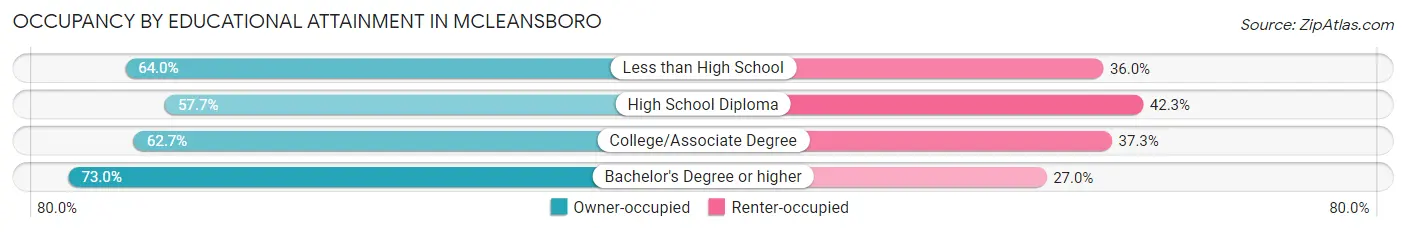
Occupancy by Educational Attainment in McLeansboro
| Household Size | Owner-occupied | Renter-occupied |
| Less than High School | 89 (64.0%) | 50 (36.0%) |
| High School Diploma | 191 (57.7%) | 140 (42.3%) |
| College/Associate Degree | 339 (62.7%) | 202 (37.3%) |
| Bachelor's Degree or higher | 130 (73.0%) | 48 (27.0%) |
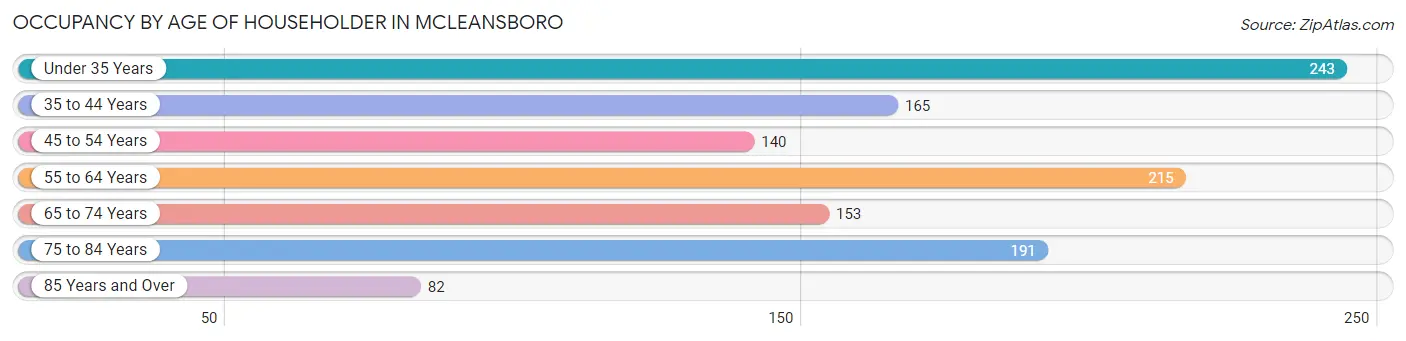
Occupancy by Age of Householder in McLeansboro
| Age Bracket | # Households | % Households |
| Under 35 Years | 243 | 20.4% |
| 35 to 44 Years | 165 | 13.9% |
| 45 to 54 Years | 140 | 11.8% |
| 55 to 64 Years | 215 | 18.1% |
| 65 to 74 Years | 153 | 12.9% |
| 75 to 84 Years | 191 | 16.1% |
| 85 Years and Over | 82 | 6.9% |
| Total | 1,189 | 100.0% |
Housing Finances in McLeansboro
Median Income by Occupancy in McLeansboro
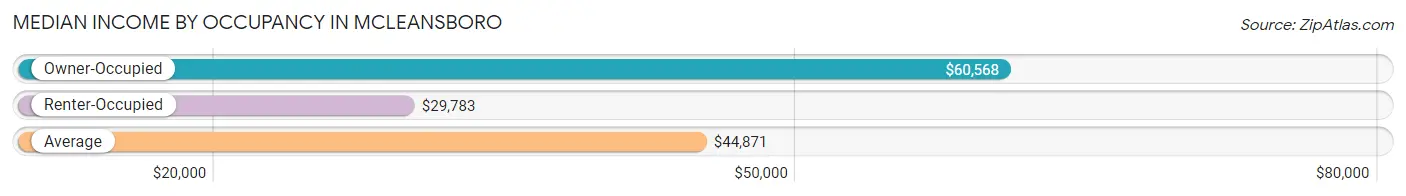
| Occupancy Type | # Households | Median Income |
| Owner-Occupied | 749 (63.0%) | $60,568 |
| Renter-Occupied | 440 (37.0%) | $29,783 |
| Average | 1,189 (100.0%) | $44,871 |
Occupancy by Householder Income Bracket in McLeansboro
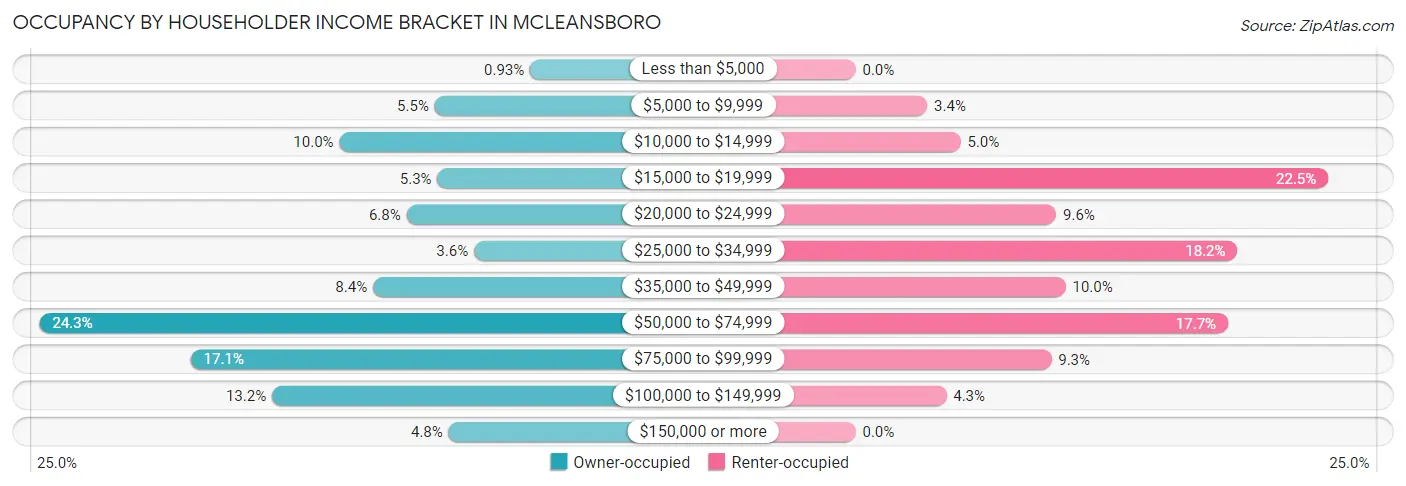
| Income Bracket | Owner-occupied | Renter-occupied |
| Less than $5,000 | 7 (0.9%) | 0 (0.0%) |
| $5,000 to $9,999 | 41 (5.5%) | 15 (3.4%) |
| $10,000 to $14,999 | 75 (10.0%) | 22 (5.0%) |
| $15,000 to $19,999 | 40 (5.3%) | 99 (22.5%) |
| $20,000 to $24,999 | 51 (6.8%) | 42 (9.6%) |
| $25,000 to $34,999 | 27 (3.6%) | 80 (18.2%) |
| $35,000 to $49,999 | 63 (8.4%) | 44 (10.0%) |
| $50,000 to $74,999 | 182 (24.3%) | 78 (17.7%) |
| $75,000 to $99,999 | 128 (17.1%) | 41 (9.3%) |
| $100,000 to $149,999 | 99 (13.2%) | 19 (4.3%) |
| $150,000 or more | 36 (4.8%) | 0 (0.0%) |
| Total | 749 (100.0%) | 440 (100.0%) |
Monthly Housing Cost Tiers in McLeansboro
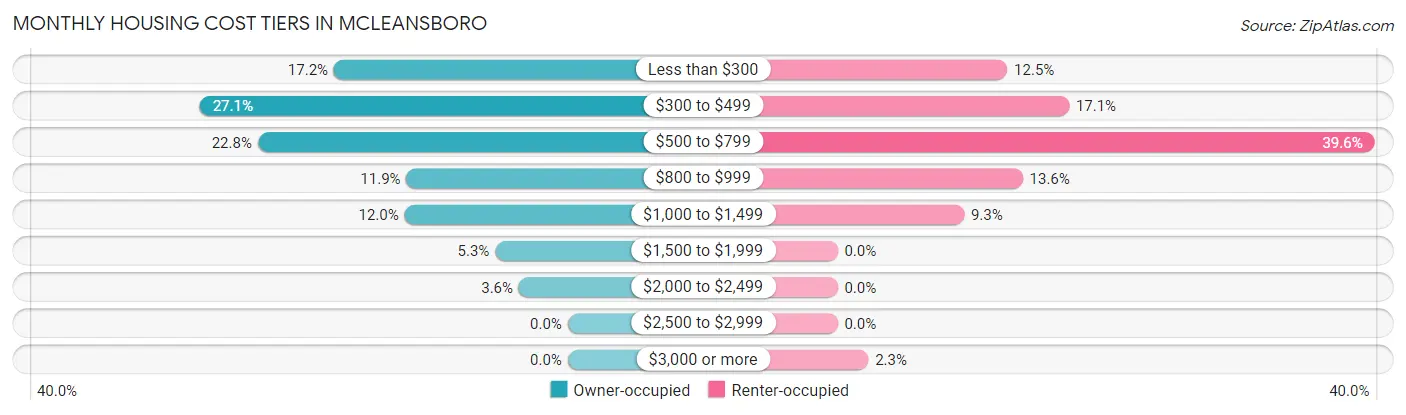
| Monthly Cost | Owner-occupied | Renter-occupied |
| Less than $300 | 129 (17.2%) | 55 (12.5%) |
| $300 to $499 | 203 (27.1%) | 75 (17.1%) |
| $500 to $799 | 171 (22.8%) | 174 (39.6%) |
| $800 to $999 | 89 (11.9%) | 60 (13.6%) |
| $1,000 to $1,499 | 90 (12.0%) | 41 (9.3%) |
| $1,500 to $1,999 | 40 (5.3%) | 0 (0.0%) |
| $2,000 to $2,499 | 27 (3.6%) | 0 (0.0%) |
| $2,500 to $2,999 | 0 (0.0%) | 0 (0.0%) |
| $3,000 or more | 0 (0.0%) | 10 (2.3%) |
| Total | 749 (100.0%) | 440 (100.0%) |
Physical Housing Characteristics in McLeansboro
Housing Structures in McLeansboro
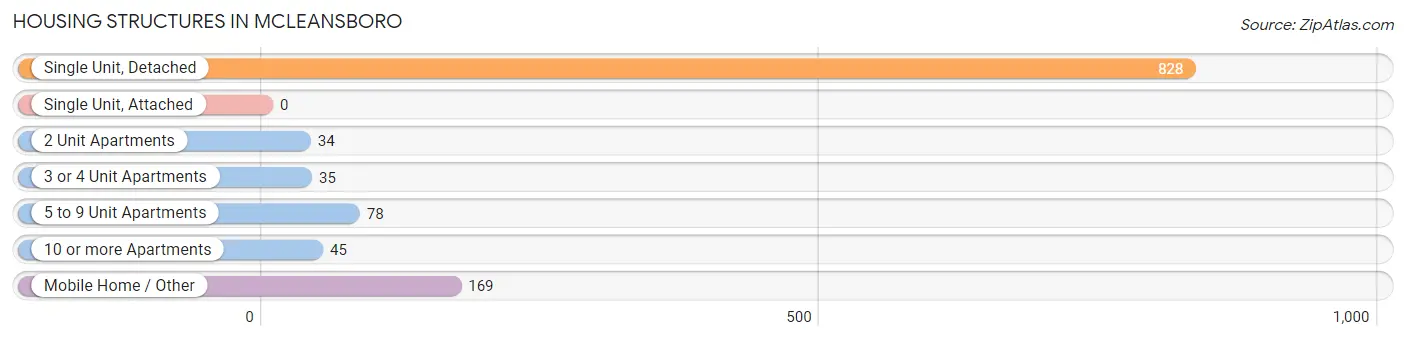
| Structure Type | # Housing Units | % Housing Units |
| Single Unit, Detached | 828 | 69.6% |
| Single Unit, Attached | 0 | 0.0% |
| 2 Unit Apartments | 34 | 2.9% |
| 3 or 4 Unit Apartments | 35 | 2.9% |
| 5 to 9 Unit Apartments | 78 | 6.6% |
| 10 or more Apartments | 45 | 3.8% |
| Mobile Home / Other | 169 | 14.2% |
| Total | 1,189 | 100.0% |
Housing Structures by Occupancy in McLeansboro
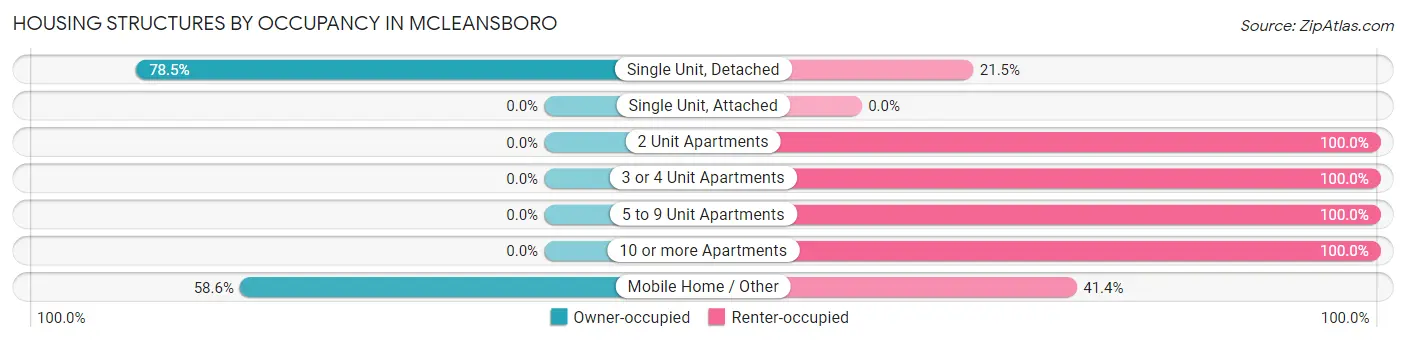
| Structure Type | Owner-occupied | Renter-occupied |
| Single Unit, Detached | 650 (78.5%) | 178 (21.5%) |
| Single Unit, Attached | 0 (0.0%) | 0 (0.0%) |
| 2 Unit Apartments | 0 (0.0%) | 34 (100.0%) |
| 3 or 4 Unit Apartments | 0 (0.0%) | 35 (100.0%) |
| 5 to 9 Unit Apartments | 0 (0.0%) | 78 (100.0%) |
| 10 or more Apartments | 0 (0.0%) | 45 (100.0%) |
| Mobile Home / Other | 99 (58.6%) | 70 (41.4%) |
| Total | 749 (63.0%) | 440 (37.0%) |
Housing Structures by Number of Rooms in McLeansboro
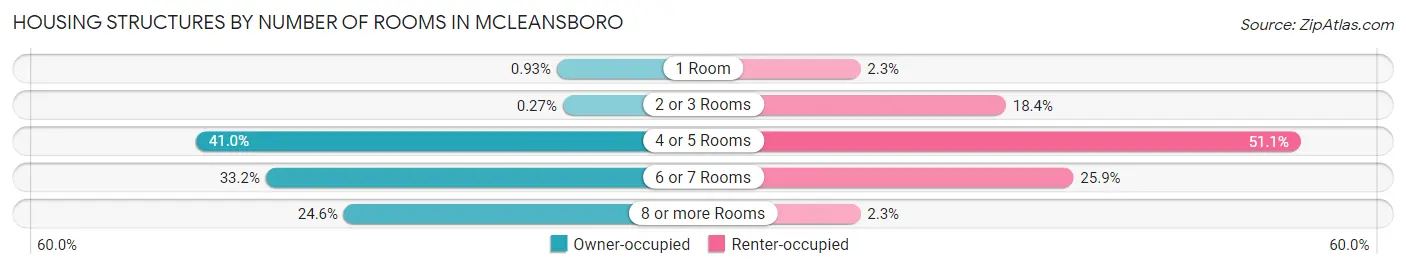
| Number of Rooms | Owner-occupied | Renter-occupied |
| 1 Room | 7 (0.9%) | 10 (2.3%) |
| 2 or 3 Rooms | 2 (0.3%) | 81 (18.4%) |
| 4 or 5 Rooms | 307 (41.0%) | 225 (51.1%) |
| 6 or 7 Rooms | 249 (33.2%) | 114 (25.9%) |
| 8 or more Rooms | 184 (24.6%) | 10 (2.3%) |
| Total | 749 (100.0%) | 440 (100.0%) |
Housing Structure by Heating Type in McLeansboro
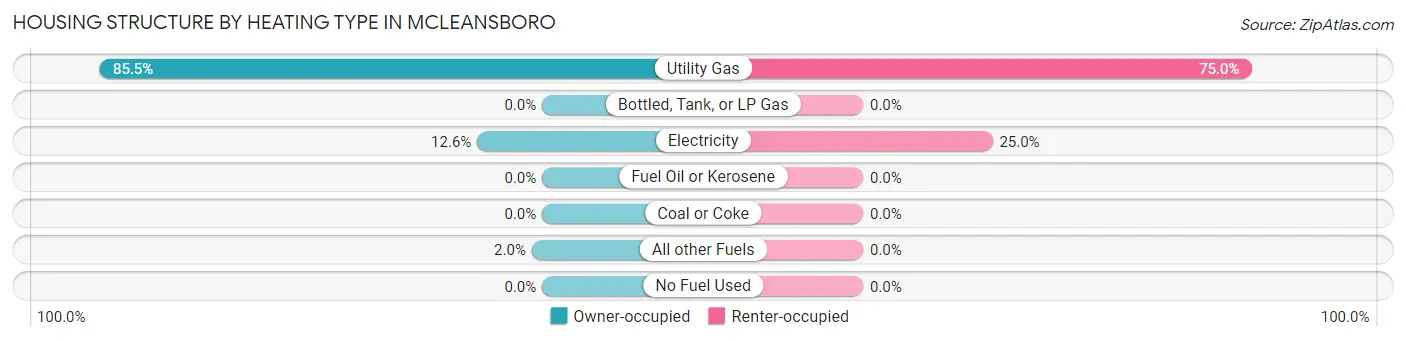
| Heating Type | Owner-occupied | Renter-occupied |
| Utility Gas | 640 (85.5%) | 330 (75.0%) |
| Bottled, Tank, or LP Gas | 0 (0.0%) | 0 (0.0%) |
| Electricity | 94 (12.6%) | 110 (25.0%) |
| Fuel Oil or Kerosene | 0 (0.0%) | 0 (0.0%) |
| Coal or Coke | 0 (0.0%) | 0 (0.0%) |
| All other Fuels | 15 (2.0%) | 0 (0.0%) |
| No Fuel Used | 0 (0.0%) | 0 (0.0%) |
| Total | 749 (100.0%) | 440 (100.0%) |
Household Vehicle Usage in McLeansboro
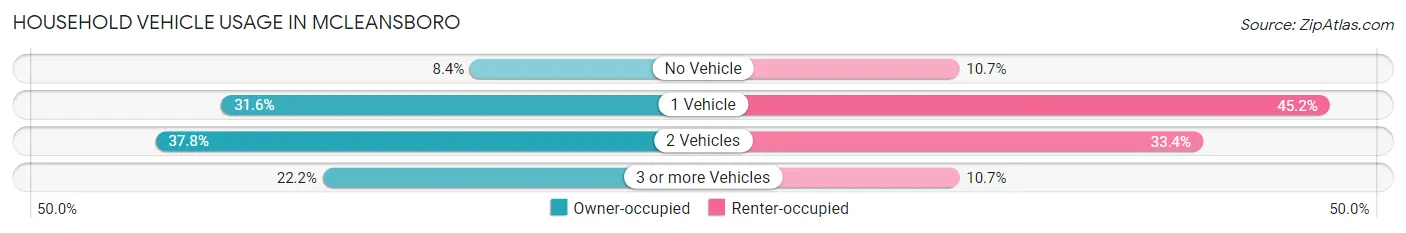
| Vehicles per Household | Owner-occupied | Renter-occupied |
| No Vehicle | 63 (8.4%) | 47 (10.7%) |
| 1 Vehicle | 237 (31.6%) | 199 (45.2%) |
| 2 Vehicles | 283 (37.8%) | 147 (33.4%) |
| 3 or more Vehicles | 166 (22.2%) | 47 (10.7%) |
| Total | 749 (100.0%) | 440 (100.0%) |
Real Estate & Mortgages in McLeansboro
Real Estate and Mortgage Overview in McLeansboro
| Characteristic | Without Mortgage | With Mortgage |
| Housing Units | 465 | 284 |
| Median Property Value | $82,800 | $66,900 |
| Median Household Income | $36,563 | $15 |
| Monthly Housing Costs | $393 | $0 |
| Real Estate Taxes | $890 | $2 |
Property Value by Mortgage Status in McLeansboro
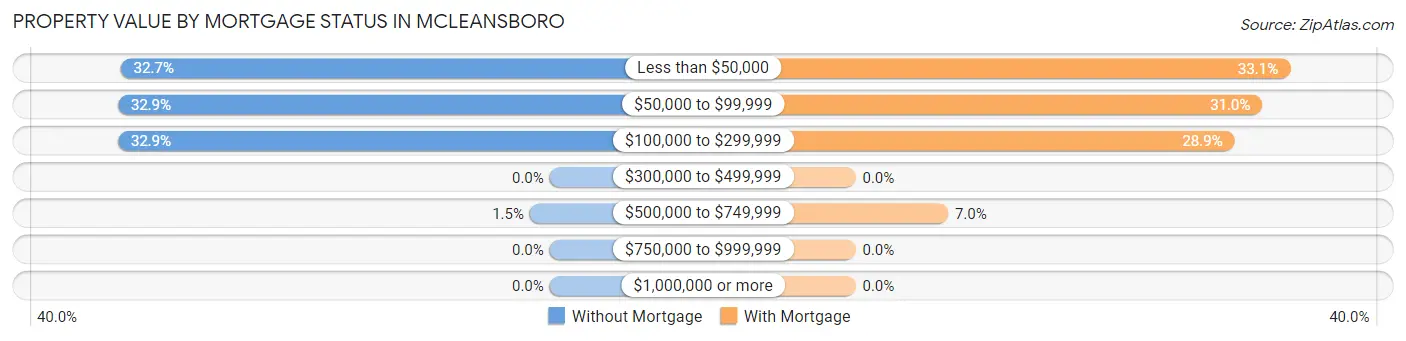
| Property Value | Without Mortgage | With Mortgage |
| Less than $50,000 | 152 (32.7%) | 94 (33.1%) |
| $50,000 to $99,999 | 153 (32.9%) | 88 (31.0%) |
| $100,000 to $299,999 | 153 (32.9%) | 82 (28.9%) |
| $300,000 to $499,999 | 0 (0.0%) | 0 (0.0%) |
| $500,000 to $749,999 | 7 (1.5%) | 20 (7.0%) |
| $750,000 to $999,999 | 0 (0.0%) | 0 (0.0%) |
| $1,000,000 or more | 0 (0.0%) | 0 (0.0%) |
| Total | 465 (100.0%) | 284 (100.0%) |
Household Income by Mortgage Status in McLeansboro
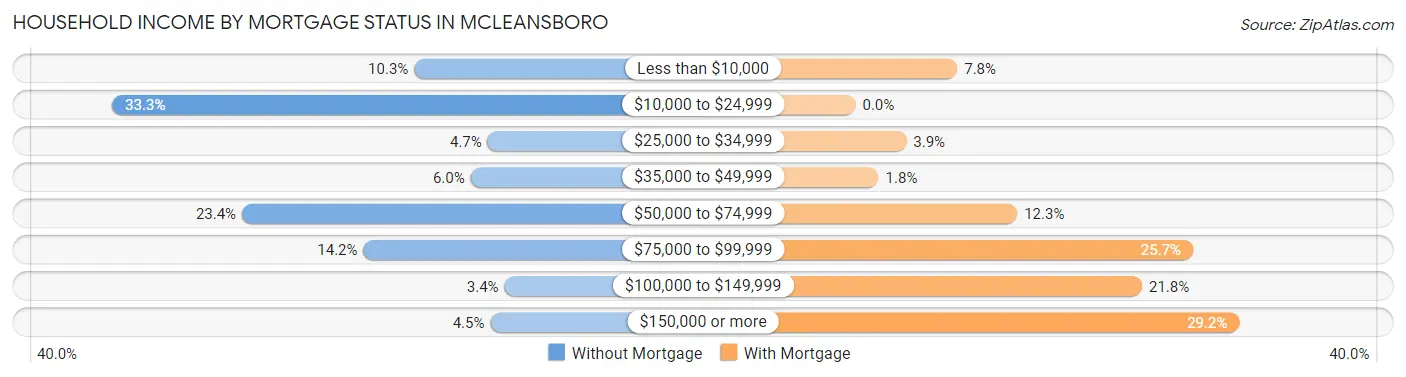
| Household Income | Without Mortgage | With Mortgage |
| Less than $10,000 | 48 (10.3%) | 22 (7.7%) |
| $10,000 to $24,999 | 155 (33.3%) | 0 (0.0%) |
| $25,000 to $34,999 | 22 (4.7%) | 11 (3.9%) |
| $35,000 to $49,999 | 28 (6.0%) | 5 (1.8%) |
| $50,000 to $74,999 | 109 (23.4%) | 35 (12.3%) |
| $75,000 to $99,999 | 66 (14.2%) | 73 (25.7%) |
| $100,000 to $149,999 | 16 (3.4%) | 62 (21.8%) |
| $150,000 or more | 21 (4.5%) | 83 (29.2%) |
| Total | 465 (100.0%) | 284 (100.0%) |
Property Value to Household Income Ratio in McLeansboro
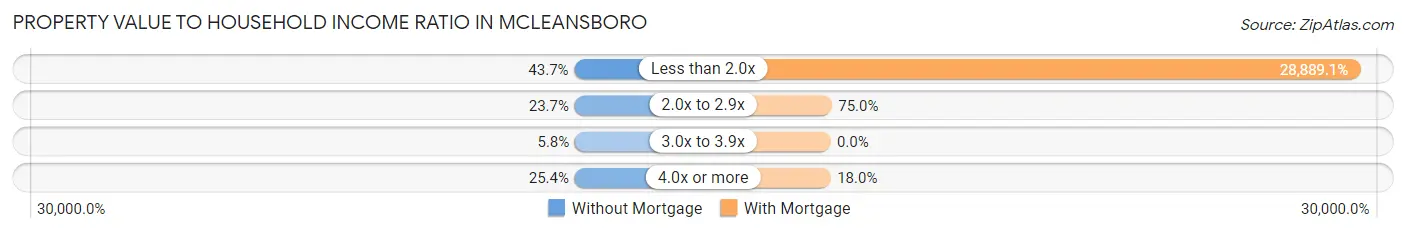
| Value-to-Income Ratio | Without Mortgage | With Mortgage |
| Less than 2.0x | 203 (43.7%) | 82,045 (28,889.1%) |
| 2.0x to 2.9x | 110 (23.7%) | 213 (75.0%) |
| 3.0x to 3.9x | 27 (5.8%) | 0 (0.0%) |
| 4.0x or more | 118 (25.4%) | 51 (18.0%) |
| Total | 465 (100.0%) | 284 (100.0%) |
Real Estate Taxes by Mortgage Status in McLeansboro
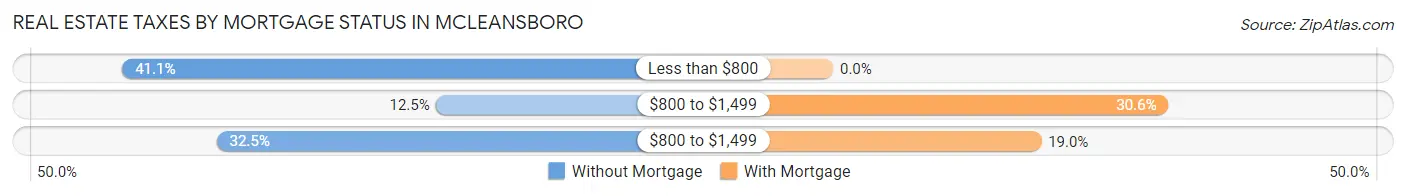
| Property Taxes | Without Mortgage | With Mortgage |
| Less than $800 | 191 (41.1%) | 0 (0.0%) |
| $800 to $1,499 | 58 (12.5%) | 87 (30.6%) |
| $800 to $1,499 | 151 (32.5%) | 54 (19.0%) |
| Total | 465 (100.0%) | 284 (100.0%) |
Health & Disability in McLeansboro
Health Insurance Coverage by Age in McLeansboro
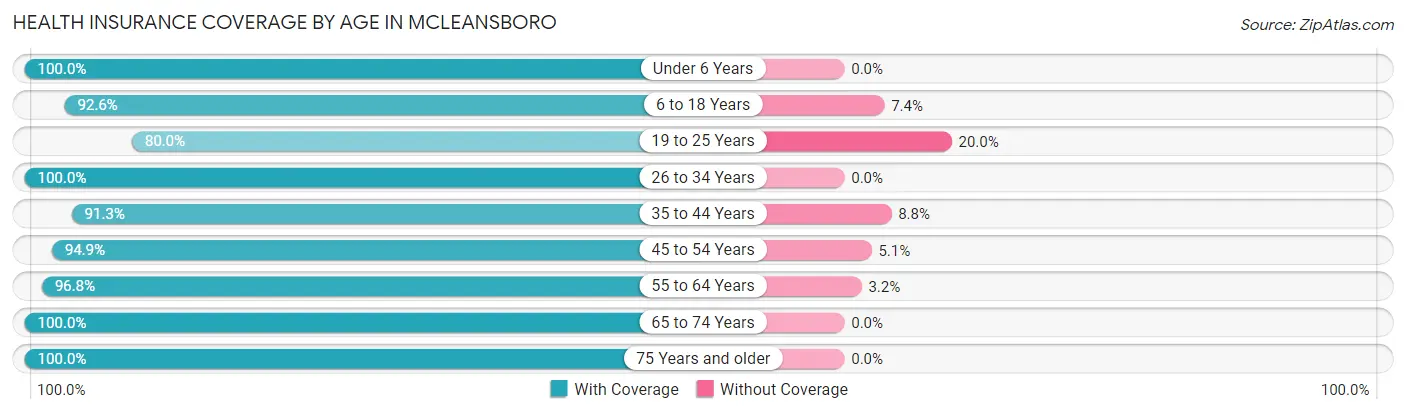
| Age Bracket | With Coverage | Without Coverage |
| Under 6 Years | 149 (100.0%) | 0 (0.0%) |
| 6 to 18 Years | 485 (92.6%) | 39 (7.4%) |
| 19 to 25 Years | 228 (80.0%) | 57 (20.0%) |
| 26 to 34 Years | 329 (100.0%) | 0 (0.0%) |
| 35 to 44 Years | 313 (91.2%) | 30 (8.7%) |
| 45 to 54 Years | 262 (94.9%) | 14 (5.1%) |
| 55 to 64 Years | 333 (96.8%) | 11 (3.2%) |
| 65 to 74 Years | 199 (100.0%) | 0 (0.0%) |
| 75 Years and older | 279 (100.0%) | 0 (0.0%) |
| Total | 2,577 (94.5%) | 151 (5.5%) |
Health Insurance Coverage by Citizenship Status in McLeansboro
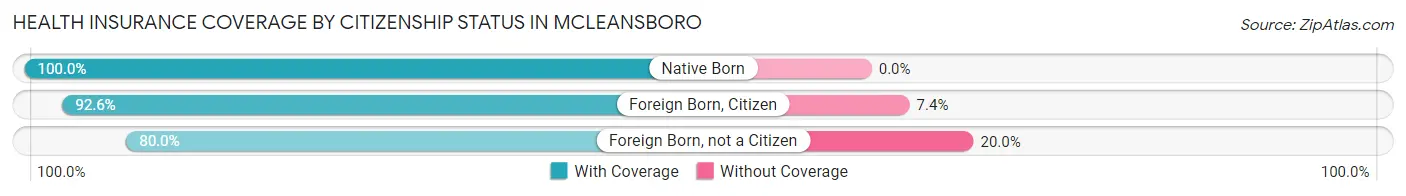
| Citizenship Status | With Coverage | Without Coverage |
| Native Born | 149 (100.0%) | 0 (0.0%) |
| Foreign Born, Citizen | 485 (92.6%) | 39 (7.4%) |
| Foreign Born, not a Citizen | 228 (80.0%) | 57 (20.0%) |
Health Insurance Coverage by Household Income in McLeansboro
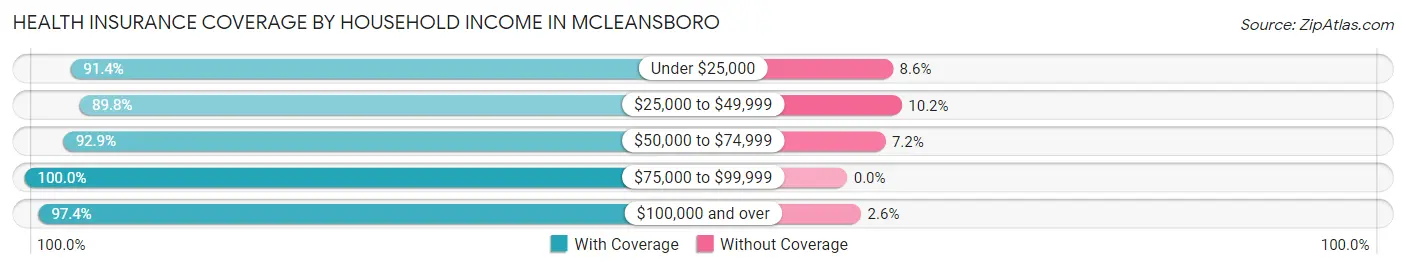
| Household Income | With Coverage | Without Coverage |
| Under $25,000 | 500 (91.4%) | 47 (8.6%) |
| $25,000 to $49,999 | 360 (89.8%) | 41 (10.2%) |
| $50,000 to $74,999 | 636 (92.8%) | 49 (7.1%) |
| $75,000 to $99,999 | 529 (100.0%) | 0 (0.0%) |
| $100,000 and over | 524 (97.4%) | 14 (2.6%) |
Public vs Private Health Insurance Coverage by Age in McLeansboro
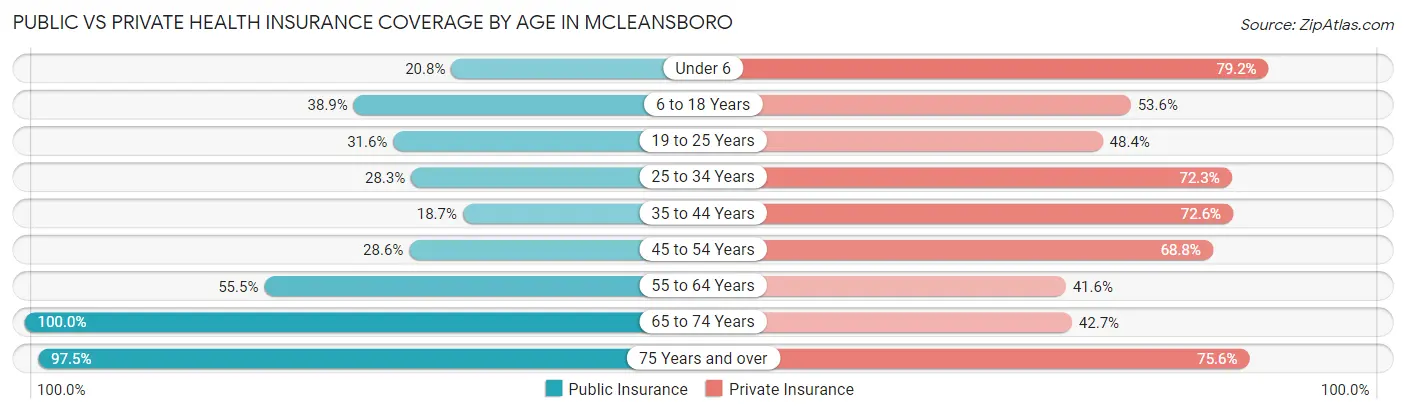
| Age Bracket | Public Insurance | Private Insurance |
| Under 6 | 31 (20.8%) | 118 (79.2%) |
| 6 to 18 Years | 204 (38.9%) | 281 (53.6%) |
| 19 to 25 Years | 90 (31.6%) | 138 (48.4%) |
| 25 to 34 Years | 93 (28.3%) | 238 (72.3%) |
| 35 to 44 Years | 64 (18.7%) | 249 (72.6%) |
| 45 to 54 Years | 79 (28.6%) | 190 (68.8%) |
| 55 to 64 Years | 191 (55.5%) | 143 (41.6%) |
| 65 to 74 Years | 199 (100.0%) | 85 (42.7%) |
| 75 Years and over | 272 (97.5%) | 211 (75.6%) |
| Total | 1,223 (44.8%) | 1,653 (60.6%) |
Disability Status by Sex by Age in McLeansboro
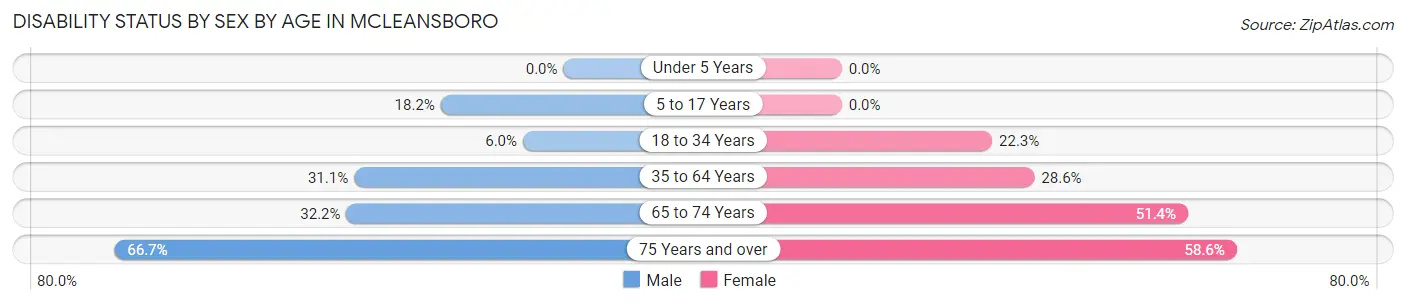
| Age Bracket | Male | Female |
| Under 5 Years | 0 (0.0%) | 0 (0.0%) |
| 5 to 17 Years | 45 (18.2%) | 0 (0.0%) |
| 18 to 34 Years | 19 (6.0%) | 77 (22.3%) |
| 35 to 64 Years | 157 (31.1%) | 131 (28.6%) |
| 65 to 74 Years | 29 (32.2%) | 56 (51.4%) |
| 75 Years and over | 20 (66.7%) | 146 (58.6%) |
Disability Class by Sex by Age in McLeansboro
Disability Class: Hearing Difficulty
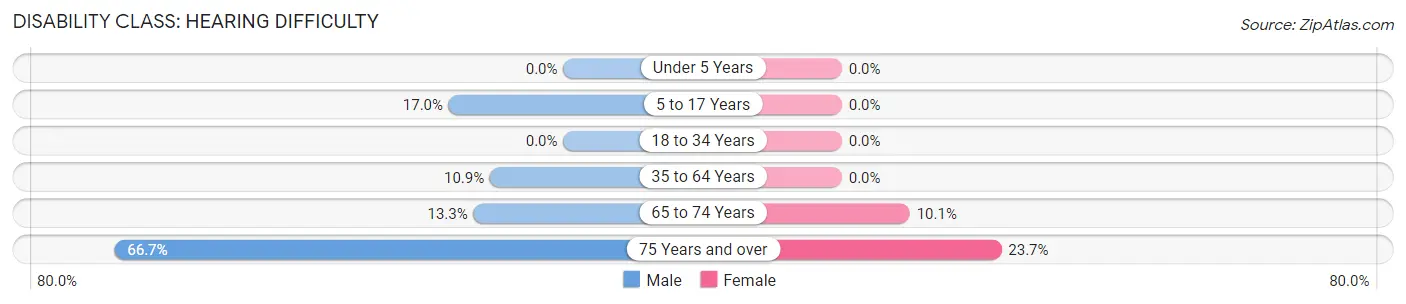
| Age Bracket | Male | Female |
| Under 5 Years | 0 (0.0%) | 0 (0.0%) |
| 5 to 17 Years | 42 (17.0%) | 0 (0.0%) |
| 18 to 34 Years | 0 (0.0%) | 0 (0.0%) |
| 35 to 64 Years | 55 (10.9%) | 0 (0.0%) |
| 65 to 74 Years | 12 (13.3%) | 11 (10.1%) |
| 75 Years and over | 20 (66.7%) | 59 (23.7%) |
Disability Class: Vision Difficulty
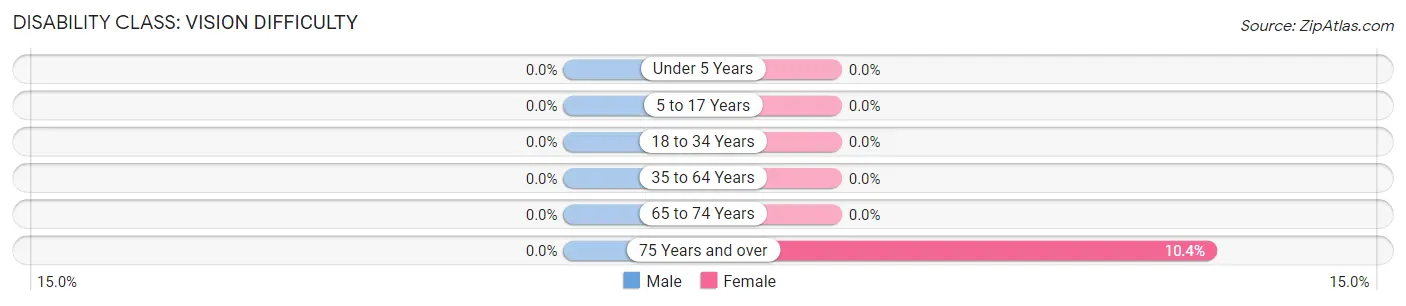
| Age Bracket | Male | Female |
| Under 5 Years | 0 (0.0%) | 0 (0.0%) |
| 5 to 17 Years | 0 (0.0%) | 0 (0.0%) |
| 18 to 34 Years | 0 (0.0%) | 0 (0.0%) |
| 35 to 64 Years | 0 (0.0%) | 0 (0.0%) |
| 65 to 74 Years | 0 (0.0%) | 0 (0.0%) |
| 75 Years and over | 0 (0.0%) | 26 (10.4%) |
Disability Class: Cognitive Difficulty
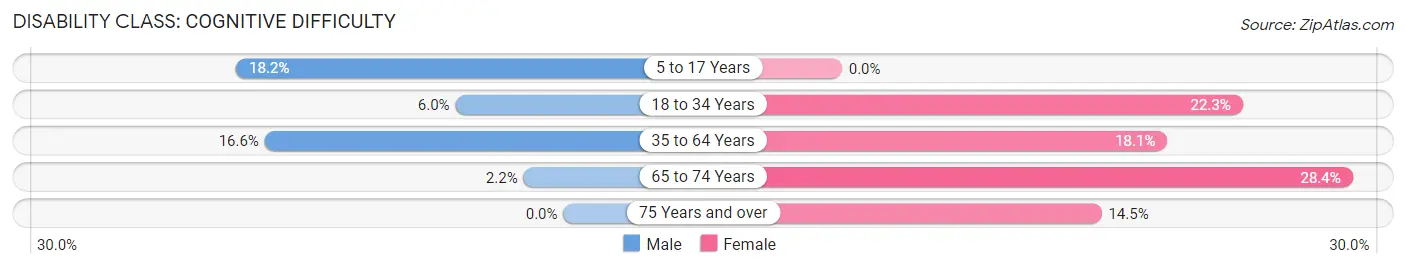
| Age Bracket | Male | Female |
| 5 to 17 Years | 45 (18.2%) | 0 (0.0%) |
| 18 to 34 Years | 19 (6.0%) | 77 (22.3%) |
| 35 to 64 Years | 84 (16.6%) | 83 (18.1%) |
| 65 to 74 Years | 2 (2.2%) | 31 (28.4%) |
| 75 Years and over | 0 (0.0%) | 36 (14.5%) |
Disability Class: Ambulatory Difficulty
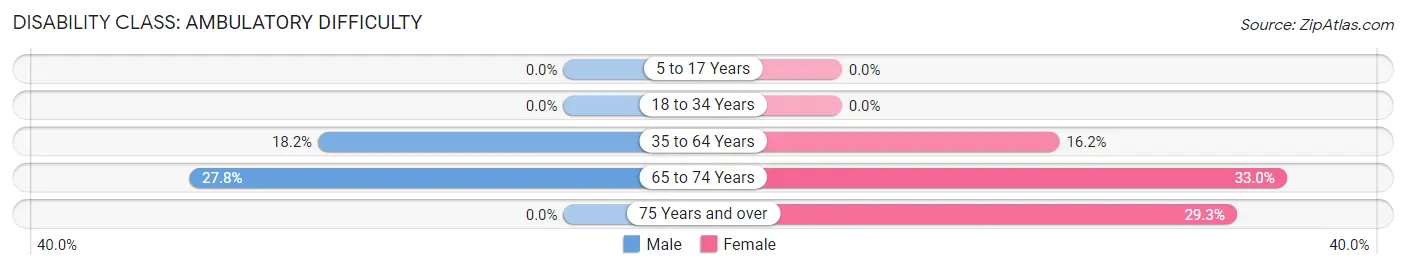
| Age Bracket | Male | Female |
| 5 to 17 Years | 0 (0.0%) | 0 (0.0%) |
| 18 to 34 Years | 0 (0.0%) | 0 (0.0%) |
| 35 to 64 Years | 92 (18.2%) | 74 (16.2%) |
| 65 to 74 Years | 25 (27.8%) | 36 (33.0%) |
| 75 Years and over | 0 (0.0%) | 73 (29.3%) |
Disability Class: Self-Care Difficulty
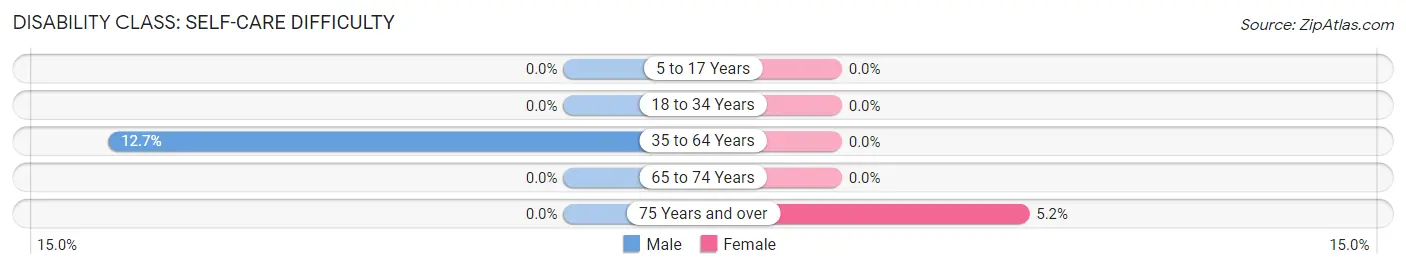
| Age Bracket | Male | Female |
| 5 to 17 Years | 0 (0.0%) | 0 (0.0%) |
| 18 to 34 Years | 0 (0.0%) | 0 (0.0%) |
| 35 to 64 Years | 64 (12.7%) | 0 (0.0%) |
| 65 to 74 Years | 0 (0.0%) | 0 (0.0%) |
| 75 Years and over | 0 (0.0%) | 13 (5.2%) |
Technology Access in McLeansboro
Computing Device Access in McLeansboro
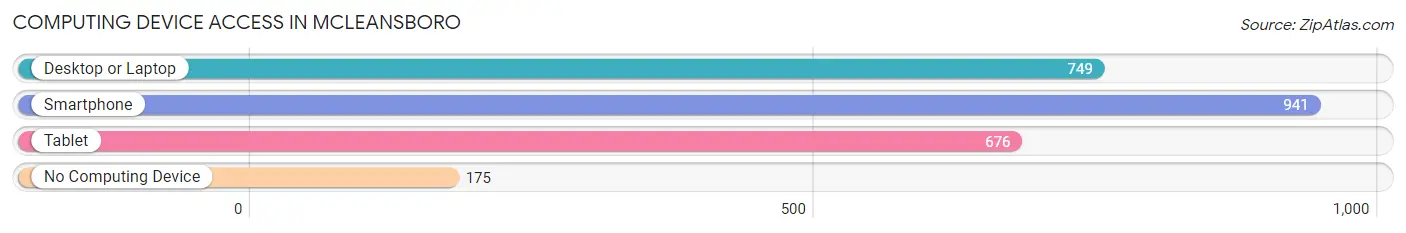
| Device Type | # Households | % Households |
| Desktop or Laptop | 749 | 63.0% |
| Smartphone | 941 | 79.1% |
| Tablet | 676 | 56.9% |
| No Computing Device | 175 | 14.7% |
| Total | 1,189 | 100.0% |
Internet Access in McLeansboro
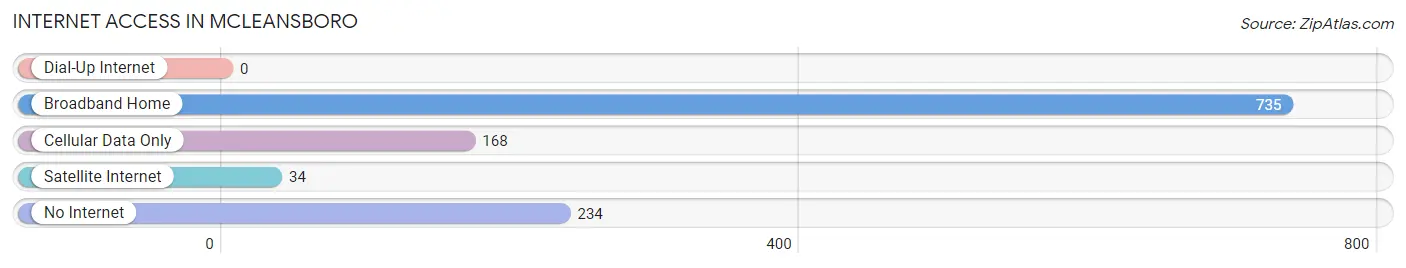
| Internet Type | # Households | % Households |
| Dial-Up Internet | 0 | 0.0% |
| Broadband Home | 735 | 61.8% |
| Cellular Data Only | 168 | 14.1% |
| Satellite Internet | 34 | 2.9% |
| No Internet | 234 | 19.7% |
| Total | 1,189 | 100.0% |
McLeansboro Summary
McLeansboro is a small city located in Hamilton County, Illinois, United States. It is the county seat of Hamilton County and is located in the southeastern part of the state. The city has a population of 2,741 as of the 2010 census.
History
McLeansboro was founded in 1817 by William McLean, a Revolutionary War veteran. The city was named after him and was incorporated in 1839. The city was an important stop on the Illinois Central Railroad, which was built in 1855. The railroad brought many new settlers to the area and helped to spur the growth of the city.
In the late 19th century, McLeansboro was a major center for coal mining. The city was home to several coal mines, including the McLeansboro Coal Company, which was founded in 1883. The coal industry was a major source of employment for the city and helped to fuel its growth.
Geography
McLeansboro is located in southeastern Illinois, in the heart of the Shawnee National Forest. The city is situated on the banks of the Little Wabash River, which flows through the city. The city is located about 60 miles southeast of St. Louis, Missouri, and about 90 miles northwest of Evansville, Indiana.
The city has a total area of 2.2 square miles, all of which is land. The city is located in a hilly region, with the highest point in the city being the McLeansboro Hill, which is located at an elevation of 845 feet.
Economy
McLeansboro’s economy is largely based on agriculture and manufacturing. The city is home to several manufacturing companies, including a plastics plant, a metal fabrication plant, and a food processing plant. The city is also home to several agricultural businesses, including a dairy farm, a grain elevator, and a feed mill.
The city is also home to several retail businesses, including several restaurants, a grocery store, and a hardware store. The city is also home to several service businesses, including a bank, a post office, and a medical clinic.
Demographics
As of the 2010 census, McLeansboro had a population of 2,741. The racial makeup of the city was 97.2% White, 0.7% African American, 0.3% Native American, 0.2% Asian, 0.1% Pacific Islander, 0.7% from other races, and 0.9% from two or more races. Hispanic or Latino of any race were 1.7% of the population.
The median income for a household in the city was $35,938, and the median income for a family was $41,250. The per capita income for the city was $17,845. About 15.2% of families and 17.7% of the population were below the poverty line, including 25.2% of those under age 18 and 8.2% of those age 65 or over.
Common Questions
What is the Total Population of McLeansboro?
Total Population of McLeansboro is 2,794.
What is the Total Male Population of McLeansboro?
Total Male Population of McLeansboro is 1,301.
What is the Total Female Population of McLeansboro?
Total Female Population of McLeansboro is 1,493.
What is the Ratio of Males per 100 Females in McLeansboro?
There are 87.14 Males per 100 Females in McLeansboro.
What is the Ratio of Females per 100 Males in McLeansboro?
There are 114.76 Females per 100 Males in McLeansboro.
What is the Median Population Age in McLeansboro?
Median Population Age in McLeansboro is 39.5 Years.
What is the Average Family Size in McLeansboro
Average Family Size in McLeansboro is 3.0 People.
What is the Average Household Size in McLeansboro
Average Household Size in McLeansboro is 2.3 People.
What is Per Capita Income in McLeansboro?
Per Capita income in McLeansboro is $24,857.
What is the Median Family Income in McLeansboro?
Median Family Income in McLeansboro is $64,022.
What is the Median Household income in McLeansboro?
Median Household Income in McLeansboro is $44,871.
What is Income or Wage Gap in McLeansboro?
Income or Wage Gap in McLeansboro is 29.6%.
Women in McLeansboro earn 70.4 cents for every dollar earned by a man.
What is Inequality or Gini Index in McLeansboro?
Inequality or Gini Index in McLeansboro is 0.42.
How Large is the Labor Force in McLeansboro?
There are 1,164 People in the Labor Forcein in McLeansboro.
What is the Percentage of People in the Labor Force in McLeansboro?
52.8% of People are in the Labor Force in McLeansboro.
What is the Unemployment Rate in McLeansboro?
Unemployment Rate in McLeansboro is 1.2%.