Cities with the Highest Percentage of Population Employed in Security & Protection in Oklahoma
RELATED REPORTS & OPTIONS
Security & Protection
Oklahoma
Compare Cities
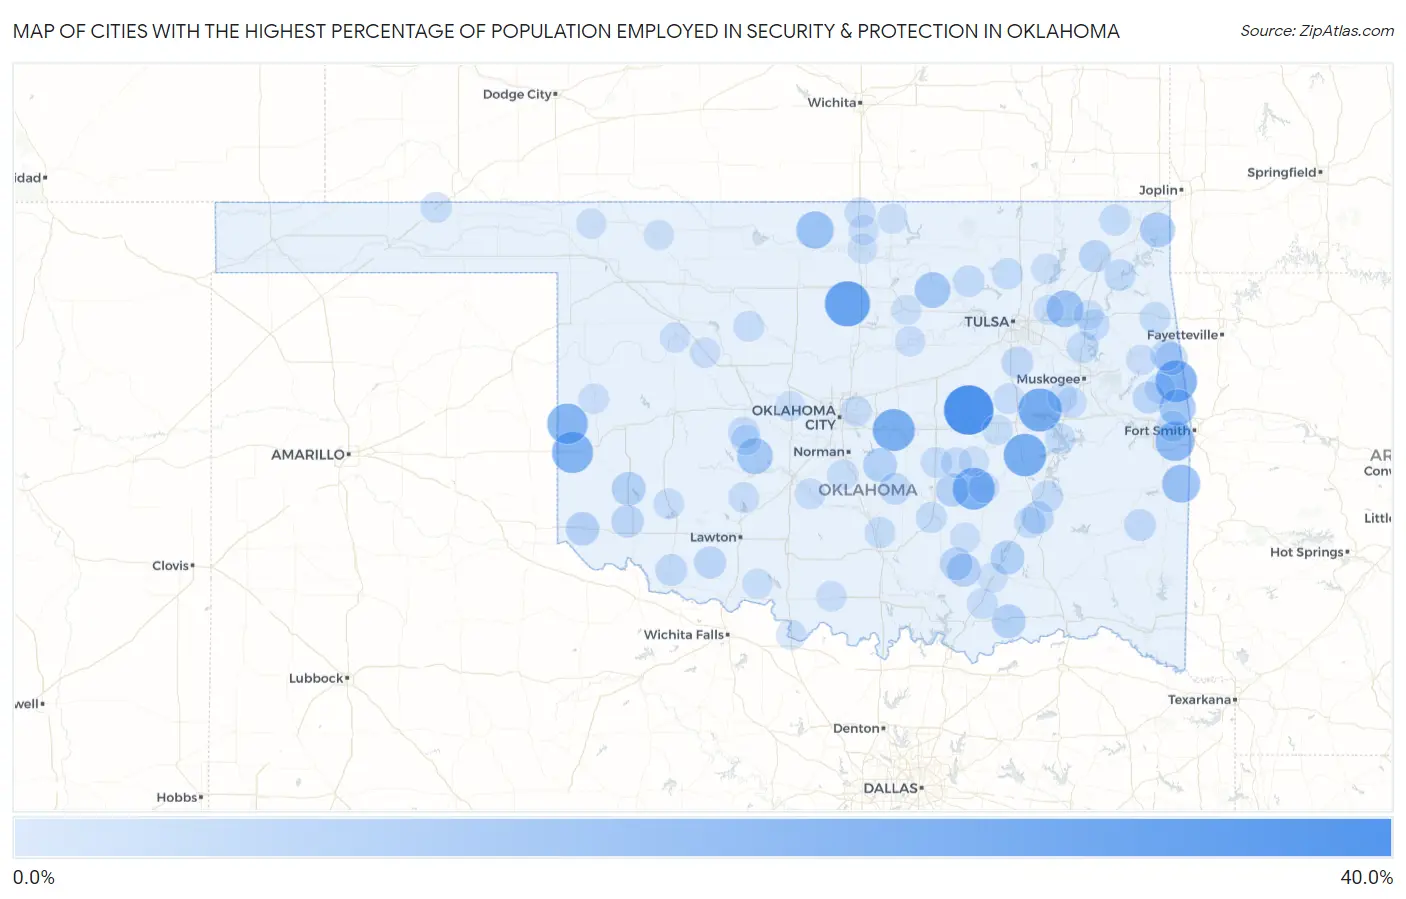
Map of Cities with the Highest Percentage of Population Employed in Security & Protection in Oklahoma
0.0%
40.0%
Cities with the Highest Percentage of Population Employed in Security & Protection in Oklahoma
| City | % Employed | vs State | vs National | |
| 1. | Ixl | 38.5% | 2.0%(+36.5)#1 | 2.1%(+36.3)#66 |
| 2. | Lucien | 30.9% | 2.0%(+28.9)#2 | 2.1%(+28.7)#113 |
| 3. | Hitchita | 27.3% | 2.0%(+25.3)#3 | 2.1%(+25.1)#147 |
| 4. | Hanna | 26.1% | 2.0%(+24.1)#4 | 2.1%(+23.9)#161 |
| 5. | Dale | 25.4% | 2.0%(+23.4)#5 | 2.1%(+23.3)#171 |
| 6. | Atwood | 25.0% | 2.0%(+23.0)#6 | 2.1%(+22.9)#181 |
| 7. | Bell | 24.5% | 2.0%(+22.5)#7 | 2.1%(+22.3)#194 |
| 8. | Erick | 23.6% | 2.0%(+21.6)#8 | 2.1%(+21.4)#211 |
| 9. | Sweetwater | 22.7% | 2.0%(+20.7)#9 | 2.1%(+20.6)#225 |
| 10. | Fort Coffee | 20.6% | 2.0%(+18.6)#10 | 2.1%(+18.4)#265 |
| 11. | Milfay | 18.4% | 2.0%(+16.4)#11 | 2.1%(+16.2)#320 |
| 12. | Monroe | 18.2% | 2.0%(+16.2)#12 | 2.1%(+16.0)#324 |
| 13. | Medford | 17.1% | 2.0%(+15.1)#13 | 2.1%(+15.0)#375 |
| 14. | Tiawah | 16.3% | 2.0%(+14.3)#14 | 2.1%(+14.2)#418 |
| 15. | Nashoba | 15.8% | 2.0%(+13.8)#15 | 2.1%(+13.6)#447 |
| 16. | Belfonte | 15.5% | 2.0%(+13.5)#16 | 2.1%(+13.3)#460 |
| 17. | Greenville | 15.4% | 2.0%(+13.4)#17 | 2.1%(+13.2)#464 |
| 18. | Gracemont | 14.5% | 2.0%(+12.5)#18 | 2.1%(+12.4)#517 |
| 19. | Little Rock | 14.3% | 2.0%(+12.3)#19 | 2.1%(+12.1)#541 |
| 20. | Skedee | 14.3% | 2.0%(+12.3)#20 | 2.1%(+12.1)#547 |
| 21. | Wyandotte | 12.9% | 2.0%(+10.9)#21 | 2.1%(+10.7)#672 |
| 22. | Edgewater Park | 12.8% | 2.0%(+10.8)#22 | 2.1%(+10.7)#677 |
| 23. | Stringtown | 11.2% | 2.0%(+9.23)#23 | 2.1%(+9.09)#876 |
| 24. | Granite | 11.2% | 2.0%(+9.22)#24 | 2.1%(+9.08)#878 |
| 25. | Bennington | 11.1% | 2.0%(+9.10)#25 | 2.1%(+8.96)#898 |
| 26. | Etowah | 11.1% | 2.0%(+9.10)#26 | 2.1%(+8.96)#904 |
| 27. | Gould | 10.5% | 2.0%(+8.52)#27 | 2.1%(+8.38)#1,012 |
| 28. | Wapanucka | 10.4% | 2.0%(+8.39)#28 | 2.1%(+8.25)#1,025 |
| 29. | Sasakwa | 10.0% | 2.0%(+7.99)#29 | 2.1%(+7.85)#1,099 |
| 30. | Peavine | 9.5% | 2.0%(+7.48)#30 | 2.1%(+7.34)#1,200 |
| 31. | Bromide | 9.3% | 2.0%(+7.29)#31 | 2.1%(+7.15)#1,243 |
| 32. | Martha | 9.1% | 2.0%(+7.08)#32 | 2.1%(+6.94)#1,302 |
| 33. | Blanco | 9.1% | 2.0%(+7.08)#33 | 2.1%(+6.94)#1,307 |
| 34. | White Eagle | 8.9% | 2.0%(+6.88)#34 | 2.1%(+6.74)#1,373 |
| 35. | White Oak | 8.5% | 2.0%(+6.44)#35 | 2.1%(+6.30)#1,504 |
| 36. | Chattanooga | 8.4% | 2.0%(+6.37)#36 | 2.1%(+6.23)#1,522 |
| 37. | Flute Springs | 8.3% | 2.0%(+6.32)#37 | 2.1%(+6.18)#1,545 |
| 38. | Shady Grove Cdp Mcintosh County | 7.8% | 2.0%(+5.83)#38 | 2.1%(+5.69)#1,708 |
| 39. | Wanette | 7.8% | 2.0%(+5.77)#39 | 2.1%(+5.63)#1,735 |
| 40. | Frederick | 7.7% | 2.0%(+5.73)#40 | 2.1%(+5.59)#1,748 |
| 41. | Whitesboro | 7.7% | 2.0%(+5.68)#41 | 2.1%(+5.54)#1,764 |
| 42. | Liberty | 7.6% | 2.0%(+5.61)#42 | 2.1%(+5.47)#1,792 |
| 43. | Langley | 7.4% | 2.0%(+5.42)#43 | 2.1%(+5.28)#1,888 |
| 44. | Hominy | 7.4% | 2.0%(+5.40)#44 | 2.1%(+5.26)#1,896 |
| 45. | Lookeba | 7.3% | 2.0%(+5.31)#45 | 2.1%(+5.17)#1,942 |
| 46. | Wagoner | 7.2% | 2.0%(+5.23)#46 | 2.1%(+5.09)#1,966 |
| 47. | Cave Spring | 7.1% | 2.0%(+5.13)#47 | 2.1%(+4.99)#2,009 |
| 48. | West Peavine | 7.0% | 2.0%(+5.03)#48 | 2.1%(+4.89)#2,056 |
| 49. | Welch | 7.0% | 2.0%(+4.97)#49 | 2.1%(+4.83)#2,085 |
| 50. | Alderson | 6.9% | 2.0%(+4.89)#50 | 2.1%(+4.75)#2,140 |
| 51. | Pittsburg | 6.8% | 2.0%(+4.77)#51 | 2.1%(+4.63)#2,198 |
| 52. | Flint Creek | 6.8% | 2.0%(+4.76)#52 | 2.1%(+4.62)#2,201 |
| 53. | Pin Oak Acres | 6.7% | 2.0%(+4.68)#53 | 2.1%(+4.54)#2,244 |
| 54. | Muldrow | 6.6% | 2.0%(+4.59)#54 | 2.1%(+4.45)#2,306 |
| 55. | Avant | 6.5% | 2.0%(+4.51)#55 | 2.1%(+4.37)#2,347 |
| 56. | Latta | 6.5% | 2.0%(+4.45)#56 | 2.1%(+4.31)#2,379 |
| 57. | Bowlegs | 6.5% | 2.0%(+4.44)#57 | 2.1%(+4.30)#2,387 |
| 58. | Wynnewood | 6.4% | 2.0%(+4.43)#58 | 2.1%(+4.29)#2,402 |
| 59. | Calvin | 6.4% | 2.0%(+4.39)#59 | 2.1%(+4.25)#2,424 |
| 60. | Caddo | 6.3% | 2.0%(+4.33)#60 | 2.1%(+4.19)#2,474 |
| 61. | Moodys | 6.2% | 2.0%(+4.24)#61 | 2.1%(+4.10)#2,523 |
| 62. | Tyrone | 6.2% | 2.0%(+4.24)#62 | 2.1%(+4.10)#2,524 |
| 63. | Washington | 6.2% | 2.0%(+4.24)#63 | 2.1%(+4.10)#2,526 |
| 64. | Okeene | 6.2% | 2.0%(+4.23)#64 | 2.1%(+4.09)#2,536 |
| 65. | Spencer | 6.2% | 2.0%(+4.19)#65 | 2.1%(+4.05)#2,564 |
| 66. | Alex | 6.1% | 2.0%(+4.08)#66 | 2.1%(+3.94)#2,636 |
| 67. | Wewoka | 6.1% | 2.0%(+4.05)#67 | 2.1%(+3.91)#2,651 |
| 68. | Apache | 6.1% | 2.0%(+4.05)#68 | 2.1%(+3.91)#2,655 |
| 69. | Eufaula | 6.1% | 2.0%(+4.04)#69 | 2.1%(+3.90)#2,670 |
| 70. | Oktaha | 6.0% | 2.0%(+4.03)#70 | 2.1%(+3.89)#2,683 |
| 71. | Roosevelt | 6.0% | 2.0%(+3.99)#71 | 2.1%(+3.85)#2,709 |
| 72. | Braman | 6.0% | 2.0%(+3.99)#72 | 2.1%(+3.85)#2,710 |
| 73. | Okmulgee | 6.0% | 2.0%(+3.97)#73 | 2.1%(+3.83)#2,726 |
| 74. | Ringling | 5.8% | 2.0%(+3.83)#74 | 2.1%(+3.69)#2,856 |
| 75. | Greasy | 5.8% | 2.0%(+3.81)#75 | 2.1%(+3.67)#2,871 |
| 76. | Binger | 5.7% | 2.0%(+3.71)#76 | 2.1%(+3.57)#2,950 |
| 77. | Oakwood | 5.7% | 2.0%(+3.71)#77 | 2.1%(+3.57)#2,960 |
| 78. | Cheyenne | 5.7% | 2.0%(+3.69)#78 | 2.1%(+3.55)#2,968 |
| 79. | Ripley | 5.7% | 2.0%(+3.65)#79 | 2.1%(+3.51)#3,000 |
| 80. | Weleetka | 5.6% | 2.0%(+3.60)#80 | 2.1%(+3.46)#3,050 |
| 81. | Taloga | 5.6% | 2.0%(+3.55)#81 | 2.1%(+3.41)#3,108 |
| 82. | Haywood | 5.6% | 2.0%(+3.55)#82 | 2.1%(+3.41)#3,112 |
| 83. | Terral | 5.5% | 2.0%(+3.50)#83 | 2.1%(+3.36)#3,144 |
| 84. | Welling | 5.5% | 2.0%(+3.50)#84 | 2.1%(+3.36)#3,149 |
| 85. | Temple | 5.5% | 2.0%(+3.48)#85 | 2.1%(+3.34)#3,175 |
| 86. | Freedom | 5.3% | 2.0%(+3.31)#86 | 2.1%(+3.17)#3,342 |
| 87. | Tonkawa | 5.3% | 2.0%(+3.28)#87 | 2.1%(+3.14)#3,382 |
| 88. | Glencoe | 5.3% | 2.0%(+3.25)#88 | 2.1%(+3.11)#3,408 |
| 89. | Tushka | 5.3% | 2.0%(+3.25)#89 | 2.1%(+3.11)#3,409 |
| 90. | Talala | 5.2% | 2.0%(+3.21)#90 | 2.1%(+3.08)#3,460 |
| 91. | Verdigris | 5.2% | 2.0%(+3.21)#91 | 2.1%(+3.07)#3,461 |
| 92. | Newkirk | 5.2% | 2.0%(+3.17)#92 | 2.1%(+3.03)#3,496 |
| 93. | Blackwell | 5.2% | 2.0%(+3.15)#93 | 2.1%(+3.01)#3,523 |
| 94. | Whitehorn Cove | 5.1% | 2.0%(+3.14)#94 | 2.1%(+3.00)#3,533 |
| 95. | Buffalo | 5.1% | 2.0%(+3.12)#95 | 2.1%(+2.98)#3,548 |
| 96. | Tupelo | 5.1% | 2.0%(+3.12)#96 | 2.1%(+2.98)#3,553 |
| 97. | Yeager | 5.1% | 2.0%(+3.12)#97 | 2.1%(+2.98)#3,555 |
| 98. | Wainwright | 5.1% | 2.0%(+3.12)#98 | 2.1%(+2.98)#3,556 |
| 99. | El Reno | 5.1% | 2.0%(+3.06)#99 | 2.1%(+2.92)#3,620 |
| 100. | Chouteau | 5.0% | 2.0%(+3.04)#100 | 2.1%(+2.90)#3,639 |
Common Questions
What are the Top 10 Cities with the Highest Percentage of Population Employed in Security & Protection in Oklahoma?
Top 10 Cities with the Highest Percentage of Population Employed in Security & Protection in Oklahoma are:
#1
38.5%
#2
30.9%
#3
27.3%
#4
26.1%
#5
25.4%
#6
25.0%
#7
24.5%
#8
23.6%
#9
22.7%
#10
20.6%
What city has the Highest Percentage of Population Employed in Security & Protection in Oklahoma?
IXL has the Highest Percentage of Population Employed in Security & Protection in Oklahoma with 38.5%.
What is the Percentage of Population Employed in Security & Protection in the State of Oklahoma?
Percentage of Population Employed in Security & Protection in Oklahoma is 2.0%.
What is the Percentage of Population Employed in Security & Protection in the United States?
Percentage of Population Employed in Security & Protection in the United States is 2.1%.