Cities with the Highest Percentage of Population Employed in Security & Protection in New Hampshire

RELATED REPORTS & OPTIONS

Security & Protection
Population
Families and Households
Female Fertility
Female Fertility (Unmarried)
Race (Community Size)
Race (Percentage)
Ancestry (Community Size)
AfghanAfricanAlaska NativeAlaskan AthabascanAlbanianAleutAlsatianAmericanApacheArabArapahoArgentineanArmenianAssyrian / Chaldean / SyriacAustralianAustrianBahamianBangladeshiBarbadianBasqueBelgianBelizeanBermudanBhutaneseBlackfeetBolivianBrazilianBritishBritish West IndianBulgarianBurmeseCajunCambodianCanadianCape VerdeanCarpatho RusynCelticCentral AmericanCentral American IndianCherokeeCheyenneChickasawChileanChineseChippewaChoctawColombianColvilleComancheCosta RicanCreeCreekCroatianCrowCubanCypriotCzechCzechoslovakianDanishDelawareDominicanDutchDutch West IndianEastern EuropeanEcuadorianEgyptianEnglishEstonianEthiopianEuropeanFijianFilipinoFinnishFrenchFrench American IndianFrench CanadianGermanGerman RussianGhanaianGreekGuamanian / ChamorroGuatemalanGuyaneseHaitianHmongHonduranHopiHoumaHungarianIcelanderIndian (Asian)IndonesianInupiatIranianIraqiIrishIroquoisIsraeliItalianJamaicanJapaneseJordanianKenyanKiowaKoreanLaotianLatvianLebaneseLiberianLithuanianLumbeeLuxembourgerMacedonianMalaysianMalteseMarshalleseMenomineeMexicanMexican American IndianMongolianMoroccanNative HawaiianNavajoNepaleseNew ZealanderNicaraguanNigerianNorthern EuropeanNorwegianOkinawanOsageOttawaPaiutePakistaniPalestinianPanamanianParaguayanPennsylvania GermanPeruvianPimaPolishPortuguesePotawatomiPuebloPuerto RicanPuget Sound SalishRomanianRussianSalvadoranSamoanScandinavianScotch-IrishScottishSeminoleSenegaleseSerbianShoshoneSierra LeoneanSiouxSlavicSlovakSloveneSomaliSouth AfricanSouth AmericanSouth American IndianSoviet UnionSpaniardSpanishSpanish AmericanSpanish American IndianSri LankanSubsaharan AfricanSudaneseSwedishSwissSyrianTaiwaneseThaiTlingit-HaidaTohono O'OdhamTonganTrinidadian and TobagonianTsimshianTurkishU.S. Virgin IslanderUgandanUkrainianUruguayanUteVenezuelanVietnameseWelshWest IndianYakamaYaquiYugoslavianYumanYup'ikZimbabwean
Ancestry (Percentage)
AfghanAfricanAlaska NativeAlaskan AthabascanAlbanianAleutAlsatianAmericanApacheArabArapahoArgentineanArmenianAssyrian / Chaldean / SyriacAustralianAustrianBahamianBangladeshiBarbadianBasqueBelgianBelizeanBermudanBhutaneseBlackfeetBolivianBrazilianBritishBritish West IndianBulgarianBurmeseCajunCambodianCanadianCape VerdeanCarpatho RusynCelticCentral AmericanCentral American IndianCherokeeCheyenneChickasawChileanChineseChippewaChoctawColombianColvilleComancheCosta RicanCreeCreekCroatianCrowCubanCypriotCzechCzechoslovakianDanishDelawareDominicanDutchDutch West IndianEastern EuropeanEcuadorianEgyptianEnglishEstonianEthiopianEuropeanFijianFilipinoFinnishFrenchFrench American IndianFrench CanadianGermanGerman RussianGhanaianGreekGuamanian / ChamorroGuatemalanGuyaneseHaitianHmongHonduranHopiHoumaHungarianIcelanderIndian (Asian)IndonesianInupiatIranianIraqiIrishIroquoisIsraeliItalianJamaicanJapaneseJordanianKenyanKiowaKoreanLaotianLatvianLebaneseLiberianLithuanianLumbeeLuxembourgerMacedonianMalaysianMalteseMarshalleseMenomineeMexicanMexican American IndianMongolianMoroccanNative HawaiianNavajoNepaleseNew ZealanderNicaraguanNigerianNorthern EuropeanNorwegianOkinawanOsageOttawaPaiutePakistaniPalestinianPanamanianParaguayanPennsylvania GermanPeruvianPimaPolishPortuguesePotawatomiPuebloPuerto RicanPuget Sound SalishRomanianRussianSalvadoranSamoanScandinavianScotch-IrishScottishSeminoleSenegaleseSerbianShoshoneSierra LeoneanSiouxSlavicSlovakSloveneSomaliSouth AfricanSouth AmericanSouth American IndianSoviet UnionSpaniardSpanishSpanish AmericanSpanish American IndianSri LankanSubsaharan AfricanSudaneseSwedishSwissSyrianTaiwaneseThaiTlingit-HaidaTohono O'OdhamTonganTrinidadian and TobagonianTsimshianTurkishU.S. Virgin IslanderUgandanUkrainianUruguayanUteVenezuelanVietnameseWelshWest IndianYakamaYaquiYugoslavianYumanYup'ikZimbabwean
Immigrant Origin (Total)
AfghanistanAfricaAlbaniaArgentinaArmeniaAsiaAustraliaAustriaAzoresBahamasBangladeshBarbadosBelarusBelgiumBelizeBoliviaBosnia and HerzegovinaBrazilBulgariaBurma / MyanmarCabo VerdeCambodiaCameroonCanadaCaribbeanCentral AmericaChileChinaColombiaCongoCosta RicaCroatiaCubaCzechoslovakiaDenmarkDominicaDominican RepublicEastern AfricaEastern AsiaEastern EuropeEcuadorEgyptEl SalvadorEnglandEritreaEthiopiaEuropeFijiFranceGermanyGhanaGreeceGrenadaGuatemalaGuyanaHaitiHondurasHong KongHungaryIndiaIndonesiaIranIraqIrelandIsraelItalyJamaicaJapanJordanKazakhstanKenyaKoreaKuwaitLaosLatin AmericaLatviaLebanonLiberiaLithuaniaMalaysiaMexicoMicronesiaMiddle AfricaMoldovaMoroccoNepalNetherlandsNicaraguaNigeriaNorth MacedoniaNorthern AfricaNorthern EuropeNorwayOceaniaPakistanPanamaPeruPhilippinesPolandPortugalRomaniaRussiaSaudi ArabiaScotlandSenegalSerbiaSierra LeoneSingaporeSomaliaSouth AfricaSouth AmericaSouth Central AsiaSouth Eastern AsiaSouthern EuropeSpainSri LankaSt. Vincent and the GrenadinesSudanSwedenSwitzerlandSyriaTaiwanThailandTrinidad and TobagoTurkeyUgandaUkraineUruguayUzbekistanVenezuelaVietnamWest IndiesWestern AfricaWestern AsiaWestern EuropeYemenZaireZimbabwe
Immigrant Origin (Percentage)
AfghanistanAfricaAlbaniaArgentinaArmeniaAsiaAustraliaAustriaAzoresBahamasBangladeshBarbadosBelarusBelgiumBelizeBoliviaBosnia and HerzegovinaBrazilBulgariaBurma / MyanmarCabo VerdeCambodiaCameroonCanadaCaribbeanCentral AmericaChileChinaColombiaCongoCosta RicaCroatiaCubaCzechoslovakiaDenmarkDominicaDominican RepublicEastern AfricaEastern AsiaEastern EuropeEcuadorEgyptEl SalvadorEnglandEritreaEthiopiaEuropeFijiFranceGermanyGhanaGreeceGrenadaGuatemalaGuyanaHaitiHondurasHong KongHungaryIndiaIndonesiaIranIraqIrelandIsraelItalyJamaicaJapanJordanKazakhstanKenyaKoreaKuwaitLaosLatin AmericaLatviaLebanonLiberiaLithuaniaMalaysiaMexicoMicronesiaMiddle AfricaMoldovaMoroccoNepalNetherlandsNicaraguaNigeriaNorth MacedoniaNorthern AfricaNorthern EuropeNorwayOceaniaPakistanPanamaPeruPhilippinesPolandPortugalRomaniaRussiaSaudi ArabiaScotlandSenegalSerbiaSierra LeoneSingaporeSomaliaSouth AfricaSouth AmericaSouth Central AsiaSouth Eastern AsiaSouthern EuropeSpainSri LankaSt. Vincent and the GrenadinesSudanSwedenSwitzerlandSyriaTaiwanThailandTrinidad and TobagoTurkeyUgandaUkraineUruguayUzbekistanVenezuelaVietnamWest IndiesWestern AfricaWestern AsiaWestern EuropeYemenZaireZimbabwe
Income
Income (Families)
Income (Households)
Poverty
Poverty (Families)
Unemployment
Employment Occupations
Employment Industries
Employer Class
Commute Time
Commute Means
School Enrollment
Education by Degree Field
Occupancy
Finances
Physical Characteristics
New Hampshire
Compare Cities
Comparison Subject

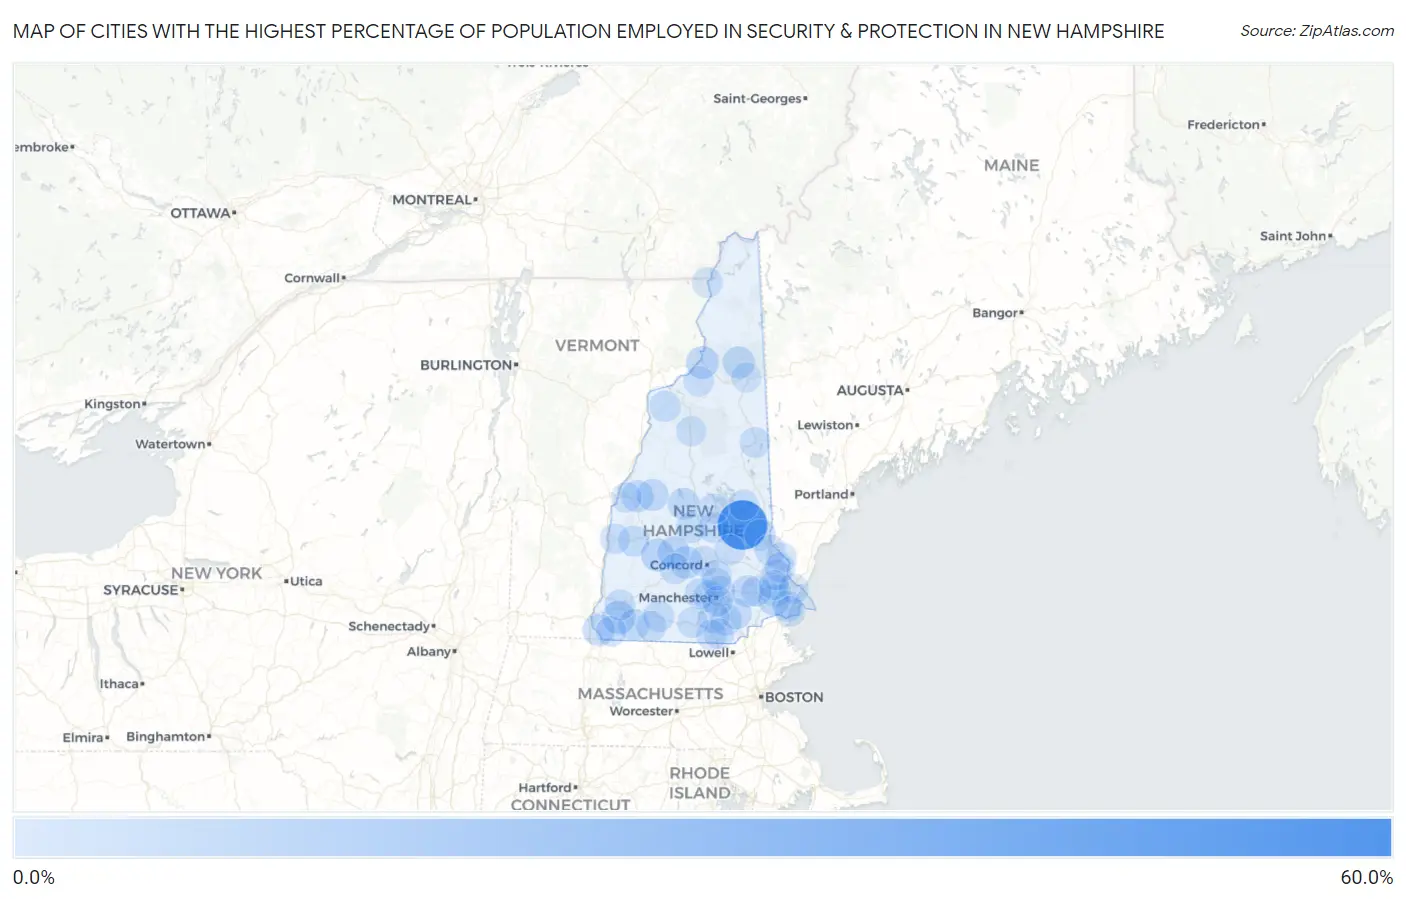
Map of Cities with the Highest Percentage of Population Employed in Security & Protection in New Hampshire

0.0%
60.0%
Cities with the Highest Percentage of Population Employed in Security & Protection in New Hampshire Map

Cities with the Highest Percentage of Population Employed in Security & Protection in New Hampshire

City % Employed vs State vs National
1.Alton56.2%1.6%(+54.6)#12.1%(+54.1)#21
2.West Swanzey8.5%1.6%(+6.89)#22.1%(+6.37)#1,486
3.Bradford7.7%1.6%(+6.04)#32.1%(+5.51)#1,775
4.Lancaster7.3%1.6%(+5.71)#42.1%(+5.18)#1,933
5.Contoocook6.6%1.6%(+5.01)#52.1%(+4.48)#2,289
6.Warner5.9%1.6%(+4.26)#62.1%(+3.73)#2,814
7.Hinsdale5.6%1.6%(+4.02)#72.1%(+3.49)#3,022
8.Francestown5.5%1.6%(+3.83)#82.1%(+3.31)#3,214
9.Berlin5.4%1.6%(+3.78)#92.1%(+3.26)#3,261
10.Bristol5.3%1.6%(+3.64)#102.1%(+3.11)#3,403
11.Enfield5.1%1.6%(+3.50)#112.1%(+2.97)#3,568
12.Canaan5.1%1.6%(+3.46)#122.1%(+2.94)#3,611
13.Raymond4.7%1.6%(+3.07)#132.1%(+2.54)#4,050
14.Newfields4.1%1.6%(+2.47)#142.1%(+1.95)#4,950
15.Farmington3.9%1.6%(+2.32)#152.1%(+1.79)#5,215
16.Exeter3.6%1.6%(+1.97)#162.1%(+1.45)#5,922
17.Troy3.4%1.6%(+1.82)#172.1%(+1.29)#6,270
18.Peterborough3.3%1.6%(+1.72)#182.1%(+1.19)#6,525
19.Pinardville3.2%1.6%(+1.58)#192.1%(+1.05)#6,869
20.Lisbon3.2%1.6%(+1.55)#202.1%(+1.02)#6,950
21.Londonderry2.9%1.6%(+1.28)#212.1%(+0.753)#7,818
22.Belmont2.7%1.6%(+1.12)#222.1%(+0.598)#8,321
23.Newport2.6%1.6%(+0.971)#232.1%(+0.445)#8,845
24.Franklin2.5%1.6%(+0.897)#242.1%(+0.371)#9,131
25.Derry2.5%1.6%(+0.859)#252.1%(+0.333)#9,281
26.East Merrimack2.3%1.6%(+0.705)#262.1%(+0.179)#9,885
27.Hampton2.3%1.6%(+0.639)#272.1%(+0.114)#10,163
28.Conway2.2%1.6%(+0.581)#282.1%(+0.055)#10,421
29.Goffstown2.1%1.6%(+0.478)#292.1%(-0.048)#10,881
30.Rochester2.0%1.6%(+0.397)#302.1%(-0.129)#11,293
31.Henniker2.0%1.6%(+0.328)#312.1%(-0.198)#11,642
32.Wolfeboro1.8%1.6%(+0.174)#322.1%(-0.352)#12,397
33.Durham1.8%1.6%(+0.142)#332.1%(-0.384)#12,546
34.Epping1.7%1.6%(+0.078)#342.1%(-0.448)#12,860
35.Keene1.7%1.6%(+0.055)#352.1%(-0.471)#12,990
36.South Hooksett1.7%1.6%(+0.036)#362.1%(-0.490)#13,097
37.Milford1.5%1.6%(-0.081)#372.1%(-0.607)#13,722
38.Laconia1.5%1.6%(-0.113)#382.1%(-0.639)#13,888
39.Pittsfield1.4%1.6%(-0.225)#392.1%(-0.751)#14,500
40.Nashua1.3%1.6%(-0.280)#402.1%(-0.806)#14,812
41.Winchester1.3%1.6%(-0.289)#412.1%(-0.815)#14,850
42.Somersworth1.3%1.6%(-0.320)#422.1%(-0.846)#15,025
43.Concord1.2%1.6%(-0.373)#432.1%(-0.899)#15,343
44.Manchester1.1%1.6%(-0.474)#442.1%(-1.000)#15,875
45.West Stewartstown1.1%1.6%(-0.492)#452.1%(-1.02)#15,964
46.Suncook1.1%1.6%(-0.543)#462.1%(-1.07)#16,252
47.Portsmouth1.1%1.6%(-0.543)#472.1%(-1.07)#16,253
48.Hampton Beach1.1%1.6%(-0.551)#482.1%(-1.08)#16,308
49.Jaffrey1.0%1.6%(-0.585)#492.1%(-1.11)#16,503
50.Lebanon0.98%1.6%(-0.639)#502.1%(-1.17)#16,779
51.Whitefield0.90%1.6%(-0.720)#512.1%(-1.25)#17,186
52.Hudson0.75%1.6%(-0.876)#522.1%(-1.40)#17,952
53.Claremont0.74%1.6%(-0.882)#532.1%(-1.41)#17,987
54.Dover0.74%1.6%(-0.883)#542.1%(-1.41)#17,990
55.Lincoln0.57%1.6%(-1.05)#552.1%(-1.57)#18,768
56.Gorham0.57%1.6%(-1.06)#562.1%(-1.58)#18,802
57.Newmarket0.31%1.6%(-1.31)#572.1%(-1.84)#19,709
58.Hooksett0.14%1.6%(-1.49)#582.1%(-2.01)#19,962

Common Questions

What are the Top 10 Cities with the Highest Percentage of Population Employed in Security & Protection in New Hampshire?
Top 10 Cities with the Highest Percentage of Population Employed in Security & Protection in New Hampshire are:
#1
56.2%
#2
8.5%
#3
7.7%
#4
7.3%
#5
6.6%
#6
5.9%
#7
5.6%
#8
5.4%
#9
5.3%
#10
5.1%
What city has the Highest Percentage of Population Employed in Security & Protection in New Hampshire?
Alton has the Highest Percentage of Population Employed in Security & Protection in New Hampshire with 56.2%.
What is the Percentage of Population Employed in Security & Protection in the State of New Hampshire?
Percentage of Population Employed in Security & Protection in New Hampshire is 1.6%.
What is the Percentage of Population Employed in Security & Protection in the United States?
Percentage of Population Employed in Security & Protection in the United States is 2.1%.