Cities with the Highest Percentage of Population Employed in Security & Protection in Pennsylvania
RELATED REPORTS & OPTIONS
Security & Protection
Pennsylvania
Compare Cities
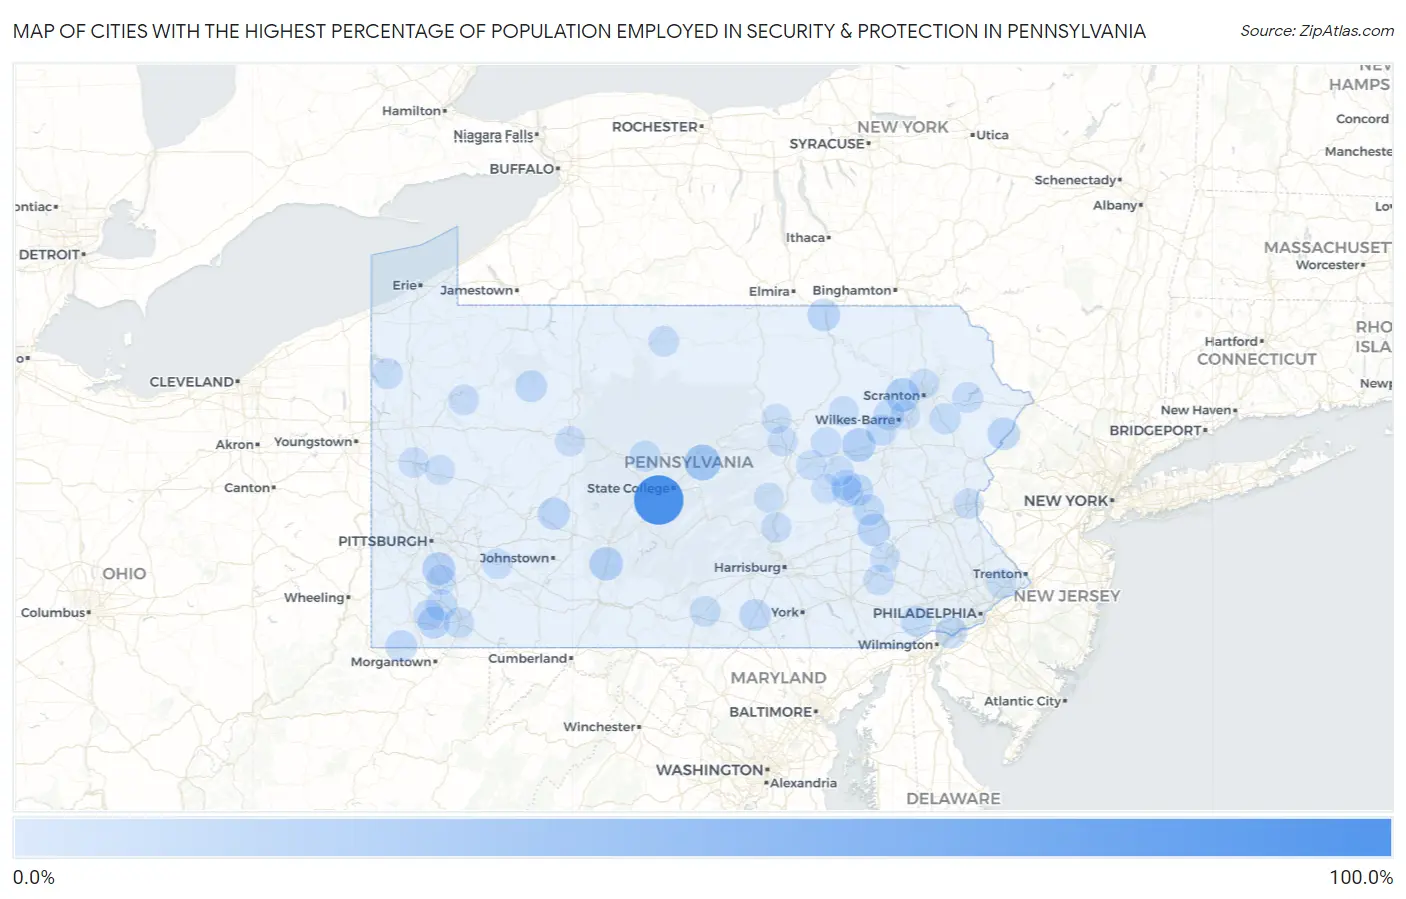
Map of Cities with the Highest Percentage of Population Employed in Security & Protection in Pennsylvania
0.0%
100.0%
Cities with the Highest Percentage of Population Employed in Security & Protection in Pennsylvania
| City | % Employed | vs State | vs National | |
| 1. | Baileyville | 100.0% | 2.0%(+98.0)#1 | 2.1%(+97.9)#1 |
| 2. | Roots | 73.8% | 2.0%(+71.8)#2 | 2.1%(+71.7)#9 |
| 3. | Hublersburg | 33.8% | 2.0%(+31.8)#3 | 2.1%(+31.7)#88 |
| 4. | St Clairsville Borough | 25.6% | 2.0%(+23.6)#4 | 2.1%(+23.5)#168 |
| 5. | Upper Exeter | 23.1% | 2.0%(+21.1)#5 | 2.1%(+21.0)#218 |
| 6. | Ohiopyle Borough | 22.7% | 2.0%(+20.7)#6 | 2.1%(+20.6)#226 |
| 7. | Reightown | 22.6% | 2.0%(+20.6)#7 | 2.1%(+20.4)#228 |
| 8. | Foundryville | 22.2% | 2.0%(+20.2)#8 | 2.1%(+20.1)#231 |
| 9. | Claysburg | 22.2% | 2.0%(+20.2)#9 | 2.1%(+20.1)#234 |
| 10. | Mill Run | 20.8% | 2.0%(+18.8)#10 | 2.1%(+18.7)#256 |
| 11. | Elrama | 20.0% | 2.0%(+18.0)#11 | 2.1%(+17.9)#275 |
| 12. | Glen Hope Borough | 19.5% | 2.0%(+17.5)#12 | 2.1%(+17.3)#291 |
| 13. | Shartlesville | 18.1% | 2.0%(+16.1)#13 | 2.1%(+15.9)#330 |
| 14. | Greens Landing | 18.0% | 2.0%(+16.0)#14 | 2.1%(+15.9)#333 |
| 15. | Pocono Mountain Lake Estates | 17.2% | 2.0%(+15.2)#15 | 2.1%(+15.0)#372 |
| 16. | Heilwood | 16.5% | 2.0%(+14.5)#16 | 2.1%(+14.4)#408 |
| 17. | Saltillo Borough | 16.2% | 2.0%(+14.2)#17 | 2.1%(+14.1)#425 |
| 18. | Fairdale | 15.4% | 2.0%(+13.3)#18 | 2.1%(+13.2)#469 |
| 19. | Brave | 15.0% | 2.0%(+13.0)#19 | 2.1%(+12.9)#486 |
| 20. | Linwood | 14.9% | 2.0%(+12.9)#20 | 2.1%(+12.8)#493 |
| 21. | Heidlersburg | 14.6% | 2.0%(+12.6)#21 | 2.1%(+12.5)#509 |
| 22. | Englewood | 14.6% | 2.0%(+12.6)#22 | 2.1%(+12.4)#515 |
| 23. | Marienville | 14.2% | 2.0%(+12.2)#23 | 2.1%(+12.1)#552 |
| 24. | Potters Mills | 14.1% | 2.0%(+12.1)#24 | 2.1%(+12.0)#558 |
| 25. | Berlin Borough | 13.8% | 2.0%(+11.8)#25 | 2.1%(+11.7)#581 |
| 26. | Milesburg Borough | 13.8% | 2.0%(+11.8)#26 | 2.1%(+11.7)#582 |
| 27. | Salladasburg Borough | 13.7% | 2.0%(+11.7)#27 | 2.1%(+11.5)#594 |
| 28. | Renningers | 13.3% | 2.0%(+11.3)#28 | 2.1%(+11.2)#630 |
| 29. | Clintonville Borough | 13.1% | 2.0%(+11.1)#29 | 2.1%(+11.0)#651 |
| 30. | Hazen | 12.5% | 2.0%(+10.5)#30 | 2.1%(+10.4)#711 |
| 31. | Wanamie | 12.2% | 2.0%(+10.2)#31 | 2.1%(+10.1)#733 |
| 32. | Hiller | 12.2% | 2.0%(+10.2)#32 | 2.1%(+10.0)#736 |
| 33. | Fountain Springs | 12.2% | 2.0%(+10.2)#33 | 2.1%(+10.0)#741 |
| 34. | Eagles Mere Borough | 12.1% | 2.0%(+10.1)#34 | 2.1%(+9.97)#745 |
| 35. | Big Bass Lake | 11.8% | 2.0%(+9.79)#35 | 2.1%(+9.66)#786 |
| 36. | Grassflat | 11.8% | 2.0%(+9.74)#36 | 2.1%(+9.62)#794 |
| 37. | Elizabethville Borough | 11.3% | 2.0%(+9.29)#37 | 2.1%(+9.17)#862 |
| 38. | Unionville | 11.1% | 2.0%(+9.09)#38 | 2.1%(+8.96)#895 |
| 39. | Chase | 10.8% | 2.0%(+8.82)#39 | 2.1%(+8.69)#947 |
| 40. | Centre Hall Borough | 10.7% | 2.0%(+8.68)#40 | 2.1%(+8.56)#968 |
| 41. | Ramey Borough | 10.7% | 2.0%(+8.68)#41 | 2.1%(+8.55)#970 |
| 42. | South Uniontown | 10.5% | 2.0%(+8.53)#42 | 2.1%(+8.40)#1,003 |
| 43. | Hartstown | 10.3% | 2.0%(+8.27)#43 | 2.1%(+8.15)#1,043 |
| 44. | Hopewell Borough | 10.2% | 2.0%(+8.18)#44 | 2.1%(+8.06)#1,057 |
| 45. | Wallenpaupack Lake Estates | 10.2% | 2.0%(+8.17)#45 | 2.1%(+8.04)#1,061 |
| 46. | Middleport Borough | 10.2% | 2.0%(+8.15)#46 | 2.1%(+8.02)#1,066 |
| 47. | Scotland | 10.1% | 2.0%(+8.06)#47 | 2.1%(+7.93)#1,083 |
| 48. | Eyers Grove | 9.5% | 2.0%(+7.50)#48 | 2.1%(+7.38)#1,193 |
| 49. | Seneca | 9.5% | 2.0%(+7.48)#49 | 2.1%(+7.35)#1,198 |
| 50. | Sweden Valley | 9.4% | 2.0%(+7.36)#50 | 2.1%(+7.23)#1,229 |
| 51. | Summerhill Borough | 9.3% | 2.0%(+7.31)#51 | 2.1%(+7.18)#1,238 |
| 52. | Dry Tavern | 9.2% | 2.0%(+7.17)#52 | 2.1%(+7.04)#1,268 |
| 53. | Jermyn Borough | 9.2% | 2.0%(+7.15)#53 | 2.1%(+7.02)#1,271 |
| 54. | Millbourne Borough | 9.1% | 2.0%(+7.07)#54 | 2.1%(+6.94)#1,290 |
| 55. | Shelltown | 9.1% | 2.0%(+7.07)#55 | 2.1%(+6.94)#1,304 |
| 56. | Callimont Borough | 9.1% | 2.0%(+7.07)#56 | 2.1%(+6.94)#1,310 |
| 57. | Fivepointville | 9.1% | 2.0%(+7.05)#57 | 2.1%(+6.93)#1,318 |
| 58. | St Vincent College | 9.0% | 2.0%(+6.99)#58 | 2.1%(+6.86)#1,333 |
| 59. | Palmer Heights | 8.9% | 2.0%(+6.90)#59 | 2.1%(+6.77)#1,361 |
| 60. | Lenkerville | 8.7% | 2.0%(+6.71)#60 | 2.1%(+6.58)#1,422 |
| 61. | Montgomery Borough | 8.7% | 2.0%(+6.65)#61 | 2.1%(+6.53)#1,440 |
| 62. | Aristes | 8.6% | 2.0%(+6.58)#62 | 2.1%(+6.45)#1,455 |
| 63. | Garrett Borough | 8.5% | 2.0%(+6.48)#63 | 2.1%(+6.35)#1,490 |
| 64. | Allenwood | 8.5% | 2.0%(+6.43)#64 | 2.1%(+6.30)#1,503 |
| 65. | Moosic Borough | 8.3% | 2.0%(+6.26)#65 | 2.1%(+6.13)#1,562 |
| 66. | Slabtown | 8.2% | 2.0%(+6.23)#66 | 2.1%(+6.10)#1,574 |
| 67. | Lake Arthur Estates | 8.2% | 2.0%(+6.16)#67 | 2.1%(+6.03)#1,599 |
| 68. | Riverside | 8.0% | 2.0%(+5.95)#68 | 2.1%(+5.82)#1,668 |
| 69. | Tionesta Borough | 7.9% | 2.0%(+5.92)#69 | 2.1%(+5.79)#1,675 |
| 70. | Sandy | 7.9% | 2.0%(+5.90)#70 | 2.1%(+5.77)#1,678 |
| 71. | Cassville Borough | 7.8% | 2.0%(+5.79)#71 | 2.1%(+5.66)#1,725 |
| 72. | Chinchilla | 7.8% | 2.0%(+5.79)#72 | 2.1%(+5.66)#1,726 |
| 73. | Ashville Borough | 7.8% | 2.0%(+5.75)#73 | 2.1%(+5.62)#1,737 |
| 74. | Jamison City | 7.8% | 2.0%(+5.73)#74 | 2.1%(+5.60)#1,743 |
| 75. | Beavertown Borough | 7.6% | 2.0%(+5.54)#75 | 2.1%(+5.41)#1,816 |
| 76. | Loop | 7.5% | 2.0%(+5.52)#76 | 2.1%(+5.39)#1,837 |
| 77. | Wickerham Manor Fisher | 7.5% | 2.0%(+5.47)#77 | 2.1%(+5.34)#1,855 |
| 78. | Dawson Borough | 7.5% | 2.0%(+5.43)#78 | 2.1%(+5.30)#1,877 |
| 79. | Cranesville Borough | 7.3% | 2.0%(+5.28)#79 | 2.1%(+5.15)#1,944 |
| 80. | Coaldale Borough Schuylkill County | 7.2% | 2.0%(+5.21)#80 | 2.1%(+5.08)#1,972 |
| 81. | Springmont | 7.2% | 2.0%(+5.19)#81 | 2.1%(+5.06)#1,977 |
| 82. | Prospect Park Borough | 7.2% | 2.0%(+5.19)#82 | 2.1%(+5.06)#1,979 |
| 83. | University Of Pittsburgh Bradford | 7.2% | 2.0%(+5.18)#83 | 2.1%(+5.05)#1,985 |
| 84. | Dunlevy Borough | 7.2% | 2.0%(+5.16)#84 | 2.1%(+5.03)#1,990 |
| 85. | West Elizabeth Borough | 7.1% | 2.0%(+5.09)#85 | 2.1%(+4.96)#2,016 |
| 86. | New Alexandria Borough | 7.1% | 2.0%(+5.07)#86 | 2.1%(+4.94)#2,029 |
| 87. | Coal Center Borough | 7.1% | 2.0%(+5.04)#87 | 2.1%(+4.91)#2,044 |
| 88. | Sankertown Borough | 7.0% | 2.0%(+5.03)#88 | 2.1%(+4.90)#2,052 |
| 89. | Shanor Northvue | 7.0% | 2.0%(+5.01)#89 | 2.1%(+4.88)#2,060 |
| 90. | Trevose | 7.0% | 2.0%(+5.01)#90 | 2.1%(+4.88)#2,061 |
| 91. | Lansford Borough | 7.0% | 2.0%(+5.01)#91 | 2.1%(+4.88)#2,063 |
| 92. | Jeddo Borough | 7.0% | 2.0%(+5.00)#92 | 2.1%(+4.87)#2,067 |
| 93. | Mount Pleasant Mills | 7.0% | 2.0%(+4.99)#93 | 2.1%(+4.86)#2,072 |
| 94. | Ranshaw | 7.0% | 2.0%(+4.96)#94 | 2.1%(+4.83)#2,087 |
| 95. | Kenmar | 6.9% | 2.0%(+4.93)#95 | 2.1%(+4.80)#2,104 |
| 96. | Mckees Rocks Borough | 6.9% | 2.0%(+4.84)#96 | 2.1%(+4.71)#2,155 |
| 97. | Troutville Borough | 6.8% | 2.0%(+4.83)#97 | 2.1%(+4.70)#2,162 |
| 98. | Oakland Cdp Cambria County | 6.8% | 2.0%(+4.82)#98 | 2.1%(+4.70)#2,164 |
| 99. | Warrior Run Borough | 6.8% | 2.0%(+4.82)#99 | 2.1%(+4.69)#2,168 |
| 100. | Hudson | 6.8% | 2.0%(+4.74)#100 | 2.1%(+4.61)#2,202 |
Common Questions
What are the Top 10 Cities with the Highest Percentage of Population Employed in Security & Protection in Pennsylvania?
Top 10 Cities with the Highest Percentage of Population Employed in Security & Protection in Pennsylvania are:
#1
100.0%
#2
33.8%
#3
23.1%
#4
22.2%
#5
22.2%
#6
20.0%
#7
18.1%
#8
18.0%
#9
17.2%
#10
16.5%
What city has the Highest Percentage of Population Employed in Security & Protection in Pennsylvania?
Baileyville has the Highest Percentage of Population Employed in Security & Protection in Pennsylvania with 100.0%.
What is the Percentage of Population Employed in Security & Protection in the State of Pennsylvania?
Percentage of Population Employed in Security & Protection in Pennsylvania is 2.0%.
What is the Percentage of Population Employed in Security & Protection in the United States?
Percentage of Population Employed in Security & Protection in the United States is 2.1%.