Candlewick Lake, IL
Candlewick Lake Map
Candlewick Lake Overview
5,080
TOTAL POPULATION
2,743
MALE POPULATION
2,337
FEMALE POPULATION
117.37
MALES / 100 FEMALES
85.20
FEMALES / 100 MALES
33.2
MEDIAN AGE
3.9
AVG FAMILY SIZE
3.4
AVG HOUSEHOLD SIZE
$31,430
PER CAPITA INCOME
$112,635
AVG FAMILY INCOME
$107,589
AVG HOUSEHOLD INCOME
40.2%
WAGE / INCOME GAP [ % ]
59.8¢/ $1
WAGE / INCOME GAP [ $ ]
0.33
INEQUALITY / GINI INDEX
2,559
LABOR FORCE [ PEOPLE ]
63.6%
PERCENT IN LABOR FORCE
3.2%
UNEMPLOYMENT RATE
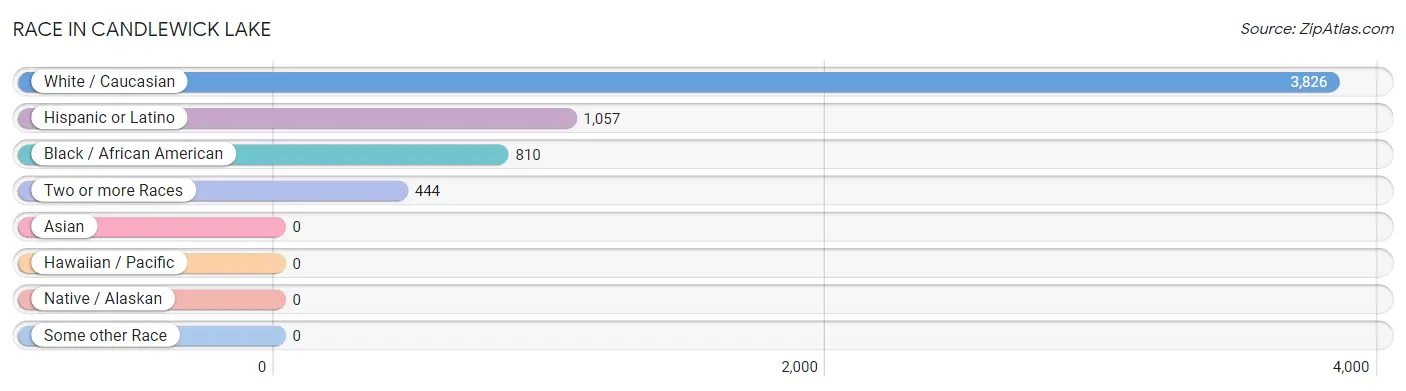
Race in Candlewick Lake
The most populous races in Candlewick Lake are White / Caucasian (3,826 | 75.3%), Hispanic or Latino (1,057 | 20.8%), and Black / African American (810 | 15.9%).
| Race | # Population | % Population |
| Asian | 0 | 0.0% |
| Black / African American | 810 | 15.9% |
| Hawaiian / Pacific | 0 | 0.0% |
| Hispanic or Latino | 1,057 | 20.8% |
| Native / Alaskan | 0 | 0.0% |
| White / Caucasian | 3,826 | 75.3% |
| Two or more Races | 444 | 8.7% |
| Some other Race | 0 | 0.0% |
| Total | 5,080 | 100.0% |
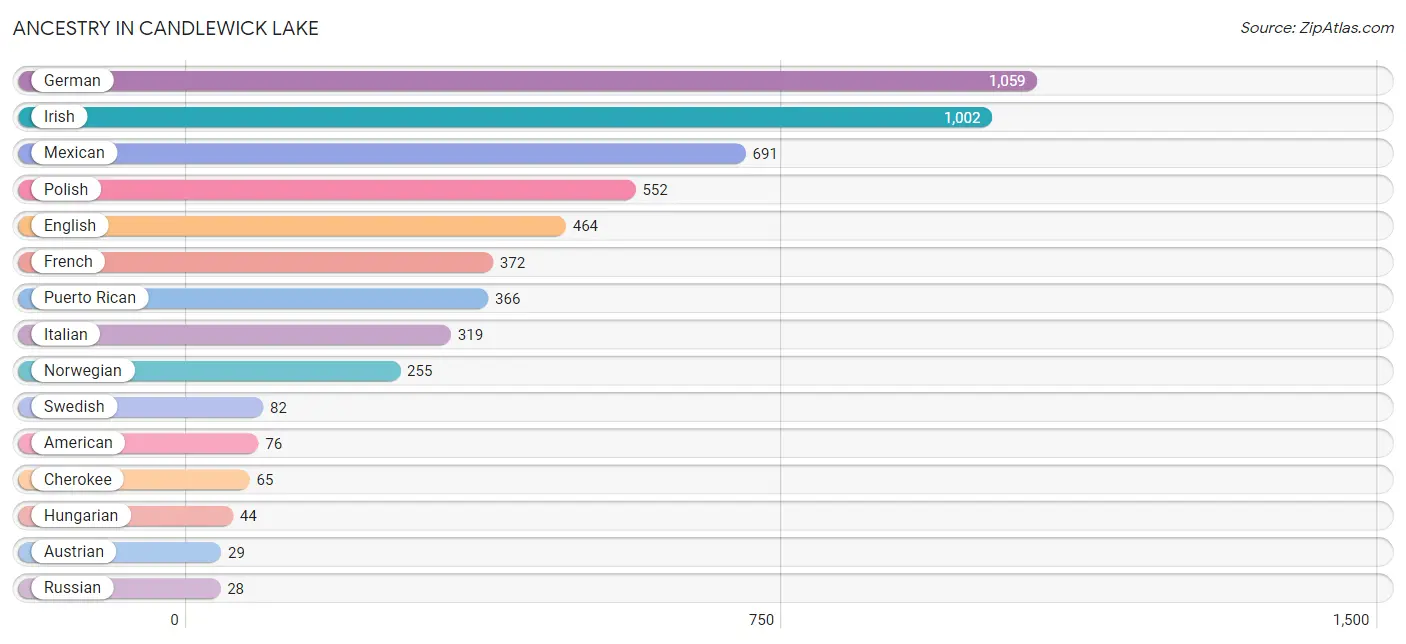
Ancestry in Candlewick Lake
The most populous ancestries reported in Candlewick Lake are German (1,059 | 20.8%), Irish (1,002 | 19.7%), Mexican (691 | 13.6%), Polish (552 | 10.9%), and English (464 | 9.1%), together accounting for 74.2% of all Candlewick Lake residents.
| Ancestry | # Population | % Population |
| American | 76 | 1.5% |
| Austrian | 29 | 0.6% |
| Blackfeet | 23 | 0.4% |
| Cherokee | 65 | 1.3% |
| English | 464 | 9.1% |
| Finnish | 8 | 0.2% |
| French | 372 | 7.3% |
| German | 1,059 | 20.8% |
| Hungarian | 44 | 0.9% |
| Irish | 1,002 | 19.7% |
| Italian | 319 | 6.3% |
| Korean | 16 | 0.3% |
| Mexican | 691 | 13.6% |
| Norwegian | 255 | 5.0% |
| Polish | 552 | 10.9% |
| Puerto Rican | 366 | 7.2% |
| Russian | 28 | 0.5% |
| Swedish | 82 | 1.6% |
| Swiss | 3 | 0.1% | View All 19 Rows |
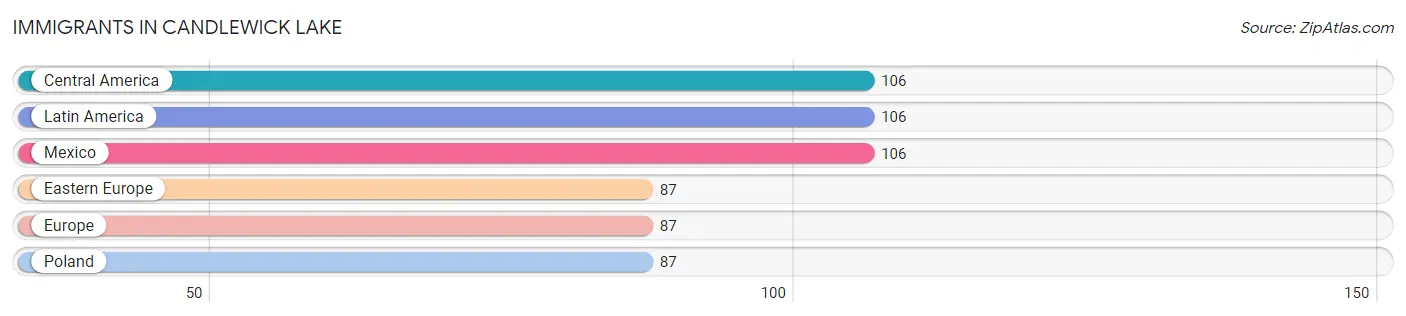
Immigrants in Candlewick Lake
The most numerous immigrant groups reported in Candlewick Lake came from Central America (106 | 2.1%), Latin America (106 | 2.1%), Mexico (106 | 2.1%), Eastern Europe (87 | 1.7%), and Europe (87 | 1.7%), together accounting for 9.7% of all Candlewick Lake residents.
| Immigration Origin | # Population | % Population |
| Central America | 106 | 2.1% |
| Eastern Europe | 87 | 1.7% |
| Europe | 87 | 1.7% |
| Latin America | 106 | 2.1% |
| Mexico | 106 | 2.1% |
| Poland | 87 | 1.7% | View All 6 Rows |
Sex and Age in Candlewick Lake
Sex and Age in Candlewick Lake
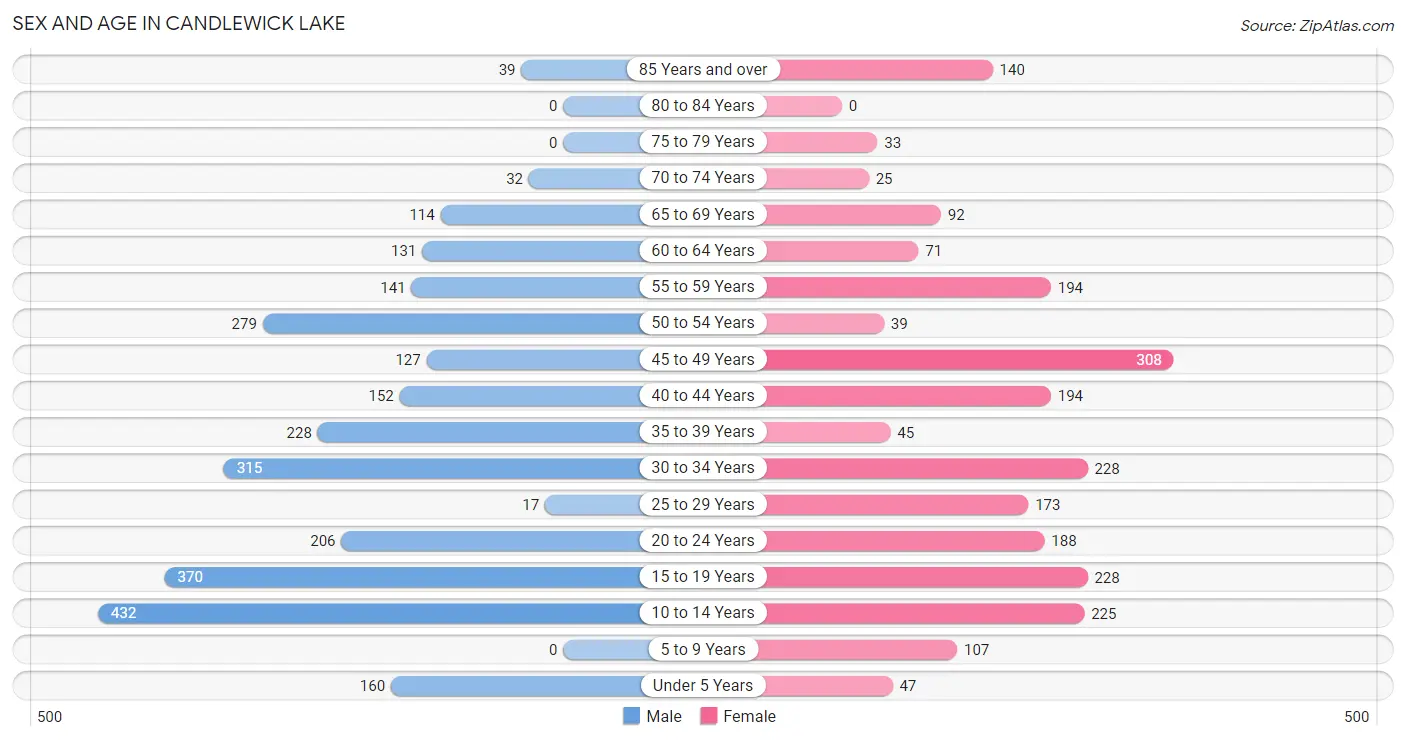
The most populous age groups in Candlewick Lake are 10 to 14 Years (432 | 15.8%) for men and 45 to 49 Years (308 | 13.2%) for women.
| Age Bracket | Male | Female |
| Under 5 Years | 160 (5.8%) | 47 (2.0%) |
| 5 to 9 Years | 0 (0.0%) | 107 (4.6%) |
| 10 to 14 Years | 432 (15.8%) | 225 (9.6%) |
| 15 to 19 Years | 370 (13.5%) | 228 (9.8%) |
| 20 to 24 Years | 206 (7.5%) | 188 (8.0%) |
| 25 to 29 Years | 17 (0.6%) | 173 (7.4%) |
| 30 to 34 Years | 315 (11.5%) | 228 (9.8%) |
| 35 to 39 Years | 228 (8.3%) | 45 (1.9%) |
| 40 to 44 Years | 152 (5.5%) | 194 (8.3%) |
| 45 to 49 Years | 127 (4.6%) | 308 (13.2%) |
| 50 to 54 Years | 279 (10.2%) | 39 (1.7%) |
| 55 to 59 Years | 141 (5.1%) | 194 (8.3%) |
| 60 to 64 Years | 131 (4.8%) | 71 (3.0%) |
| 65 to 69 Years | 114 (4.2%) | 92 (3.9%) |
| 70 to 74 Years | 32 (1.2%) | 25 (1.1%) |
| 75 to 79 Years | 0 (0.0%) | 33 (1.4%) |
| 80 to 84 Years | 0 (0.0%) | 0 (0.0%) |
| 85 Years and over | 39 (1.4%) | 140 (6.0%) |
| Total | 2,743 (100.0%) | 2,337 (100.0%) |
Families and Households in Candlewick Lake
Median Family Size in Candlewick Lake
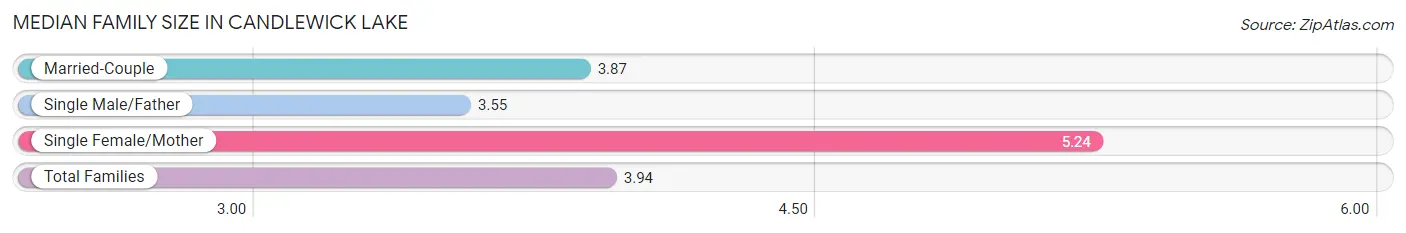
The median family size in Candlewick Lake is 3.94 persons per family, with single female/mother families (91 | 7.9%) accounting for the largest median family size of 5.24 persons per family. On the other hand, single male/father families (126 | 11.0%) represent the smallest median family size with 3.55 persons per family.
| Family Type | # Families | Family Size |
| Married-Couple | 929 (81.1%) | 3.87 |
| Single Male/Father | 126 (11.0%) | 3.55 |
| Single Female/Mother | 91 (7.9%) | 5.24 |
| Total Families | 1,146 (100.0%) | 3.94 |
Median Household Size in Candlewick Lake
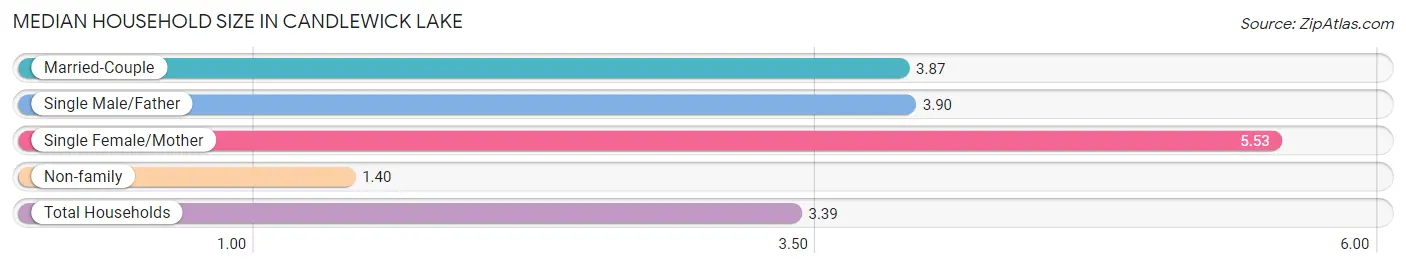
The median household size in Candlewick Lake is 3.39 persons per household, with single female/mother households (91 | 6.1%) accounting for the largest median household size of 5.53 persons per household. non-family households (353 | 23.5%) represent the smallest median household size with 1.40 persons per household.
| Household Type | # Households | Household Size |
| Married-Couple | 929 (62.0%) | 3.87 |
| Single Male/Father | 126 (8.4%) | 3.90 |
| Single Female/Mother | 91 (6.1%) | 5.53 |
| Non-family | 353 (23.5%) | 1.40 |
| Total Households | 1,499 (100.0%) | 3.39 |
Household Size by Marriage Status in Candlewick Lake
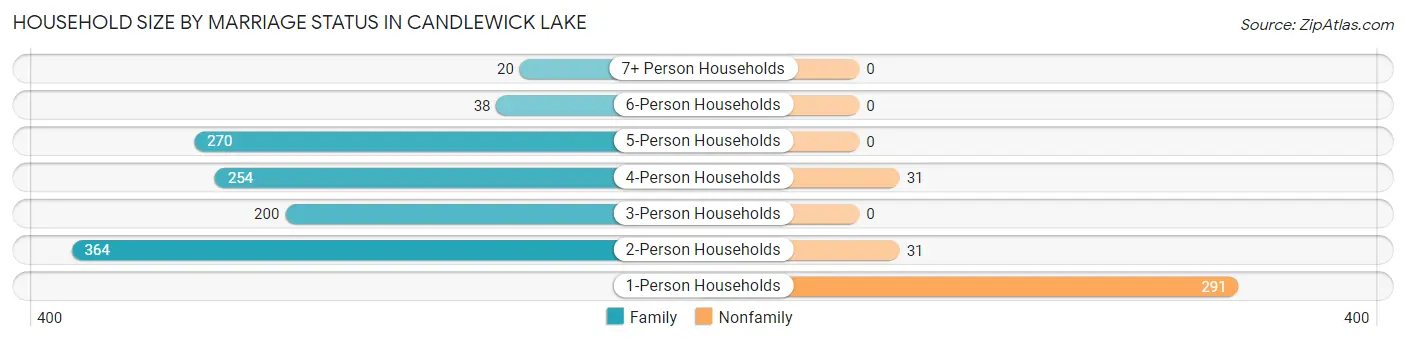
Out of a total of 1,499 households in Candlewick Lake, 1,146 (76.4%) are family households, while 353 (23.5%) are nonfamily households. The most numerous type of family households are 2-person households, comprising 364, and the most common type of nonfamily households are 1-person households, comprising 291.
| Household Size | Family Households | Nonfamily Households |
| 1-Person Households | - | 291 (19.4%) |
| 2-Person Households | 364 (24.3%) | 31 (2.1%) |
| 3-Person Households | 200 (13.3%) | 0 (0.0%) |
| 4-Person Households | 254 (16.9%) | 31 (2.1%) |
| 5-Person Households | 270 (18.0%) | 0 (0.0%) |
| 6-Person Households | 38 (2.5%) | 0 (0.0%) |
| 7+ Person Households | 20 (1.3%) | 0 (0.0%) |
| Total | 1,146 (76.4%) | 353 (23.5%) |
Female Fertility in Candlewick Lake
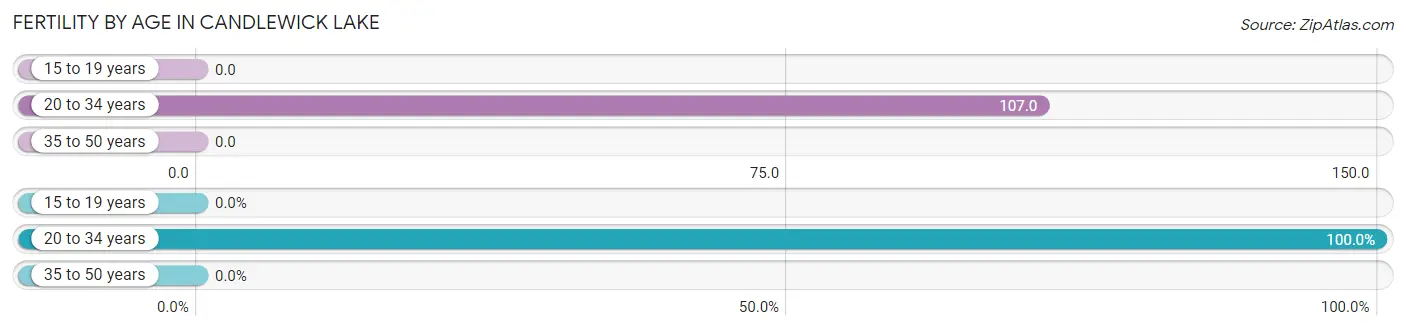
Fertility by Age in Candlewick Lake
Average fertility rate in Candlewick Lake is 46.0 births per 1,000 women. Women in the age bracket of 20 to 34 years have the highest fertility rate with 107.0 births per 1,000 women. Women in the age bracket of 20 to 34 years acount for 100.0% of all women with births.
| Age Bracket | Women with Births | Births / 1,000 Women |
| 15 to 19 years | 0 (0.0%) | 0.0 |
| 20 to 34 years | 63 (100.0%) | 107.0 |
| 35 to 50 years | 0 (0.0%) | 0.0 |
| Total | 63 (100.0%) | 46.0 |
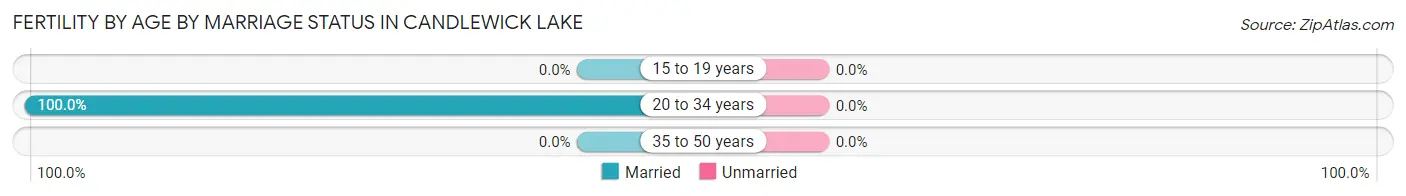
Fertility by Age by Marriage Status in Candlewick Lake
| Age Bracket | Married | Unmarried |
| 15 to 19 years | 0 (0.0%) | 0 (0.0%) |
| 20 to 34 years | 63 (100.0%) | 0 (0.0%) |
| 35 to 50 years | 0 (0.0%) | 0 (0.0%) |
| Total | 63 (100.0%) | 0 (0.0%) |
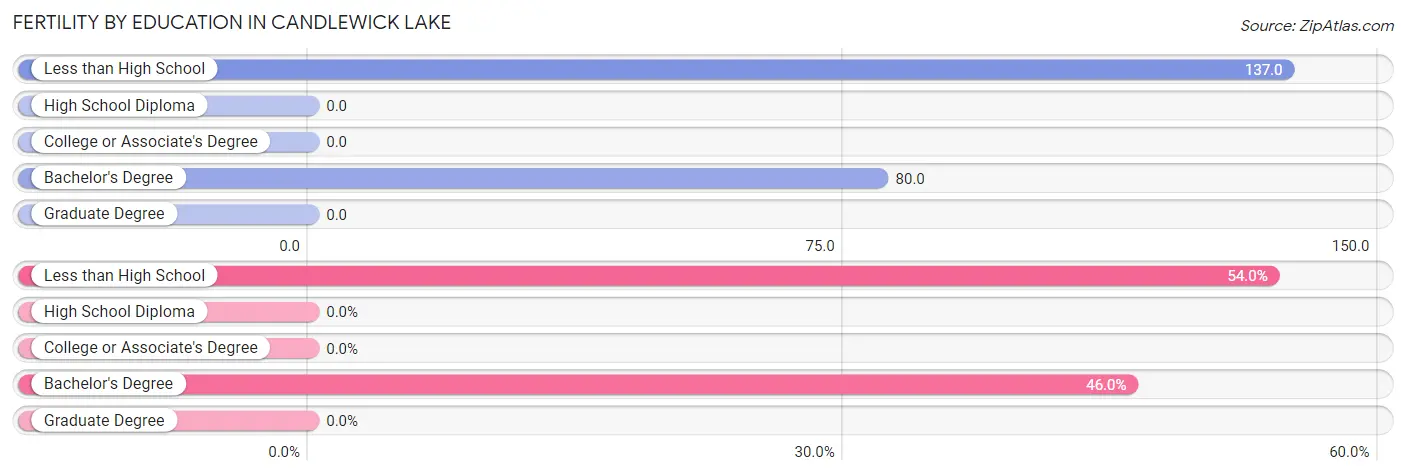
Fertility by Education in Candlewick Lake
| Educational Attainment | Women with Births | Births / 1,000 Women |
| Less than High School | 34 (54.0%) | 137.0 |
| High School Diploma | 0 (0.0%) | 0.0 |
| College or Associate's Degree | 0 (0.0%) | 0.0 |
| Bachelor's Degree | 29 (46.0%) | 80.0 |
| Graduate Degree | 0 (0.0%) | 0.0 |
| Total | 63 (100.0%) | 46.0 |
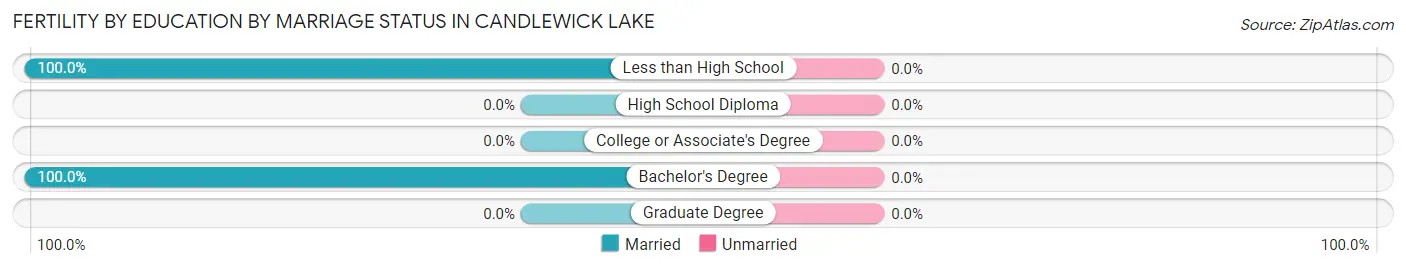
Fertility by Education by Marriage Status in Candlewick Lake
| Educational Attainment | Married | Unmarried |
| Less than High School | 34 (100.0%) | 0 (0.0%) |
| High School Diploma | 0 (0.0%) | 0 (0.0%) |
| College or Associate's Degree | 0 (0.0%) | 0 (0.0%) |
| Bachelor's Degree | 29 (100.0%) | 0 (0.0%) |
| Graduate Degree | 0 (0.0%) | 0 (0.0%) |
| Total | 63 (100.0%) | 0 (0.0%) |
Income in Candlewick Lake
Income Overview in Candlewick Lake
Per Capita Income in Candlewick Lake is $31,430, while median incomes of families and households are $112,635 and $107,589 respectively.
| Characteristic | Number | Measure |
| Per Capita Income | 5,080 | $31,430 |
| Median Family Income | 1,146 | $112,635 |
| Mean Family Income | 1,146 | $102,456 |
| Median Household Income | 1,499 | $107,589 |
| Mean Household Income | 1,499 | $100,417 |
| Income Deficit | 1,146 | $0 |
| Wage / Income Gap (%) | 5,080 | 40.16% |
| Wage / Income Gap ($) | 5,080 | 59.84¢ per $1 |
| Gini / Inequality Index | 5,080 | 0.33 |
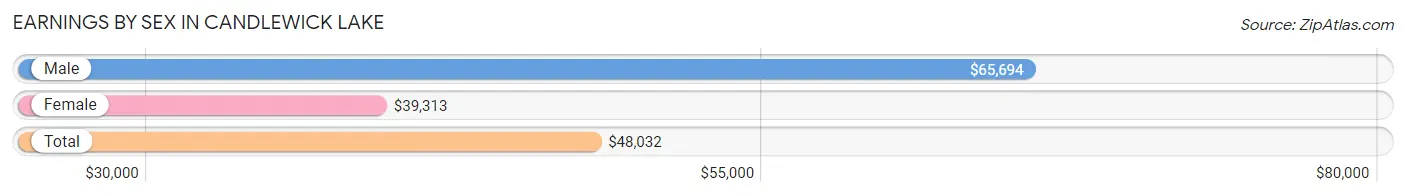
Earnings by Sex in Candlewick Lake
Average Earnings in Candlewick Lake are $48,032, $65,694 for men and $39,313 for women, a difference of 40.2%.
| Sex | Number | Average Earnings |
| Male | 1,419 (53.1%) | $65,694 |
| Female | 1,254 (46.9%) | $39,313 |
| Total | 2,673 (100.0%) | $48,032 |
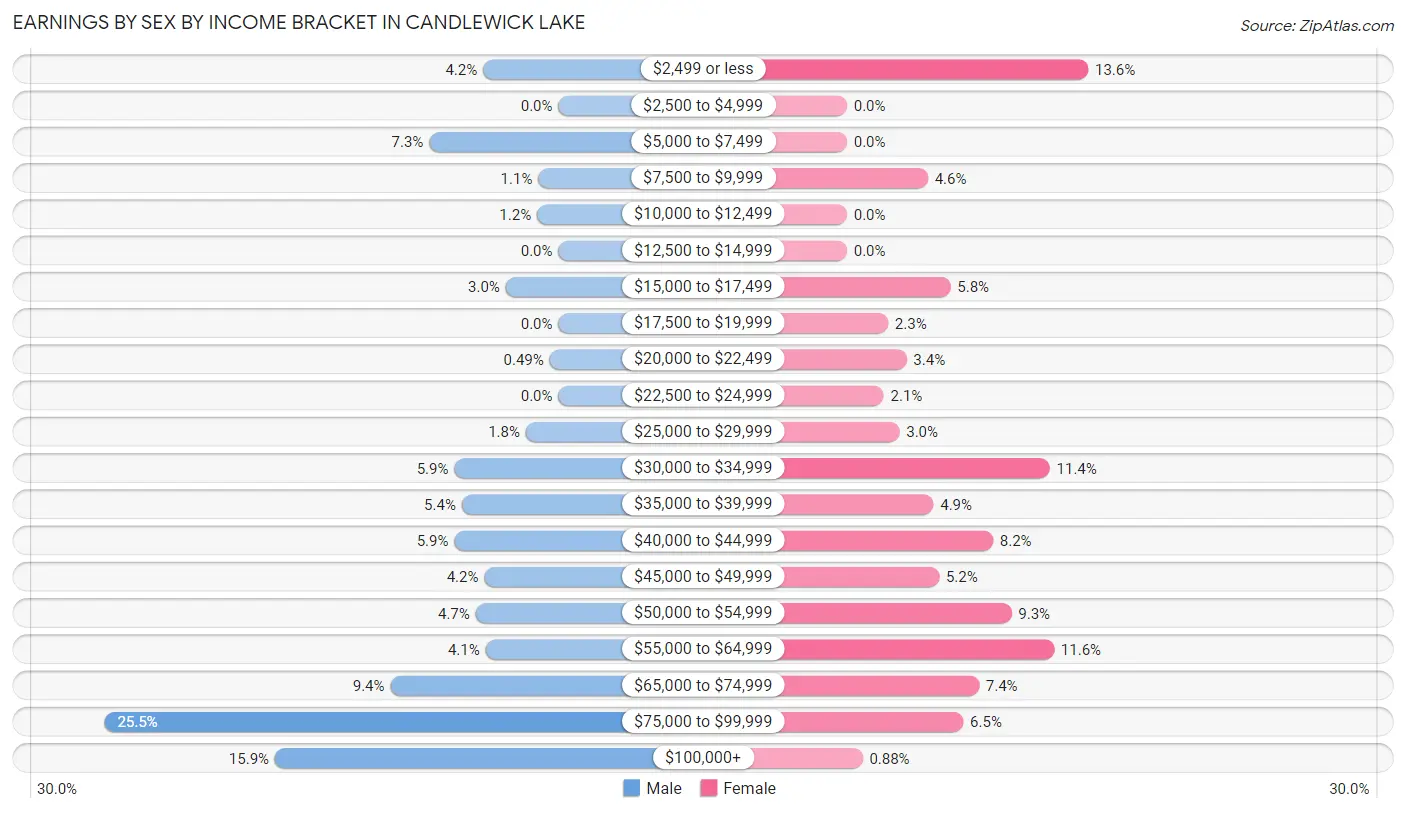
Earnings by Sex by Income Bracket in Candlewick Lake
The most common earnings brackets in Candlewick Lake are $75,000 to $99,999 for men (362 | 25.5%) and $2,499 or less for women (170 | 13.6%).
| Income | Male | Female |
| $2,499 or less | 60 (4.2%) | 170 (13.6%) |
| $2,500 to $4,999 | 0 (0.0%) | 0 (0.0%) |
| $5,000 to $7,499 | 103 (7.3%) | 0 (0.0%) |
| $7,500 to $9,999 | 16 (1.1%) | 57 (4.5%) |
| $10,000 to $12,499 | 17 (1.2%) | 0 (0.0%) |
| $12,500 to $14,999 | 0 (0.0%) | 0 (0.0%) |
| $15,000 to $17,499 | 42 (3.0%) | 73 (5.8%) |
| $17,500 to $19,999 | 0 (0.0%) | 29 (2.3%) |
| $20,000 to $22,499 | 7 (0.5%) | 42 (3.4%) |
| $22,500 to $24,999 | 0 (0.0%) | 26 (2.1%) |
| $25,000 to $29,999 | 26 (1.8%) | 37 (2.9%) |
| $30,000 to $34,999 | 83 (5.9%) | 143 (11.4%) |
| $35,000 to $39,999 | 77 (5.4%) | 61 (4.9%) |
| $40,000 to $44,999 | 83 (5.9%) | 103 (8.2%) |
| $45,000 to $49,999 | 59 (4.2%) | 65 (5.2%) |
| $50,000 to $54,999 | 66 (4.6%) | 116 (9.2%) |
| $55,000 to $64,999 | 58 (4.1%) | 146 (11.6%) |
| $65,000 to $74,999 | 134 (9.4%) | 93 (7.4%) |
| $75,000 to $99,999 | 362 (25.5%) | 82 (6.5%) |
| $100,000+ | 226 (15.9%) | 11 (0.9%) |
| Total | 1,419 (100.0%) | 1,254 (100.0%) |
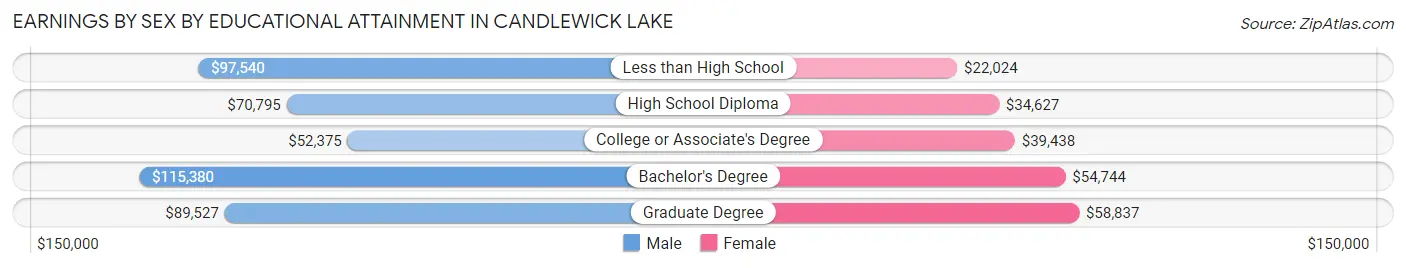
Earnings by Sex by Educational Attainment in Candlewick Lake
Average earnings in Candlewick Lake are $73,750 for men and $47,569 for women, a difference of 35.5%. Men with an educational attainment of bachelor's degree enjoy the highest average annual earnings of $115,380, while those with college or associate's degree education earn the least with $52,375. Women with an educational attainment of graduate degree earn the most with the average annual earnings of $58,837, while those with less than high school education have the smallest earnings of $22,024.
| Educational Attainment | Male Income | Female Income |
| Less than High School | $97,540 | $22,024 |
| High School Diploma | $70,795 | $34,627 |
| College or Associate's Degree | $52,375 | $39,438 |
| Bachelor's Degree | $115,380 | $54,744 |
| Graduate Degree | $89,527 | $58,837 |
| Total | $73,750 | $47,569 |
Family Income in Candlewick Lake
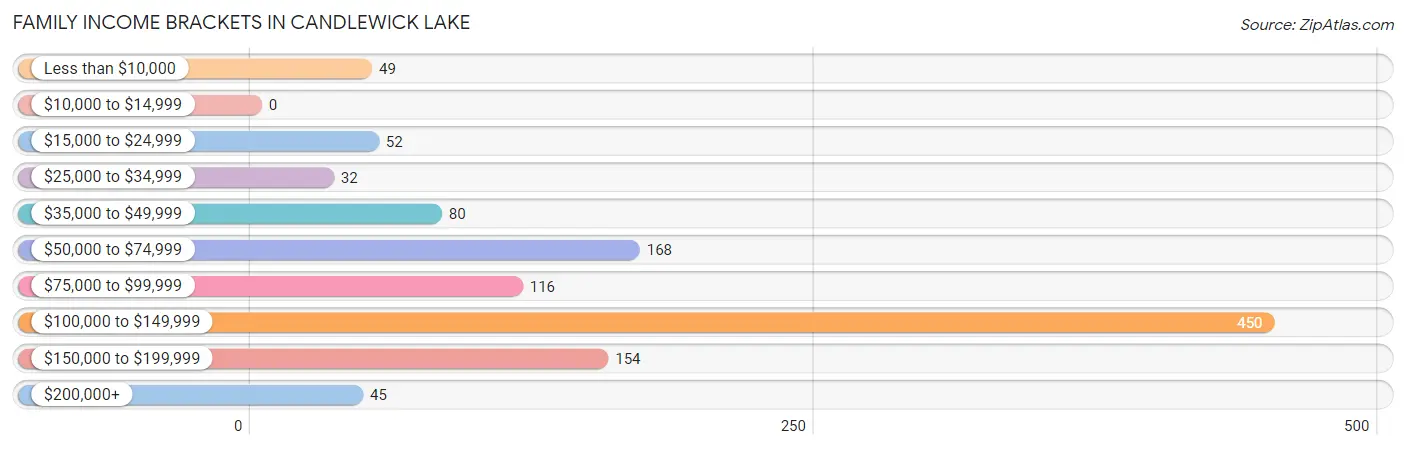
Family Income Brackets in Candlewick Lake
According to the Candlewick Lake family income data, there are 450 families falling into the $100,000 to $149,999 income range, which is the most common income bracket and makes up 39.3% of all families.
| Income Bracket | # Families | % Families |
| Less than $10,000 | 49 | 4.3% |
| $10,000 to $14,999 | 0 | 0.0% |
| $15,000 to $24,999 | 52 | 4.5% |
| $25,000 to $34,999 | 32 | 2.8% |
| $35,000 to $49,999 | 80 | 7.0% |
| $50,000 to $74,999 | 168 | 14.7% |
| $75,000 to $99,999 | 116 | 10.1% |
| $100,000 to $149,999 | 450 | 39.3% |
| $150,000 to $199,999 | 154 | 13.4% |
| $200,000+ | 45 | 3.9% |
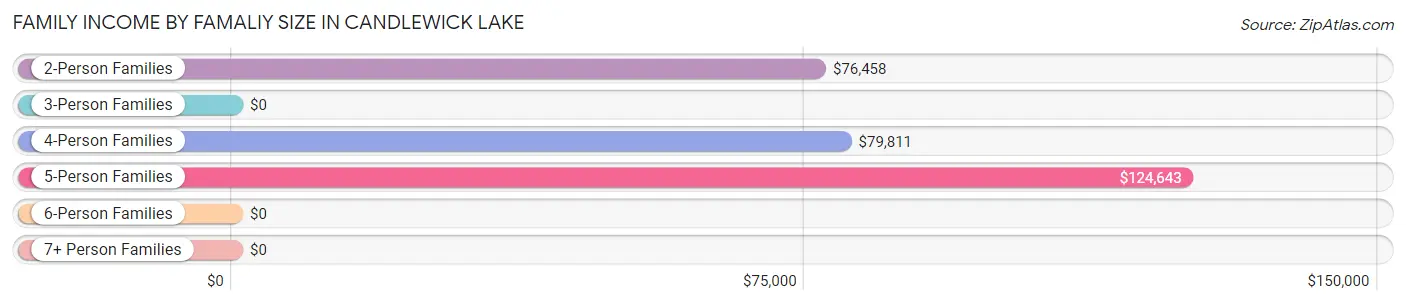
Family Income by Famaliy Size in Candlewick Lake
5-person families (228 | 19.9%) account for the highest median family income in Candlewick Lake with $124,643 per family, while 2-person families (364 | 31.8%) have the highest median income of $38,229 per family member.
| Income Bracket | # Families | Median Income |
| 2-Person Families | 364 (31.8%) | $76,458 |
| 3-Person Families | 213 (18.6%) | $0 |
| 4-Person Families | 283 (24.7%) | $79,811 |
| 5-Person Families | 228 (19.9%) | $124,643 |
| 6-Person Families | 38 (3.3%) | $0 |
| 7+ Person Families | 20 (1.8%) | $0 |
| Total | 1,146 (100.0%) | $112,635 |
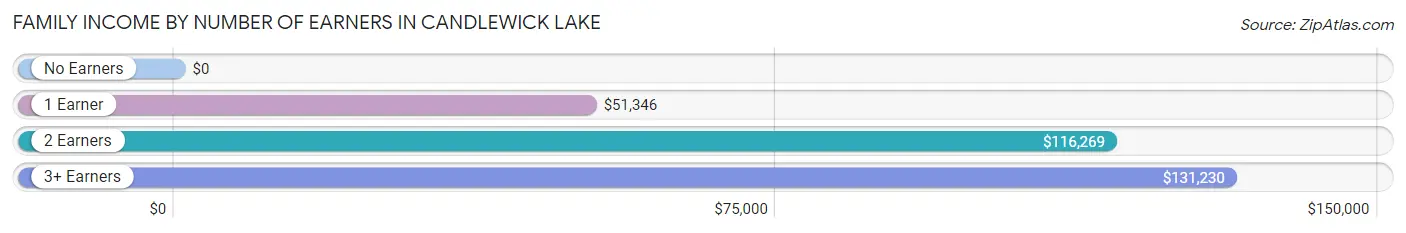
Family Income by Number of Earners in Candlewick Lake
| Number of Earners | # Families | Median Income |
| No Earners | 119 (10.4%) | $0 |
| 1 Earner | 252 (22.0%) | $51,346 |
| 2 Earners | 490 (42.8%) | $116,269 |
| 3+ Earners | 285 (24.9%) | $131,230 |
| Total | 1,146 (100.0%) | $112,635 |
Household Income in Candlewick Lake
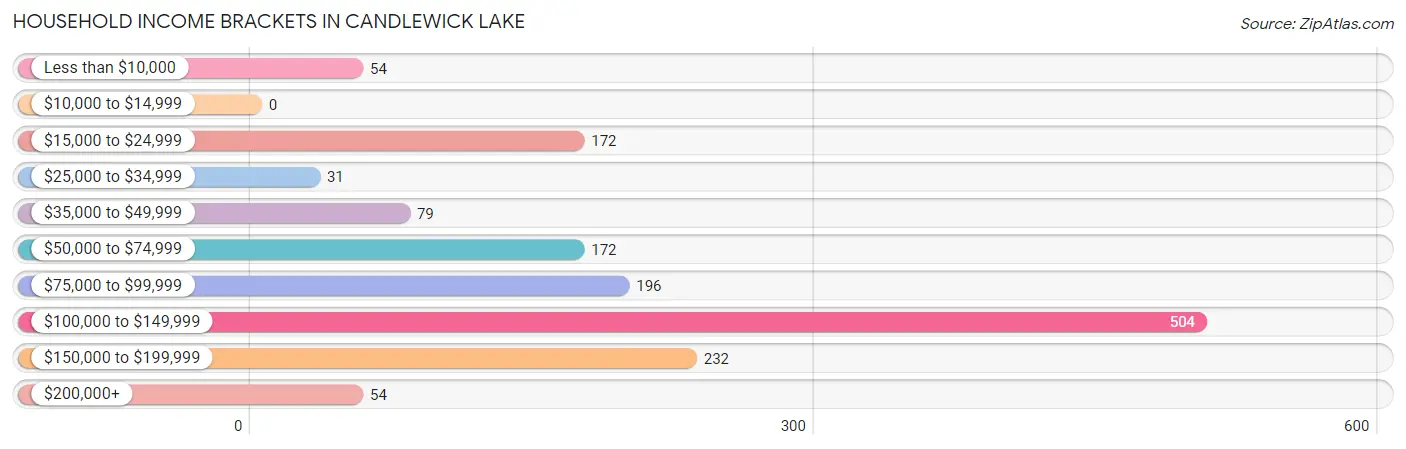
Household Income Brackets in Candlewick Lake
With 504 households falling in the category, the $100,000 to $149,999 income range is the most frequent in Candlewick Lake, accounting for 33.6% of all households.
| Income Bracket | # Households | % Households |
| Less than $10,000 | 54 | 3.6% |
| $10,000 to $14,999 | 0 | 0.0% |
| $15,000 to $24,999 | 172 | 11.5% |
| $25,000 to $34,999 | 31 | 2.1% |
| $35,000 to $49,999 | 79 | 5.3% |
| $50,000 to $74,999 | 172 | 11.5% |
| $75,000 to $99,999 | 196 | 13.1% |
| $100,000 to $149,999 | 504 | 33.6% |
| $150,000 to $199,999 | 232 | 15.5% |
| $200,000+ | 54 | 3.6% |
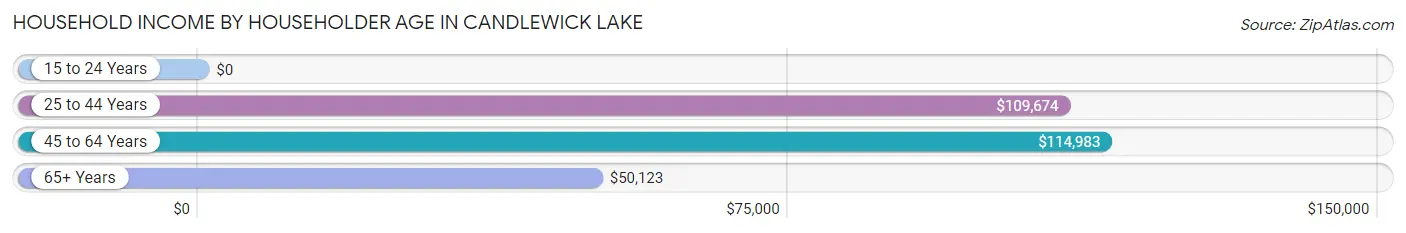
Household Income by Householder Age in Candlewick Lake
The median household income in Candlewick Lake is $107,589, with the highest median household income of $114,983 found in the 45 to 64 years age bracket for the primary householder. A total of 547 households (36.5%) fall into this category.
| Income Bracket | # Households | Median Income |
| 15 to 24 Years | 0 (0.0%) | $0 |
| 25 to 44 Years | 602 (40.2%) | $109,674 |
| 45 to 64 Years | 547 (36.5%) | $114,983 |
| 65+ Years | 350 (23.4%) | $50,123 |
| Total | 1,499 (100.0%) | $107,589 |
Poverty in Candlewick Lake
Income Below Poverty by Sex and Age in Candlewick Lake
With 7.2% poverty level for males and 4.8% for females among the residents of Candlewick Lake, 15 year old males and 12 to 14 year old females are the most vulnerable to poverty, with 28 males (43.1%) and 42 females (30.7%) in their respective age groups living below the poverty level.
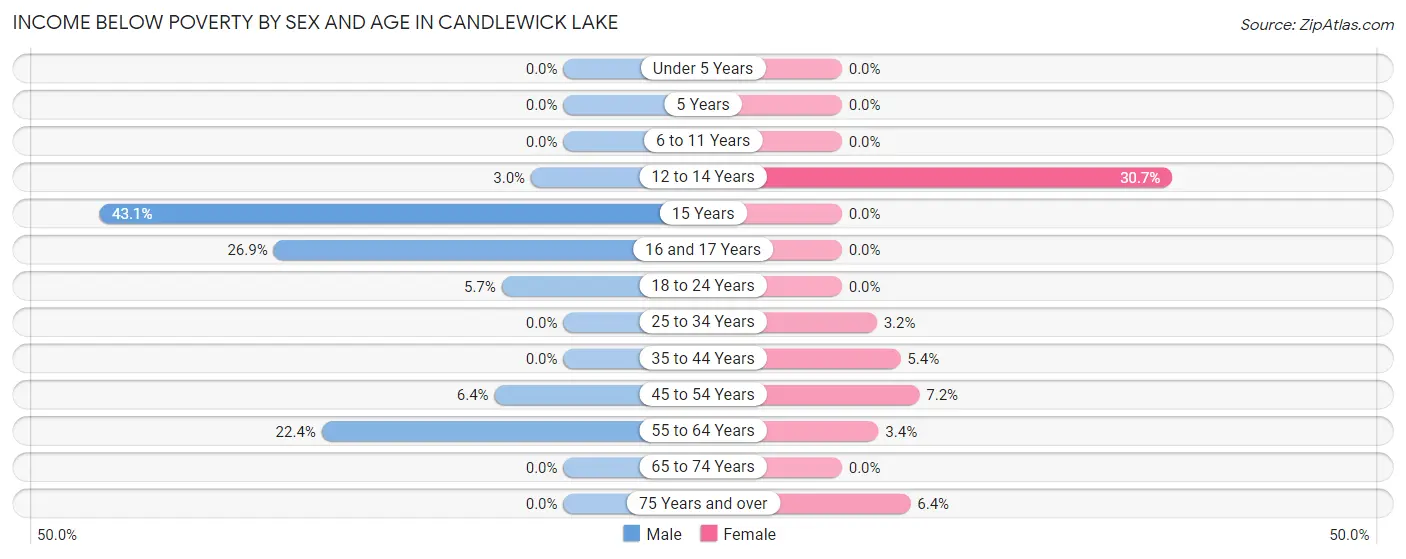
| Age Bracket | Male | Female |
| Under 5 Years | 0 (0.0%) | 0 (0.0%) |
| 5 Years | 0 (0.0%) | 0 (0.0%) |
| 6 to 11 Years | 0 (0.0%) | 0 (0.0%) |
| 12 to 14 Years | 13 (3.0%) | 42 (30.7%) |
| 15 Years | 28 (43.1%) | 0 (0.0%) |
| 16 and 17 Years | 53 (26.9%) | 0 (0.0%) |
| 18 to 24 Years | 18 (5.7%) | 0 (0.0%) |
| 25 to 34 Years | 0 (0.0%) | 13 (3.2%) |
| 35 to 44 Years | 0 (0.0%) | 13 (5.4%) |
| 45 to 54 Years | 26 (6.4%) | 25 (7.2%) |
| 55 to 64 Years | 61 (22.4%) | 9 (3.4%) |
| 65 to 74 Years | 0 (0.0%) | 0 (0.0%) |
| 75 Years and over | 0 (0.0%) | 11 (6.4%) |
| Total | 199 (7.2%) | 113 (4.8%) |
Income Above Poverty by Sex and Age in Candlewick Lake
According to the poverty statistics in Candlewick Lake, males aged under 5 years and females aged under 5 years are the age groups that are most secure financially, with 100.0% of males and 100.0% of females in these age groups living above the poverty line.
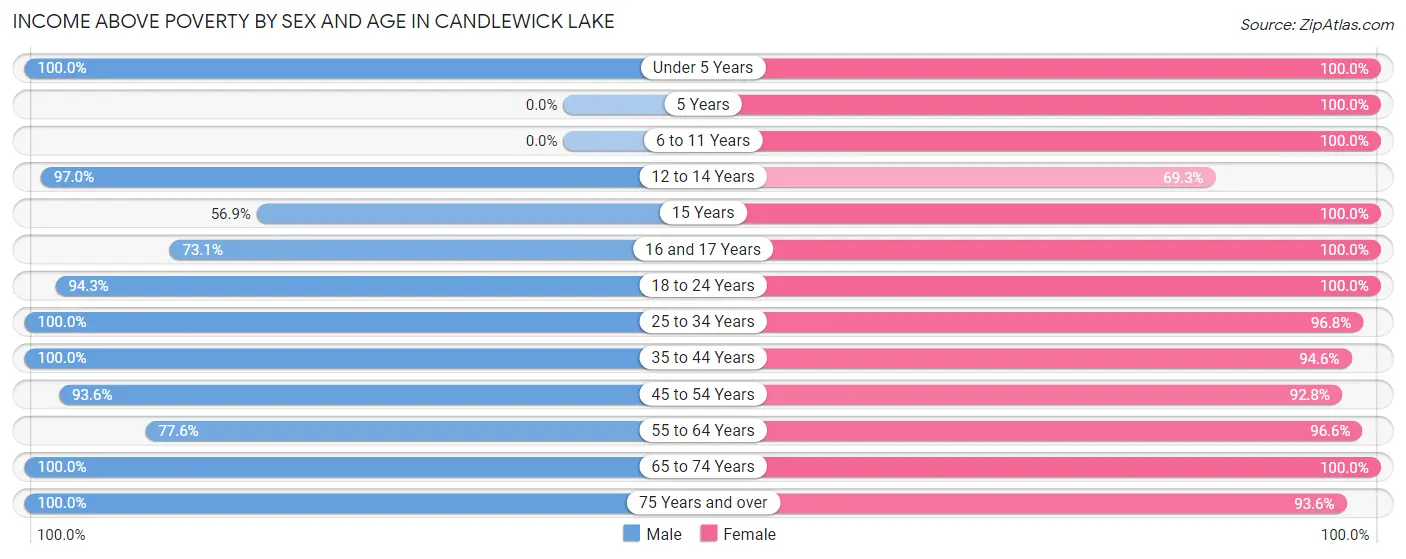
| Age Bracket | Male | Female |
| Under 5 Years | 160 (100.0%) | 47 (100.0%) |
| 5 Years | 0 (0.0%) | 18 (100.0%) |
| 6 to 11 Years | 0 (0.0%) | 177 (100.0%) |
| 12 to 14 Years | 419 (97.0%) | 95 (69.3%) |
| 15 Years | 37 (56.9%) | 20 (100.0%) |
| 16 and 17 Years | 144 (73.1%) | 84 (100.0%) |
| 18 to 24 Years | 296 (94.3%) | 312 (100.0%) |
| 25 to 34 Years | 332 (100.0%) | 388 (96.8%) |
| 35 to 44 Years | 380 (100.0%) | 226 (94.6%) |
| 45 to 54 Years | 380 (93.6%) | 322 (92.8%) |
| 55 to 64 Years | 211 (77.6%) | 256 (96.6%) |
| 65 to 74 Years | 146 (100.0%) | 117 (100.0%) |
| 75 Years and over | 39 (100.0%) | 162 (93.6%) |
| Total | 2,544 (92.7%) | 2,224 (95.2%) |
Income Below Poverty Among Married-Couple Families in Candlewick Lake
The poverty statistics for married-couple families in Candlewick Lake show that 3.1% or 29 of the total 929 families live below the poverty line. Families with no children have the highest poverty rate of 5.8%, comprising of 29 families. On the other hand, families with 1 or 2 children have the lowest poverty rate of 0.0%, which includes 0 families.
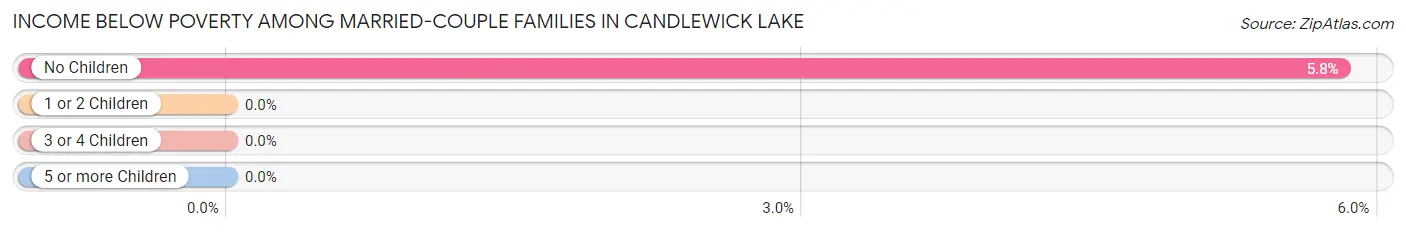
| Children | Above Poverty | Below Poverty |
| No Children | 470 (94.2%) | 29 (5.8%) |
| 1 or 2 Children | 351 (100.0%) | 0 (0.0%) |
| 3 or 4 Children | 79 (100.0%) | 0 (0.0%) |
| 5 or more Children | 0 (0.0%) | 0 (0.0%) |
| Total | 900 (96.9%) | 29 (3.1%) |
Income Below Poverty Among Single-Parent Households in Candlewick Lake
According to the poverty data in Candlewick Lake, 40.5% or 51 single-father households and 22.0% or 20 single-mother households are living below the poverty line. Among single-father households, those with 1 or 2 children have the highest poverty rate, with 51 households (60.7%) experiencing poverty. Likewise, among single-mother households, those with 1 or 2 children have the highest poverty rate, with 13 households (100.0%) falling below the poverty line.
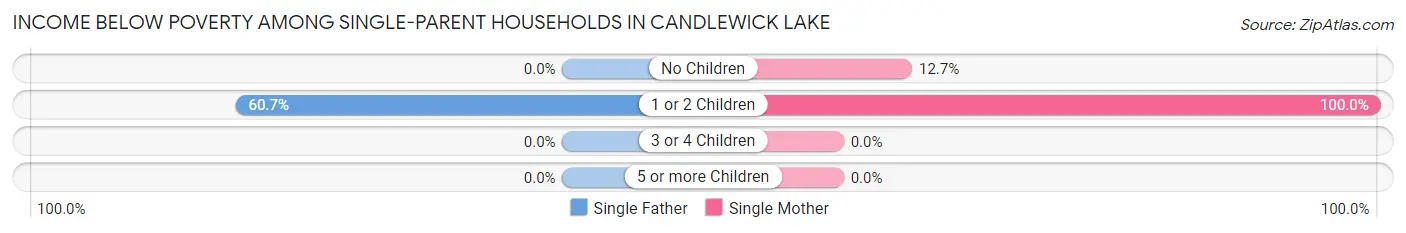
| Children | Single Father | Single Mother |
| No Children | 0 (0.0%) | 7 (12.7%) |
| 1 or 2 Children | 51 (60.7%) | 13 (100.0%) |
| 3 or 4 Children | 0 (0.0%) | 0 (0.0%) |
| 5 or more Children | 0 (0.0%) | 0 (0.0%) |
| Total | 51 (40.5%) | 20 (22.0%) |
Income Below Poverty Among Married-Couple vs Single-Parent Households in Candlewick Lake
The poverty data for Candlewick Lake shows that 29 of the married-couple family households (3.1%) and 71 of the single-parent households (32.7%) are living below the poverty level. Within the married-couple family households, those with no children have the highest poverty rate, with 29 households (5.8%) falling below the poverty line. Among the single-parent households, those with 1 or 2 children have the highest poverty rate, with 64 household (66.0%) living below poverty.
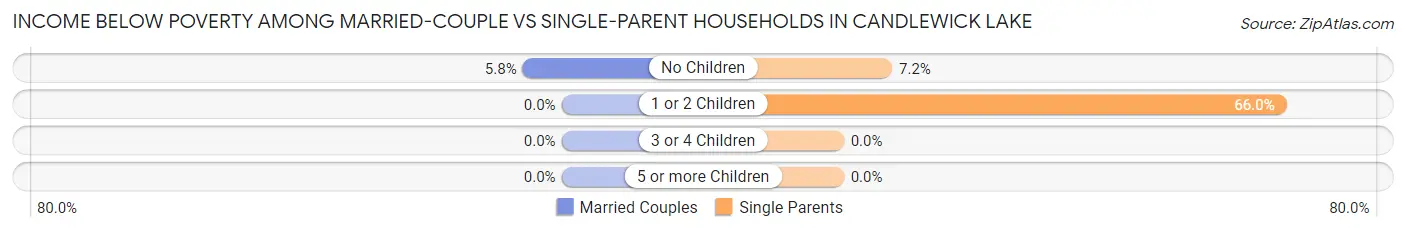
| Children | Married-Couple Families | Single-Parent Households |
| No Children | 29 (5.8%) | 7 (7.2%) |
| 1 or 2 Children | 0 (0.0%) | 64 (66.0%) |
| 3 or 4 Children | 0 (0.0%) | 0 (0.0%) |
| 5 or more Children | 0 (0.0%) | 0 (0.0%) |
| Total | 29 (3.1%) | 71 (32.7%) |
Employment Characteristics in Candlewick Lake
Employment by Class of Employer in Candlewick Lake
Among the 2,403 employed individuals in Candlewick Lake, private company employees (1,695 | 70.5%), local government employees (317 | 13.2%), and state government employees (116 | 4.8%) make up the most common classes of employment.
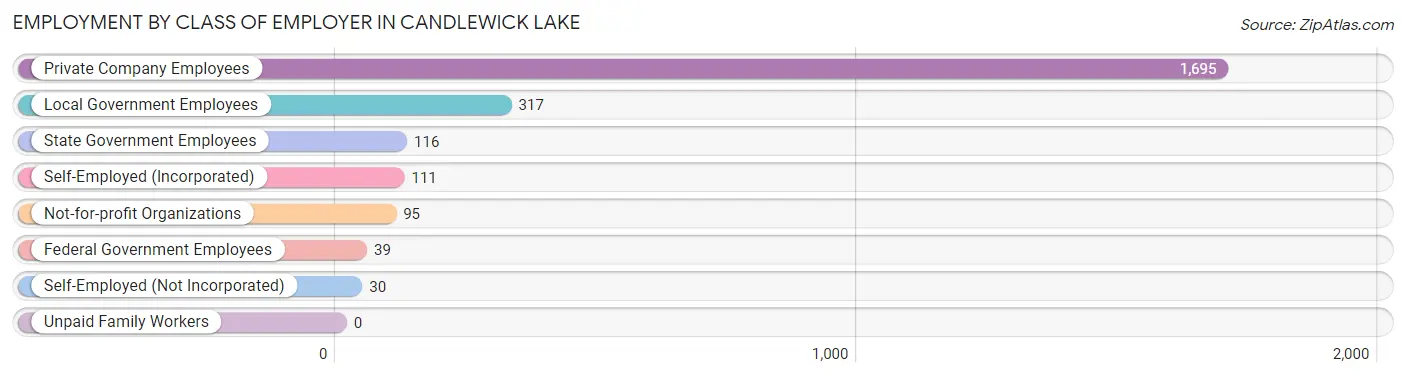
| Employer Class | # Employees | % Employees |
| Private Company Employees | 1,695 | 70.5% |
| Self-Employed (Incorporated) | 111 | 4.6% |
| Self-Employed (Not Incorporated) | 30 | 1.3% |
| Not-for-profit Organizations | 95 | 4.0% |
| Local Government Employees | 317 | 13.2% |
| State Government Employees | 116 | 4.8% |
| Federal Government Employees | 39 | 1.6% |
| Unpaid Family Workers | 0 | 0.0% |
| Total | 2,403 | 100.0% |
Employment Status by Age in Candlewick Lake
According to the labor force statistics for Candlewick Lake, out of the total population over 16 years of age (4,024), 63.6% or 2,559 individuals are in the labor force, with 3.2% or 82 of them unemployed. The age group with the highest labor force participation rate is 30 to 34 years, with 92.3% or 501 individuals in the labor force. Within the labor force, the 60 to 64 years age range has the highest percentage of unemployed individuals, with 10.4% or 10 of them being unemployed.
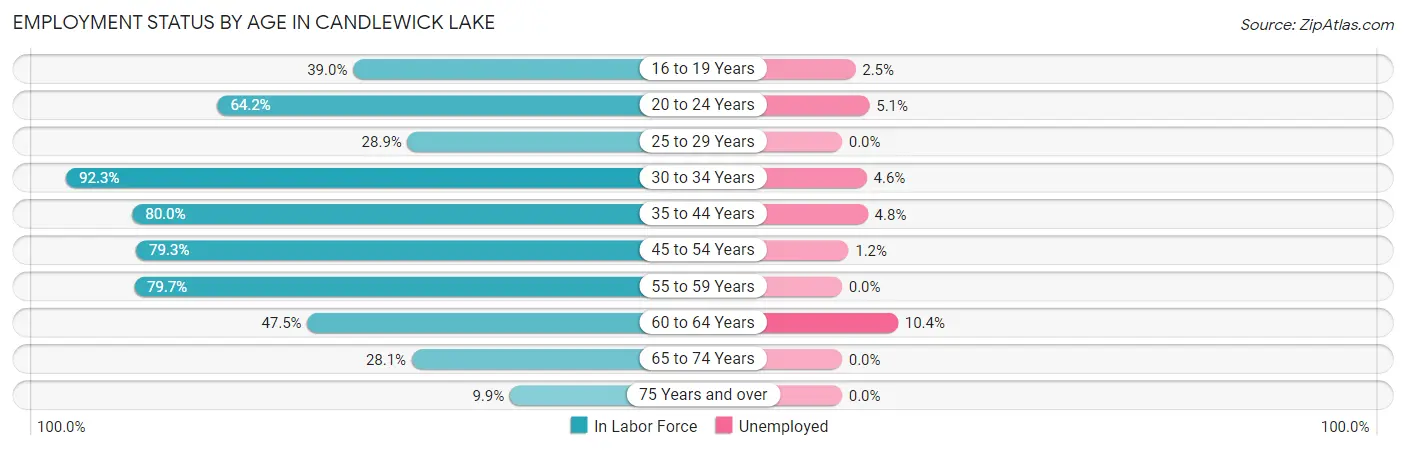
| Age Bracket | In Labor Force | Unemployed |
| 16 to 19 Years | 200 (39.0%) | 5 (2.5%) |
| 20 to 24 Years | 253 (64.2%) | 13 (5.1%) |
| 25 to 29 Years | 55 (28.9%) | 0 (0.0%) |
| 30 to 34 Years | 501 (92.3%) | 23 (4.6%) |
| 35 to 44 Years | 495 (80.0%) | 24 (4.8%) |
| 45 to 54 Years | 597 (79.3%) | 7 (1.2%) |
| 55 to 59 Years | 267 (79.7%) | 0 (0.0%) |
| 60 to 64 Years | 96 (47.5%) | 10 (10.4%) |
| 65 to 74 Years | 74 (28.1%) | 0 (0.0%) |
| 75 Years and over | 21 (9.9%) | 0 (0.0%) |
| Total | 2,559 (63.6%) | 82 (3.2%) |
Employment Status by Educational Attainment in Candlewick Lake
According to labor force statistics for Candlewick Lake, 76.1% of individuals (2,011) out of the total population between 25 and 64 years of age (2,642) are in the labor force, with 3.2% or 64 of them being unemployed. The group with the highest labor force participation rate are those with the educational attainment of high school diploma, with 78.0% or 546 individuals in the labor force. Within the labor force, individuals with less than high school education have the highest percentage of unemployment, with 18.6% or 24 of them being unemployed.
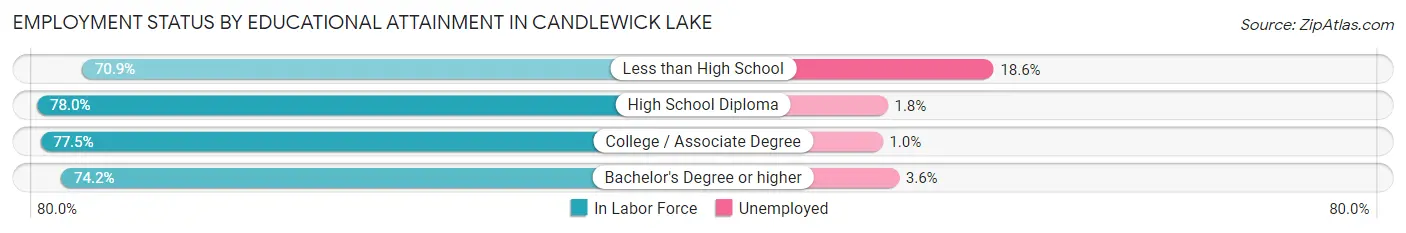
| Educational Attainment | In Labor Force | Unemployed |
| Less than High School | 129 (70.9%) | 34 (18.6%) |
| High School Diploma | 546 (78.0%) | 13 (1.8%) |
| College / Associate Degree | 700 (77.5%) | 9 (1.0%) |
| Bachelor's Degree or higher | 636 (74.2%) | 31 (3.6%) |
| Total | 2,011 (76.1%) | 85 (3.2%) |
Employment Occupations by Sex in Candlewick Lake
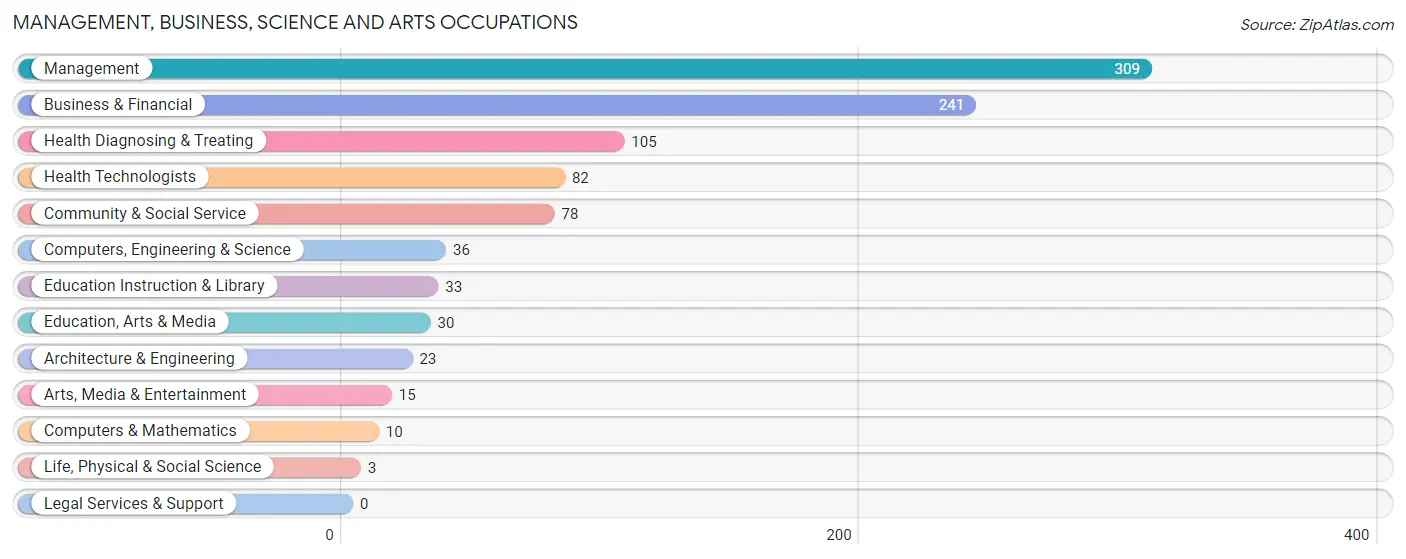
Management, Business, Science and Arts Occupations
The most common Management, Business, Science and Arts occupations in Candlewick Lake are Management (309 | 12.5%), Business & Financial (241 | 9.7%), Health Diagnosing & Treating (105 | 4.2%), Health Technologists (82 | 3.3%), and Community & Social Service (78 | 3.2%).
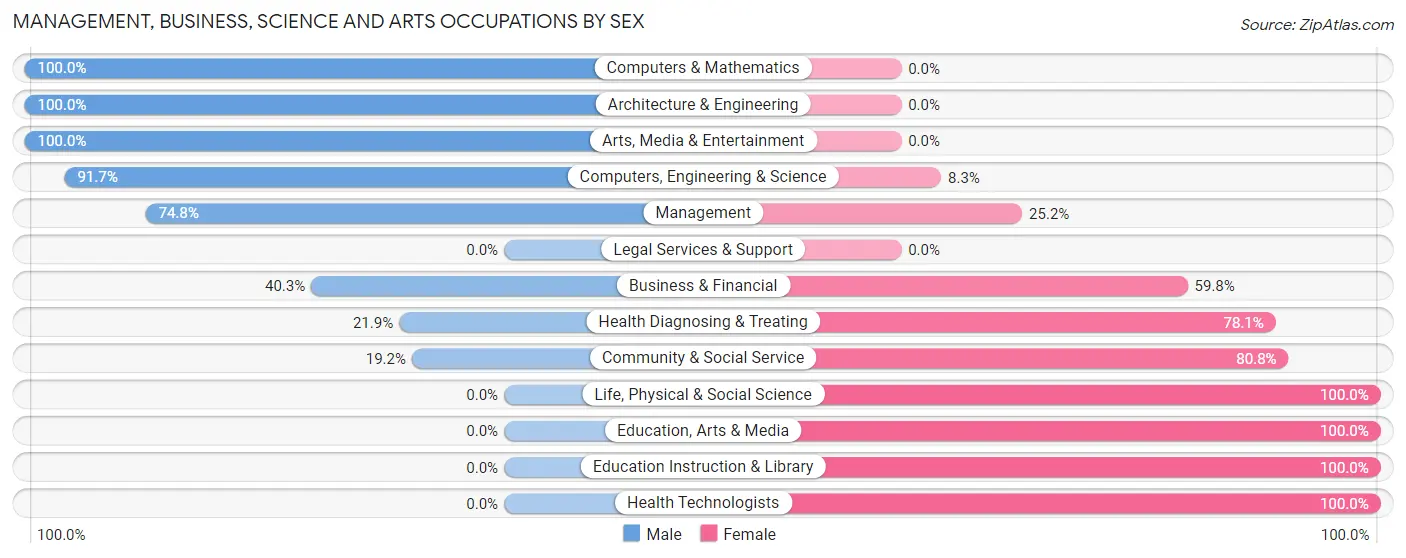
Management, Business, Science and Arts Occupations by Sex
Within the Management, Business, Science and Arts occupations in Candlewick Lake, the most male-oriented occupations are Computers & Mathematics (100.0%), Architecture & Engineering (100.0%), and Arts, Media & Entertainment (100.0%), while the most female-oriented occupations are Life, Physical & Social Science (100.0%), Education, Arts & Media (100.0%), and Education Instruction & Library (100.0%).
| Occupation | Male | Female |
| Management | 231 (74.8%) | 78 (25.2%) |
| Business & Financial | 97 (40.3%) | 144 (59.8%) |
| Computers, Engineering & Science | 33 (91.7%) | 3 (8.3%) |
| Computers & Mathematics | 10 (100.0%) | 0 (0.0%) |
| Architecture & Engineering | 23 (100.0%) | 0 (0.0%) |
| Life, Physical & Social Science | 0 (0.0%) | 3 (100.0%) |
| Community & Social Service | 15 (19.2%) | 63 (80.8%) |
| Education, Arts & Media | 0 (0.0%) | 30 (100.0%) |
| Legal Services & Support | 0 (0.0%) | 0 (0.0%) |
| Education Instruction & Library | 0 (0.0%) | 33 (100.0%) |
| Arts, Media & Entertainment | 15 (100.0%) | 0 (0.0%) |
| Health Diagnosing & Treating | 23 (21.9%) | 82 (78.1%) |
| Health Technologists | 0 (0.0%) | 82 (100.0%) |
| Total (Category) | 399 (51.9%) | 370 (48.1%) |
| Total (Overall) | 1,351 (54.5%) | 1,126 (45.5%) |
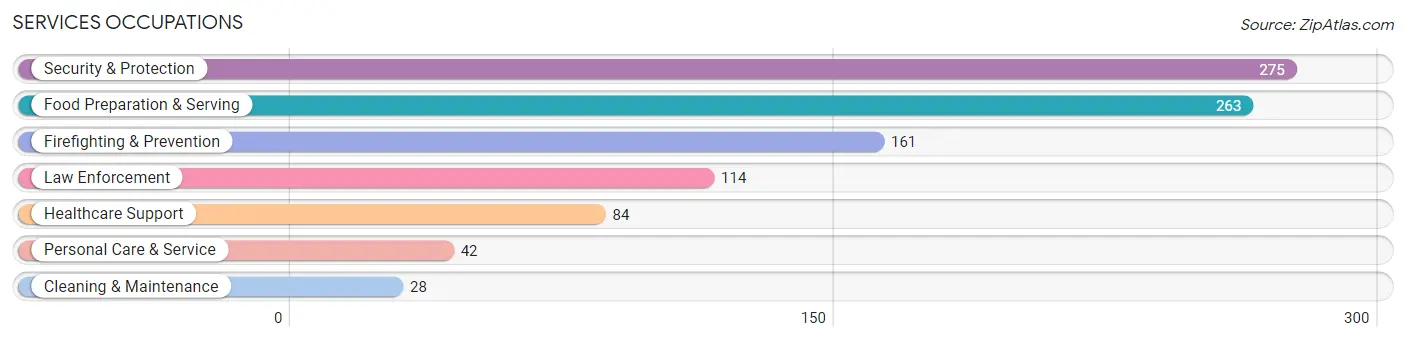
Services Occupations
The most common Services occupations in Candlewick Lake are Security & Protection (275 | 11.1%), Food Preparation & Serving (263 | 10.6%), Firefighting & Prevention (161 | 6.5%), Law Enforcement (114 | 4.6%), and Healthcare Support (84 | 3.4%).
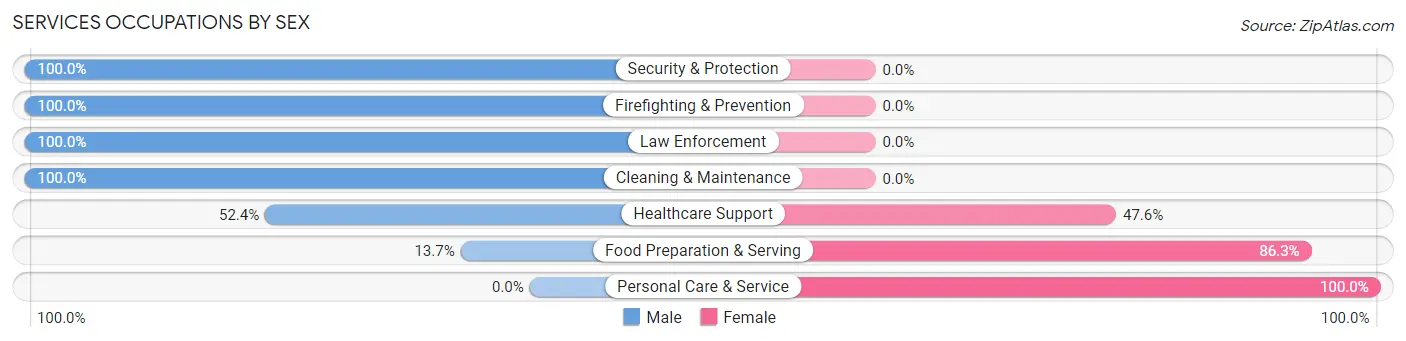
Services Occupations by Sex
Within the Services occupations in Candlewick Lake, the most male-oriented occupations are Security & Protection (100.0%), Firefighting & Prevention (100.0%), and Law Enforcement (100.0%), while the most female-oriented occupations are Personal Care & Service (100.0%), Food Preparation & Serving (86.3%), and Healthcare Support (47.6%).
| Occupation | Male | Female |
| Healthcare Support | 44 (52.4%) | 40 (47.6%) |
| Security & Protection | 275 (100.0%) | 0 (0.0%) |
| Firefighting & Prevention | 161 (100.0%) | 0 (0.0%) |
| Law Enforcement | 114 (100.0%) | 0 (0.0%) |
| Food Preparation & Serving | 36 (13.7%) | 227 (86.3%) |
| Cleaning & Maintenance | 28 (100.0%) | 0 (0.0%) |
| Personal Care & Service | 0 (0.0%) | 42 (100.0%) |
| Total (Category) | 383 (55.3%) | 309 (44.7%) |
| Total (Overall) | 1,351 (54.5%) | 1,126 (45.5%) |
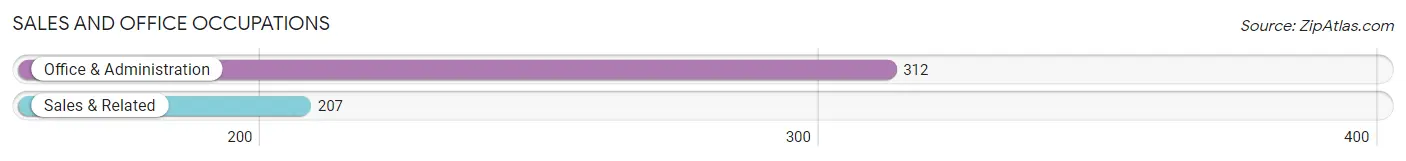
Sales and Office Occupations
The most common Sales and Office occupations in Candlewick Lake are Office & Administration (312 | 12.6%), and Sales & Related (207 | 8.4%).
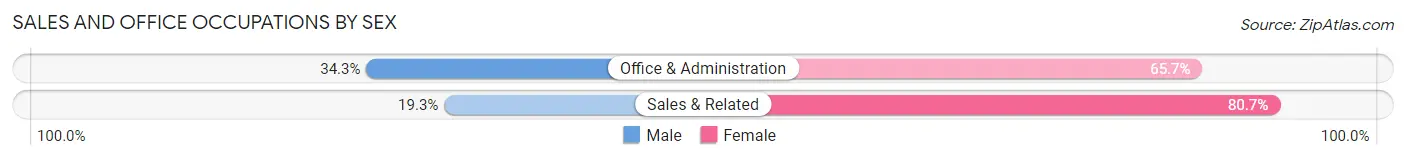
Sales and Office Occupations by Sex
| Occupation | Male | Female |
| Sales & Related | 40 (19.3%) | 167 (80.7%) |
| Office & Administration | 107 (34.3%) | 205 (65.7%) |
| Total (Category) | 147 (28.3%) | 372 (71.7%) |
| Total (Overall) | 1,351 (54.5%) | 1,126 (45.5%) |
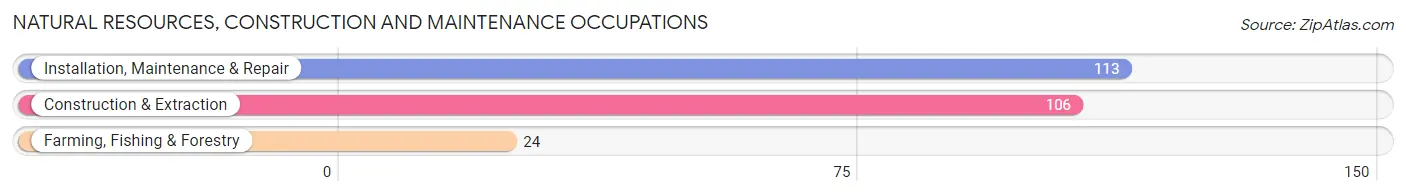
Natural Resources, Construction and Maintenance Occupations
The most common Natural Resources, Construction and Maintenance occupations in Candlewick Lake are Installation, Maintenance & Repair (113 | 4.6%), Construction & Extraction (106 | 4.3%), and Farming, Fishing & Forestry (24 | 1.0%).
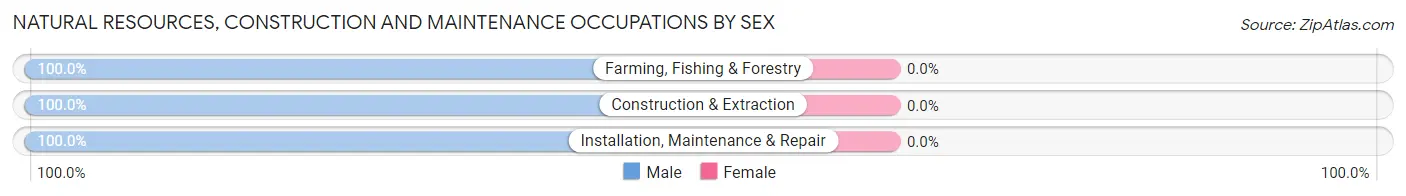
Natural Resources, Construction and Maintenance Occupations by Sex
| Occupation | Male | Female |
| Farming, Fishing & Forestry | 24 (100.0%) | 0 (0.0%) |
| Construction & Extraction | 106 (100.0%) | 0 (0.0%) |
| Installation, Maintenance & Repair | 113 (100.0%) | 0 (0.0%) |
| Total (Category) | 243 (100.0%) | 0 (0.0%) |
| Total (Overall) | 1,351 (54.5%) | 1,126 (45.5%) |
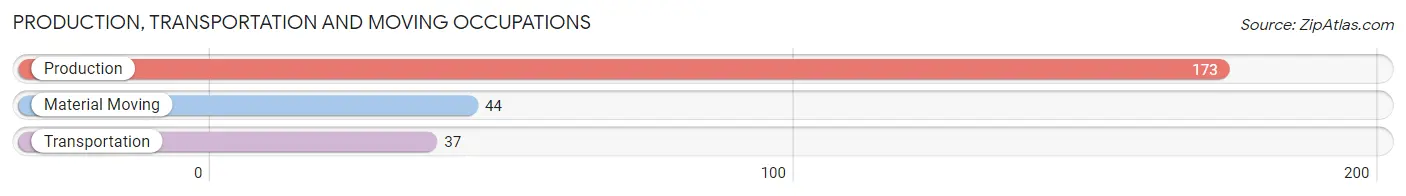
Production, Transportation and Moving Occupations
The most common Production, Transportation and Moving occupations in Candlewick Lake are Production (173 | 7.0%), Material Moving (44 | 1.8%), and Transportation (37 | 1.5%).
Production, Transportation and Moving Occupations by Sex
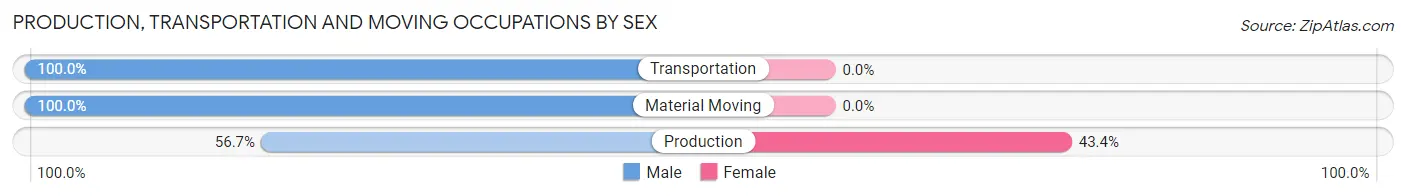
| Occupation | Male | Female |
| Production | 98 (56.7%) | 75 (43.3%) |
| Transportation | 37 (100.0%) | 0 (0.0%) |
| Material Moving | 44 (100.0%) | 0 (0.0%) |
| Total (Category) | 179 (70.5%) | 75 (29.5%) |
| Total (Overall) | 1,351 (54.5%) | 1,126 (45.5%) |
Employment Industries by Sex in Candlewick Lake
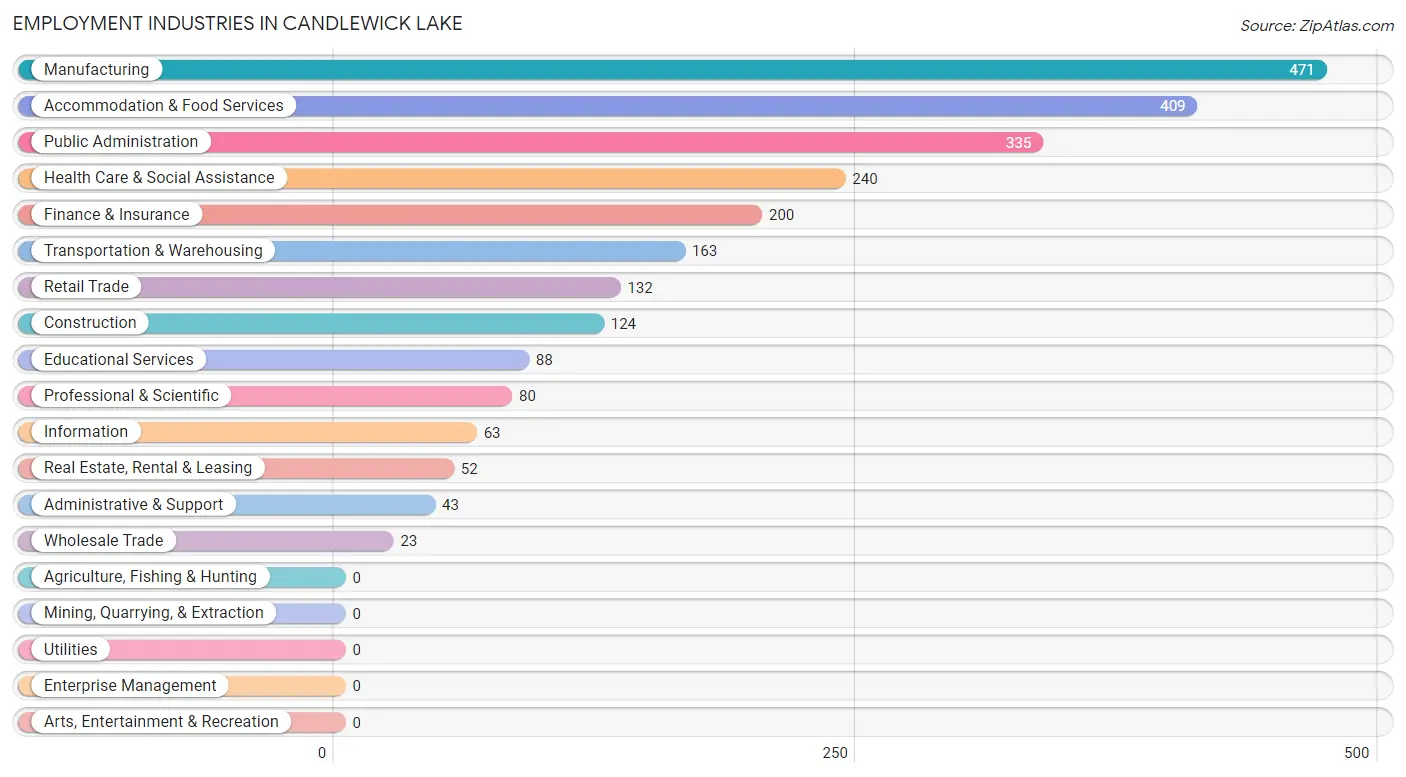
Employment Industries in Candlewick Lake
The major employment industries in Candlewick Lake include Manufacturing (471 | 19.0%), Accommodation & Food Services (409 | 16.5%), Public Administration (335 | 13.5%), Health Care & Social Assistance (240 | 9.7%), and Finance & Insurance (200 | 8.1%).
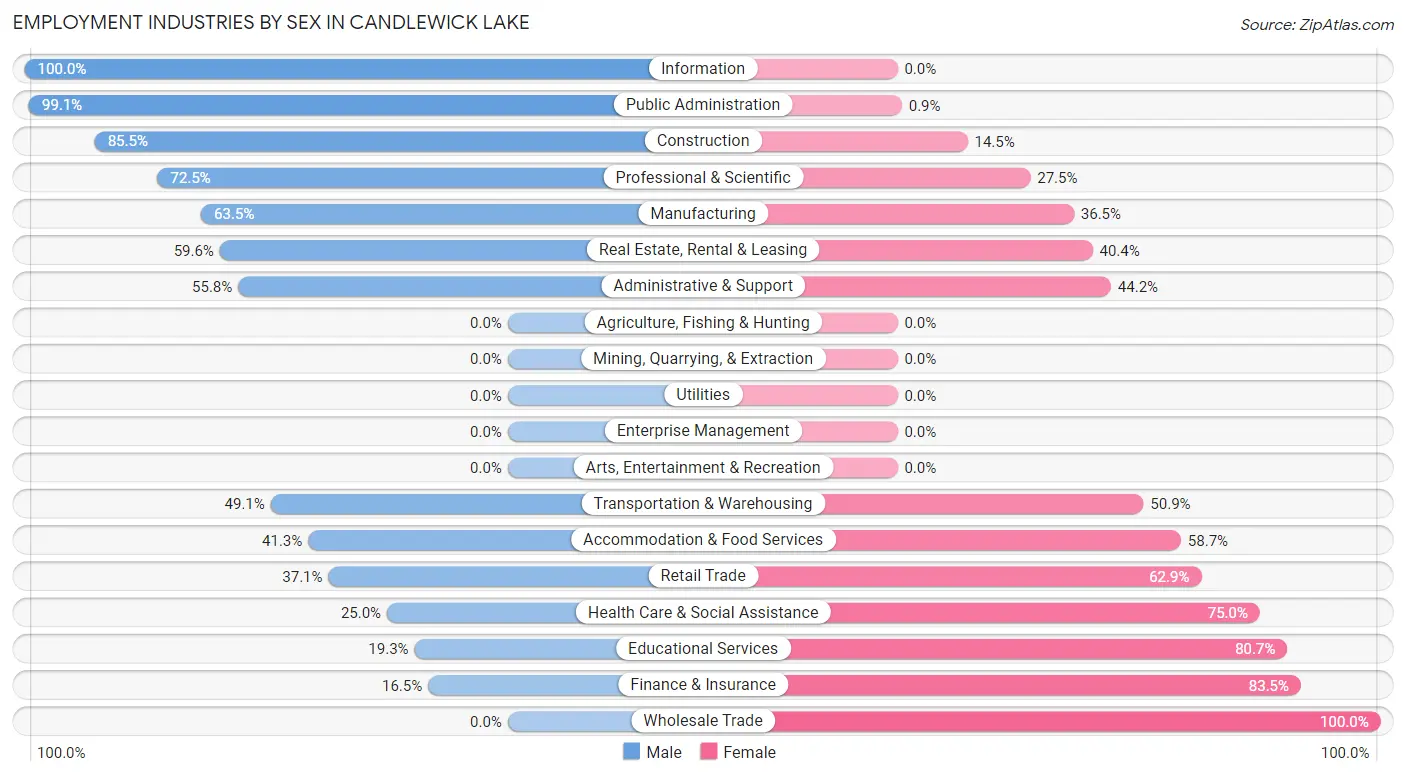
Employment Industries by Sex in Candlewick Lake
The Candlewick Lake industries that see more men than women are Information (100.0%), Public Administration (99.1%), and Construction (85.5%), whereas the industries that tend to have a higher number of women are Wholesale Trade (100.0%), Finance & Insurance (83.5%), and Educational Services (80.7%).
| Industry | Male | Female |
| Agriculture, Fishing & Hunting | 0 (0.0%) | 0 (0.0%) |
| Mining, Quarrying, & Extraction | 0 (0.0%) | 0 (0.0%) |
| Construction | 106 (85.5%) | 18 (14.5%) |
| Manufacturing | 299 (63.5%) | 172 (36.5%) |
| Wholesale Trade | 0 (0.0%) | 23 (100.0%) |
| Retail Trade | 49 (37.1%) | 83 (62.9%) |
| Transportation & Warehousing | 80 (49.1%) | 83 (50.9%) |
| Utilities | 0 (0.0%) | 0 (0.0%) |
| Information | 63 (100.0%) | 0 (0.0%) |
| Finance & Insurance | 33 (16.5%) | 167 (83.5%) |
| Real Estate, Rental & Leasing | 31 (59.6%) | 21 (40.4%) |
| Professional & Scientific | 58 (72.5%) | 22 (27.5%) |
| Enterprise Management | 0 (0.0%) | 0 (0.0%) |
| Administrative & Support | 24 (55.8%) | 19 (44.2%) |
| Educational Services | 17 (19.3%) | 71 (80.7%) |
| Health Care & Social Assistance | 60 (25.0%) | 180 (75.0%) |
| Arts, Entertainment & Recreation | 0 (0.0%) | 0 (0.0%) |
| Accommodation & Food Services | 169 (41.3%) | 240 (58.7%) |
| Public Administration | 332 (99.1%) | 3 (0.9%) |
| Total | 1,351 (54.5%) | 1,126 (45.5%) |
Education in Candlewick Lake
School Enrollment in Candlewick Lake
The most common levels of schooling among the 1,484 students in Candlewick Lake are middle school (524 | 35.3%), high school (500 | 33.7%), and college / undergraduate (260 | 17.5%).
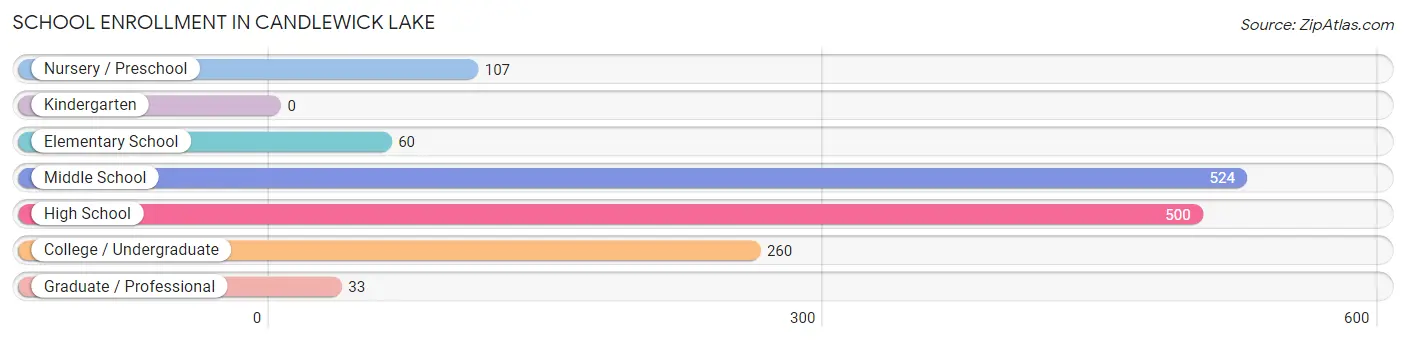
| School Level | # Students | % Students |
| Nursery / Preschool | 107 | 7.2% |
| Kindergarten | 0 | 0.0% |
| Elementary School | 60 | 4.0% |
| Middle School | 524 | 35.3% |
| High School | 500 | 33.7% |
| College / Undergraduate | 260 | 17.5% |
| Graduate / Professional | 33 | 2.2% |
| Total | 1,484 | 100.0% |
School Enrollment by Age by Funding Source in Candlewick Lake
Out of a total of 1,484 students who are enrolled in schools in Candlewick Lake, 338 (22.8%) attend a private institution, while the remaining 1,146 (77.2%) are enrolled in public schools. The age group of 20 to 24 year olds has the highest likelihood of being enrolled in private schools, with 89 (81.7% in the age bracket) enrolled. Conversely, the age group of 5 to 9 year old has the lowest likelihood of being enrolled in a private school, with 36 (100.0% in the age bracket) attending a public institution.
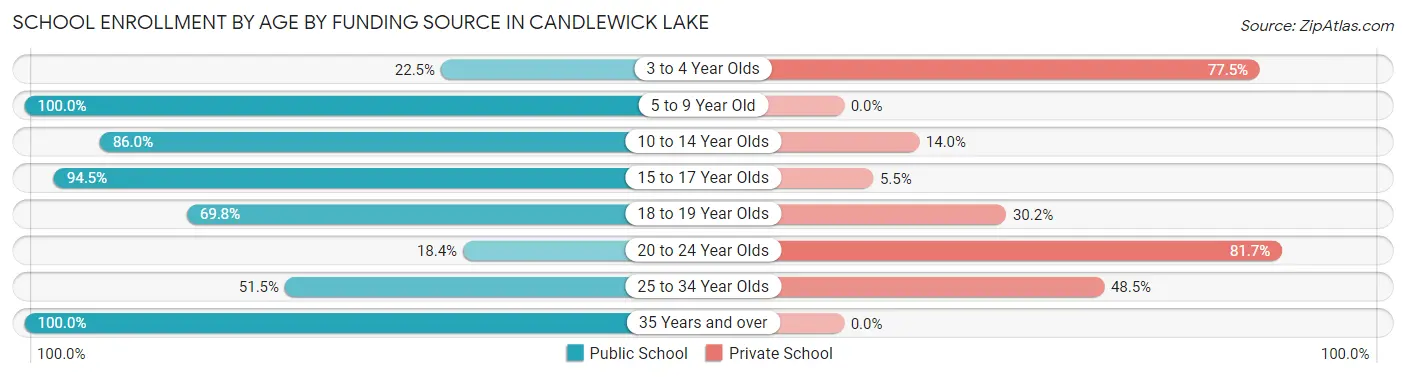
| Age Bracket | Public School | Private School |
| 3 to 4 Year Olds | 20 (22.5%) | 69 (77.5%) |
| 5 to 9 Year Old | 36 (100.0%) | 0 (0.0%) |
| 10 to 14 Year Olds | 565 (86.0%) | 92 (14.0%) |
| 15 to 17 Year Olds | 346 (94.5%) | 20 (5.5%) |
| 18 to 19 Year Olds | 120 (69.8%) | 52 (30.2%) |
| 20 to 24 Year Olds | 20 (18.3%) | 89 (81.7%) |
| 25 to 34 Year Olds | 17 (51.5%) | 16 (48.5%) |
| 35 Years and over | 22 (100.0%) | 0 (0.0%) |
| Total | 1,146 (77.2%) | 338 (22.8%) |
Educational Attainment by Field of Study in Candlewick Lake
Business (273 | 25.9%), liberal arts & history (151 | 14.3%), psychology (125 | 11.8%), computers & mathematics (96 | 9.1%), and science & technology (90 | 8.5%) are the most common fields of study among 1,056 individuals in Candlewick Lake who have obtained a bachelor's degree or higher.
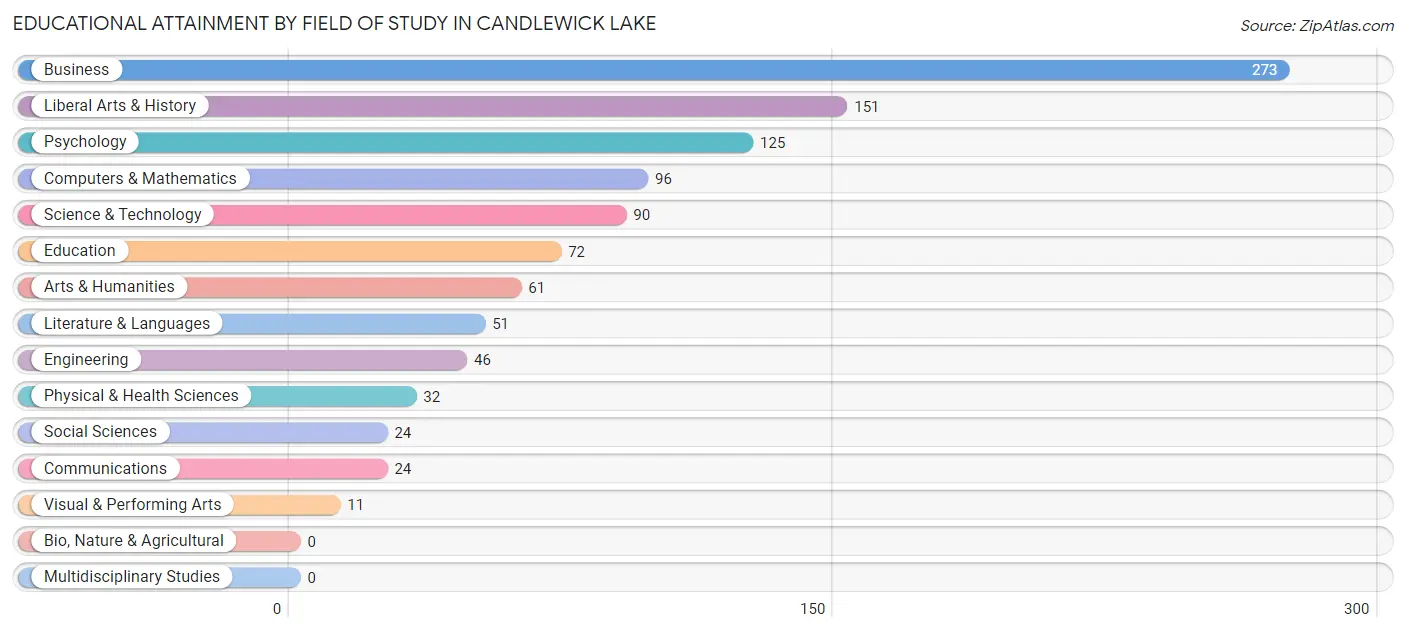
| Field of Study | # Graduates | % Graduates |
| Computers & Mathematics | 96 | 9.1% |
| Bio, Nature & Agricultural | 0 | 0.0% |
| Physical & Health Sciences | 32 | 3.0% |
| Psychology | 125 | 11.8% |
| Social Sciences | 24 | 2.3% |
| Engineering | 46 | 4.4% |
| Multidisciplinary Studies | 0 | 0.0% |
| Science & Technology | 90 | 8.5% |
| Business | 273 | 25.9% |
| Education | 72 | 6.8% |
| Literature & Languages | 51 | 4.8% |
| Liberal Arts & History | 151 | 14.3% |
| Visual & Performing Arts | 11 | 1.0% |
| Communications | 24 | 2.3% |
| Arts & Humanities | 61 | 5.8% |
| Total | 1,056 | 100.0% |
Transportation & Commute in Candlewick Lake
Vehicle Availability by Sex in Candlewick Lake
The most prevalent vehicle ownership categories in Candlewick Lake are males with 3 vehicles (482, accounting for 35.7%) and females with 3 vehicles (357, making up 45.8%).
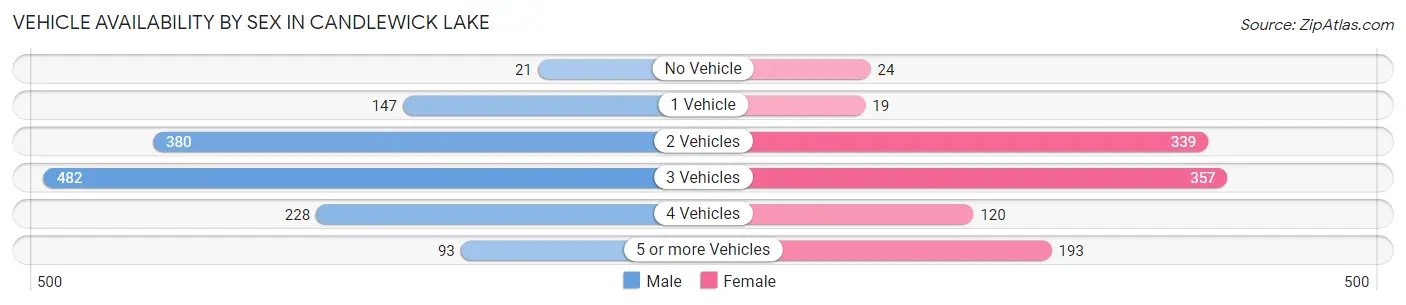
| Vehicles Available | Male | Female |
| No Vehicle | 21 (1.5%) | 24 (2.3%) |
| 1 Vehicle | 147 (10.9%) | 19 (1.8%) |
| 2 Vehicles | 380 (28.1%) | 339 (32.2%) |
| 3 Vehicles | 482 (35.7%) | 357 (33.9%) |
| 4 Vehicles | 228 (16.9%) | 120 (11.4%) |
| 5 or more Vehicles | 93 (6.9%) | 193 (18.3%) |
| Total | 1,351 (100.0%) | 1,052 (100.0%) |
Commute Time in Candlewick Lake
The most frequently occuring commute durations in Candlewick Lake are 20 to 24 minutes (563 commuters, 24.1%), 30 to 34 minutes (466 commuters, 20.0%), and 45 to 59 minutes (292 commuters, 12.5%).
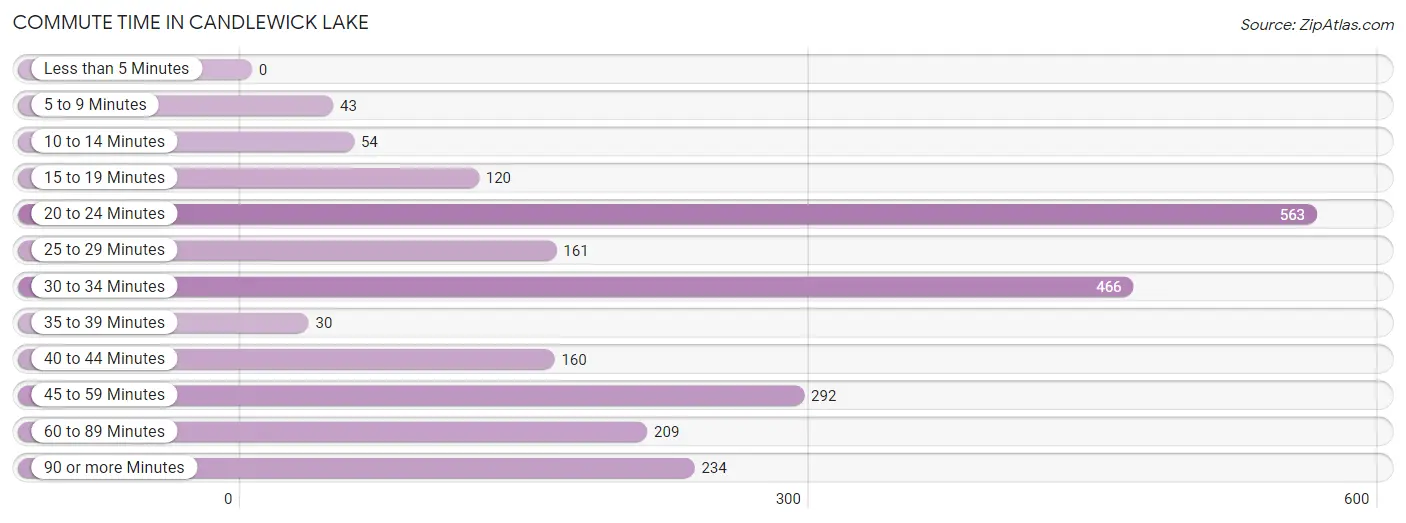
| Commute Time | # Commuters | % Commuters |
| Less than 5 Minutes | 0 | 0.0% |
| 5 to 9 Minutes | 43 | 1.8% |
| 10 to 14 Minutes | 54 | 2.3% |
| 15 to 19 Minutes | 120 | 5.1% |
| 20 to 24 Minutes | 563 | 24.1% |
| 25 to 29 Minutes | 161 | 6.9% |
| 30 to 34 Minutes | 466 | 20.0% |
| 35 to 39 Minutes | 30 | 1.3% |
| 40 to 44 Minutes | 160 | 6.9% |
| 45 to 59 Minutes | 292 | 12.5% |
| 60 to 89 Minutes | 209 | 9.0% |
| 90 or more Minutes | 234 | 10.0% |
Commute Time by Sex in Candlewick Lake
The most common commute times in Candlewick Lake are 20 to 24 minutes (377 commuters, 27.9%) for males and 30 to 34 minutes (379 commuters, 38.6%) for females.
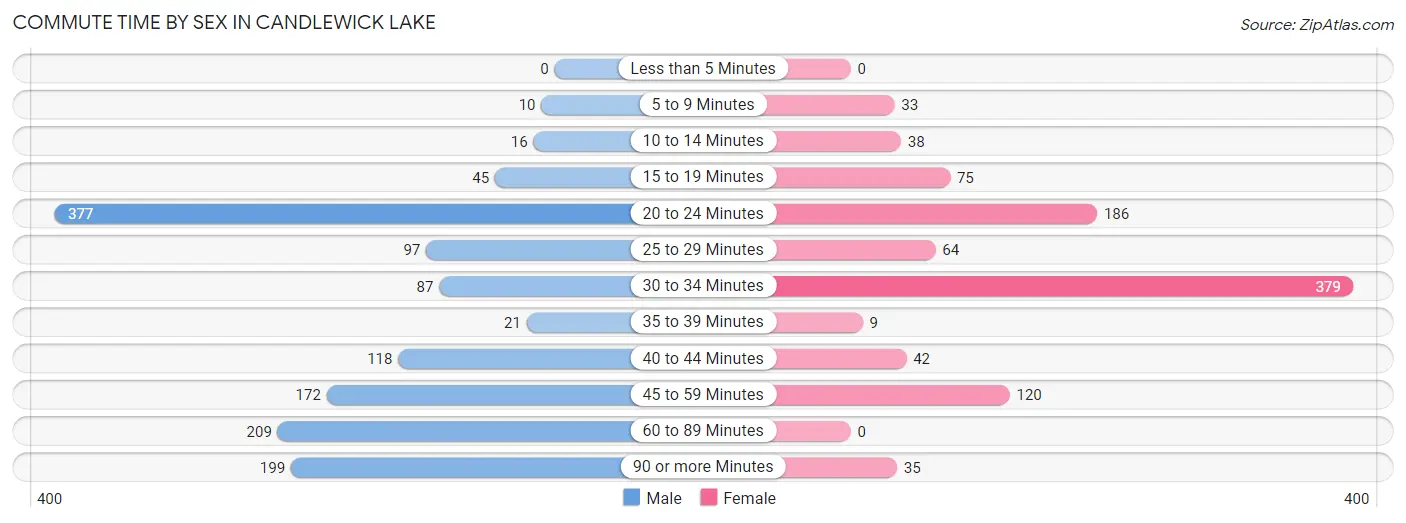
| Commute Time | Male | Female |
| Less than 5 Minutes | 0 (0.0%) | 0 (0.0%) |
| 5 to 9 Minutes | 10 (0.7%) | 33 (3.4%) |
| 10 to 14 Minutes | 16 (1.2%) | 38 (3.9%) |
| 15 to 19 Minutes | 45 (3.3%) | 75 (7.6%) |
| 20 to 24 Minutes | 377 (27.9%) | 186 (19.0%) |
| 25 to 29 Minutes | 97 (7.2%) | 64 (6.5%) |
| 30 to 34 Minutes | 87 (6.4%) | 379 (38.6%) |
| 35 to 39 Minutes | 21 (1.5%) | 9 (0.9%) |
| 40 to 44 Minutes | 118 (8.7%) | 42 (4.3%) |
| 45 to 59 Minutes | 172 (12.7%) | 120 (12.2%) |
| 60 to 89 Minutes | 209 (15.5%) | 0 (0.0%) |
| 90 or more Minutes | 199 (14.7%) | 35 (3.6%) |
Time of Departure to Work by Sex in Candlewick Lake
The most frequent times of departure to work in Candlewick Lake are 6:00 AM to 6:29 AM (362, 26.8%) for males and 12:00 PM to 3:59 PM (260, 26.5%) for females.
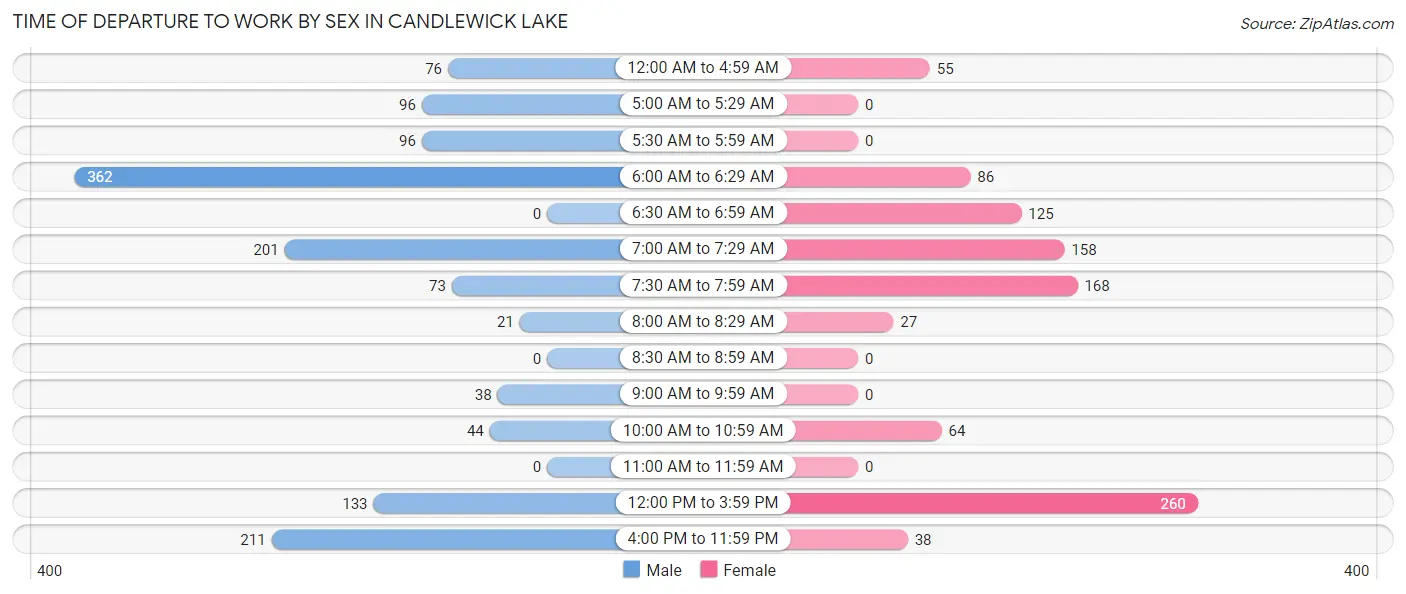
| Time of Departure | Male | Female |
| 12:00 AM to 4:59 AM | 76 (5.6%) | 55 (5.6%) |
| 5:00 AM to 5:29 AM | 96 (7.1%) | 0 (0.0%) |
| 5:30 AM to 5:59 AM | 96 (7.1%) | 0 (0.0%) |
| 6:00 AM to 6:29 AM | 362 (26.8%) | 86 (8.8%) |
| 6:30 AM to 6:59 AM | 0 (0.0%) | 125 (12.7%) |
| 7:00 AM to 7:29 AM | 201 (14.9%) | 158 (16.1%) |
| 7:30 AM to 7:59 AM | 73 (5.4%) | 168 (17.1%) |
| 8:00 AM to 8:29 AM | 21 (1.5%) | 27 (2.8%) |
| 8:30 AM to 8:59 AM | 0 (0.0%) | 0 (0.0%) |
| 9:00 AM to 9:59 AM | 38 (2.8%) | 0 (0.0%) |
| 10:00 AM to 10:59 AM | 44 (3.3%) | 64 (6.5%) |
| 11:00 AM to 11:59 AM | 0 (0.0%) | 0 (0.0%) |
| 12:00 PM to 3:59 PM | 133 (9.8%) | 260 (26.5%) |
| 4:00 PM to 11:59 PM | 211 (15.6%) | 38 (3.9%) |
| Total | 1,351 (100.0%) | 981 (100.0%) |
Housing Occupancy in Candlewick Lake
Occupancy by Ownership in Candlewick Lake
Of the total 1,499 dwellings in Candlewick Lake, owner-occupied units account for 1,388 (92.6%), while renter-occupied units make up 111 (7.4%).
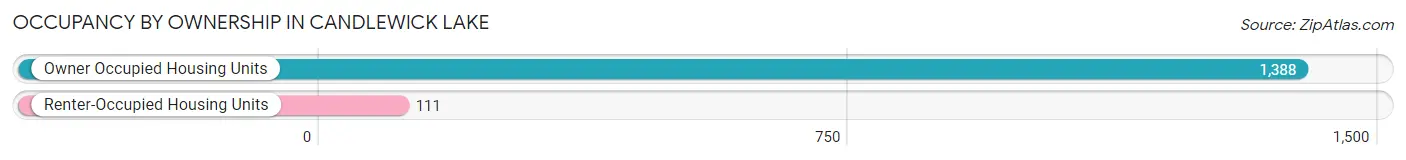
| Occupancy | # Housing Units | % Housing Units |
| Owner Occupied Housing Units | 1,388 | 92.6% |
| Renter-Occupied Housing Units | 111 | 7.4% |
| Total Occupied Housing Units | 1,499 | 100.0% |
Occupancy by Household Size in Candlewick Lake
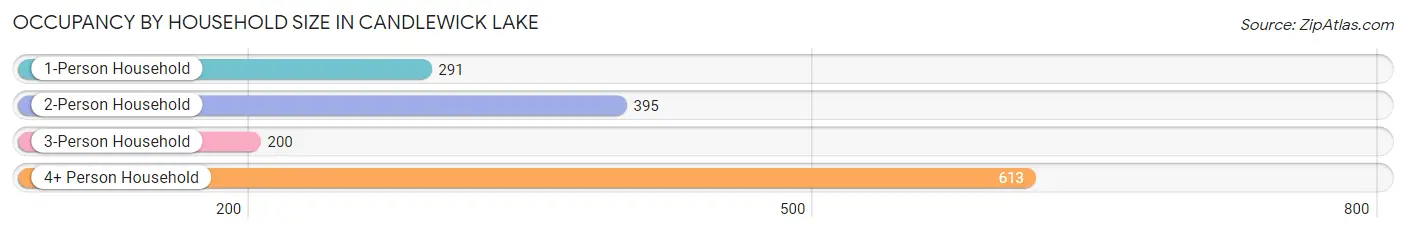
| Household Size | # Housing Units | % Housing Units |
| 1-Person Household | 291 | 19.4% |
| 2-Person Household | 395 | 26.4% |
| 3-Person Household | 200 | 13.3% |
| 4+ Person Household | 613 | 40.9% |
| Total Housing Units | 1,499 | 100.0% |
Occupancy by Ownership by Household Size in Candlewick Lake
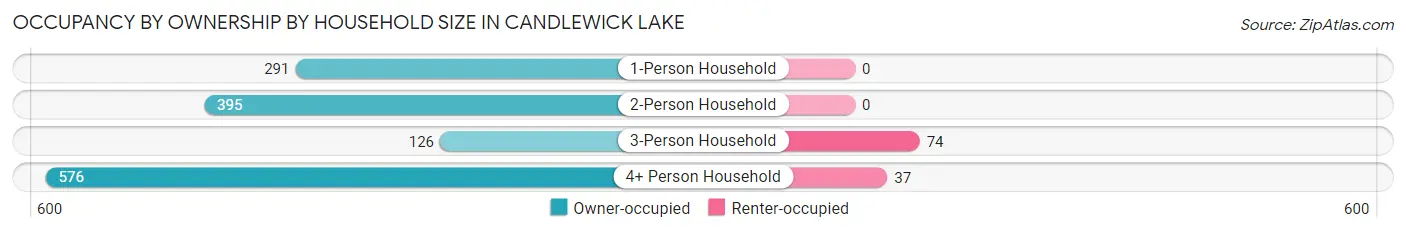
| Household Size | Owner-occupied | Renter-occupied |
| 1-Person Household | 291 (100.0%) | 0 (0.0%) |
| 2-Person Household | 395 (100.0%) | 0 (0.0%) |
| 3-Person Household | 126 (63.0%) | 74 (37.0%) |
| 4+ Person Household | 576 (94.0%) | 37 (6.0%) |
| Total Housing Units | 1,388 (92.6%) | 111 (7.4%) |
Occupancy by Educational Attainment in Candlewick Lake
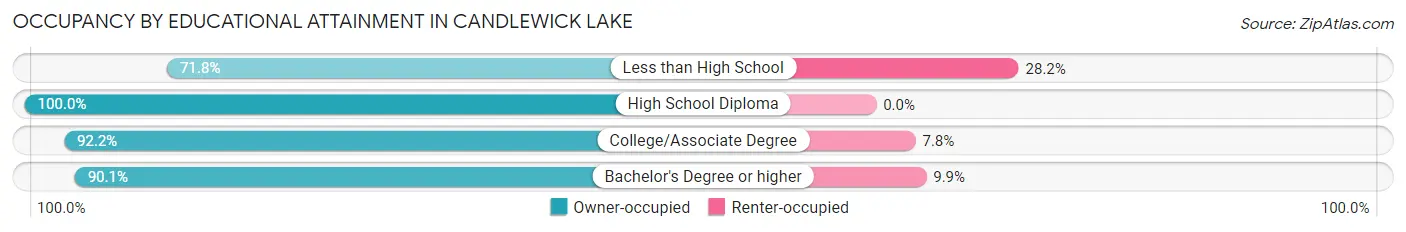
| Household Size | Owner-occupied | Renter-occupied |
| Less than High School | 61 (71.8%) | 24 (28.2%) |
| High School Diploma | 440 (100.0%) | 0 (0.0%) |
| College/Associate Degree | 425 (92.2%) | 36 (7.8%) |
| Bachelor's Degree or higher | 462 (90.1%) | 51 (9.9%) |
Occupancy by Age of Householder in Candlewick Lake
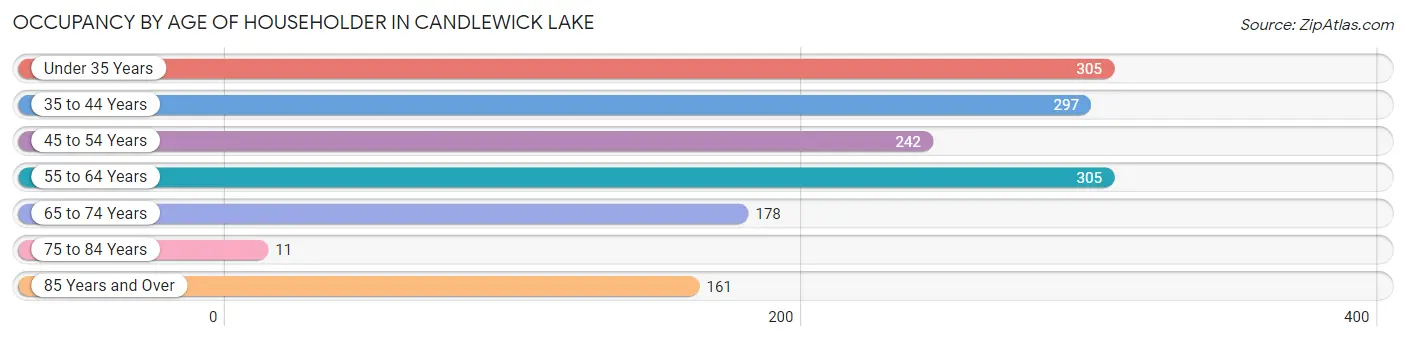
| Age Bracket | # Households | % Households |
| Under 35 Years | 305 | 20.3% |
| 35 to 44 Years | 297 | 19.8% |
| 45 to 54 Years | 242 | 16.1% |
| 55 to 64 Years | 305 | 20.3% |
| 65 to 74 Years | 178 | 11.9% |
| 75 to 84 Years | 11 | 0.7% |
| 85 Years and Over | 161 | 10.7% |
| Total | 1,499 | 100.0% |
Housing Finances in Candlewick Lake
Median Income by Occupancy in Candlewick Lake
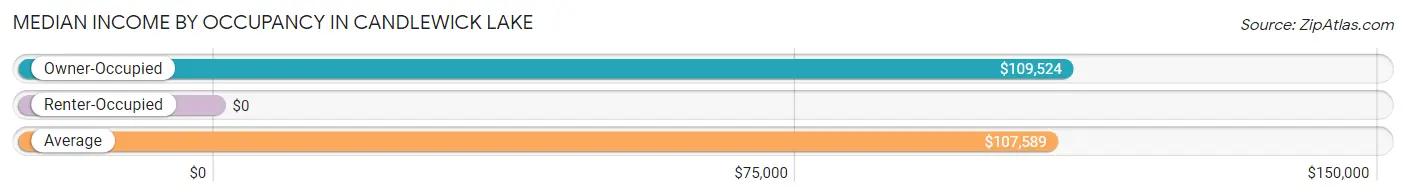
| Occupancy Type | # Households | Median Income |
| Owner-Occupied | 1,388 (92.6%) | $109,524 |
| Renter-Occupied | 111 (7.4%) | $0 |
| Average | 1,499 (100.0%) | $107,589 |
Occupancy by Householder Income Bracket in Candlewick Lake
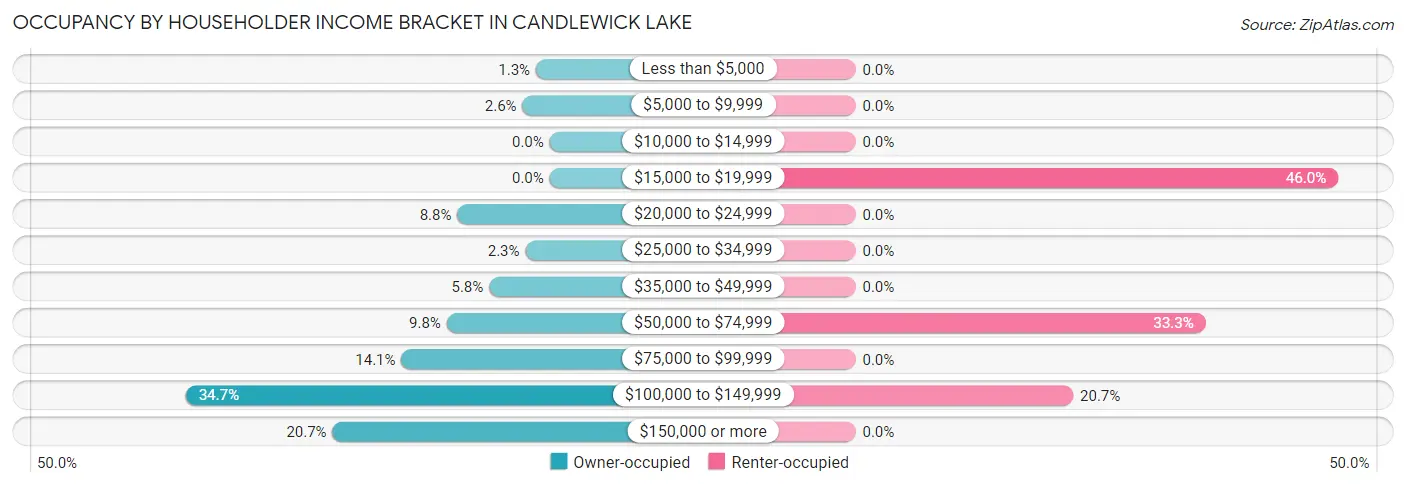
| Income Bracket | Owner-occupied | Renter-occupied |
| Less than $5,000 | 18 (1.3%) | 0 (0.0%) |
| $5,000 to $9,999 | 36 (2.6%) | 0 (0.0%) |
| $10,000 to $14,999 | 0 (0.0%) | 0 (0.0%) |
| $15,000 to $19,999 | 0 (0.0%) | 51 (46.0%) |
| $20,000 to $24,999 | 122 (8.8%) | 0 (0.0%) |
| $25,000 to $34,999 | 32 (2.3%) | 0 (0.0%) |
| $35,000 to $49,999 | 80 (5.8%) | 0 (0.0%) |
| $50,000 to $74,999 | 136 (9.8%) | 37 (33.3%) |
| $75,000 to $99,999 | 196 (14.1%) | 0 (0.0%) |
| $100,000 to $149,999 | 481 (34.6%) | 23 (20.7%) |
| $150,000 or more | 287 (20.7%) | 0 (0.0%) |
| Total | 1,388 (100.0%) | 111 (100.0%) |
Monthly Housing Cost Tiers in Candlewick Lake
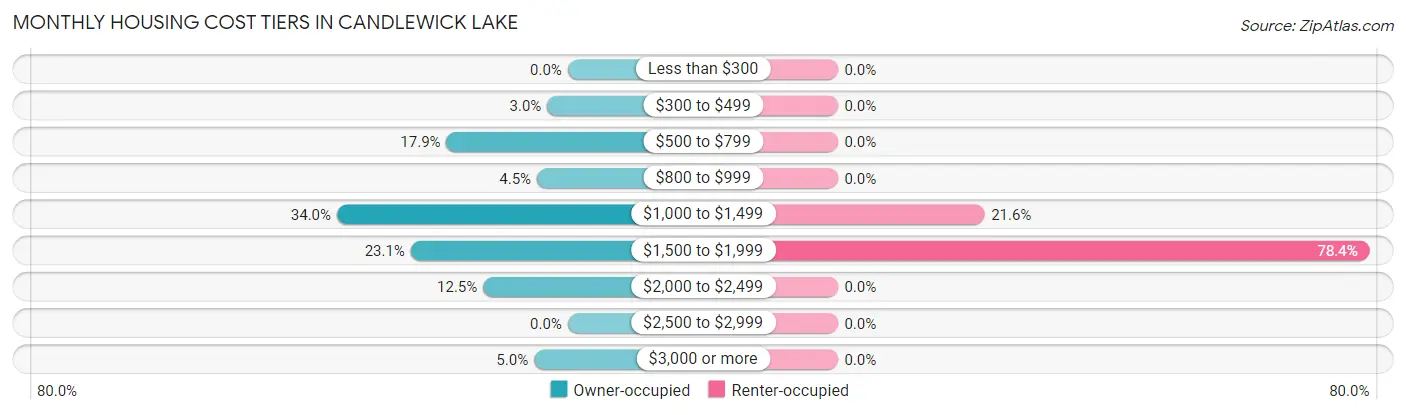
| Monthly Cost | Owner-occupied | Renter-occupied |
| Less than $300 | 0 (0.0%) | 0 (0.0%) |
| $300 to $499 | 42 (3.0%) | 0 (0.0%) |
| $500 to $799 | 248 (17.9%) | 0 (0.0%) |
| $800 to $999 | 63 (4.5%) | 0 (0.0%) |
| $1,000 to $1,499 | 472 (34.0%) | 24 (21.6%) |
| $1,500 to $1,999 | 321 (23.1%) | 87 (78.4%) |
| $2,000 to $2,499 | 173 (12.5%) | 0 (0.0%) |
| $2,500 to $2,999 | 0 (0.0%) | 0 (0.0%) |
| $3,000 or more | 69 (5.0%) | 0 (0.0%) |
| Total | 1,388 (100.0%) | 111 (100.0%) |
Physical Housing Characteristics in Candlewick Lake
Housing Structures in Candlewick Lake
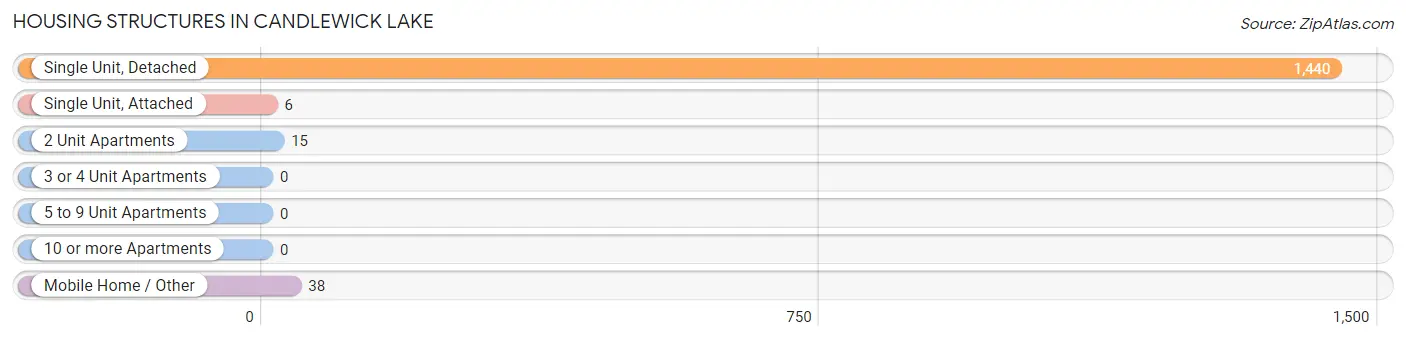
| Structure Type | # Housing Units | % Housing Units |
| Single Unit, Detached | 1,440 | 96.1% |
| Single Unit, Attached | 6 | 0.4% |
| 2 Unit Apartments | 15 | 1.0% |
| 3 or 4 Unit Apartments | 0 | 0.0% |
| 5 to 9 Unit Apartments | 0 | 0.0% |
| 10 or more Apartments | 0 | 0.0% |
| Mobile Home / Other | 38 | 2.5% |
| Total | 1,499 | 100.0% |
Housing Structures by Occupancy in Candlewick Lake
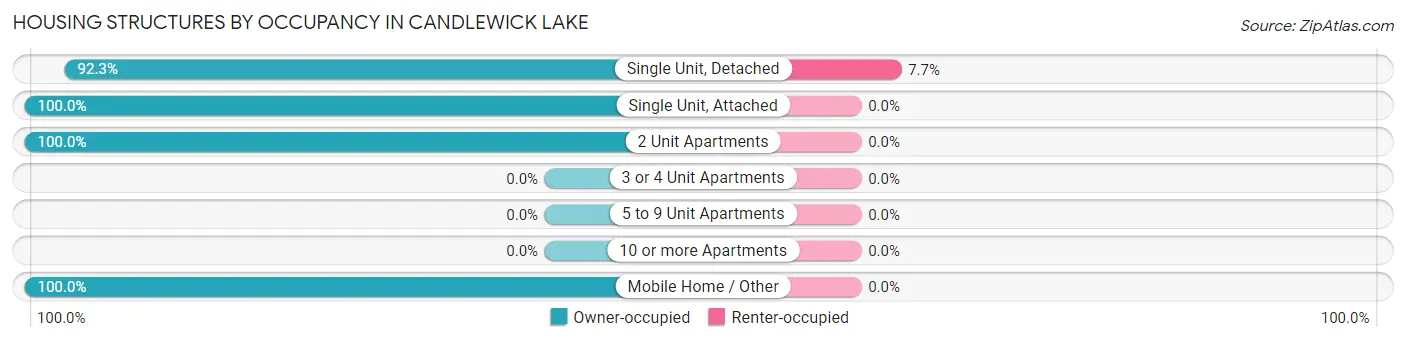
| Structure Type | Owner-occupied | Renter-occupied |
| Single Unit, Detached | 1,329 (92.3%) | 111 (7.7%) |
| Single Unit, Attached | 6 (100.0%) | 0 (0.0%) |
| 2 Unit Apartments | 15 (100.0%) | 0 (0.0%) |
| 3 or 4 Unit Apartments | 0 (0.0%) | 0 (0.0%) |
| 5 to 9 Unit Apartments | 0 (0.0%) | 0 (0.0%) |
| 10 or more Apartments | 0 (0.0%) | 0 (0.0%) |
| Mobile Home / Other | 38 (100.0%) | 0 (0.0%) |
| Total | 1,388 (92.6%) | 111 (7.4%) |
Housing Structures by Number of Rooms in Candlewick Lake
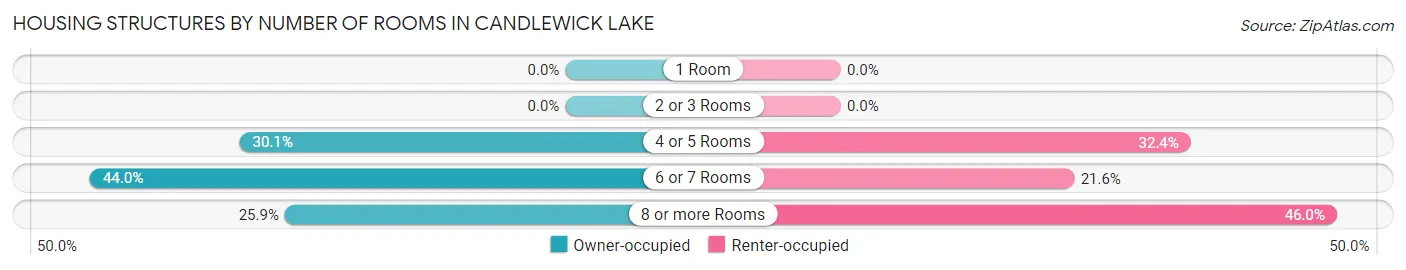
| Number of Rooms | Owner-occupied | Renter-occupied |
| 1 Room | 0 (0.0%) | 0 (0.0%) |
| 2 or 3 Rooms | 0 (0.0%) | 0 (0.0%) |
| 4 or 5 Rooms | 418 (30.1%) | 36 (32.4%) |
| 6 or 7 Rooms | 610 (44.0%) | 24 (21.6%) |
| 8 or more Rooms | 360 (25.9%) | 51 (46.0%) |
| Total | 1,388 (100.0%) | 111 (100.0%) |
Housing Structure by Heating Type in Candlewick Lake
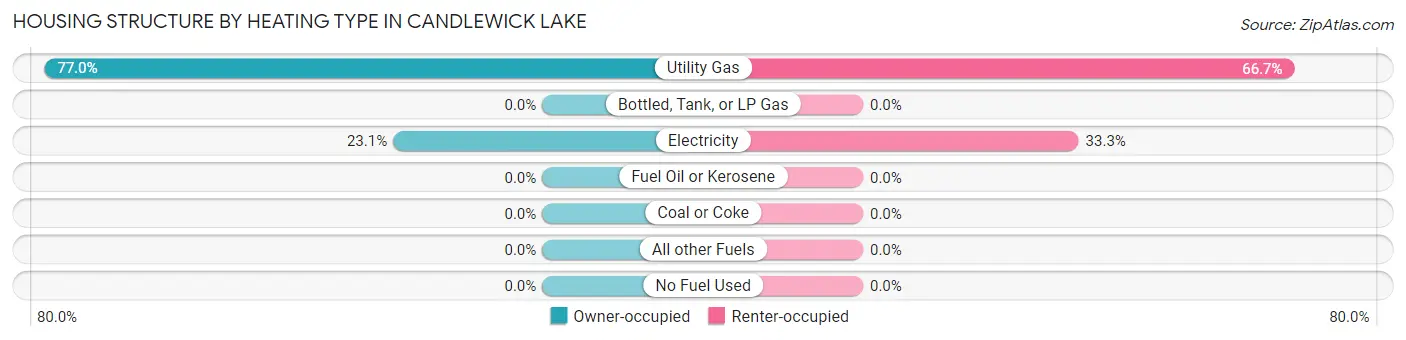
| Heating Type | Owner-occupied | Renter-occupied |
| Utility Gas | 1,068 (76.9%) | 74 (66.7%) |
| Bottled, Tank, or LP Gas | 0 (0.0%) | 0 (0.0%) |
| Electricity | 320 (23.1%) | 37 (33.3%) |
| Fuel Oil or Kerosene | 0 (0.0%) | 0 (0.0%) |
| Coal or Coke | 0 (0.0%) | 0 (0.0%) |
| All other Fuels | 0 (0.0%) | 0 (0.0%) |
| No Fuel Used | 0 (0.0%) | 0 (0.0%) |
| Total | 1,388 (100.0%) | 111 (100.0%) |
Household Vehicle Usage in Candlewick Lake
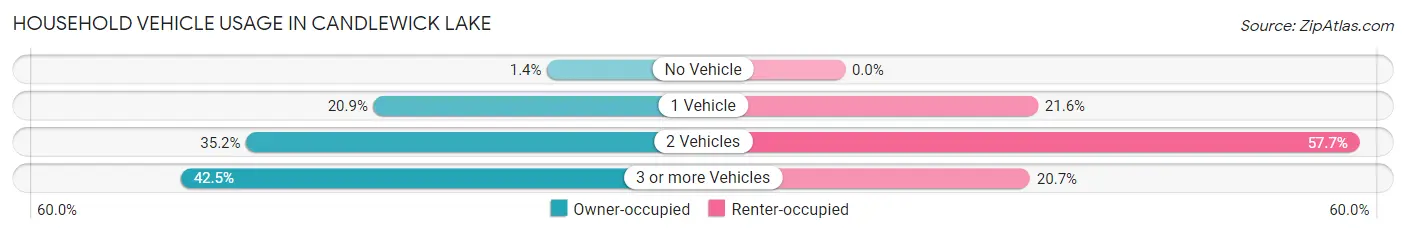
| Vehicles per Household | Owner-occupied | Renter-occupied |
| No Vehicle | 20 (1.4%) | 0 (0.0%) |
| 1 Vehicle | 290 (20.9%) | 24 (21.6%) |
| 2 Vehicles | 488 (35.2%) | 64 (57.7%) |
| 3 or more Vehicles | 590 (42.5%) | 23 (20.7%) |
| Total | 1,388 (100.0%) | 111 (100.0%) |
Real Estate & Mortgages in Candlewick Lake
Real Estate and Mortgage Overview in Candlewick Lake
| Characteristic | Without Mortgage | With Mortgage |
| Housing Units | 331 | 1,057 |
| Median Property Value | $159,300 | $161,700 |
| Median Household Income | $113,226 | $287 |
| Monthly Housing Costs | $706 | $69 |
| Real Estate Taxes | $2,844 | $19 |
Property Value by Mortgage Status in Candlewick Lake
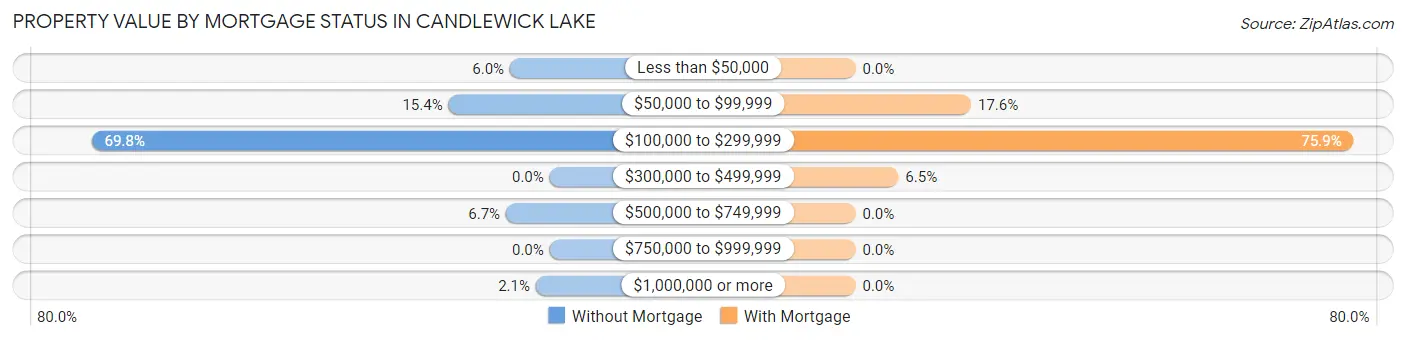
| Property Value | Without Mortgage | With Mortgage |
| Less than $50,000 | 20 (6.0%) | 0 (0.0%) |
| $50,000 to $99,999 | 51 (15.4%) | 186 (17.6%) |
| $100,000 to $299,999 | 231 (69.8%) | 802 (75.9%) |
| $300,000 to $499,999 | 0 (0.0%) | 69 (6.5%) |
| $500,000 to $749,999 | 22 (6.7%) | 0 (0.0%) |
| $750,000 to $999,999 | 0 (0.0%) | 0 (0.0%) |
| $1,000,000 or more | 7 (2.1%) | 0 (0.0%) |
| Total | 331 (100.0%) | 1,057 (100.0%) |
Household Income by Mortgage Status in Candlewick Lake
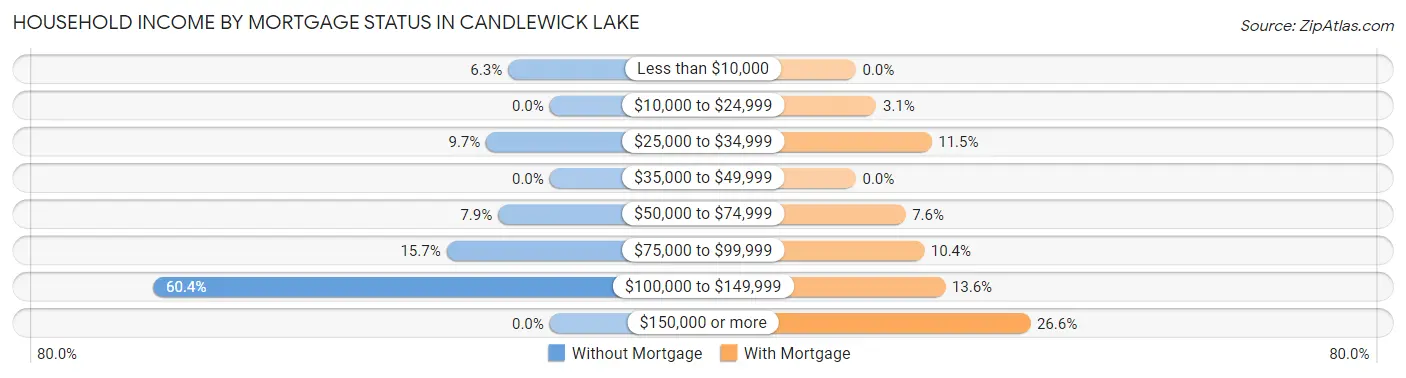
| Household Income | Without Mortgage | With Mortgage |
| Less than $10,000 | 21 (6.3%) | 0 (0.0%) |
| $10,000 to $24,999 | 0 (0.0%) | 33 (3.1%) |
| $25,000 to $34,999 | 32 (9.7%) | 122 (11.5%) |
| $35,000 to $49,999 | 0 (0.0%) | 0 (0.0%) |
| $50,000 to $74,999 | 26 (7.9%) | 80 (7.6%) |
| $75,000 to $99,999 | 52 (15.7%) | 110 (10.4%) |
| $100,000 to $149,999 | 200 (60.4%) | 144 (13.6%) |
| $150,000 or more | 0 (0.0%) | 281 (26.6%) |
| Total | 331 (100.0%) | 1,057 (100.0%) |
Property Value to Household Income Ratio in Candlewick Lake
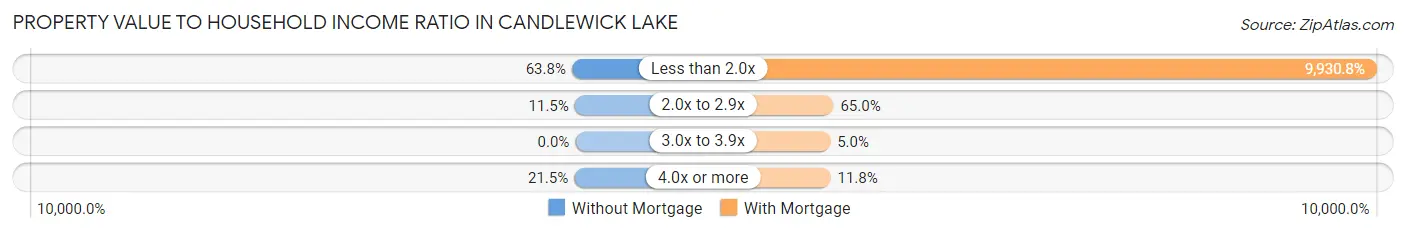
| Value-to-Income Ratio | Without Mortgage | With Mortgage |
| Less than 2.0x | 211 (63.7%) | 104,969 (9,930.8%) |
| 2.0x to 2.9x | 38 (11.5%) | 687 (65.0%) |
| 3.0x to 3.9x | 0 (0.0%) | 53 (5.0%) |
| 4.0x or more | 71 (21.4%) | 125 (11.8%) |
| Total | 331 (100.0%) | 1,057 (100.0%) |
Real Estate Taxes by Mortgage Status in Candlewick Lake
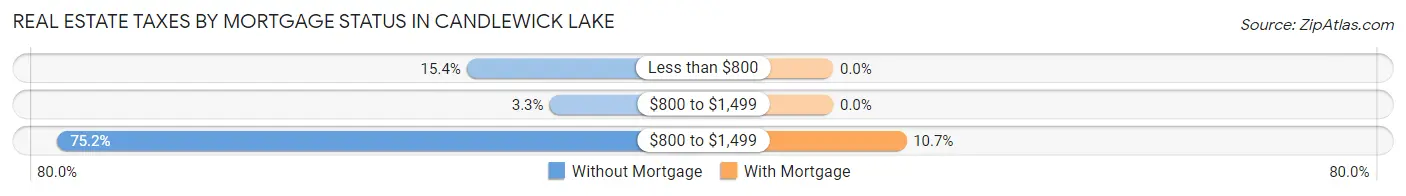
| Property Taxes | Without Mortgage | With Mortgage |
| Less than $800 | 51 (15.4%) | 0 (0.0%) |
| $800 to $1,499 | 11 (3.3%) | 0 (0.0%) |
| $800 to $1,499 | 249 (75.2%) | 113 (10.7%) |
| Total | 331 (100.0%) | 1,057 (100.0%) |
Health & Disability in Candlewick Lake
Health Insurance Coverage by Age in Candlewick Lake
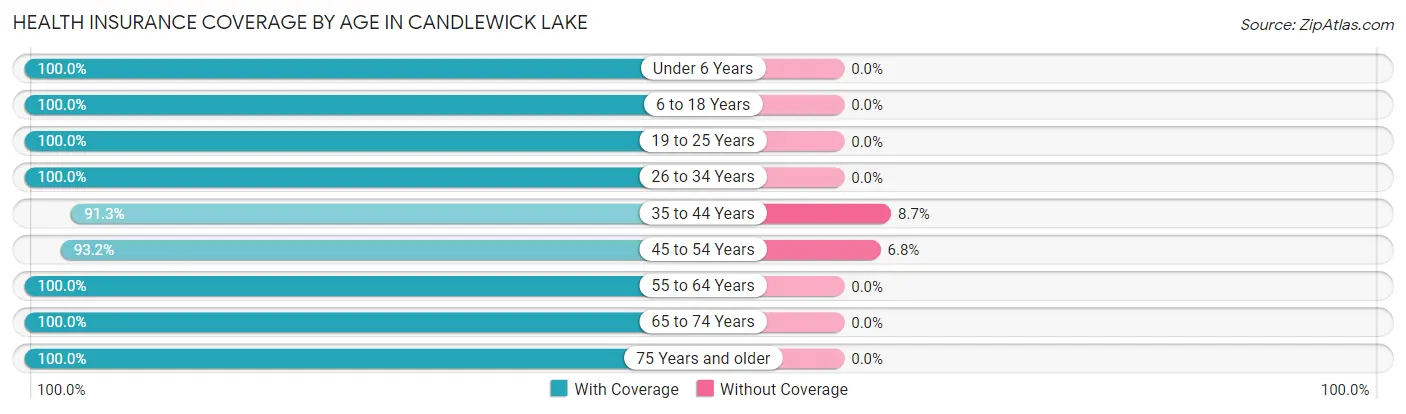
| Age Bracket | With Coverage | Without Coverage |
| Under 6 Years | 225 (100.0%) | 0 (0.0%) |
| 6 to 18 Years | 1,263 (100.0%) | 0 (0.0%) |
| 19 to 25 Years | 492 (100.0%) | 0 (0.0%) |
| 26 to 34 Years | 716 (100.0%) | 0 (0.0%) |
| 35 to 44 Years | 565 (91.3%) | 54 (8.7%) |
| 45 to 54 Years | 702 (93.2%) | 51 (6.8%) |
| 55 to 64 Years | 537 (100.0%) | 0 (0.0%) |
| 65 to 74 Years | 263 (100.0%) | 0 (0.0%) |
| 75 Years and older | 212 (100.0%) | 0 (0.0%) |
| Total | 4,975 (97.9%) | 105 (2.1%) |
Health Insurance Coverage by Citizenship Status in Candlewick Lake
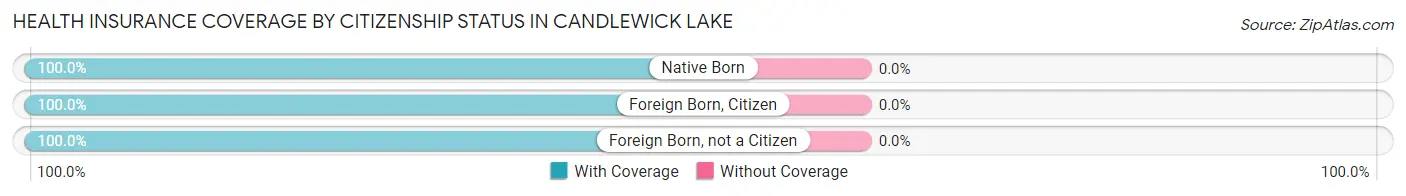
| Citizenship Status | With Coverage | Without Coverage |
| Native Born | 225 (100.0%) | 0 (0.0%) |
| Foreign Born, Citizen | 1,263 (100.0%) | 0 (0.0%) |
| Foreign Born, not a Citizen | 492 (100.0%) | 0 (0.0%) |
Health Insurance Coverage by Household Income in Candlewick Lake
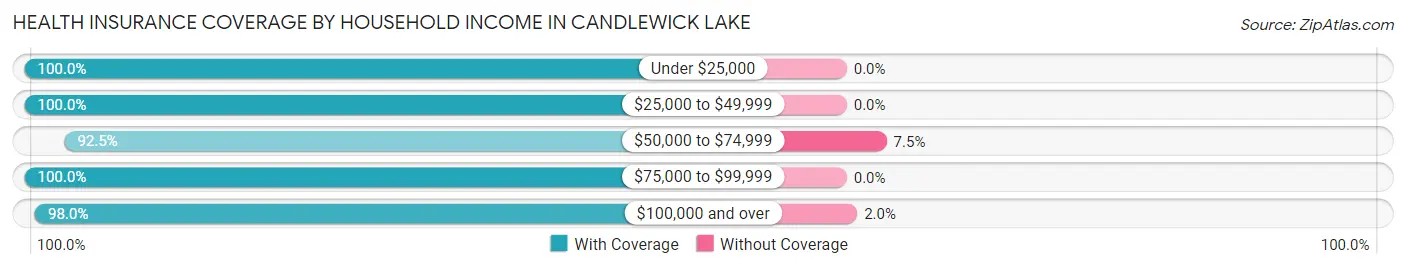
| Household Income | With Coverage | Without Coverage |
| Under $25,000 | 369 (100.0%) | 0 (0.0%) |
| $25,000 to $49,999 | 490 (100.0%) | 0 (0.0%) |
| $50,000 to $74,999 | 483 (92.5%) | 39 (7.5%) |
| $75,000 to $99,999 | 338 (100.0%) | 0 (0.0%) |
| $100,000 and over | 3,295 (98.0%) | 66 (2.0%) |
Public vs Private Health Insurance Coverage by Age in Candlewick Lake
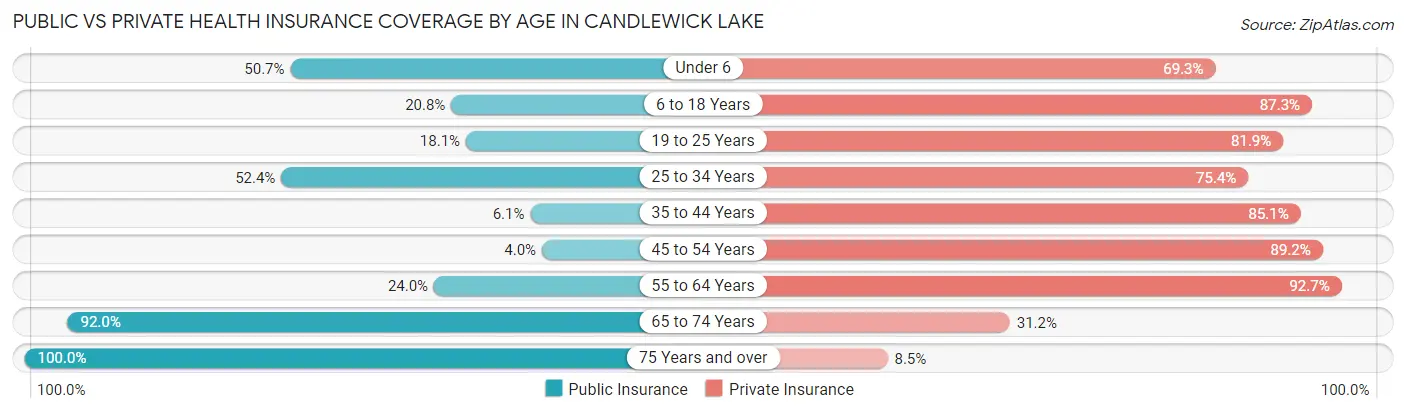
| Age Bracket | Public Insurance | Private Insurance |
| Under 6 | 114 (50.7%) | 156 (69.3%) |
| 6 to 18 Years | 263 (20.8%) | 1,102 (87.3%) |
| 19 to 25 Years | 89 (18.1%) | 403 (81.9%) |
| 25 to 34 Years | 375 (52.4%) | 540 (75.4%) |
| 35 to 44 Years | 38 (6.1%) | 527 (85.1%) |
| 45 to 54 Years | 30 (4.0%) | 672 (89.2%) |
| 55 to 64 Years | 129 (24.0%) | 498 (92.7%) |
| 65 to 74 Years | 242 (92.0%) | 82 (31.2%) |
| 75 Years and over | 212 (100.0%) | 18 (8.5%) |
| Total | 1,492 (29.4%) | 3,998 (78.7%) |
Disability Status by Sex by Age in Candlewick Lake
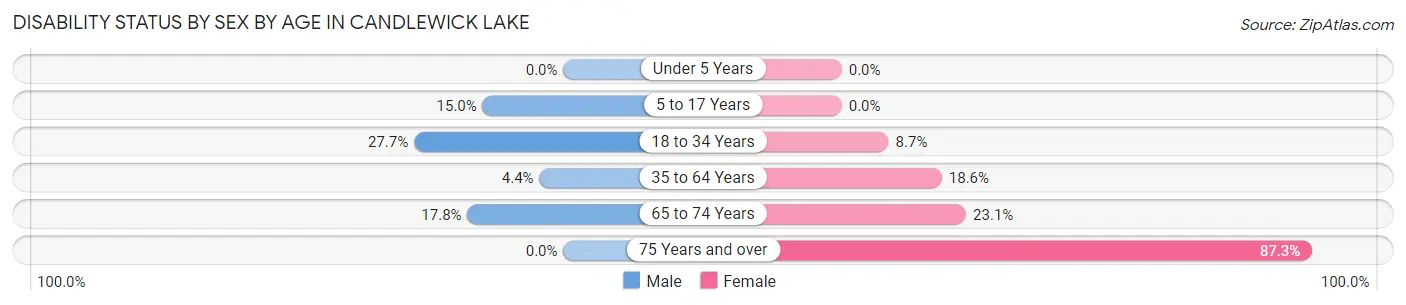
| Age Bracket | Male | Female |
| Under 5 Years | 0 (0.0%) | 0 (0.0%) |
| 5 to 17 Years | 104 (15.0%) | 0 (0.0%) |
| 18 to 34 Years | 179 (27.7%) | 62 (8.7%) |
| 35 to 64 Years | 47 (4.4%) | 158 (18.6%) |
| 65 to 74 Years | 26 (17.8%) | 27 (23.1%) |
| 75 Years and over | 0 (0.0%) | 151 (87.3%) |
Disability Class by Sex by Age in Candlewick Lake
Disability Class: Hearing Difficulty
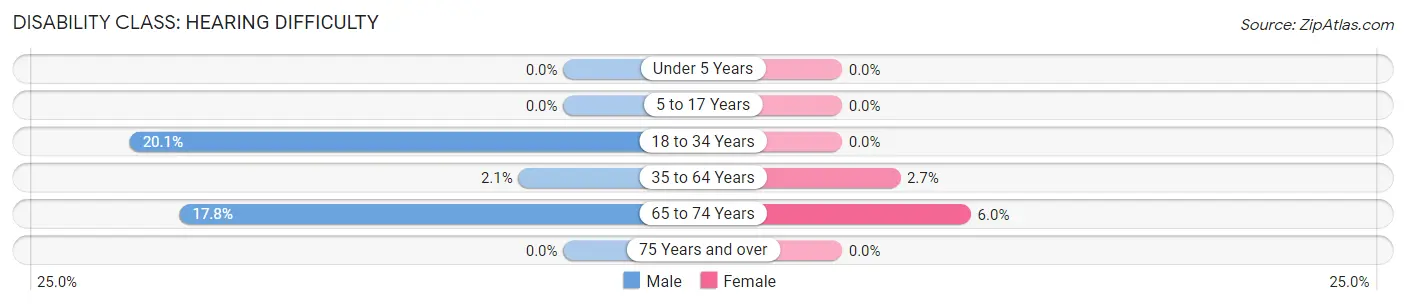
| Age Bracket | Male | Female |
| Under 5 Years | 0 (0.0%) | 0 (0.0%) |
| 5 to 17 Years | 0 (0.0%) | 0 (0.0%) |
| 18 to 34 Years | 130 (20.1%) | 0 (0.0%) |
| 35 to 64 Years | 22 (2.1%) | 23 (2.7%) |
| 65 to 74 Years | 26 (17.8%) | 7 (6.0%) |
| 75 Years and over | 0 (0.0%) | 0 (0.0%) |
Disability Class: Vision Difficulty
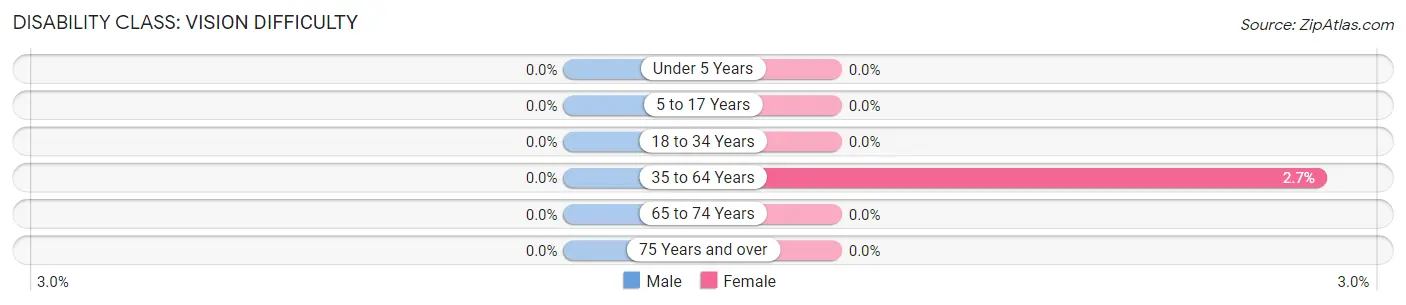
| Age Bracket | Male | Female |
| Under 5 Years | 0 (0.0%) | 0 (0.0%) |
| 5 to 17 Years | 0 (0.0%) | 0 (0.0%) |
| 18 to 34 Years | 0 (0.0%) | 0 (0.0%) |
| 35 to 64 Years | 0 (0.0%) | 23 (2.7%) |
| 65 to 74 Years | 0 (0.0%) | 0 (0.0%) |
| 75 Years and over | 0 (0.0%) | 0 (0.0%) |
Disability Class: Cognitive Difficulty
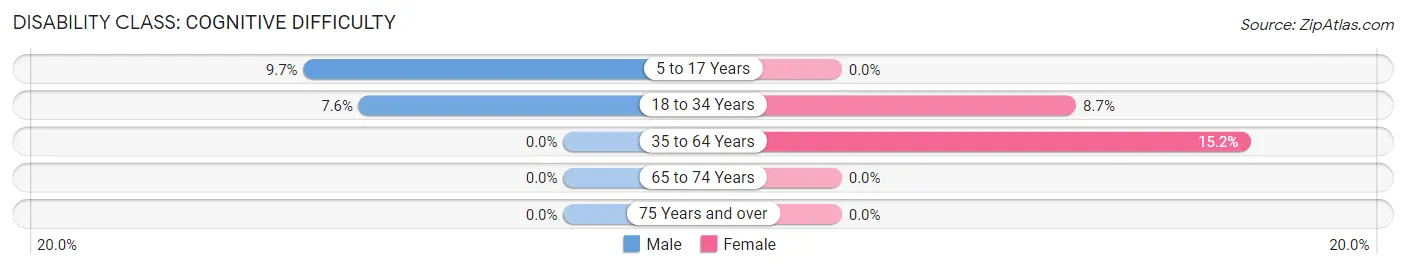
| Age Bracket | Male | Female |
| 5 to 17 Years | 67 (9.7%) | 0 (0.0%) |
| 18 to 34 Years | 49 (7.6%) | 62 (8.7%) |
| 35 to 64 Years | 0 (0.0%) | 129 (15.2%) |
| 65 to 74 Years | 0 (0.0%) | 0 (0.0%) |
| 75 Years and over | 0 (0.0%) | 0 (0.0%) |
Disability Class: Ambulatory Difficulty
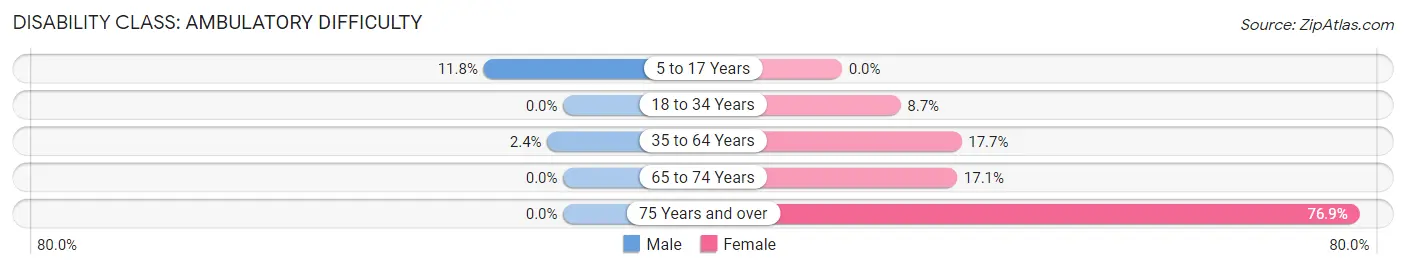
| Age Bracket | Male | Female |
| 5 to 17 Years | 82 (11.8%) | 0 (0.0%) |
| 18 to 34 Years | 0 (0.0%) | 62 (8.7%) |
| 35 to 64 Years | 25 (2.4%) | 151 (17.7%) |
| 65 to 74 Years | 0 (0.0%) | 20 (17.1%) |
| 75 Years and over | 0 (0.0%) | 133 (76.9%) |
Disability Class: Self-Care Difficulty
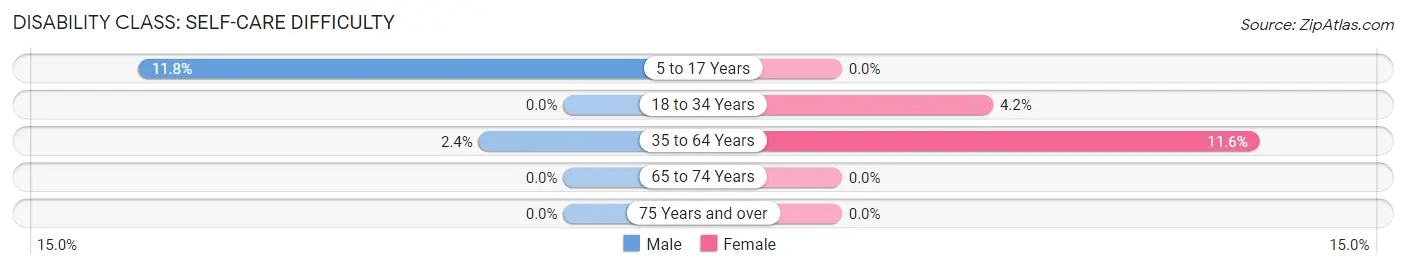
| Age Bracket | Male | Female |
| 5 to 17 Years | 82 (11.8%) | 0 (0.0%) |
| 18 to 34 Years | 0 (0.0%) | 30 (4.2%) |
| 35 to 64 Years | 25 (2.4%) | 99 (11.6%) |
| 65 to 74 Years | 0 (0.0%) | 0 (0.0%) |
| 75 Years and over | 0 (0.0%) | 0 (0.0%) |
Technology Access in Candlewick Lake
Computing Device Access in Candlewick Lake
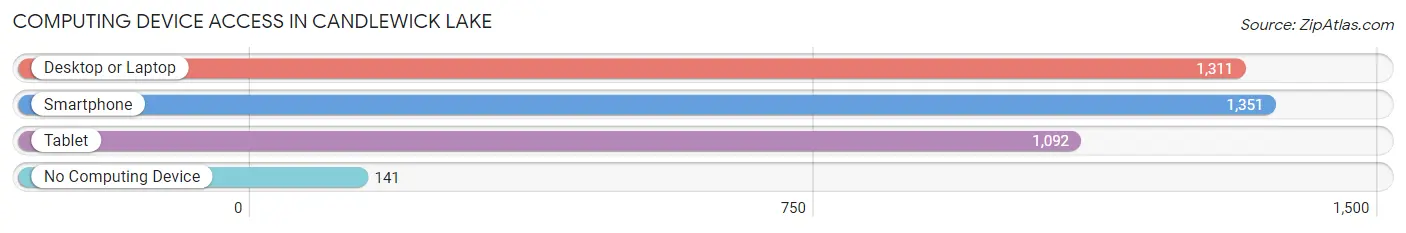
| Device Type | # Households | % Households |
| Desktop or Laptop | 1,311 | 87.5% |
| Smartphone | 1,351 | 90.1% |
| Tablet | 1,092 | 72.9% |
| No Computing Device | 141 | 9.4% |
| Total | 1,499 | 100.0% |
Internet Access in Candlewick Lake
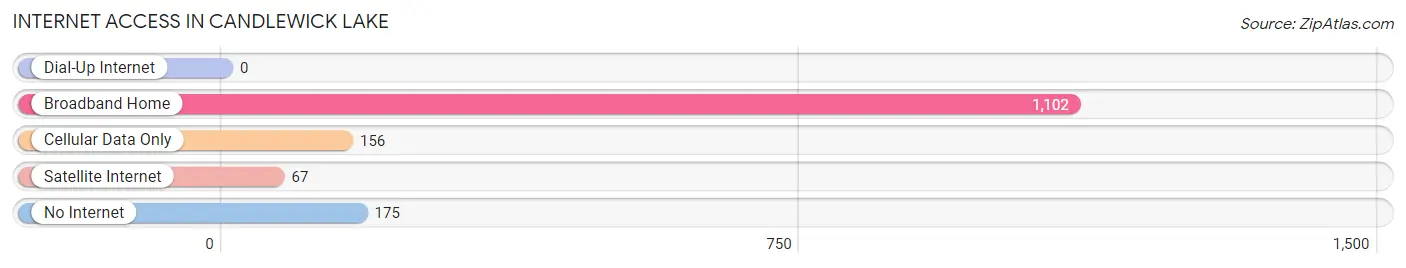
| Internet Type | # Households | % Households |
| Dial-Up Internet | 0 | 0.0% |
| Broadband Home | 1,102 | 73.5% |
| Cellular Data Only | 156 | 10.4% |
| Satellite Internet | 67 | 4.5% |
| No Internet | 175 | 11.7% |
| Total | 1,499 | 100.0% |
Candlewick Lake Summary
Candlewick Lake, Illinois is a small village located in McHenry County, Illinois. It is situated on the shores of Candlewick Lake, a natural lake that is part of the Fox River watershed. The village is located about 40 miles northwest of Chicago and is part of the Chicago metropolitan area. The village has a population of about 1,500 people and is a popular destination for tourists and outdoor enthusiasts.
History
The area around Candlewick Lake has been inhabited for thousands of years. The first settlers in the area were Native Americans, who lived in the area for centuries before the arrival of European settlers. The first Europeans to settle in the area were French fur traders, who arrived in the late 1700s. The area was part of the Northwest Territory until 1818, when it became part of the state of Illinois.
In the early 1800s, the area around Candlewick Lake was mostly farmland. The first settlers in the area were mostly farmers, who grew crops such as corn, wheat, and oats. In the late 1800s, the area began to develop as a resort destination. The first resort in the area was the Candlewick Lake Hotel, which opened in 1891. The hotel was a popular destination for wealthy Chicagoans, who would come to the area to escape the city and enjoy the natural beauty of the lake.
In the early 1900s, the area around Candlewick Lake began to develop as a residential community. The first homes in the area were built in the 1920s and 1930s. The village of Candlewick Lake was officially incorporated in 1945.
Geography
Candlewick Lake is located in McHenry County, Illinois. It is situated on the shores of Candlewick Lake, a natural lake that is part of the Fox River watershed. The lake is about 1,000 acres in size and is a popular destination for fishing, boating, and other outdoor activities. The village is located about 40 miles northwest of Chicago and is part of the Chicago metropolitan area.
The village of Candlewick Lake is located in a rural area, surrounded by farmland and woodlands. The village is located on the edge of the Candlewick Lake State Park, which is a popular destination for outdoor recreation. The park features a variety of activities, including hiking, camping, fishing, and boating.
Economy
The economy of Candlewick Lake is largely based on tourism and outdoor recreation. The village is a popular destination for tourists and outdoor enthusiasts, who come to the area to enjoy the natural beauty of the lake and the surrounding area. The village is also home to several small businesses, including restaurants, shops, and other services.
The village is also home to several manufacturing companies, including a plastics manufacturer and a metal fabrication company. The village is also home to a number of small farms, which produce a variety of crops, including corn, wheat, and oats.
Demographics
As of the 2010 census, the population of Candlewick Lake was 1,500 people. The village is predominantly white, with about 95% of the population being white. The median household income in the village is about $50,000, which is slightly higher than the national average. The village has a low unemployment rate, with only about 4% of the population being unemployed.
Conclusion
Candlewick Lake, Illinois is a small village located in McHenry County, Illinois. It is situated on the shores of Candlewick Lake, a natural lake that is part of the Fox River watershed. The village has a population of about 1,500 people and is a popular destination for tourists and outdoor enthusiasts. The economy of the village is largely based on tourism and outdoor recreation, and the village is home to several small businesses, manufacturing companies, and farms. The village is predominantly white, with a median household income of about $50,000 and a low unemployment rate.
Common Questions
What is the Total Population of Candlewick Lake?
Total Population of Candlewick Lake is 5,080.
What is the Total Male Population of Candlewick Lake?
Total Male Population of Candlewick Lake is 2,743.
What is the Total Female Population of Candlewick Lake?
Total Female Population of Candlewick Lake is 2,337.
What is the Ratio of Males per 100 Females in Candlewick Lake?
There are 117.37 Males per 100 Females in Candlewick Lake.
What is the Ratio of Females per 100 Males in Candlewick Lake?
There are 85.20 Females per 100 Males in Candlewick Lake.
What is the Median Population Age in Candlewick Lake?
Median Population Age in Candlewick Lake is 33.2 Years.
What is the Average Family Size in Candlewick Lake
Average Family Size in Candlewick Lake is 3.9 People.
What is the Average Household Size in Candlewick Lake
Average Household Size in Candlewick Lake is 3.4 People.
What is Per Capita Income in Candlewick Lake?
Per Capita income in Candlewick Lake is $31,430.
What is the Median Family Income in Candlewick Lake?
Median Family Income in Candlewick Lake is $112,635.
What is the Median Household income in Candlewick Lake?
Median Household Income in Candlewick Lake is $107,589.
What is Income or Wage Gap in Candlewick Lake?
Income or Wage Gap in Candlewick Lake is 40.2%.
Women in Candlewick Lake earn 59.8 cents for every dollar earned by a man.
What is Inequality or Gini Index in Candlewick Lake?
Inequality or Gini Index in Candlewick Lake is 0.33.
How Large is the Labor Force in Candlewick Lake?
There are 2,559 People in the Labor Forcein in Candlewick Lake.
What is the Percentage of People in the Labor Force in Candlewick Lake?
63.6% of People are in the Labor Force in Candlewick Lake.
What is the Unemployment Rate in Candlewick Lake?
Unemployment Rate in Candlewick Lake is 3.2%.