Lantana, TX
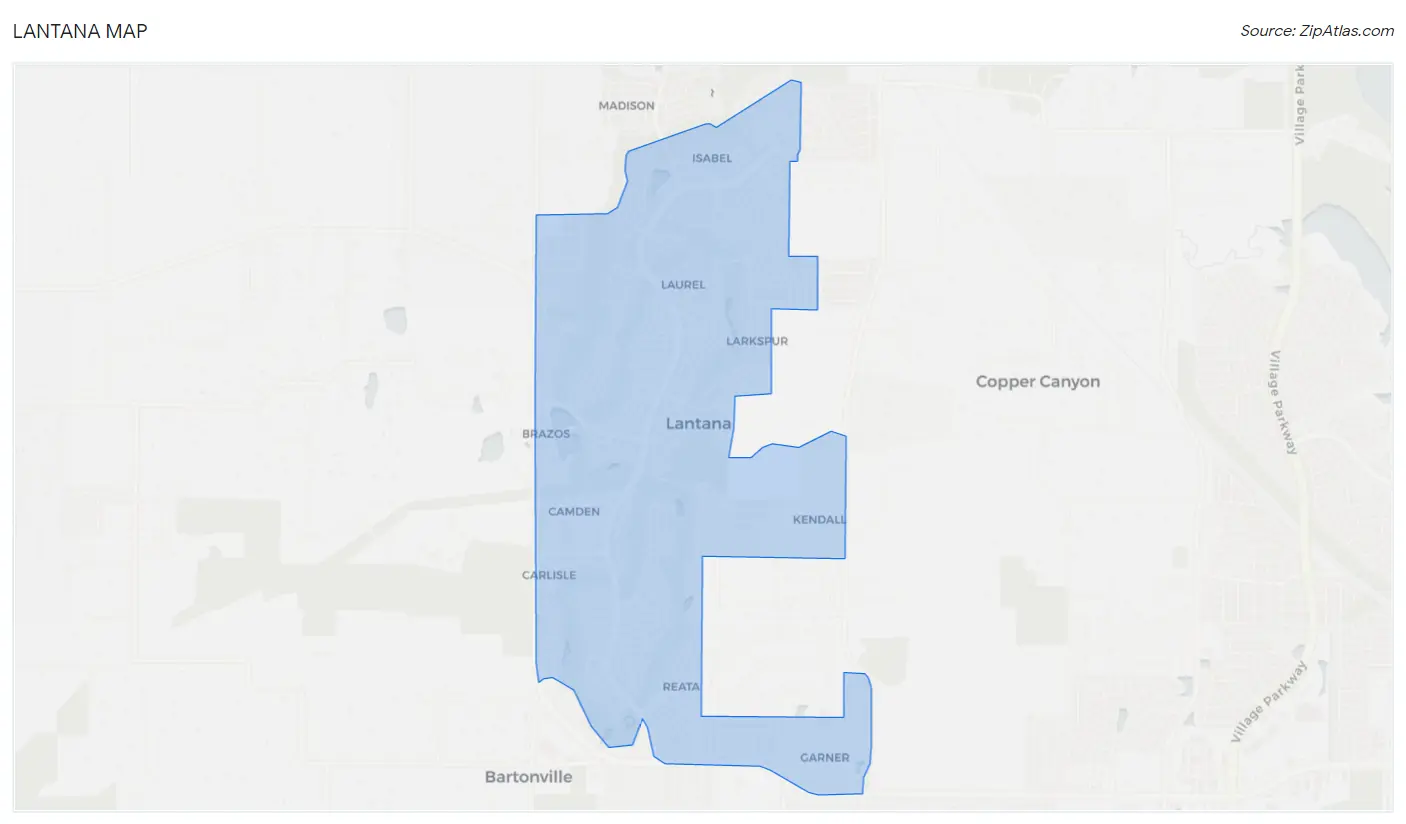
Lantana Map
Lantana Overview
11,706
TOTAL POPULATION
5,158
MALE POPULATION
6,548
FEMALE POPULATION
78.77
MALES / 100 FEMALES
126.95
FEMALES / 100 MALES
39.7
MEDIAN AGE
3.3
AVG FAMILY SIZE
3.1
AVG HOUSEHOLD SIZE
$67,244
PER CAPITA INCOME
$216,761
AVG FAMILY INCOME
$205,412
AVG HOUSEHOLD INCOME
50.1%
WAGE / INCOME GAP [ % ]
49.9¢/ $1
WAGE / INCOME GAP [ $ ]
0.30
INEQUALITY / GINI INDEX
5,412
LABOR FORCE [ PEOPLE ]
62.6%
PERCENT IN LABOR FORCE
3.6%
UNEMPLOYMENT RATE
Lantana Area Codes
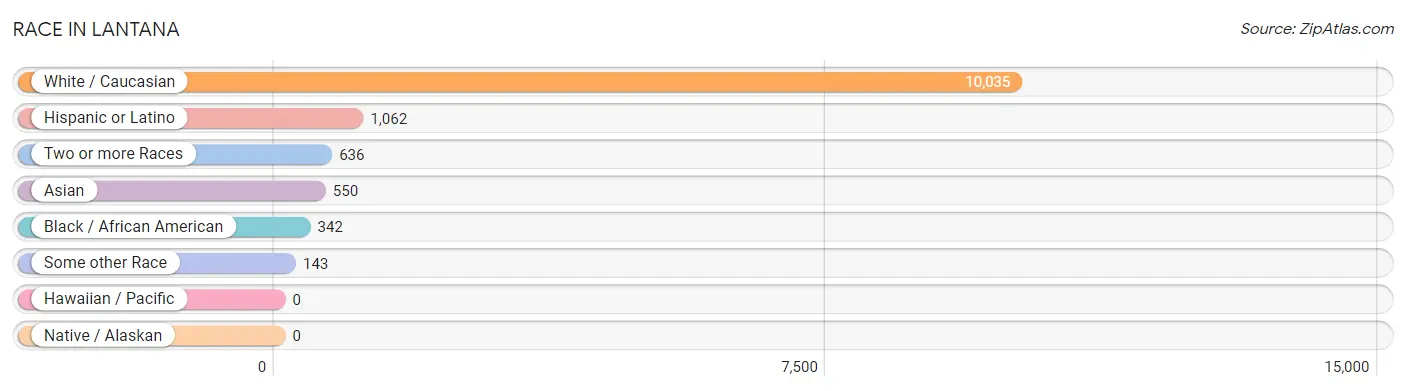
Race in Lantana
The most populous races in Lantana are White / Caucasian (10,035 | 85.7%), Hispanic or Latino (1,062 | 9.1%), and Two or more Races (636 | 5.4%).
| Race | # Population | % Population |
| Asian | 550 | 4.7% |
| Black / African American | 342 | 2.9% |
| Hawaiian / Pacific | 0 | 0.0% |
| Hispanic or Latino | 1,062 | 9.1% |
| Native / Alaskan | 0 | 0.0% |
| White / Caucasian | 10,035 | 85.7% |
| Two or more Races | 636 | 5.4% |
| Some other Race | 143 | 1.2% |
| Total | 11,706 | 100.0% |
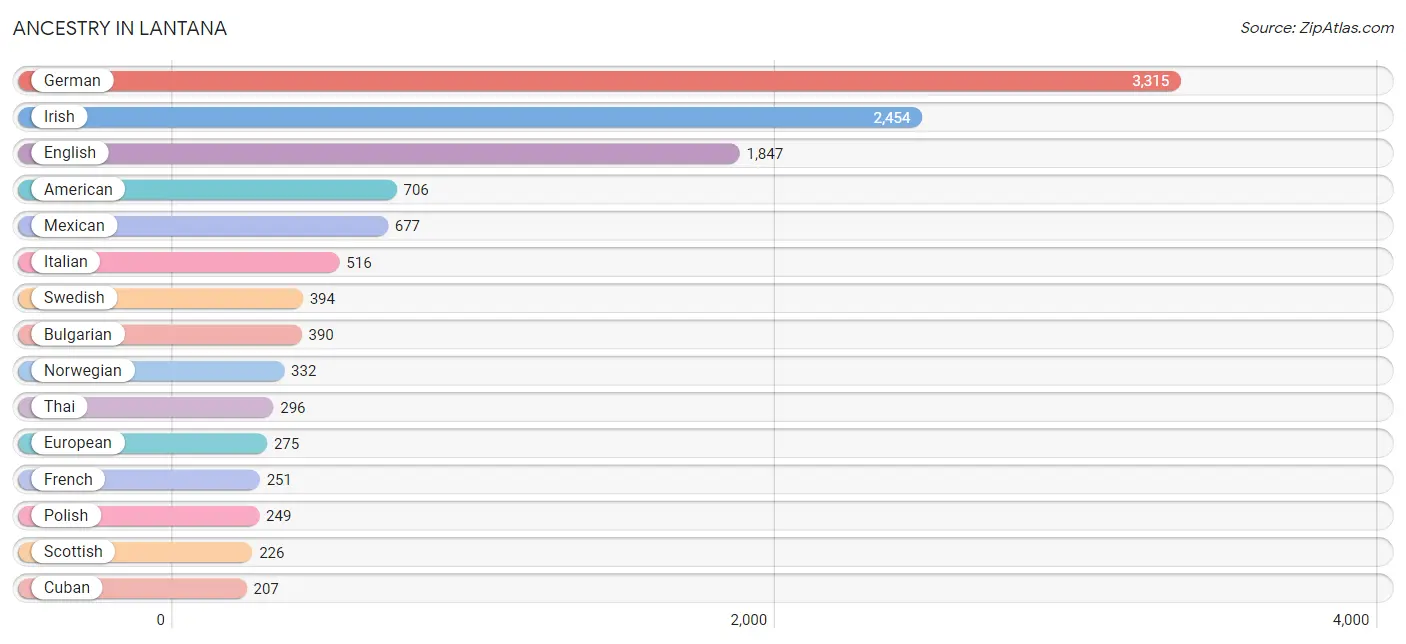
Ancestry in Lantana
The most populous ancestries reported in Lantana are German (3,315 | 28.3%), Irish (2,454 | 21.0%), English (1,847 | 15.8%), American (706 | 6.0%), and Mexican (677 | 5.8%), together accounting for 76.9% of all Lantana residents.
| Ancestry | # Population | % Population |
| American | 706 | 6.0% |
| Arab | 80 | 0.7% |
| Brazilian | 92 | 0.8% |
| British | 194 | 1.7% |
| Bulgarian | 390 | 3.3% |
| Burmese | 89 | 0.8% |
| Cajun | 24 | 0.2% |
| Canadian | 34 | 0.3% |
| Cherokee | 49 | 0.4% |
| Chilean | 72 | 0.6% |
| Colombian | 41 | 0.4% |
| Cuban | 207 | 1.8% |
| Czech | 110 | 0.9% |
| Dutch | 14 | 0.1% |
| English | 1,847 | 15.8% |
| European | 275 | 2.4% |
| French | 251 | 2.1% |
| French Canadian | 31 | 0.3% |
| German | 3,315 | 28.3% |
| Greek | 92 | 0.8% |
| Hungarian | 144 | 1.2% |
| Indian (Asian) | 151 | 1.3% |
| Irish | 2,454 | 21.0% |
| Italian | 516 | 4.4% |
| Lebanese | 80 | 0.7% |
| Luxembourger | 3 | 0.0% |
| Mexican | 677 | 5.8% |
| Norwegian | 332 | 2.8% |
| Polish | 249 | 2.1% |
| Portuguese | 15 | 0.1% |
| Puerto Rican | 20 | 0.2% |
| Russian | 91 | 0.8% |
| Scotch-Irish | 62 | 0.5% |
| Scottish | 226 | 1.9% |
| Serbian | 117 | 1.0% |
| South American | 113 | 1.0% |
| Swedish | 394 | 3.4% |
| Thai | 296 | 2.5% |
| Turkish | 187 | 1.6% |
| Ukrainian | 160 | 1.4% |
| Welsh | 45 | 0.4% | View All 41 Rows |
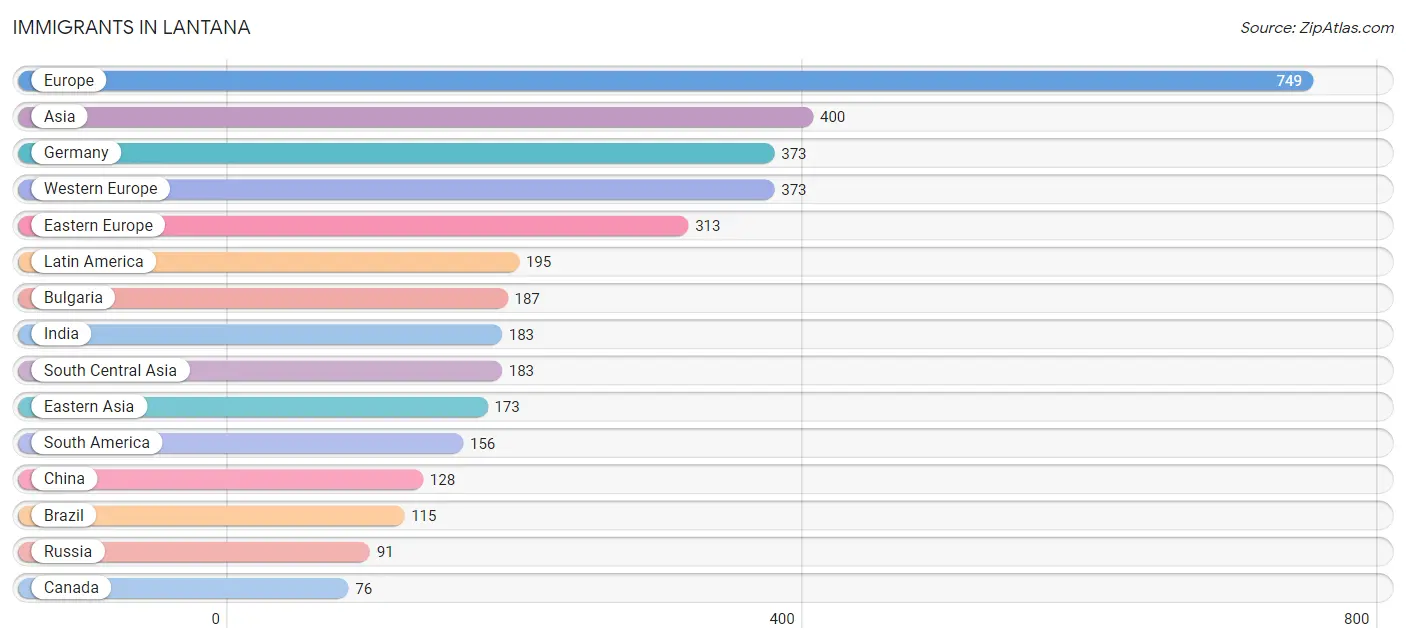
Immigrants in Lantana
The most numerous immigrant groups reported in Lantana came from Europe (749 | 6.4%), Asia (400 | 3.4%), Germany (373 | 3.2%), Western Europe (373 | 3.2%), and Eastern Europe (313 | 2.7%), together accounting for 18.9% of all Lantana residents.
| Immigration Origin | # Population | % Population |
| Africa | 20 | 0.2% |
| Asia | 400 | 3.4% |
| Brazil | 115 | 1.0% |
| Bulgaria | 187 | 1.6% |
| Cambodia | 28 | 0.2% |
| Canada | 76 | 0.6% |
| Central America | 39 | 0.3% |
| China | 128 | 1.1% |
| Colombia | 41 | 0.4% |
| Eastern Africa | 20 | 0.2% |
| Eastern Asia | 173 | 1.5% |
| Eastern Europe | 313 | 2.7% |
| Europe | 749 | 6.4% |
| Germany | 373 | 3.2% |
| India | 183 | 1.6% |
| Korea | 45 | 0.4% |
| Latin America | 195 | 1.7% |
| Mexico | 39 | 0.3% |
| Northern Europe | 63 | 0.5% |
| Poland | 35 | 0.3% |
| Russia | 91 | 0.8% |
| South America | 156 | 1.3% |
| South Central Asia | 183 | 1.6% |
| South Eastern Asia | 44 | 0.4% |
| Taiwan | 46 | 0.4% |
| Vietnam | 16 | 0.1% |
| Western Europe | 373 | 3.2% | View All 27 Rows |
Sex and Age in Lantana
Sex and Age in Lantana
The most populous age groups in Lantana are 45 to 49 Years (660 | 12.8%) for men and 10 to 14 Years (777 | 11.9%) for women.
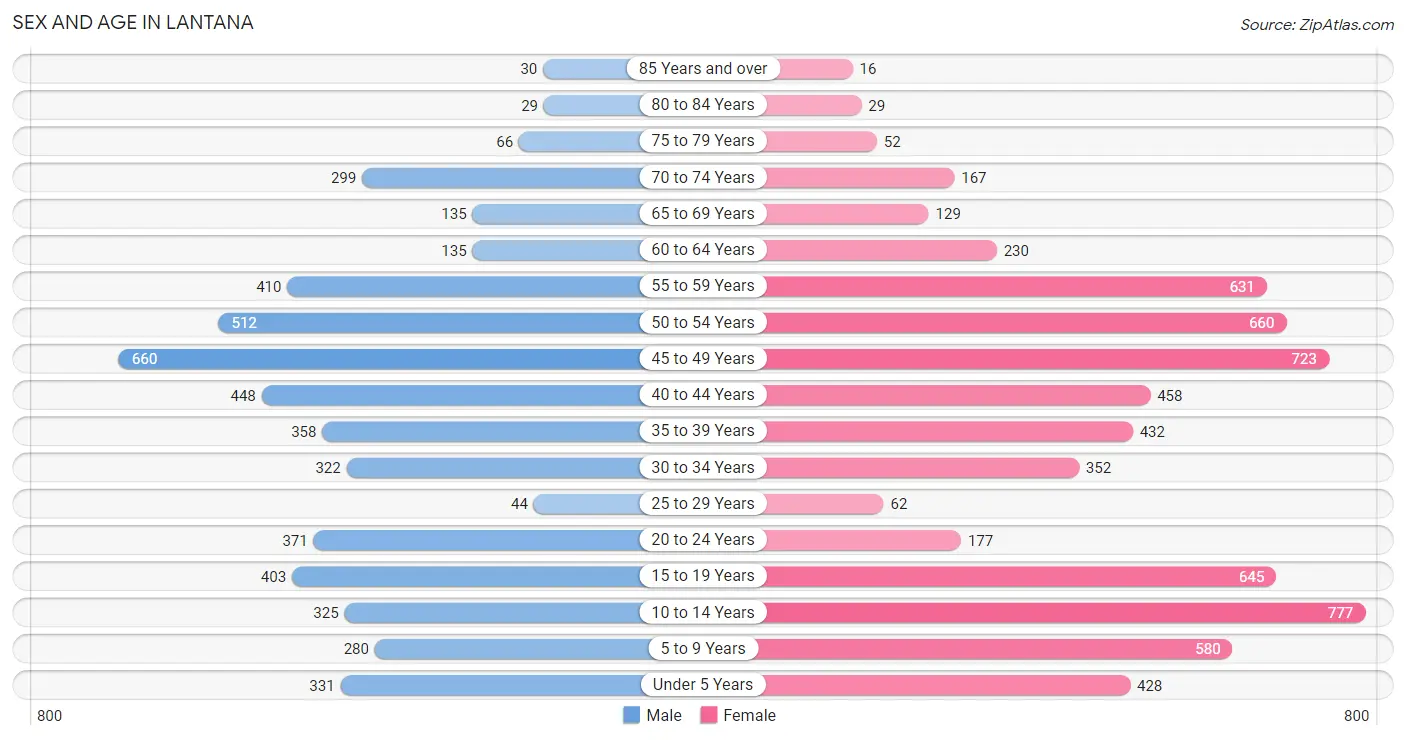
| Age Bracket | Male | Female |
| Under 5 Years | 331 (6.4%) | 428 (6.5%) |
| 5 to 9 Years | 280 (5.4%) | 580 (8.9%) |
| 10 to 14 Years | 325 (6.3%) | 777 (11.9%) |
| 15 to 19 Years | 403 (7.8%) | 645 (9.9%) |
| 20 to 24 Years | 371 (7.2%) | 177 (2.7%) |
| 25 to 29 Years | 44 (0.9%) | 62 (0.9%) |
| 30 to 34 Years | 322 (6.2%) | 352 (5.4%) |
| 35 to 39 Years | 358 (6.9%) | 432 (6.6%) |
| 40 to 44 Years | 448 (8.7%) | 458 (7.0%) |
| 45 to 49 Years | 660 (12.8%) | 723 (11.0%) |
| 50 to 54 Years | 512 (9.9%) | 660 (10.1%) |
| 55 to 59 Years | 410 (8.0%) | 631 (9.6%) |
| 60 to 64 Years | 135 (2.6%) | 230 (3.5%) |
| 65 to 69 Years | 135 (2.6%) | 129 (2.0%) |
| 70 to 74 Years | 299 (5.8%) | 167 (2.5%) |
| 75 to 79 Years | 66 (1.3%) | 52 (0.8%) |
| 80 to 84 Years | 29 (0.6%) | 29 (0.4%) |
| 85 Years and over | 30 (0.6%) | 16 (0.2%) |
| Total | 5,158 (100.0%) | 6,548 (100.0%) |
Families and Households in Lantana
Median Family Size in Lantana
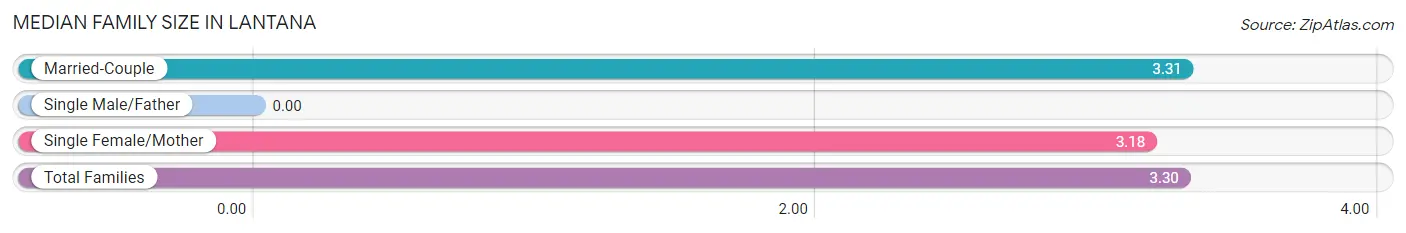
| Family Type | # Families | Family Size |
| Married-Couple | 3,216 (95.4%) | 3.31 |
| Single Male/Father | 0 (0.0%) | - |
| Single Female/Mother | 157 (4.6%) | 3.18 |
| Total Families | 3,373 (100.0%) | 3.30 |
Median Household Size in Lantana
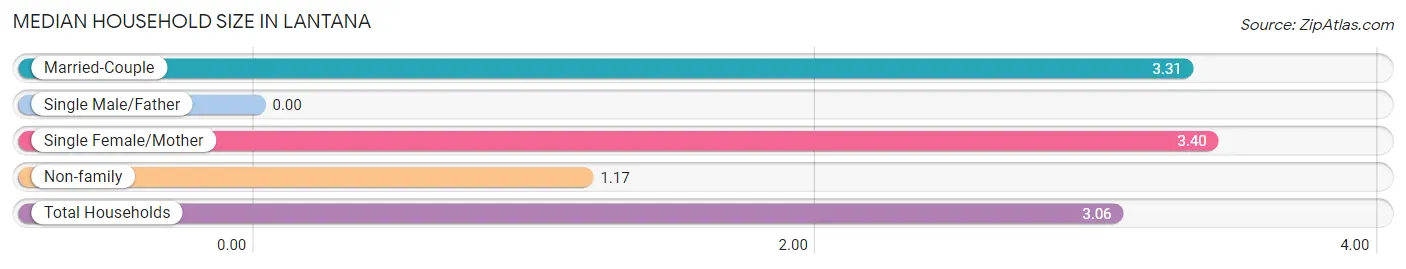
| Household Type | # Households | Household Size |
| Married-Couple | 3,216 (84.0%) | 3.31 |
| Single Male/Father | 0 (0.0%) | - |
| Single Female/Mother | 157 (4.1%) | 3.40 |
| Non-family | 457 (11.9%) | 1.17 |
| Total Households | 3,830 (100.0%) | 3.06 |
Household Size by Marriage Status in Lantana
Out of a total of 3,830 households in Lantana, 3,373 (88.1%) are family households, while 457 (11.9%) are nonfamily households. The most numerous type of family households are 2-person households, comprising 1,049, and the most common type of nonfamily households are 1-person households, comprising 411.
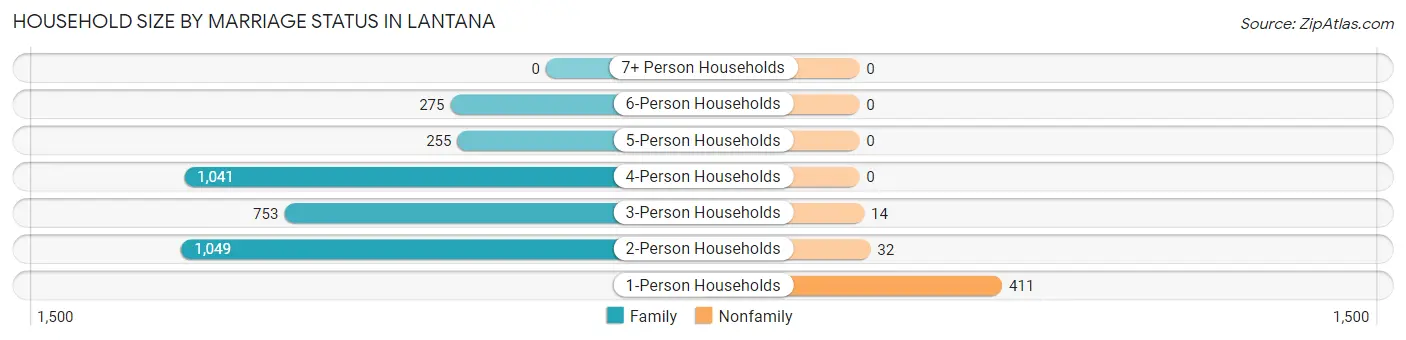
| Household Size | Family Households | Nonfamily Households |
| 1-Person Households | - | 411 (10.7%) |
| 2-Person Households | 1,049 (27.4%) | 32 (0.8%) |
| 3-Person Households | 753 (19.7%) | 14 (0.4%) |
| 4-Person Households | 1,041 (27.2%) | 0 (0.0%) |
| 5-Person Households | 255 (6.7%) | 0 (0.0%) |
| 6-Person Households | 275 (7.2%) | 0 (0.0%) |
| 7+ Person Households | 0 (0.0%) | 0 (0.0%) |
| Total | 3,373 (88.1%) | 457 (11.9%) |
Female Fertility in Lantana
Fertility by Age in Lantana
Average fertility rate in Lantana is 23.0 births per 1,000 women. Women in the age bracket of 20 to 34 years have the highest fertility rate with 118.0 births per 1,000 women. Women in the age bracket of 20 to 34 years acount for 100.0% of all women with births.
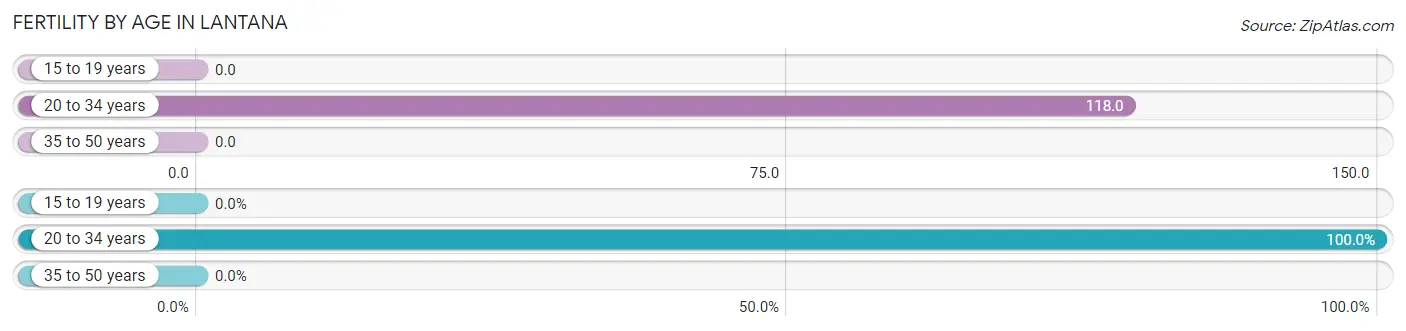
| Age Bracket | Women with Births | Births / 1,000 Women |
| 15 to 19 years | 0 (0.0%) | 0.0 |
| 20 to 34 years | 70 (100.0%) | 118.0 |
| 35 to 50 years | 0 (0.0%) | 0.0 |
| Total | 70 (100.0%) | 23.0 |
Fertility by Age by Marriage Status in Lantana
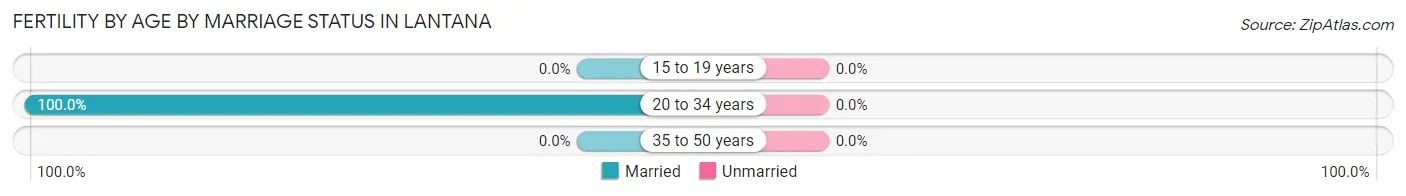
| Age Bracket | Married | Unmarried |
| 15 to 19 years | 0 (0.0%) | 0 (0.0%) |
| 20 to 34 years | 70 (100.0%) | 0 (0.0%) |
| 35 to 50 years | 0 (0.0%) | 0 (0.0%) |
| Total | 70 (100.0%) | 0 (0.0%) |
Fertility by Education in Lantana
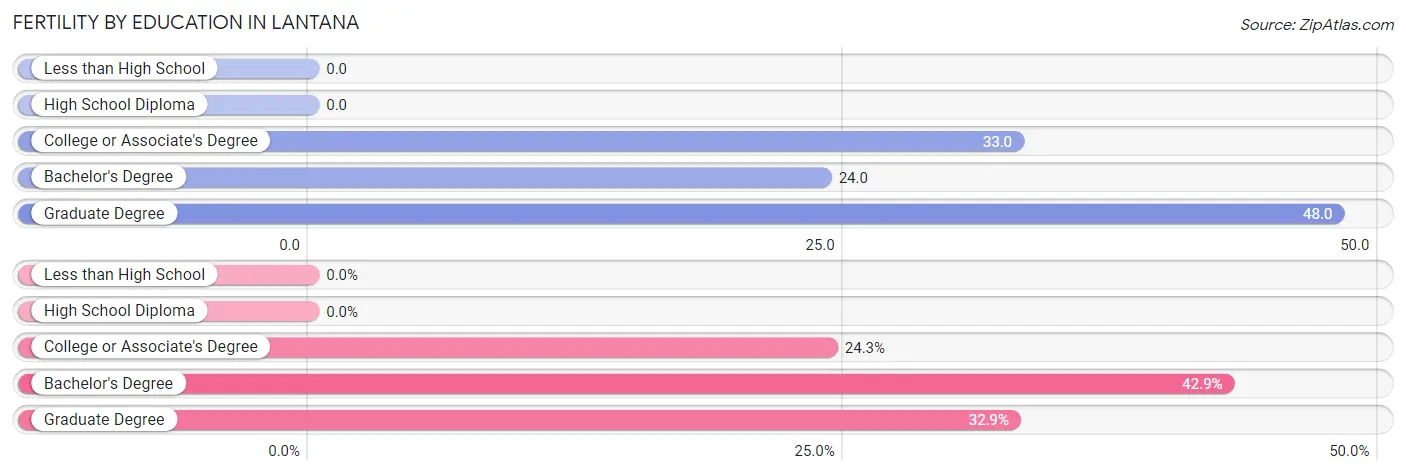
| Educational Attainment | Women with Births | Births / 1,000 Women |
| Less than High School | 0 (0.0%) | 0.0 |
| High School Diploma | 0 (0.0%) | 0.0 |
| College or Associate's Degree | 17 (24.3%) | 33.0 |
| Bachelor's Degree | 30 (42.9%) | 24.0 |
| Graduate Degree | 23 (32.9%) | 48.0 |
| Total | 70 (100.0%) | 23.0 |
Fertility by Education by Marriage Status in Lantana
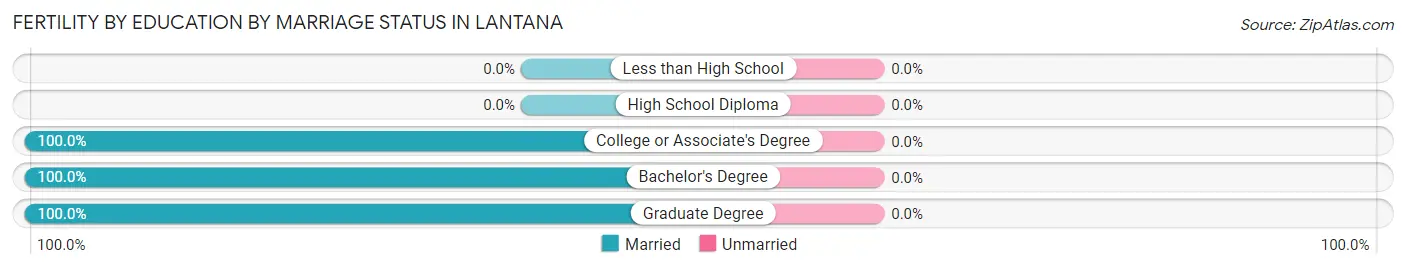
| Educational Attainment | Married | Unmarried |
| Less than High School | 0 (0.0%) | 0 (0.0%) |
| High School Diploma | 0 (0.0%) | 0 (0.0%) |
| College or Associate's Degree | 17 (100.0%) | 0 (0.0%) |
| Bachelor's Degree | 30 (100.0%) | 0 (0.0%) |
| Graduate Degree | 23 (100.0%) | 0 (0.0%) |
| Total | 70 (100.0%) | 0 (0.0%) |
Income in Lantana
Income Overview in Lantana
Per Capita Income in Lantana is $67,244, while median incomes of families and households are $216,761 and $205,412 respectively.
| Characteristic | Number | Measure |
| Per Capita Income | 11,706 | $67,244 |
| Median Family Income | 3,373 | $216,761 |
| Mean Family Income | 3,373 | $223,353 |
| Median Household Income | 3,830 | $205,412 |
| Mean Household Income | 3,830 | $209,535 |
| Income Deficit | 3,373 | $0 |
| Wage / Income Gap (%) | 11,706 | 50.14% |
| Wage / Income Gap ($) | 11,706 | 49.86¢ per $1 |
| Gini / Inequality Index | 11,706 | 0.30 |
Earnings by Sex in Lantana
Average Earnings in Lantana are $103,902, $137,222 for men and $68,413 for women, a difference of 50.1%.
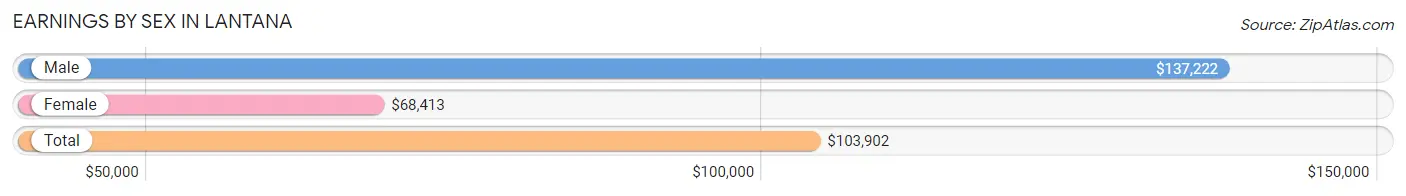
| Sex | Number | Average Earnings |
| Male | 3,312 (57.9%) | $137,222 |
| Female | 2,410 (42.1%) | $68,413 |
| Total | 5,722 (100.0%) | $103,902 |
Earnings by Sex by Income Bracket in Lantana
The most common earnings brackets in Lantana are $100,000+ for men (2,325 | 70.2%) and $100,000+ for women (676 | 28.1%).
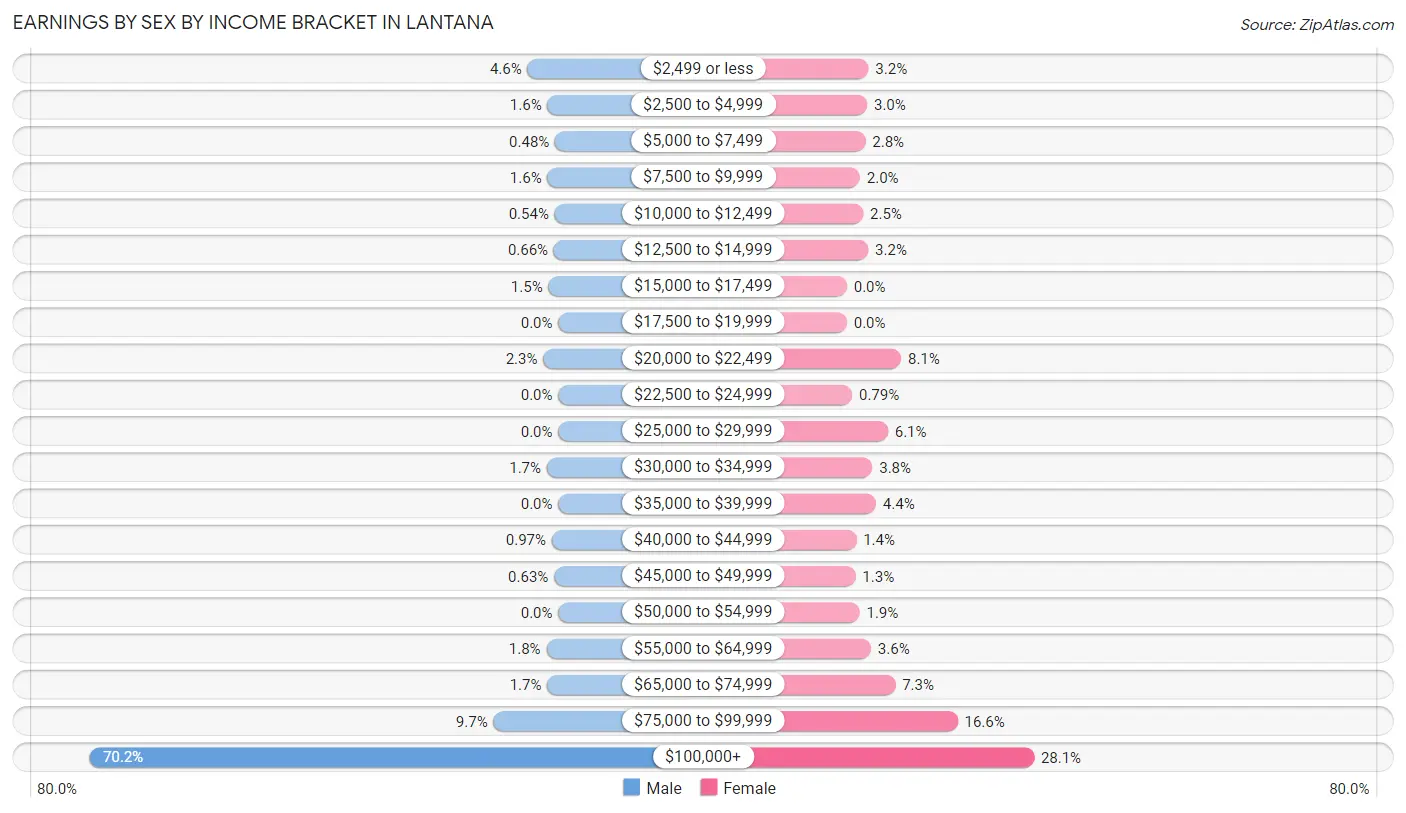
| Income | Male | Female |
| $2,499 or less | 153 (4.6%) | 78 (3.2%) |
| $2,500 to $4,999 | 54 (1.6%) | 73 (3.0%) |
| $5,000 to $7,499 | 16 (0.5%) | 67 (2.8%) |
| $7,500 to $9,999 | 54 (1.6%) | 47 (1.9%) |
| $10,000 to $12,499 | 18 (0.5%) | 59 (2.5%) |
| $12,500 to $14,999 | 22 (0.7%) | 77 (3.2%) |
| $15,000 to $17,499 | 49 (1.5%) | 0 (0.0%) |
| $17,500 to $19,999 | 0 (0.0%) | 0 (0.0%) |
| $20,000 to $22,499 | 75 (2.3%) | 196 (8.1%) |
| $22,500 to $24,999 | 0 (0.0%) | 19 (0.8%) |
| $25,000 to $29,999 | 0 (0.0%) | 148 (6.1%) |
| $30,000 to $34,999 | 57 (1.7%) | 92 (3.8%) |
| $35,000 to $39,999 | 0 (0.0%) | 105 (4.4%) |
| $40,000 to $44,999 | 32 (1.0%) | 34 (1.4%) |
| $45,000 to $49,999 | 21 (0.6%) | 31 (1.3%) |
| $50,000 to $54,999 | 0 (0.0%) | 46 (1.9%) |
| $55,000 to $64,999 | 59 (1.8%) | 87 (3.6%) |
| $65,000 to $74,999 | 55 (1.7%) | 175 (7.3%) |
| $75,000 to $99,999 | 322 (9.7%) | 400 (16.6%) |
| $100,000+ | 2,325 (70.2%) | 676 (28.1%) |
| Total | 3,312 (100.0%) | 2,410 (100.0%) |
Earnings by Sex by Educational Attainment in Lantana
Average earnings in Lantana are $158,347 for men and $69,633 for women, a difference of 56.0%. Men with an educational attainment of bachelor's degree enjoy the highest average annual earnings of $173,833, while those with college or associate's degree education earn the least with $104,159. Women with an educational attainment of graduate degree earn the most with the average annual earnings of $86,923, while those with high school diploma education have the smallest earnings of $21,402.
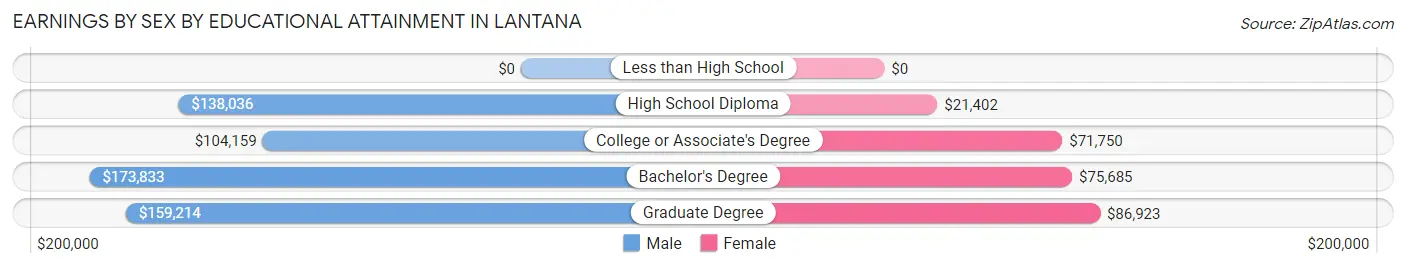
| Educational Attainment | Male Income | Female Income |
| Less than High School | - | - |
| High School Diploma | $138,036 | $21,402 |
| College or Associate's Degree | $104,159 | $71,750 |
| Bachelor's Degree | $173,833 | $75,685 |
| Graduate Degree | $159,214 | $86,923 |
| Total | $158,347 | $69,633 |
Family Income in Lantana
Family Income Brackets in Lantana
According to the Lantana family income data, there are 1,855 families falling into the $200,000+ income range, which is the most common income bracket and makes up 55.0% of all families.
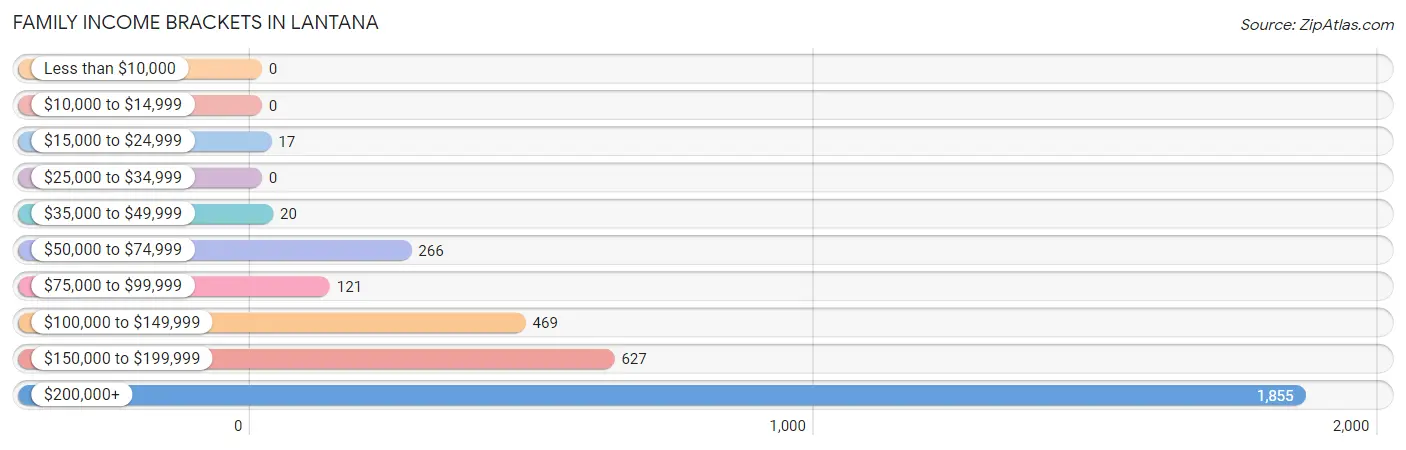
| Income Bracket | # Families | % Families |
| Less than $10,000 | 0 | 0.0% |
| $10,000 to $14,999 | 0 | 0.0% |
| $15,000 to $24,999 | 17 | 0.5% |
| $25,000 to $34,999 | 0 | 0.0% |
| $35,000 to $49,999 | 20 | 0.6% |
| $50,000 to $74,999 | 266 | 7.9% |
| $75,000 to $99,999 | 121 | 3.6% |
| $100,000 to $149,999 | 469 | 13.9% |
| $150,000 to $199,999 | 627 | 18.6% |
| $200,000+ | 1,855 | 55.0% |
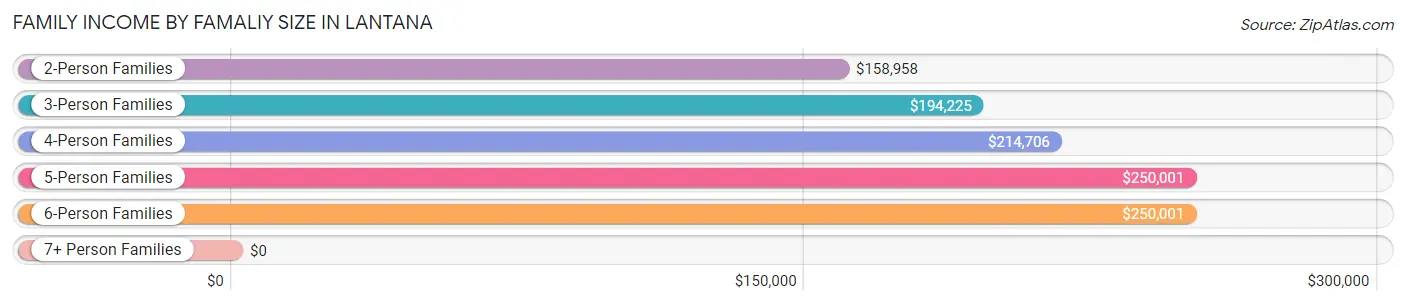
Family Income by Famaliy Size in Lantana
5-person families (234 | 6.9%) account for the highest median family income in Lantana with $250,001 per family, while 2-person families (1,049 | 31.1%) have the highest median income of $79,479 per family member.
| Income Bracket | # Families | Median Income |
| 2-Person Families | 1,049 (31.1%) | $158,958 |
| 3-Person Families | 753 (22.3%) | $194,225 |
| 4-Person Families | 1,062 (31.5%) | $214,706 |
| 5-Person Families | 234 (6.9%) | $250,001 |
| 6-Person Families | 275 (8.2%) | $250,001 |
| 7+ Person Families | 0 (0.0%) | $0 |
| Total | 3,373 (100.0%) | $216,761 |
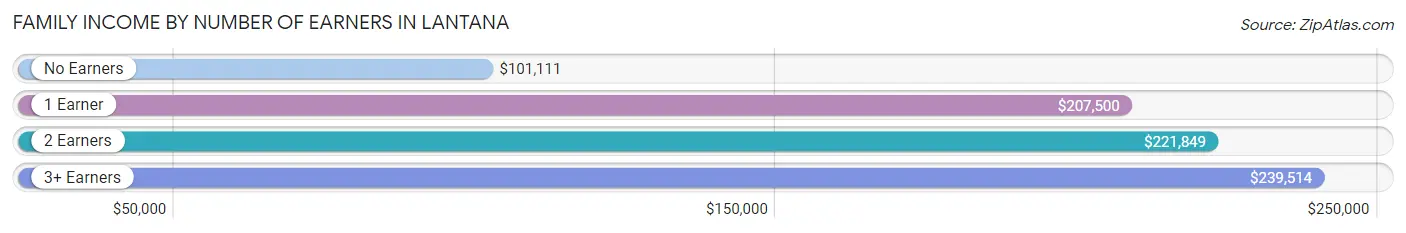
Family Income by Number of Earners in Lantana
The median family income in Lantana is $216,761, with families comprising 3+ earners (231) having the highest median family income of $239,514, while families with no earners (140) have the lowest median family income of $101,111, accounting for 6.9% and 4.2% of families, respectively.
| Number of Earners | # Families | Median Income |
| No Earners | 140 (4.2%) | $101,111 |
| 1 Earner | 1,468 (43.5%) | $207,500 |
| 2 Earners | 1,534 (45.5%) | $221,849 |
| 3+ Earners | 231 (6.9%) | $239,514 |
| Total | 3,373 (100.0%) | $216,761 |
Household Income in Lantana
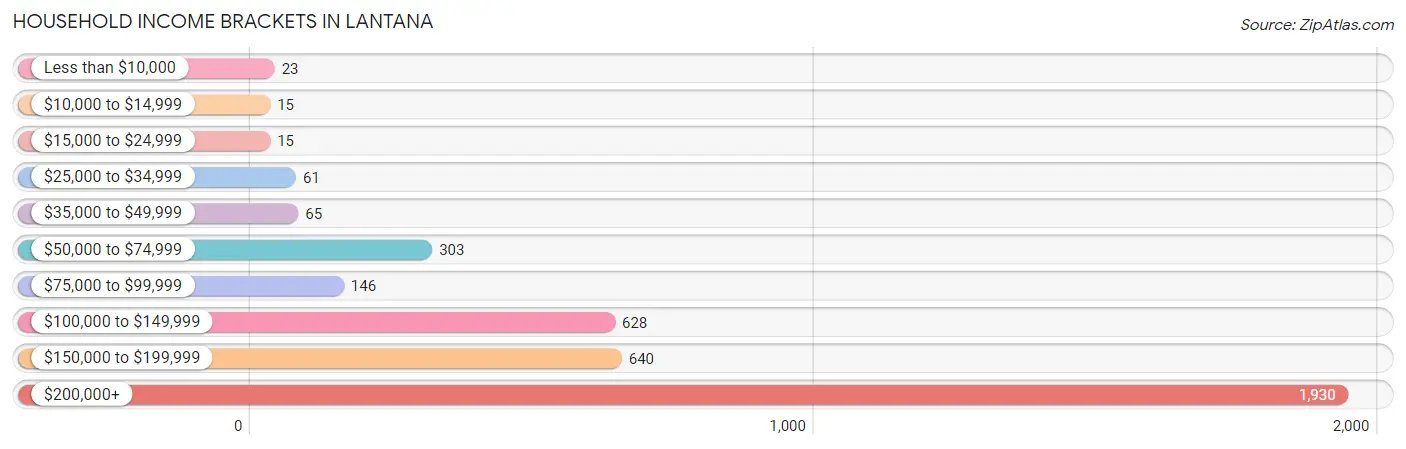
Household Income Brackets in Lantana
With 1,930 households falling in the category, the $200,000+ income range is the most frequent in Lantana, accounting for 50.4% of all households. In contrast, only 15 households (0.4%) fall into the $10,000 to $14,999 income bracket, making it the least populous group.
| Income Bracket | # Households | % Households |
| Less than $10,000 | 23 | 0.6% |
| $10,000 to $14,999 | 15 | 0.4% |
| $15,000 to $24,999 | 15 | 0.4% |
| $25,000 to $34,999 | 61 | 1.6% |
| $35,000 to $49,999 | 65 | 1.7% |
| $50,000 to $74,999 | 303 | 7.9% |
| $75,000 to $99,999 | 146 | 3.8% |
| $100,000 to $149,999 | 628 | 16.4% |
| $150,000 to $199,999 | 640 | 16.7% |
| $200,000+ | 1,930 | 50.4% |
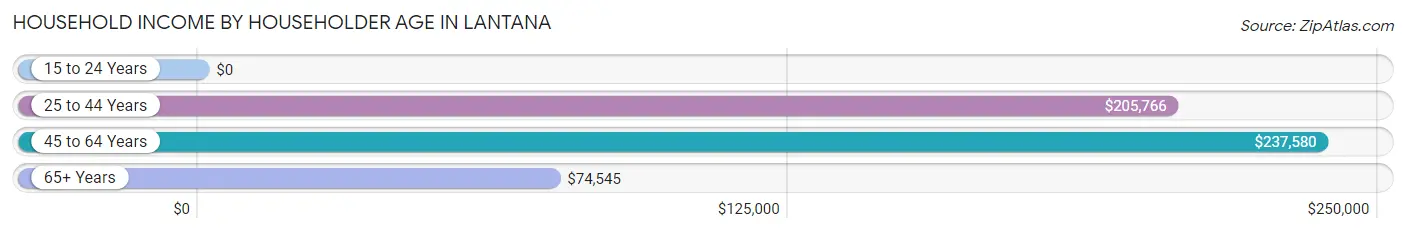
Household Income by Householder Age in Lantana
The median household income in Lantana is $205,412, with the highest median household income of $237,580 found in the 45 to 64 years age bracket for the primary householder. A total of 1,939 households (50.6%) fall into this category.
| Income Bracket | # Households | Median Income |
| 15 to 24 Years | 0 (0.0%) | $0 |
| 25 to 44 Years | 1,213 (31.7%) | $205,766 |
| 45 to 64 Years | 1,939 (50.6%) | $237,580 |
| 65+ Years | 678 (17.7%) | $74,545 |
| Total | 3,830 (100.0%) | $205,412 |
Poverty in Lantana
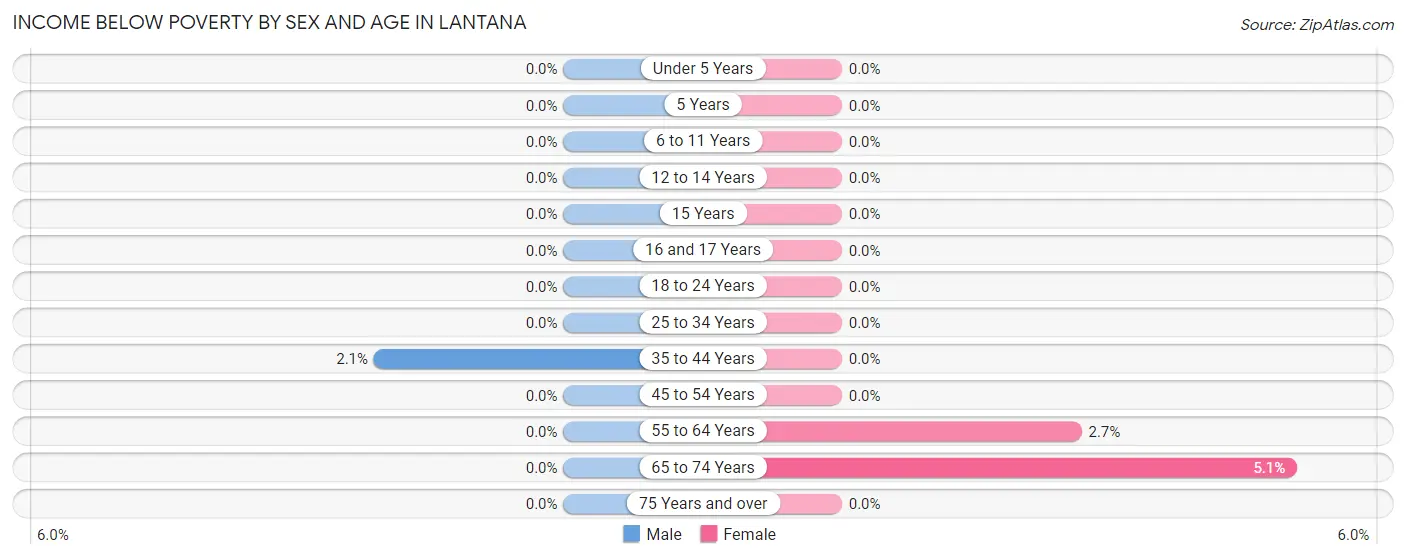
Income Below Poverty by Sex and Age in Lantana
With 0.3% poverty level for males and 0.6% for females among the residents of Lantana, 35 to 44 year old males and 65 to 74 year old females are the most vulnerable to poverty, with 17 males (2.1%) and 15 females (5.1%) in their respective age groups living below the poverty level.
| Age Bracket | Male | Female |
| Under 5 Years | 0 (0.0%) | 0 (0.0%) |
| 5 Years | 0 (0.0%) | 0 (0.0%) |
| 6 to 11 Years | 0 (0.0%) | 0 (0.0%) |
| 12 to 14 Years | 0 (0.0%) | 0 (0.0%) |
| 15 Years | 0 (0.0%) | 0 (0.0%) |
| 16 and 17 Years | 0 (0.0%) | 0 (0.0%) |
| 18 to 24 Years | 0 (0.0%) | 0 (0.0%) |
| 25 to 34 Years | 0 (0.0%) | 0 (0.0%) |
| 35 to 44 Years | 17 (2.1%) | 0 (0.0%) |
| 45 to 54 Years | 0 (0.0%) | 0 (0.0%) |
| 55 to 64 Years | 0 (0.0%) | 23 (2.7%) |
| 65 to 74 Years | 0 (0.0%) | 15 (5.1%) |
| 75 Years and over | 0 (0.0%) | 0 (0.0%) |
| Total | 17 (0.3%) | 38 (0.6%) |
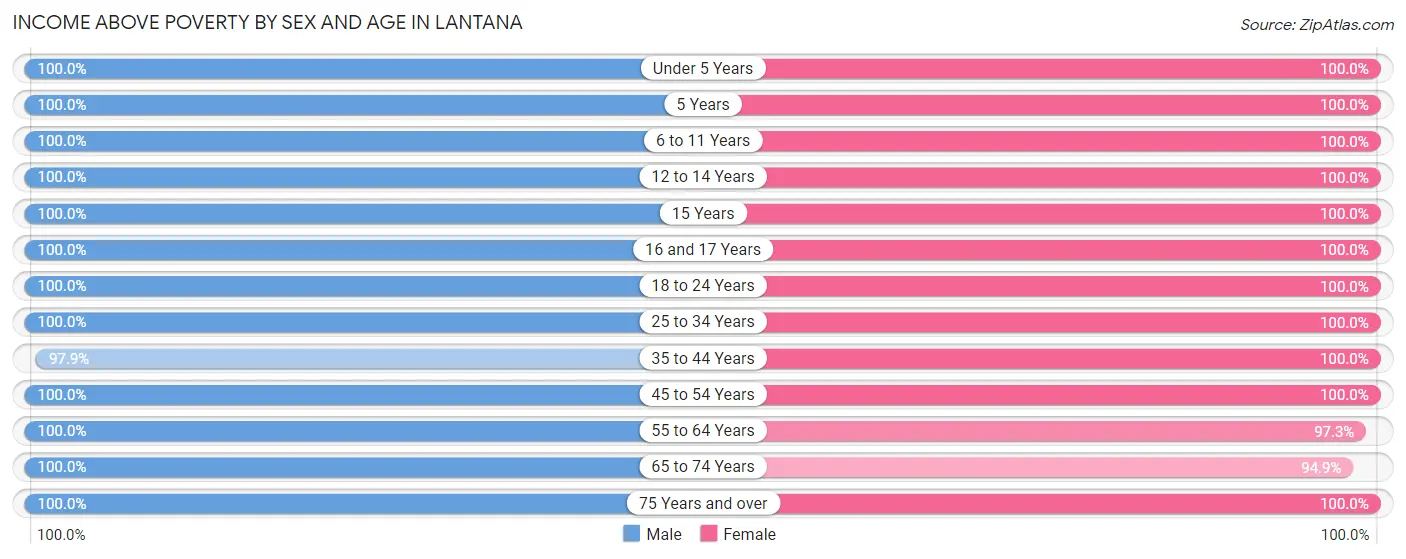
Income Above Poverty by Sex and Age in Lantana
According to the poverty statistics in Lantana, males aged under 5 years and females aged under 5 years are the age groups that are most secure financially, with 100.0% of males and 100.0% of females in these age groups living above the poverty line.
| Age Bracket | Male | Female |
| Under 5 Years | 331 (100.0%) | 428 (100.0%) |
| 5 Years | 54 (100.0%) | 46 (100.0%) |
| 6 to 11 Years | 301 (100.0%) | 775 (100.0%) |
| 12 to 14 Years | 250 (100.0%) | 536 (100.0%) |
| 15 Years | 177 (100.0%) | 163 (100.0%) |
| 16 and 17 Years | 155 (100.0%) | 473 (100.0%) |
| 18 to 24 Years | 442 (100.0%) | 186 (100.0%) |
| 25 to 34 Years | 366 (100.0%) | 414 (100.0%) |
| 35 to 44 Years | 789 (97.9%) | 890 (100.0%) |
| 45 to 54 Years | 1,172 (100.0%) | 1,383 (100.0%) |
| 55 to 64 Years | 545 (100.0%) | 838 (97.3%) |
| 65 to 74 Years | 434 (100.0%) | 281 (94.9%) |
| 75 Years and over | 125 (100.0%) | 97 (100.0%) |
| Total | 5,141 (99.7%) | 6,510 (99.4%) |
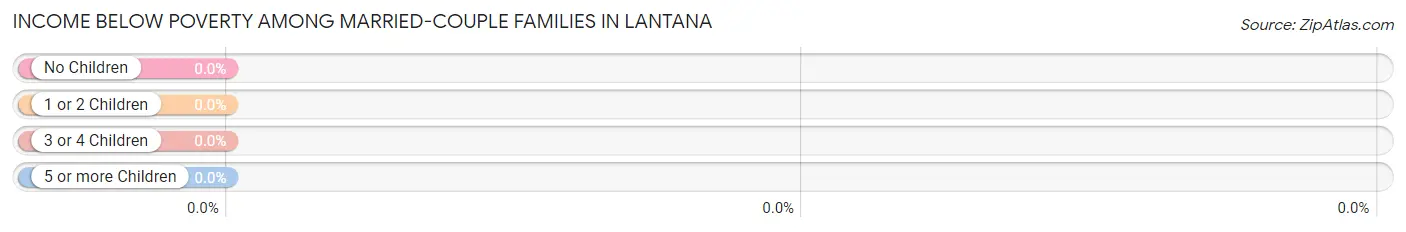
Income Below Poverty Among Married-Couple Families in Lantana
| Children | Above Poverty | Below Poverty |
| No Children | 1,209 (100.0%) | 0 (0.0%) |
| 1 or 2 Children | 1,561 (100.0%) | 0 (0.0%) |
| 3 or 4 Children | 446 (100.0%) | 0 (0.0%) |
| 5 or more Children | 0 (0.0%) | 0 (0.0%) |
| Total | 3,216 (100.0%) | 0 (0.0%) |
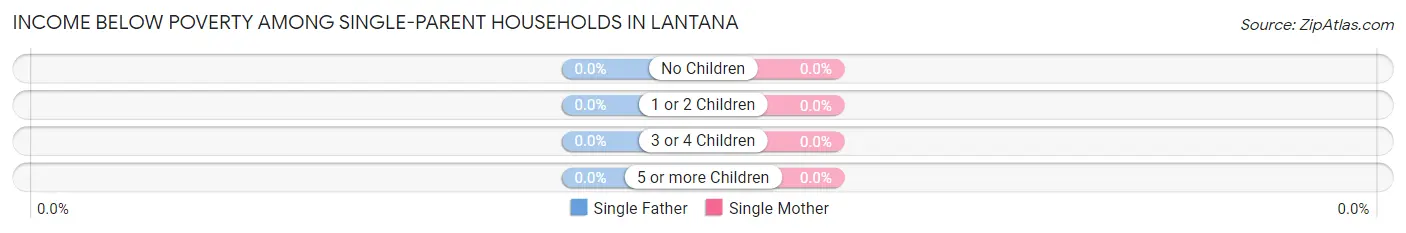
Income Below Poverty Among Single-Parent Households in Lantana
| Children | Single Father | Single Mother |
| No Children | 0 (0.0%) | 0 (0.0%) |
| 1 or 2 Children | 0 (0.0%) | 0 (0.0%) |
| 3 or 4 Children | 0 (0.0%) | 0 (0.0%) |
| 5 or more Children | 0 (0.0%) | 0 (0.0%) |
| Total | 0 (0.0%) | 0 (0.0%) |
Income Below Poverty Among Married-Couple vs Single-Parent Households in Lantana
| Children | Married-Couple Families | Single-Parent Households |
| No Children | 0 (0.0%) | 0 (0.0%) |
| 1 or 2 Children | 0 (0.0%) | 0 (0.0%) |
| 3 or 4 Children | 0 (0.0%) | 0 (0.0%) |
| 5 or more Children | 0 (0.0%) | 0 (0.0%) |
| Total | 0 (0.0%) | 0 (0.0%) |
Employment Characteristics in Lantana
Employment by Class of Employer in Lantana
Among the 5,157 employed individuals in Lantana, private company employees (3,971 | 77.0%), local government employees (322 | 6.2%), and self-employed (incorporated) (287 | 5.6%) make up the most common classes of employment.
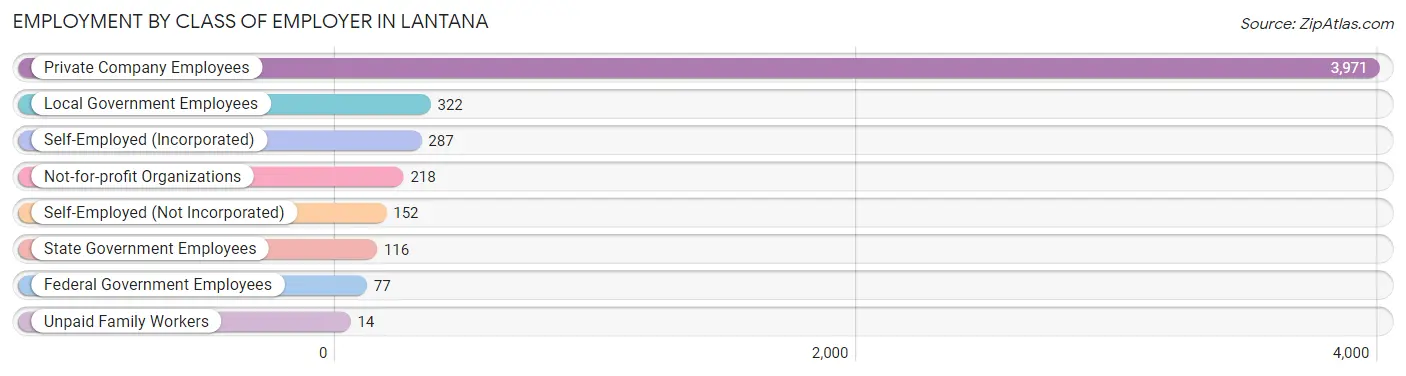
| Employer Class | # Employees | % Employees |
| Private Company Employees | 3,971 | 77.0% |
| Self-Employed (Incorporated) | 287 | 5.6% |
| Self-Employed (Not Incorporated) | 152 | 2.9% |
| Not-for-profit Organizations | 218 | 4.2% |
| Local Government Employees | 322 | 6.2% |
| State Government Employees | 116 | 2.2% |
| Federal Government Employees | 77 | 1.5% |
| Unpaid Family Workers | 14 | 0.3% |
| Total | 5,157 | 100.0% |
Employment Status by Age in Lantana
According to the labor force statistics for Lantana, out of the total population over 16 years of age (8,645), 62.6% or 5,412 individuals are in the labor force, with 3.6% or 195 of them unemployed. The age group with the highest labor force participation rate is 55 to 59 years, with 89.5% or 932 individuals in the labor force. Within the labor force, the 60 to 64 years age range has the highest percentage of unemployed individuals, with 15.8% or 30 of them being unemployed.
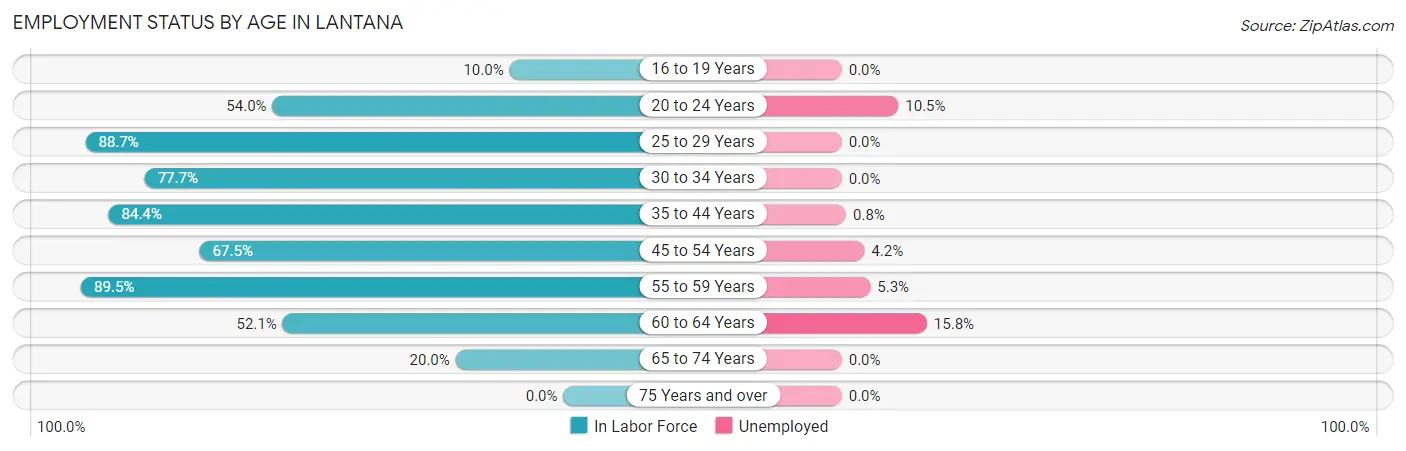
| Age Bracket | In Labor Force | Unemployed |
| 16 to 19 Years | 71 (10.0%) | 0 (0.0%) |
| 20 to 24 Years | 296 (54.0%) | 31 (10.5%) |
| 25 to 29 Years | 94 (88.7%) | 0 (0.0%) |
| 30 to 34 Years | 524 (77.7%) | 0 (0.0%) |
| 35 to 44 Years | 1,431 (84.4%) | 11 (0.8%) |
| 45 to 54 Years | 1,725 (67.5%) | 72 (4.2%) |
| 55 to 59 Years | 932 (89.5%) | 49 (5.3%) |
| 60 to 64 Years | 190 (52.1%) | 30 (15.8%) |
| 65 to 74 Years | 146 (20.0%) | 0 (0.0%) |
| 75 Years and over | 0 (0.0%) | 0 (0.0%) |
| Total | 5,412 (62.6%) | 195 (3.6%) |
Employment Status by Educational Attainment in Lantana
According to labor force statistics for Lantana, 76.0% of individuals (4,892) out of the total population between 25 and 64 years of age (6,437) are in the labor force, with 3.4% or 166 of them being unemployed. The group with the highest labor force participation rate are those with the educational attainment of college / associate degree, with 78.8% or 894 individuals in the labor force. Within the labor force, individuals with bachelor's degree or higher education have the highest percentage of unemployment, with 4.4% or 162 of them being unemployed.
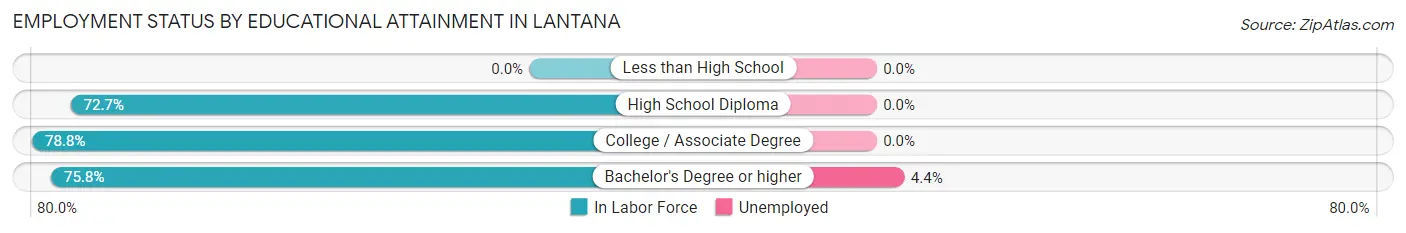
| Educational Attainment | In Labor Force | Unemployed |
| Less than High School | 0 (0.0%) | 0 (0.0%) |
| High School Diploma | 307 (72.7%) | 0 (0.0%) |
| College / Associate Degree | 894 (78.8%) | 0 (0.0%) |
| Bachelor's Degree or higher | 3,693 (75.8%) | 214 (4.4%) |
| Total | 4,892 (76.0%) | 219 (3.4%) |
Employment Occupations by Sex in Lantana
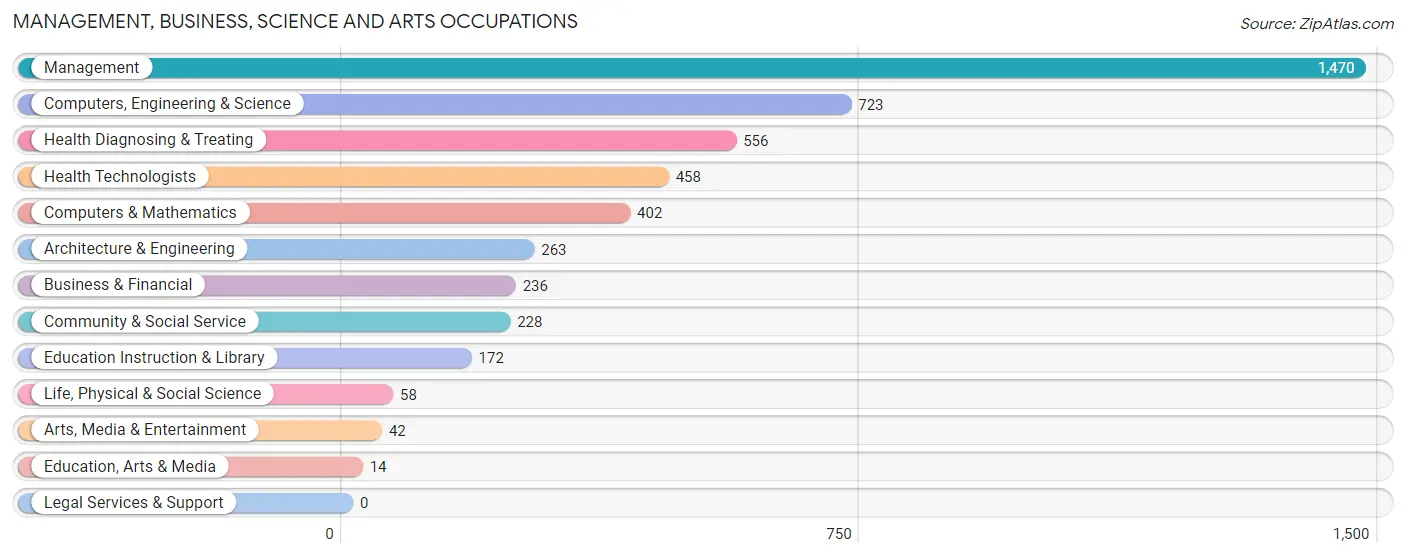
Management, Business, Science and Arts Occupations
The most common Management, Business, Science and Arts occupations in Lantana are Management (1,470 | 28.2%), Computers, Engineering & Science (723 | 13.9%), Health Diagnosing & Treating (556 | 10.7%), Health Technologists (458 | 8.8%), and Computers & Mathematics (402 | 7.7%).
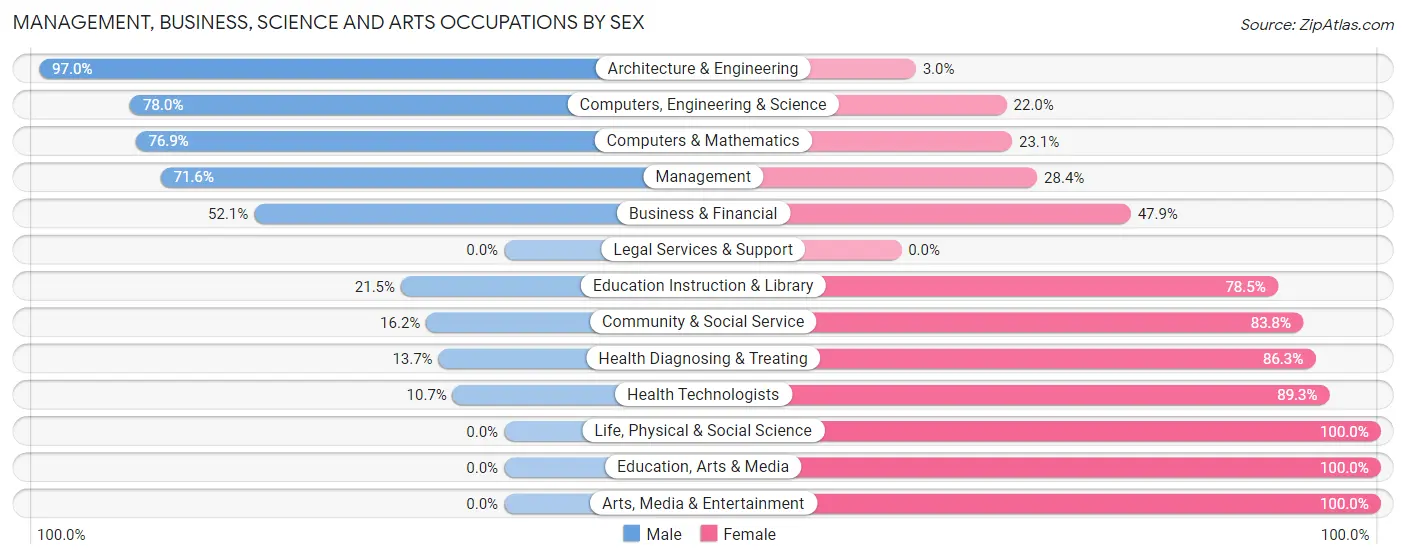
Management, Business, Science and Arts Occupations by Sex
Within the Management, Business, Science and Arts occupations in Lantana, the most male-oriented occupations are Architecture & Engineering (97.0%), Computers, Engineering & Science (78.0%), and Computers & Mathematics (76.9%), while the most female-oriented occupations are Life, Physical & Social Science (100.0%), Education, Arts & Media (100.0%), and Arts, Media & Entertainment (100.0%).
| Occupation | Male | Female |
| Management | 1,053 (71.6%) | 417 (28.4%) |
| Business & Financial | 123 (52.1%) | 113 (47.9%) |
| Computers, Engineering & Science | 564 (78.0%) | 159 (22.0%) |
| Computers & Mathematics | 309 (76.9%) | 93 (23.1%) |
| Architecture & Engineering | 255 (97.0%) | 8 (3.0%) |
| Life, Physical & Social Science | 0 (0.0%) | 58 (100.0%) |
| Community & Social Service | 37 (16.2%) | 191 (83.8%) |
| Education, Arts & Media | 0 (0.0%) | 14 (100.0%) |
| Legal Services & Support | 0 (0.0%) | 0 (0.0%) |
| Education Instruction & Library | 37 (21.5%) | 135 (78.5%) |
| Arts, Media & Entertainment | 0 (0.0%) | 42 (100.0%) |
| Health Diagnosing & Treating | 76 (13.7%) | 480 (86.3%) |
| Health Technologists | 49 (10.7%) | 409 (89.3%) |
| Total (Category) | 1,853 (57.7%) | 1,360 (42.3%) |
| Total (Overall) | 2,909 (55.8%) | 2,304 (44.2%) |
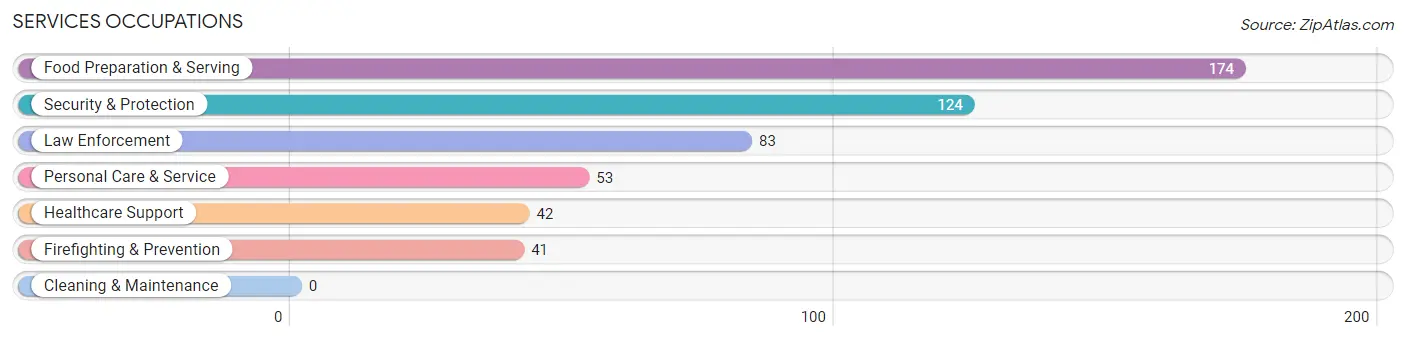
Services Occupations
The most common Services occupations in Lantana are Food Preparation & Serving (174 | 3.3%), Security & Protection (124 | 2.4%), Law Enforcement (83 | 1.6%), Personal Care & Service (53 | 1.0%), and Healthcare Support (42 | 0.8%).
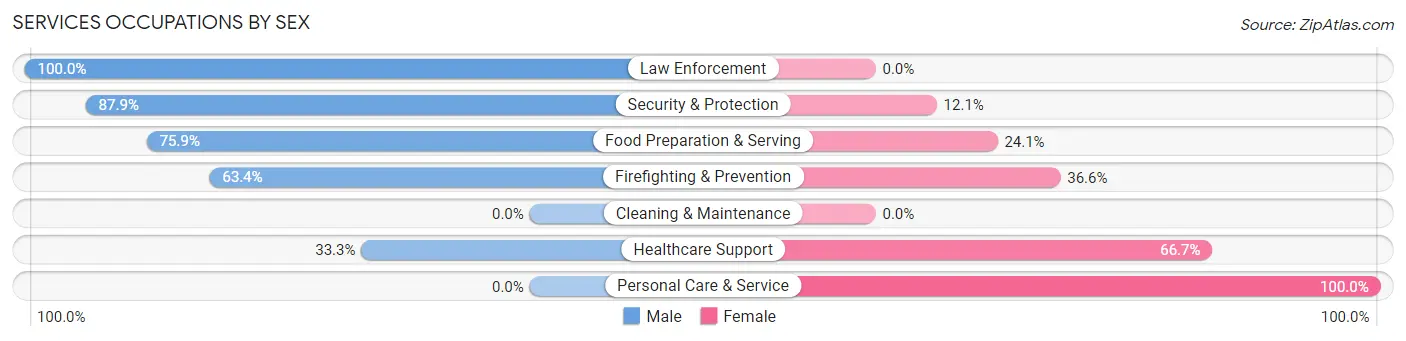
Services Occupations by Sex
Within the Services occupations in Lantana, the most male-oriented occupations are Law Enforcement (100.0%), Security & Protection (87.9%), and Food Preparation & Serving (75.9%), while the most female-oriented occupations are Personal Care & Service (100.0%), Healthcare Support (66.7%), and Firefighting & Prevention (36.6%).
| Occupation | Male | Female |
| Healthcare Support | 14 (33.3%) | 28 (66.7%) |
| Security & Protection | 109 (87.9%) | 15 (12.1%) |
| Firefighting & Prevention | 26 (63.4%) | 15 (36.6%) |
| Law Enforcement | 83 (100.0%) | 0 (0.0%) |
| Food Preparation & Serving | 132 (75.9%) | 42 (24.1%) |
| Cleaning & Maintenance | 0 (0.0%) | 0 (0.0%) |
| Personal Care & Service | 0 (0.0%) | 53 (100.0%) |
| Total (Category) | 255 (64.9%) | 138 (35.1%) |
| Total (Overall) | 2,909 (55.8%) | 2,304 (44.2%) |
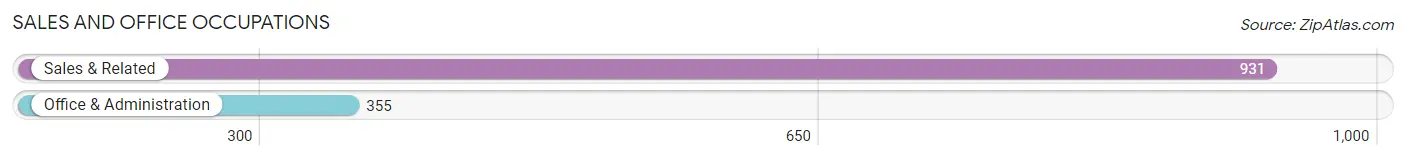
Sales and Office Occupations
The most common Sales and Office occupations in Lantana are Sales & Related (931 | 17.9%), and Office & Administration (355 | 6.8%).
Sales and Office Occupations by Sex
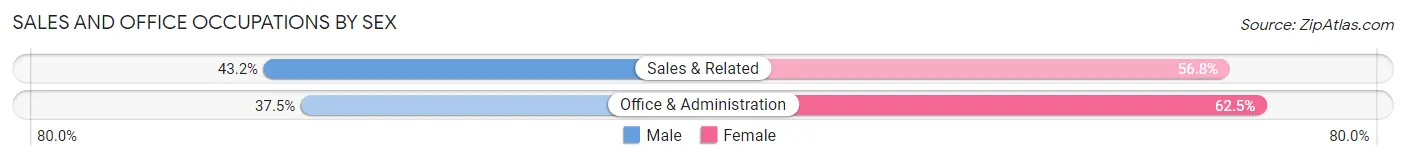
| Occupation | Male | Female |
| Sales & Related | 402 (43.2%) | 529 (56.8%) |
| Office & Administration | 133 (37.5%) | 222 (62.5%) |
| Total (Category) | 535 (41.6%) | 751 (58.4%) |
| Total (Overall) | 2,909 (55.8%) | 2,304 (44.2%) |
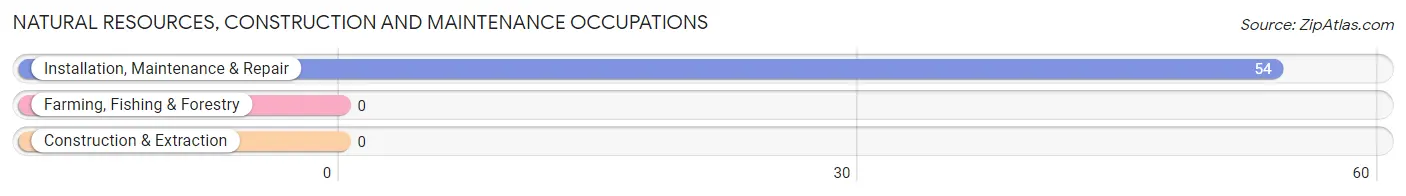
Natural Resources, Construction and Maintenance Occupations
The most common Natural Resources, Construction and Maintenance occupations in Lantana are , and Installation, Maintenance & Repair (54 | 1.0%).
Natural Resources, Construction and Maintenance Occupations by Sex
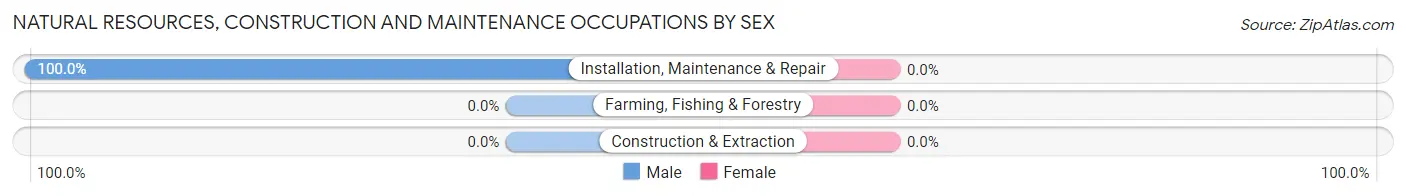
| Occupation | Male | Female |
| Farming, Fishing & Forestry | 0 (0.0%) | 0 (0.0%) |
| Construction & Extraction | 0 (0.0%) | 0 (0.0%) |
| Installation, Maintenance & Repair | 54 (100.0%) | 0 (0.0%) |
| Total (Category) | 54 (100.0%) | 0 (0.0%) |
| Total (Overall) | 2,909 (55.8%) | 2,304 (44.2%) |
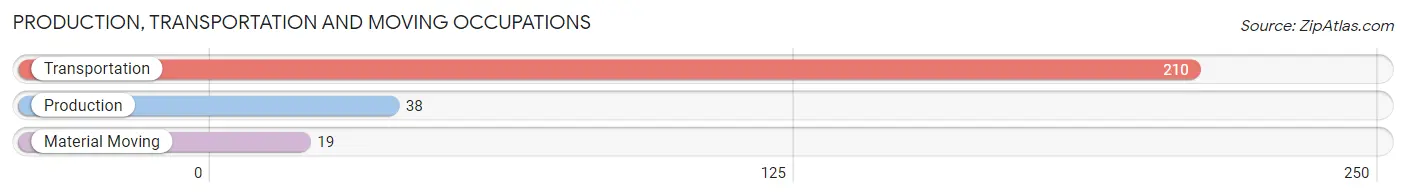
Production, Transportation and Moving Occupations
The most common Production, Transportation and Moving occupations in Lantana are Transportation (210 | 4.0%), Production (38 | 0.7%), and Material Moving (19 | 0.4%).
Production, Transportation and Moving Occupations by Sex
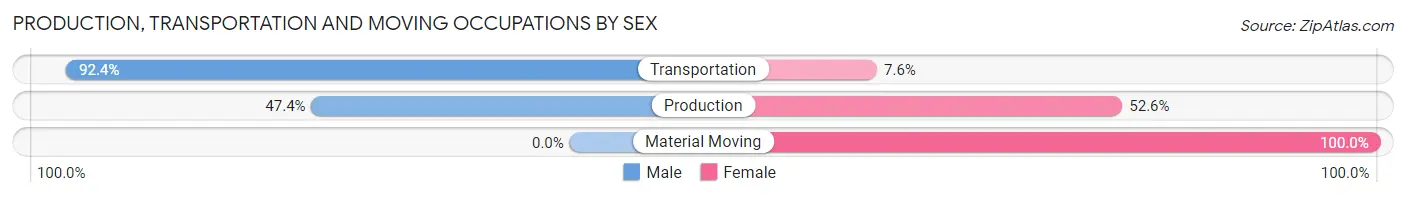
| Occupation | Male | Female |
| Production | 18 (47.4%) | 20 (52.6%) |
| Transportation | 194 (92.4%) | 16 (7.6%) |
| Material Moving | 0 (0.0%) | 19 (100.0%) |
| Total (Category) | 212 (79.4%) | 55 (20.6%) |
| Total (Overall) | 2,909 (55.8%) | 2,304 (44.2%) |
Employment Industries by Sex in Lantana
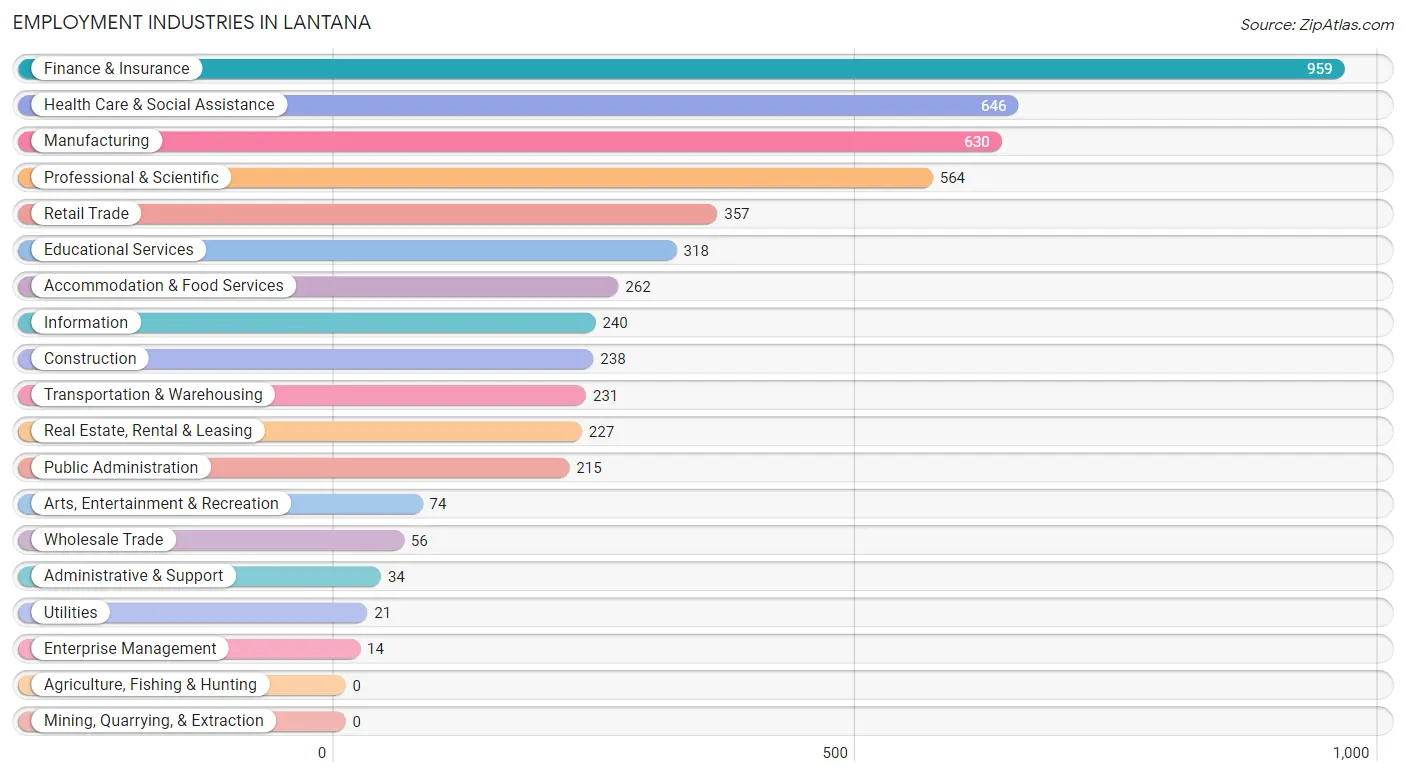
Employment Industries in Lantana
The major employment industries in Lantana include Finance & Insurance (959 | 18.4%), Health Care & Social Assistance (646 | 12.4%), Manufacturing (630 | 12.1%), Professional & Scientific (564 | 10.8%), and Retail Trade (357 | 6.9%).
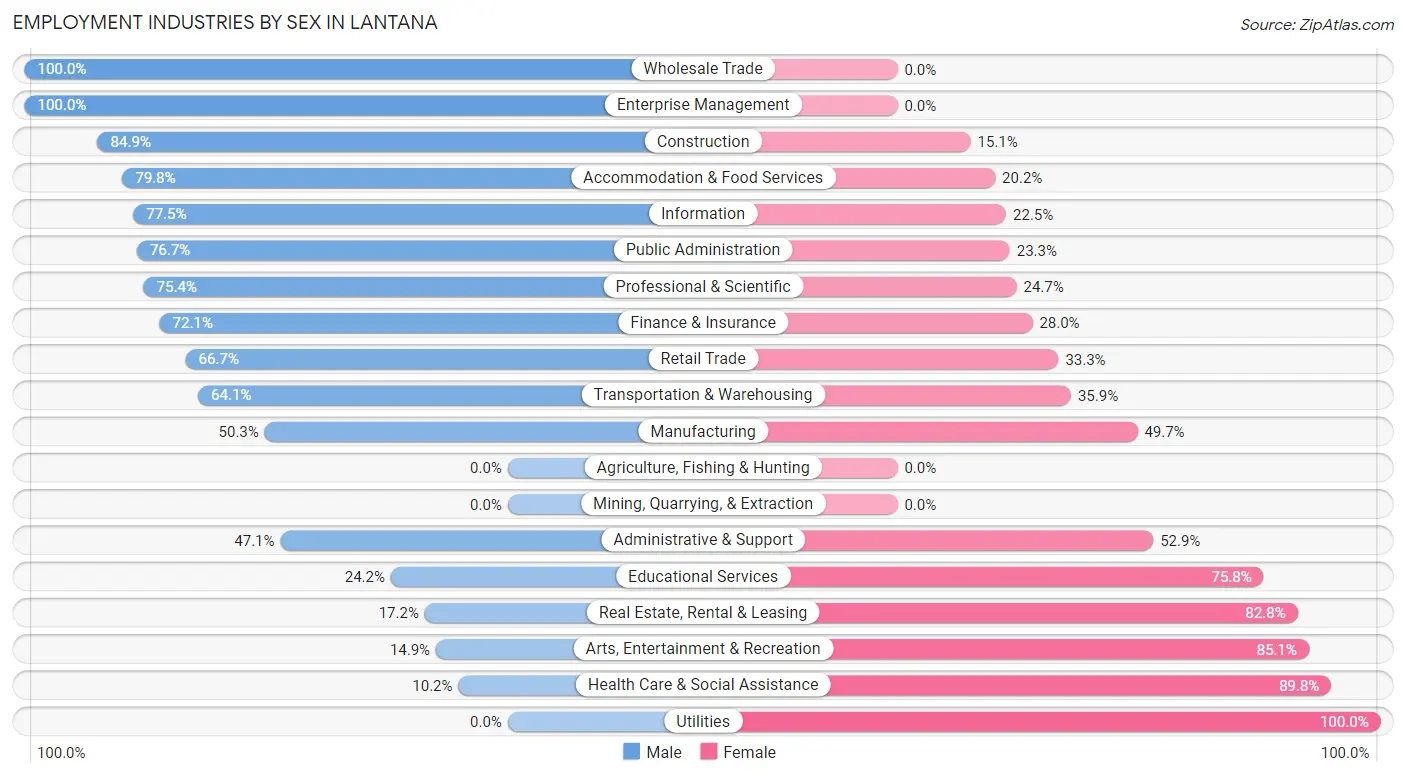
Employment Industries by Sex in Lantana
The Lantana industries that see more men than women are Wholesale Trade (100.0%), Enterprise Management (100.0%), and Construction (84.9%), whereas the industries that tend to have a higher number of women are Utilities (100.0%), Health Care & Social Assistance (89.8%), and Arts, Entertainment & Recreation (85.1%).
| Industry | Male | Female |
| Agriculture, Fishing & Hunting | 0 (0.0%) | 0 (0.0%) |
| Mining, Quarrying, & Extraction | 0 (0.0%) | 0 (0.0%) |
| Construction | 202 (84.9%) | 36 (15.1%) |
| Manufacturing | 317 (50.3%) | 313 (49.7%) |
| Wholesale Trade | 56 (100.0%) | 0 (0.0%) |
| Retail Trade | 238 (66.7%) | 119 (33.3%) |
| Transportation & Warehousing | 148 (64.1%) | 83 (35.9%) |
| Utilities | 0 (0.0%) | 21 (100.0%) |
| Information | 186 (77.5%) | 54 (22.5%) |
| Finance & Insurance | 691 (72.1%) | 268 (28.0%) |
| Real Estate, Rental & Leasing | 39 (17.2%) | 188 (82.8%) |
| Professional & Scientific | 425 (75.3%) | 139 (24.6%) |
| Enterprise Management | 14 (100.0%) | 0 (0.0%) |
| Administrative & Support | 16 (47.1%) | 18 (52.9%) |
| Educational Services | 77 (24.2%) | 241 (75.8%) |
| Health Care & Social Assistance | 66 (10.2%) | 580 (89.8%) |
| Arts, Entertainment & Recreation | 11 (14.9%) | 63 (85.1%) |
| Accommodation & Food Services | 209 (79.8%) | 53 (20.2%) |
| Public Administration | 165 (76.7%) | 50 (23.3%) |
| Total | 2,909 (55.8%) | 2,304 (44.2%) |
Education in Lantana
School Enrollment in Lantana
The most common levels of schooling among the 3,849 students in Lantana are high school (1,085 | 28.2%), middle school (966 | 25.1%), and elementary school (618 | 16.1%).
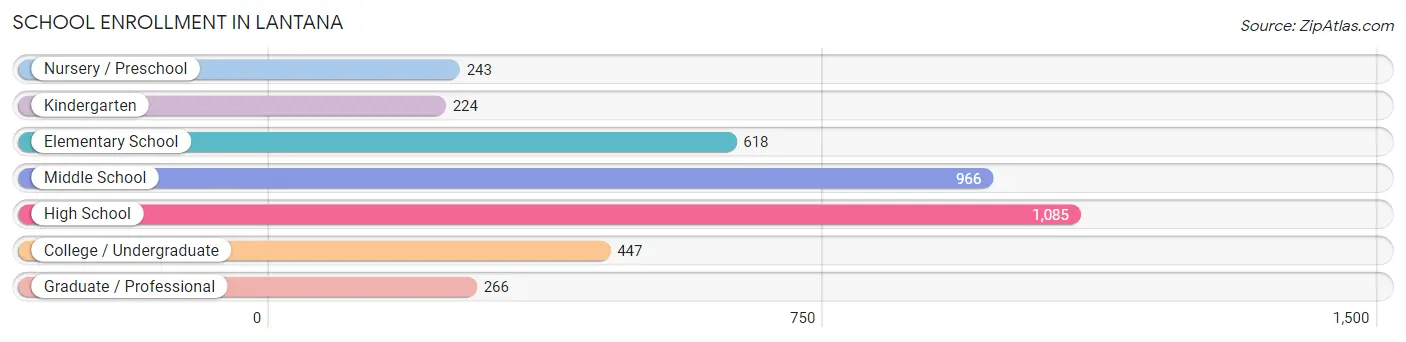
| School Level | # Students | % Students |
| Nursery / Preschool | 243 | 6.3% |
| Kindergarten | 224 | 5.8% |
| Elementary School | 618 | 16.1% |
| Middle School | 966 | 25.1% |
| High School | 1,085 | 28.2% |
| College / Undergraduate | 447 | 11.6% |
| Graduate / Professional | 266 | 6.9% |
| Total | 3,849 | 100.0% |
School Enrollment by Age by Funding Source in Lantana
Out of a total of 3,849 students who are enrolled in schools in Lantana, 843 (21.9%) attend a private institution, while the remaining 3,006 (78.1%) are enrolled in public schools. The age group of 3 to 4 year olds has the highest likelihood of being enrolled in private schools, with 152 (85.4% in the age bracket) enrolled. Conversely, the age group of 18 to 19 year olds has the lowest likelihood of being enrolled in a private school, with 71 (100.0% in the age bracket) attending a public institution.
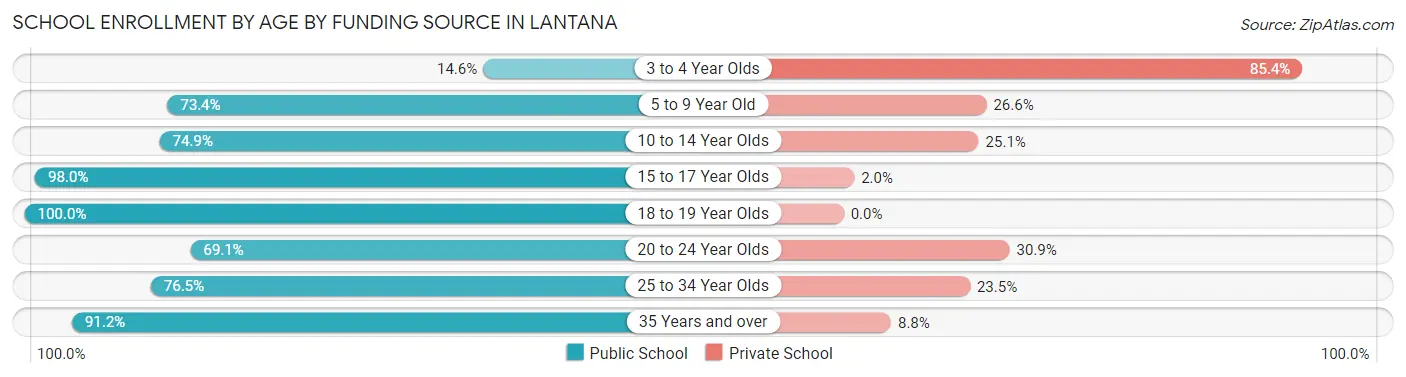
| Age Bracket | Public School | Private School |
| 3 to 4 Year Olds | 26 (14.6%) | 152 (85.4%) |
| 5 to 9 Year Old | 621 (73.4%) | 225 (26.6%) |
| 10 to 14 Year Olds | 825 (74.9%) | 277 (25.1%) |
| 15 to 17 Year Olds | 949 (98.0%) | 19 (2.0%) |
| 18 to 19 Year Olds | 71 (100.0%) | 0 (0.0%) |
| 20 to 24 Year Olds | 320 (69.1%) | 143 (30.9%) |
| 25 to 34 Year Olds | 39 (76.5%) | 12 (23.5%) |
| 35 Years and over | 155 (91.2%) | 15 (8.8%) |
| Total | 3,006 (78.1%) | 843 (21.9%) |
Educational Attainment by Field of Study in Lantana
Business (1,747 | 30.0%), science & technology (1,007 | 17.3%), engineering (579 | 9.9%), communications (437 | 7.5%), and education (405 | 6.9%) are the most common fields of study among 5,832 individuals in Lantana who have obtained a bachelor's degree or higher.
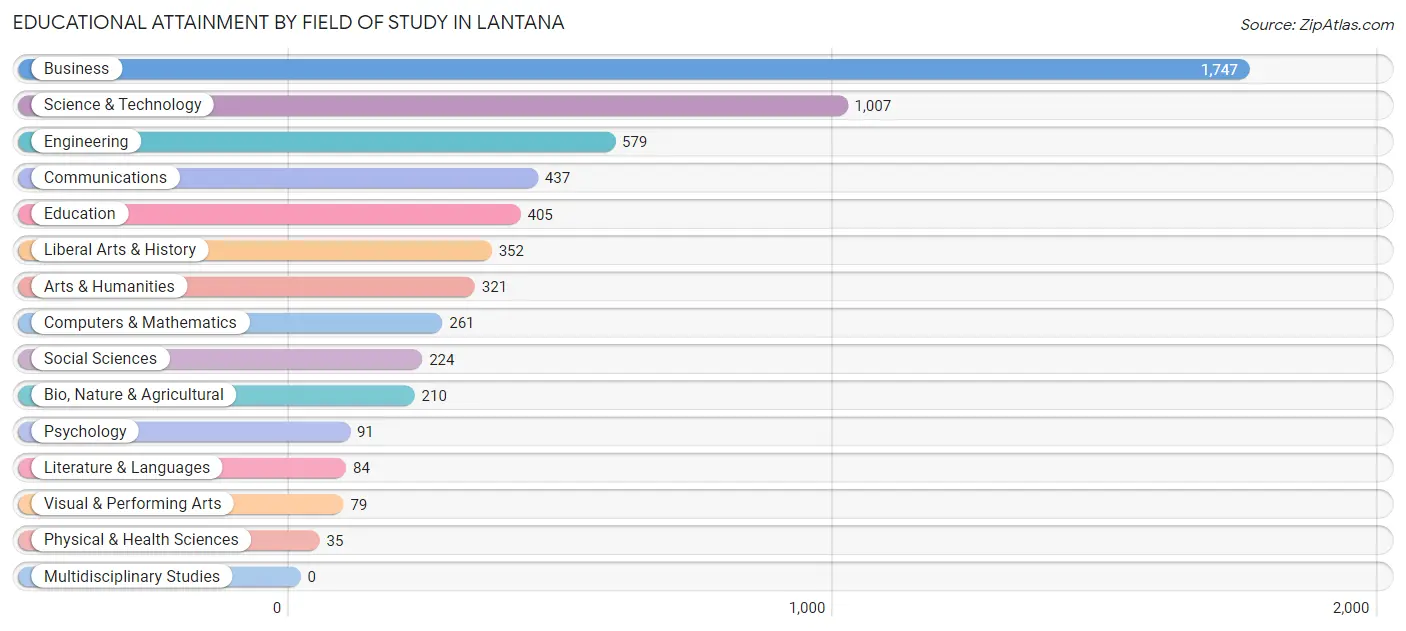
| Field of Study | # Graduates | % Graduates |
| Computers & Mathematics | 261 | 4.5% |
| Bio, Nature & Agricultural | 210 | 3.6% |
| Physical & Health Sciences | 35 | 0.6% |
| Psychology | 91 | 1.6% |
| Social Sciences | 224 | 3.8% |
| Engineering | 579 | 9.9% |
| Multidisciplinary Studies | 0 | 0.0% |
| Science & Technology | 1,007 | 17.3% |
| Business | 1,747 | 30.0% |
| Education | 405 | 6.9% |
| Literature & Languages | 84 | 1.4% |
| Liberal Arts & History | 352 | 6.0% |
| Visual & Performing Arts | 79 | 1.3% |
| Communications | 437 | 7.5% |
| Arts & Humanities | 321 | 5.5% |
| Total | 5,832 | 100.0% |
Transportation & Commute in Lantana
Vehicle Availability by Sex in Lantana
The most prevalent vehicle ownership categories in Lantana are males with 2 vehicles (1,796, accounting for 62.1%) and females with 2 vehicles (1,450, making up 79.4%).
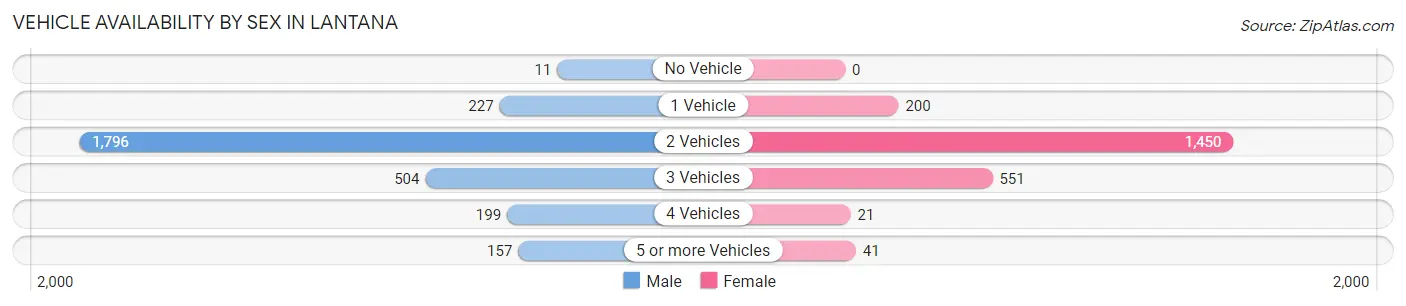
| Vehicles Available | Male | Female |
| No Vehicle | 11 (0.4%) | 0 (0.0%) |
| 1 Vehicle | 227 (7.8%) | 200 (8.8%) |
| 2 Vehicles | 1,796 (62.1%) | 1,450 (64.1%) |
| 3 Vehicles | 504 (17.4%) | 551 (24.3%) |
| 4 Vehicles | 199 (6.9%) | 21 (0.9%) |
| 5 or more Vehicles | 157 (5.4%) | 41 (1.8%) |
| Total | 2,894 (100.0%) | 2,263 (100.0%) |
Commute Time in Lantana
The most frequently occuring commute durations in Lantana are 30 to 34 minutes (590 commuters, 14.6%), 45 to 59 minutes (575 commuters, 14.2%), and 25 to 29 minutes (530 commuters, 13.1%).
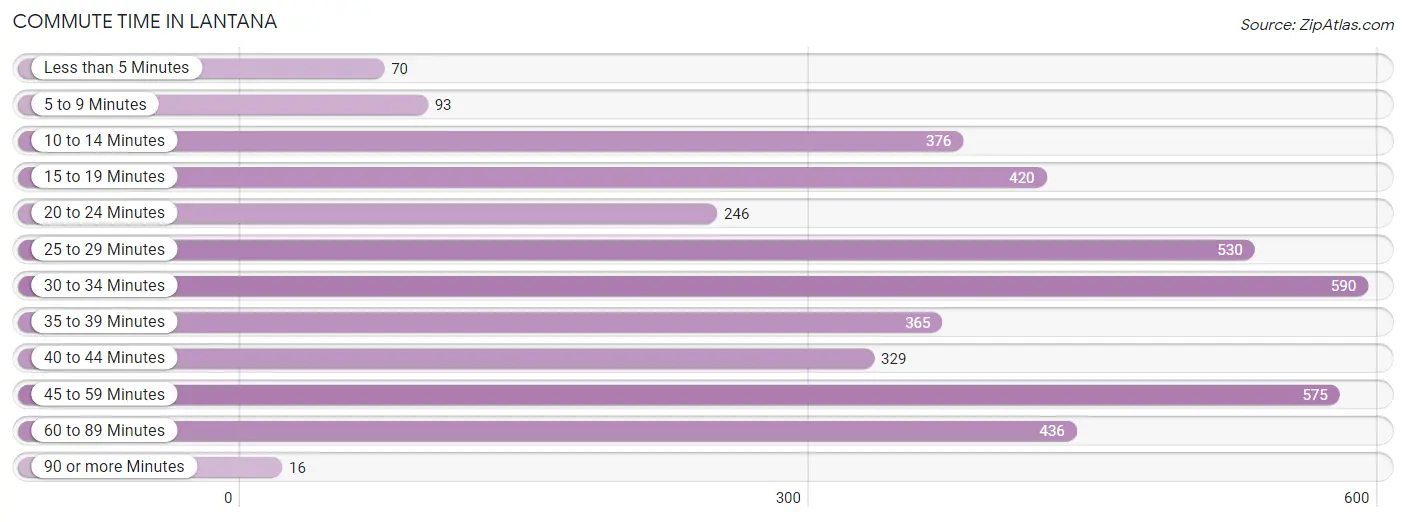
| Commute Time | # Commuters | % Commuters |
| Less than 5 Minutes | 70 | 1.7% |
| 5 to 9 Minutes | 93 | 2.3% |
| 10 to 14 Minutes | 376 | 9.3% |
| 15 to 19 Minutes | 420 | 10.4% |
| 20 to 24 Minutes | 246 | 6.1% |
| 25 to 29 Minutes | 530 | 13.1% |
| 30 to 34 Minutes | 590 | 14.6% |
| 35 to 39 Minutes | 365 | 9.0% |
| 40 to 44 Minutes | 329 | 8.1% |
| 45 to 59 Minutes | 575 | 14.2% |
| 60 to 89 Minutes | 436 | 10.8% |
| 90 or more Minutes | 16 | 0.4% |
Commute Time by Sex in Lantana
The most common commute times in Lantana are 60 to 89 minutes (383 commuters, 15.8%) for males and 25 to 29 minutes (291 commuters, 17.9%) for females.
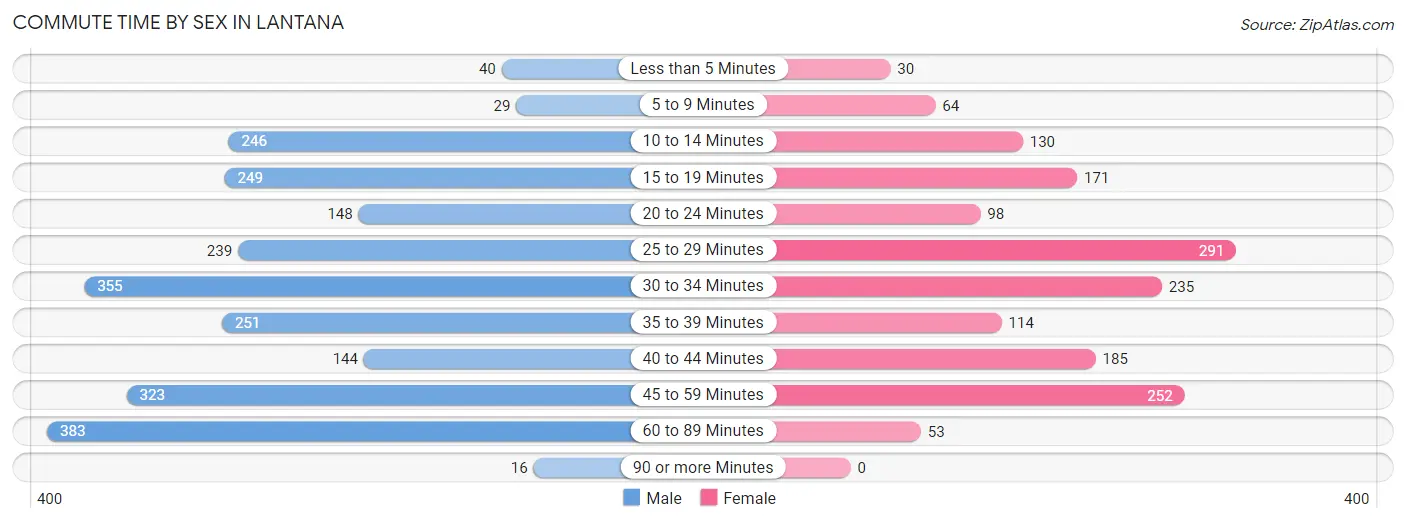
| Commute Time | Male | Female |
| Less than 5 Minutes | 40 (1.7%) | 30 (1.8%) |
| 5 to 9 Minutes | 29 (1.2%) | 64 (3.9%) |
| 10 to 14 Minutes | 246 (10.2%) | 130 (8.0%) |
| 15 to 19 Minutes | 249 (10.3%) | 171 (10.5%) |
| 20 to 24 Minutes | 148 (6.1%) | 98 (6.0%) |
| 25 to 29 Minutes | 239 (9.9%) | 291 (17.9%) |
| 30 to 34 Minutes | 355 (14.6%) | 235 (14.5%) |
| 35 to 39 Minutes | 251 (10.4%) | 114 (7.0%) |
| 40 to 44 Minutes | 144 (5.9%) | 185 (11.4%) |
| 45 to 59 Minutes | 323 (13.3%) | 252 (15.5%) |
| 60 to 89 Minutes | 383 (15.8%) | 53 (3.3%) |
| 90 or more Minutes | 16 (0.7%) | 0 (0.0%) |
Time of Departure to Work by Sex in Lantana
The most frequent times of departure to work in Lantana are 4:00 PM to 11:59 PM (370, 15.3%) for males and 7:30 AM to 7:59 AM (397, 24.5%) for females.
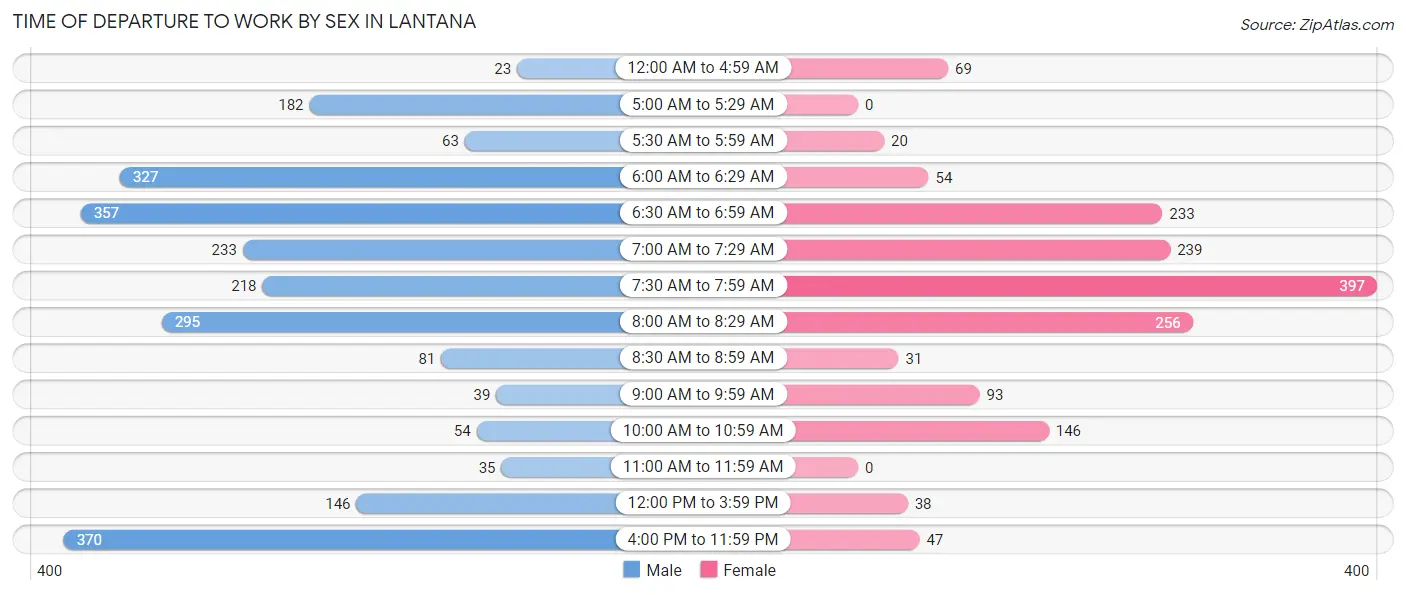
| Time of Departure | Male | Female |
| 12:00 AM to 4:59 AM | 23 (0.9%) | 69 (4.3%) |
| 5:00 AM to 5:29 AM | 182 (7.5%) | 0 (0.0%) |
| 5:30 AM to 5:59 AM | 63 (2.6%) | 20 (1.2%) |
| 6:00 AM to 6:29 AM | 327 (13.5%) | 54 (3.3%) |
| 6:30 AM to 6:59 AM | 357 (14.7%) | 233 (14.4%) |
| 7:00 AM to 7:29 AM | 233 (9.6%) | 239 (14.7%) |
| 7:30 AM to 7:59 AM | 218 (9.0%) | 397 (24.5%) |
| 8:00 AM to 8:29 AM | 295 (12.2%) | 256 (15.8%) |
| 8:30 AM to 8:59 AM | 81 (3.3%) | 31 (1.9%) |
| 9:00 AM to 9:59 AM | 39 (1.6%) | 93 (5.7%) |
| 10:00 AM to 10:59 AM | 54 (2.2%) | 146 (9.0%) |
| 11:00 AM to 11:59 AM | 35 (1.4%) | 0 (0.0%) |
| 12:00 PM to 3:59 PM | 146 (6.0%) | 38 (2.3%) |
| 4:00 PM to 11:59 PM | 370 (15.3%) | 47 (2.9%) |
| Total | 2,423 (100.0%) | 1,623 (100.0%) |
Housing Occupancy in Lantana
Occupancy by Ownership in Lantana
Of the total 3,830 dwellings in Lantana, owner-occupied units account for 3,570 (93.2%), while renter-occupied units make up 260 (6.8%).
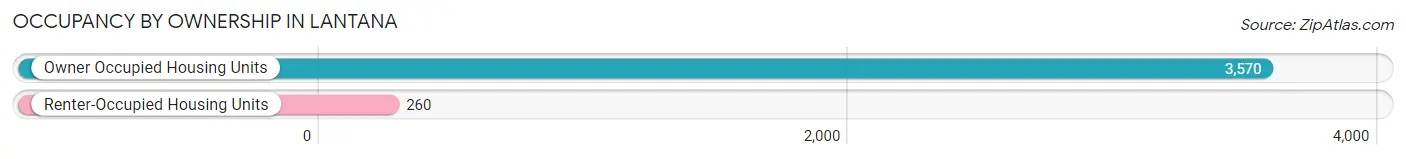
| Occupancy | # Housing Units | % Housing Units |
| Owner Occupied Housing Units | 3,570 | 93.2% |
| Renter-Occupied Housing Units | 260 | 6.8% |
| Total Occupied Housing Units | 3,830 | 100.0% |
Occupancy by Household Size in Lantana
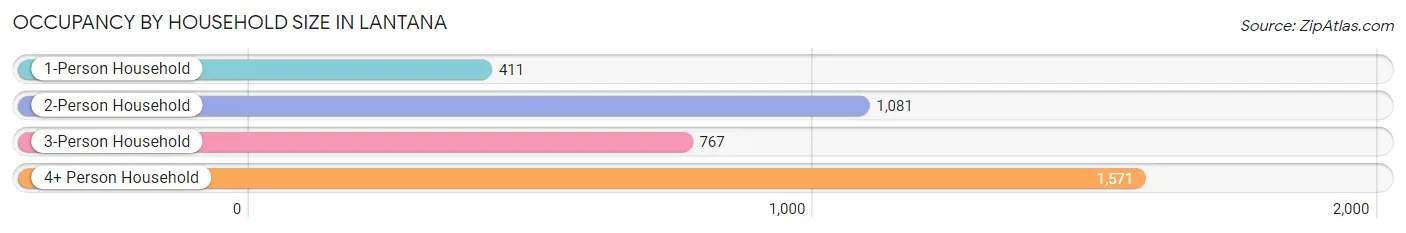
| Household Size | # Housing Units | % Housing Units |
| 1-Person Household | 411 | 10.7% |
| 2-Person Household | 1,081 | 28.2% |
| 3-Person Household | 767 | 20.0% |
| 4+ Person Household | 1,571 | 41.0% |
| Total Housing Units | 3,830 | 100.0% |
Occupancy by Ownership by Household Size in Lantana
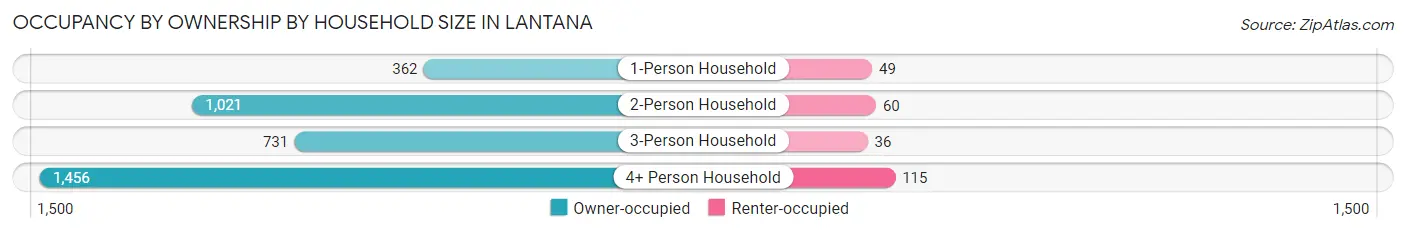
| Household Size | Owner-occupied | Renter-occupied |
| 1-Person Household | 362 (88.1%) | 49 (11.9%) |
| 2-Person Household | 1,021 (94.5%) | 60 (5.6%) |
| 3-Person Household | 731 (95.3%) | 36 (4.7%) |
| 4+ Person Household | 1,456 (92.7%) | 115 (7.3%) |
| Total Housing Units | 3,570 (93.2%) | 260 (6.8%) |
Occupancy by Educational Attainment in Lantana
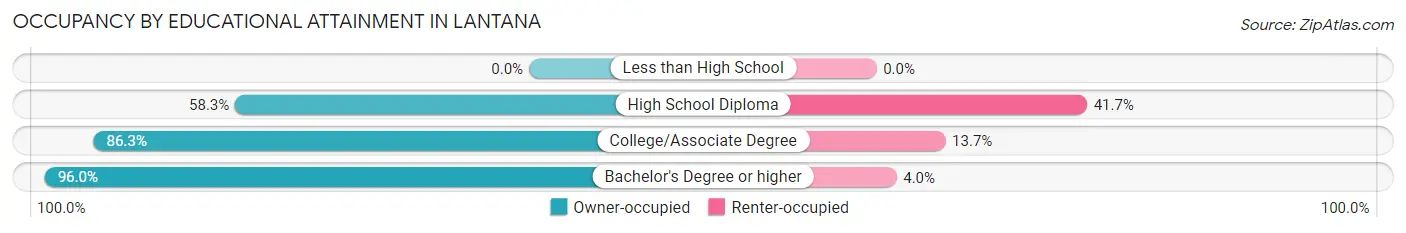
| Household Size | Owner-occupied | Renter-occupied |
| Less than High School | 0 (0.0%) | 0 (0.0%) |
| High School Diploma | 67 (58.3%) | 48 (41.7%) |
| College/Associate Degree | 568 (86.3%) | 90 (13.7%) |
| Bachelor's Degree or higher | 2,935 (96.0%) | 122 (4.0%) |
Occupancy by Age of Householder in Lantana
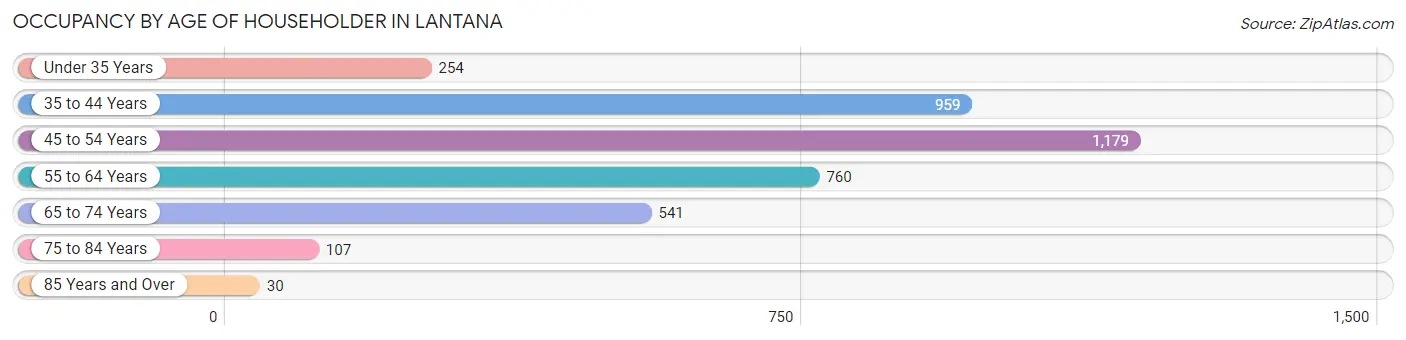
| Age Bracket | # Households | % Households |
| Under 35 Years | 254 | 6.6% |
| 35 to 44 Years | 959 | 25.0% |
| 45 to 54 Years | 1,179 | 30.8% |
| 55 to 64 Years | 760 | 19.8% |
| 65 to 74 Years | 541 | 14.1% |
| 75 to 84 Years | 107 | 2.8% |
| 85 Years and Over | 30 | 0.8% |
| Total | 3,830 | 100.0% |
Housing Finances in Lantana
Median Income by Occupancy in Lantana
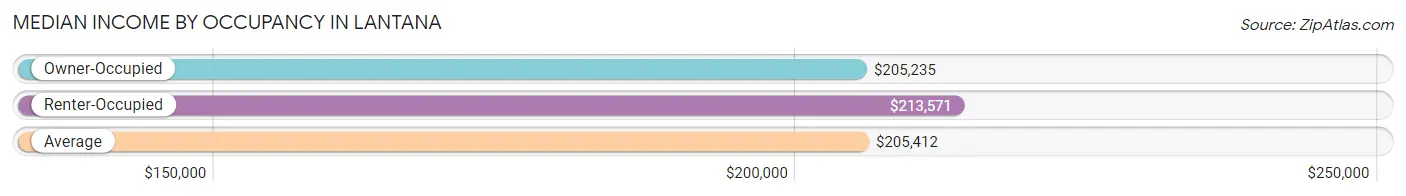
| Occupancy Type | # Households | Median Income |
| Owner-Occupied | 3,570 (93.2%) | $205,235 |
| Renter-Occupied | 260 (6.8%) | $213,571 |
| Average | 3,830 (100.0%) | $205,412 |
Occupancy by Householder Income Bracket in Lantana
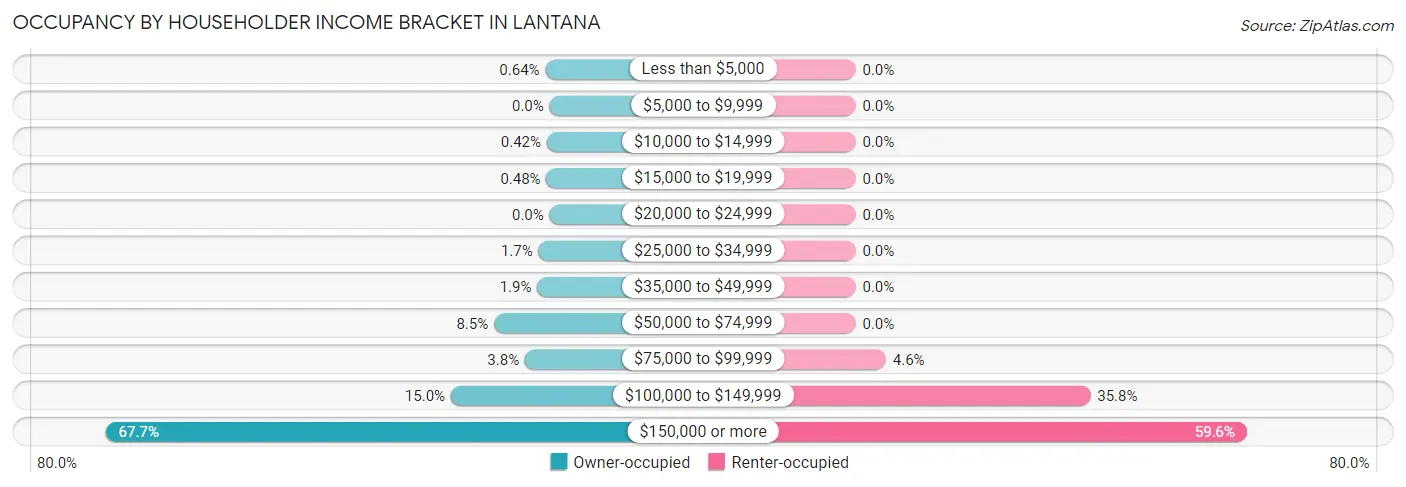
| Income Bracket | Owner-occupied | Renter-occupied |
| Less than $5,000 | 23 (0.6%) | 0 (0.0%) |
| $5,000 to $9,999 | 0 (0.0%) | 0 (0.0%) |
| $10,000 to $14,999 | 15 (0.4%) | 0 (0.0%) |
| $15,000 to $19,999 | 17 (0.5%) | 0 (0.0%) |
| $20,000 to $24,999 | 0 (0.0%) | 0 (0.0%) |
| $25,000 to $34,999 | 60 (1.7%) | 0 (0.0%) |
| $35,000 to $49,999 | 67 (1.9%) | 0 (0.0%) |
| $50,000 to $74,999 | 302 (8.5%) | 0 (0.0%) |
| $75,000 to $99,999 | 134 (3.7%) | 12 (4.6%) |
| $100,000 to $149,999 | 537 (15.0%) | 93 (35.8%) |
| $150,000 or more | 2,415 (67.6%) | 155 (59.6%) |
| Total | 3,570 (100.0%) | 260 (100.0%) |
Monthly Housing Cost Tiers in Lantana
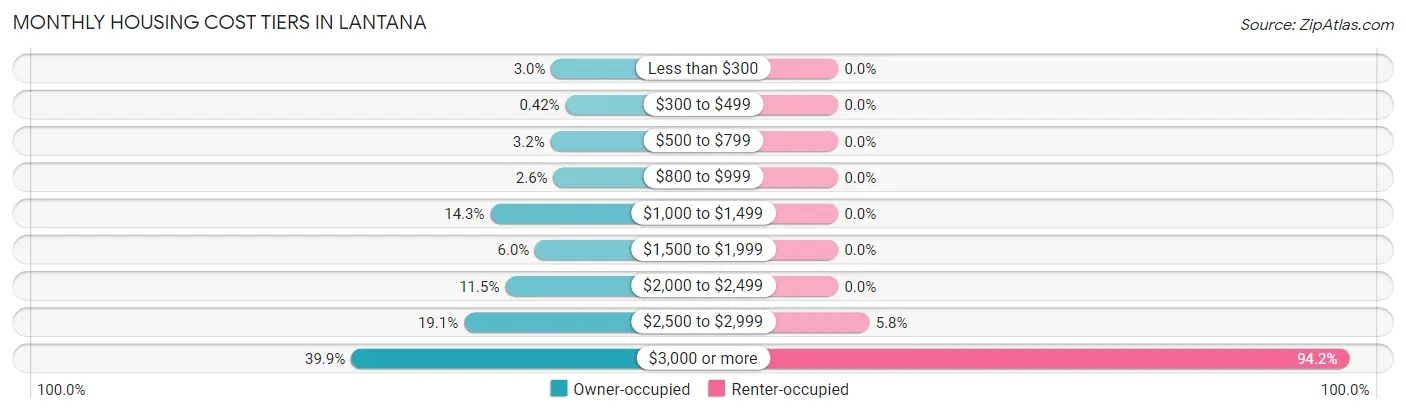
| Monthly Cost | Owner-occupied | Renter-occupied |
| Less than $300 | 108 (3.0%) | 0 (0.0%) |
| $300 to $499 | 15 (0.4%) | 0 (0.0%) |
| $500 to $799 | 113 (3.2%) | 0 (0.0%) |
| $800 to $999 | 94 (2.6%) | 0 (0.0%) |
| $1,000 to $1,499 | 509 (14.3%) | 0 (0.0%) |
| $1,500 to $1,999 | 214 (6.0%) | 0 (0.0%) |
| $2,000 to $2,499 | 411 (11.5%) | 0 (0.0%) |
| $2,500 to $2,999 | 682 (19.1%) | 15 (5.8%) |
| $3,000 or more | 1,424 (39.9%) | 245 (94.2%) |
| Total | 3,570 (100.0%) | 260 (100.0%) |
Physical Housing Characteristics in Lantana
Housing Structures in Lantana
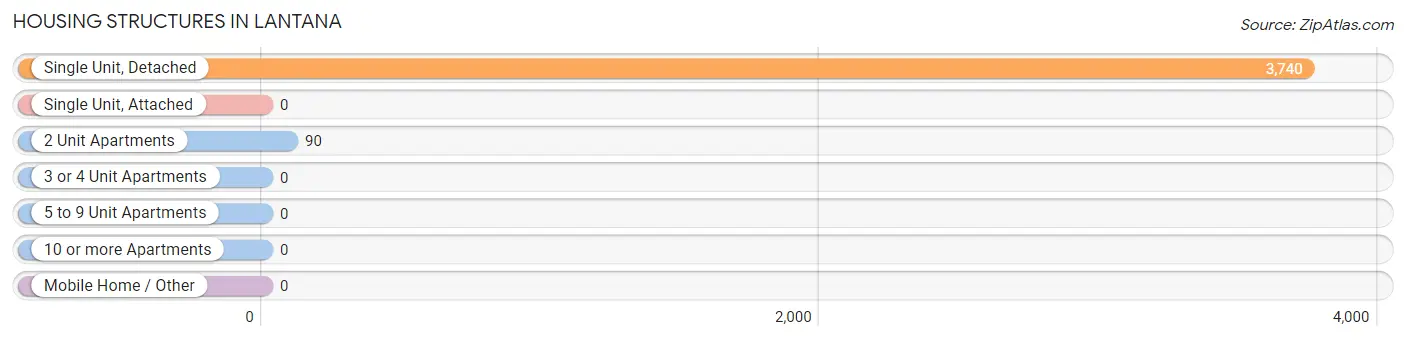
| Structure Type | # Housing Units | % Housing Units |
| Single Unit, Detached | 3,740 | 97.7% |
| Single Unit, Attached | 0 | 0.0% |
| 2 Unit Apartments | 90 | 2.4% |
| 3 or 4 Unit Apartments | 0 | 0.0% |
| 5 to 9 Unit Apartments | 0 | 0.0% |
| 10 or more Apartments | 0 | 0.0% |
| Mobile Home / Other | 0 | 0.0% |
| Total | 3,830 | 100.0% |
Housing Structures by Occupancy in Lantana
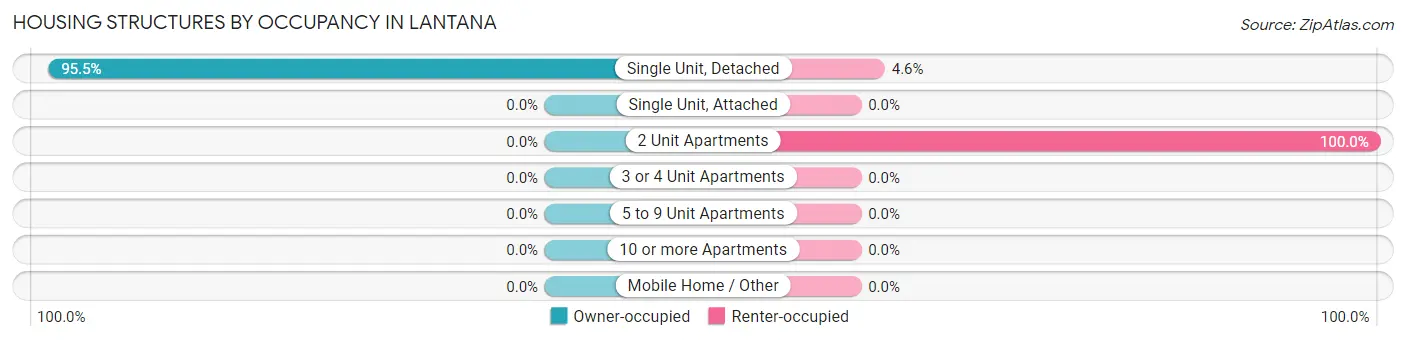
| Structure Type | Owner-occupied | Renter-occupied |
| Single Unit, Detached | 3,570 (95.5%) | 170 (4.5%) |
| Single Unit, Attached | 0 (0.0%) | 0 (0.0%) |
| 2 Unit Apartments | 0 (0.0%) | 90 (100.0%) |
| 3 or 4 Unit Apartments | 0 (0.0%) | 0 (0.0%) |
| 5 to 9 Unit Apartments | 0 (0.0%) | 0 (0.0%) |
| 10 or more Apartments | 0 (0.0%) | 0 (0.0%) |
| Mobile Home / Other | 0 (0.0%) | 0 (0.0%) |
| Total | 3,570 (93.2%) | 260 (6.8%) |
Housing Structures by Number of Rooms in Lantana
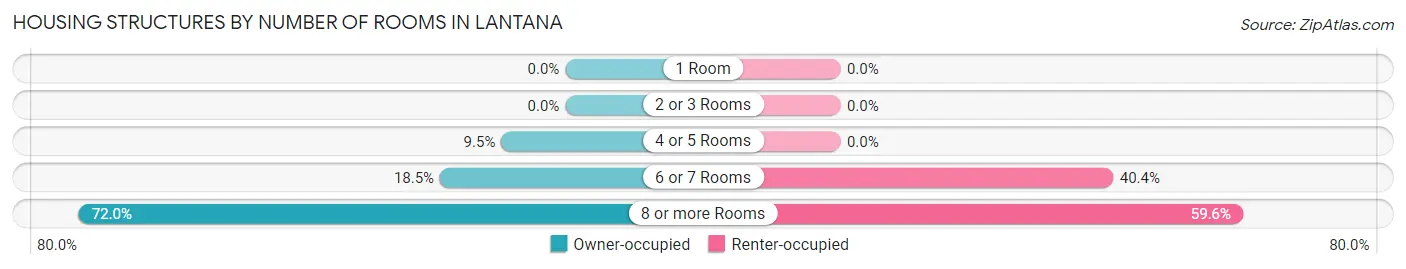
| Number of Rooms | Owner-occupied | Renter-occupied |
| 1 Room | 0 (0.0%) | 0 (0.0%) |
| 2 or 3 Rooms | 0 (0.0%) | 0 (0.0%) |
| 4 or 5 Rooms | 338 (9.5%) | 0 (0.0%) |
| 6 or 7 Rooms | 662 (18.5%) | 105 (40.4%) |
| 8 or more Rooms | 2,570 (72.0%) | 155 (59.6%) |
| Total | 3,570 (100.0%) | 260 (100.0%) |
Housing Structure by Heating Type in Lantana
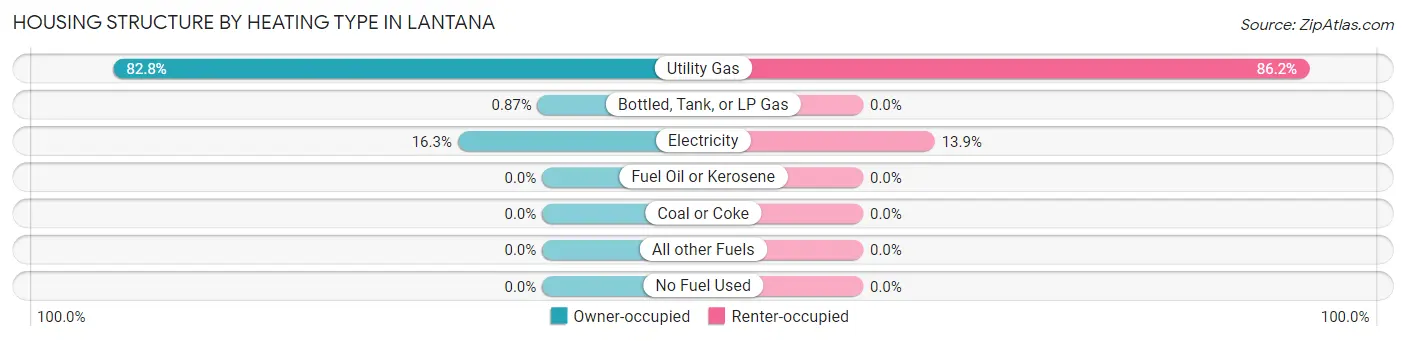
| Heating Type | Owner-occupied | Renter-occupied |
| Utility Gas | 2,957 (82.8%) | 224 (86.2%) |
| Bottled, Tank, or LP Gas | 31 (0.9%) | 0 (0.0%) |
| Electricity | 582 (16.3%) | 36 (13.9%) |
| Fuel Oil or Kerosene | 0 (0.0%) | 0 (0.0%) |
| Coal or Coke | 0 (0.0%) | 0 (0.0%) |
| All other Fuels | 0 (0.0%) | 0 (0.0%) |
| No Fuel Used | 0 (0.0%) | 0 (0.0%) |
| Total | 3,570 (100.0%) | 260 (100.0%) |
Household Vehicle Usage in Lantana
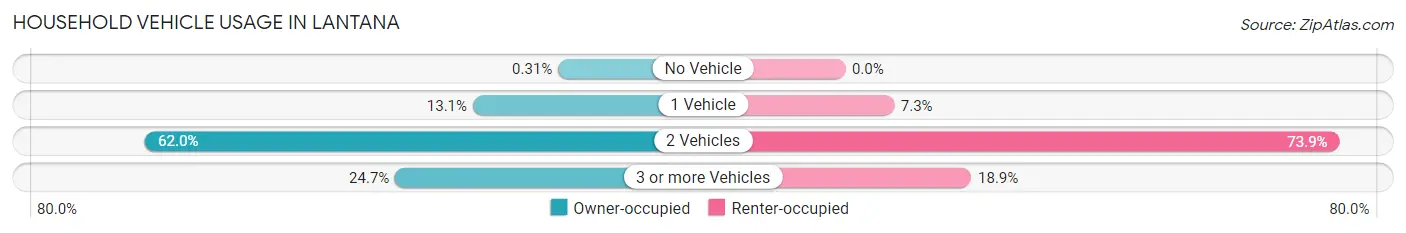
| Vehicles per Household | Owner-occupied | Renter-occupied |
| No Vehicle | 11 (0.3%) | 0 (0.0%) |
| 1 Vehicle | 466 (13.1%) | 19 (7.3%) |
| 2 Vehicles | 2,213 (62.0%) | 192 (73.9%) |
| 3 or more Vehicles | 880 (24.6%) | 49 (18.9%) |
| Total | 3,570 (100.0%) | 260 (100.0%) |
Real Estate & Mortgages in Lantana
Real Estate and Mortgage Overview in Lantana
| Characteristic | Without Mortgage | With Mortgage |
| Housing Units | 893 | 2,677 |
| Median Property Value | $462,900 | $489,800 |
| Median Household Income | $136,632 | $1,994 |
| Monthly Housing Costs | $1,271 | $1,424 |
| Real Estate Taxes | $9,680 | $165 |
Property Value by Mortgage Status in Lantana
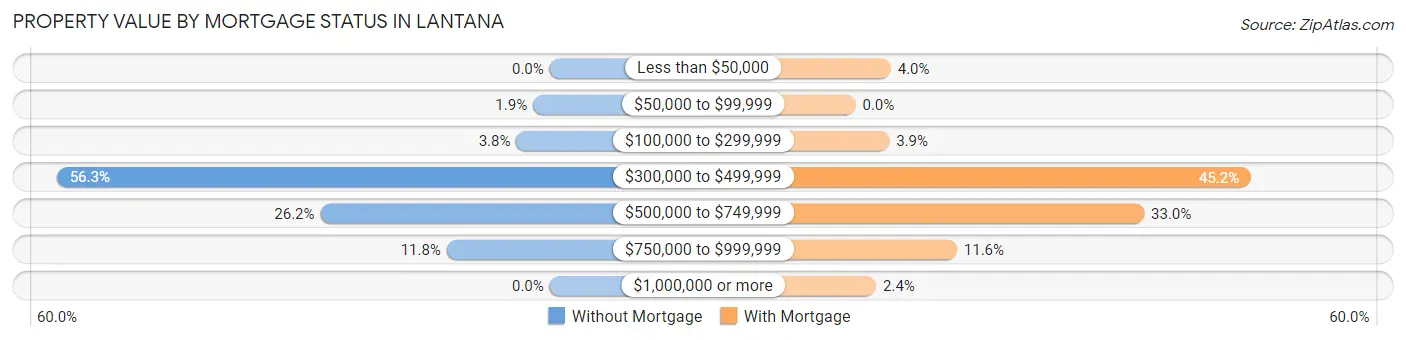
| Property Value | Without Mortgage | With Mortgage |
| Less than $50,000 | 0 (0.0%) | 108 (4.0%) |
| $50,000 to $99,999 | 17 (1.9%) | 0 (0.0%) |
| $100,000 to $299,999 | 34 (3.8%) | 103 (3.8%) |
| $300,000 to $499,999 | 503 (56.3%) | 1,210 (45.2%) |
| $500,000 to $749,999 | 234 (26.2%) | 883 (33.0%) |
| $750,000 to $999,999 | 105 (11.8%) | 310 (11.6%) |
| $1,000,000 or more | 0 (0.0%) | 63 (2.4%) |
| Total | 893 (100.0%) | 2,677 (100.0%) |
Household Income by Mortgage Status in Lantana
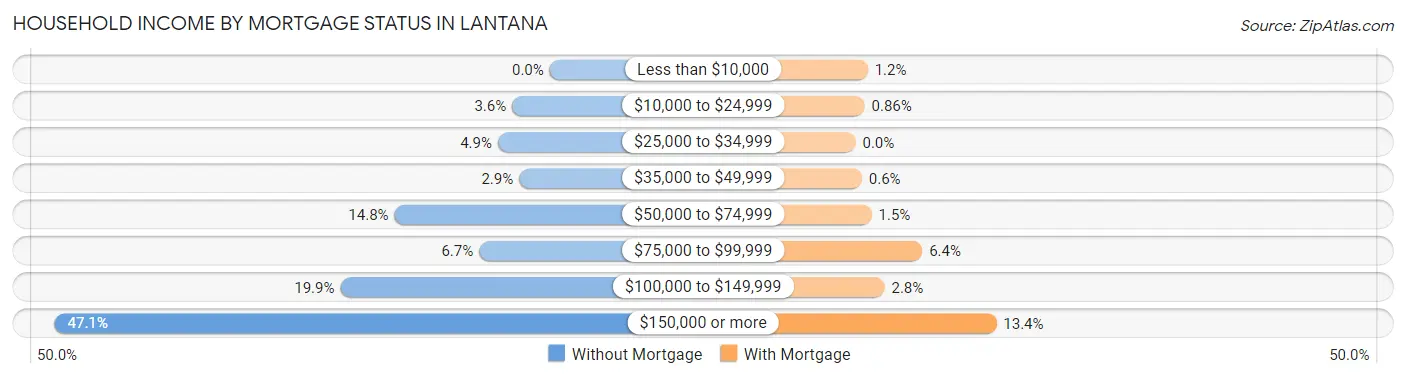
| Household Income | Without Mortgage | With Mortgage |
| Less than $10,000 | 0 (0.0%) | 31 (1.2%) |
| $10,000 to $24,999 | 32 (3.6%) | 23 (0.9%) |
| $25,000 to $34,999 | 44 (4.9%) | 0 (0.0%) |
| $35,000 to $49,999 | 26 (2.9%) | 16 (0.6%) |
| $50,000 to $74,999 | 132 (14.8%) | 41 (1.5%) |
| $75,000 to $99,999 | 60 (6.7%) | 170 (6.4%) |
| $100,000 to $149,999 | 178 (19.9%) | 74 (2.8%) |
| $150,000 or more | 421 (47.1%) | 359 (13.4%) |
| Total | 893 (100.0%) | 2,677 (100.0%) |
Property Value to Household Income Ratio in Lantana
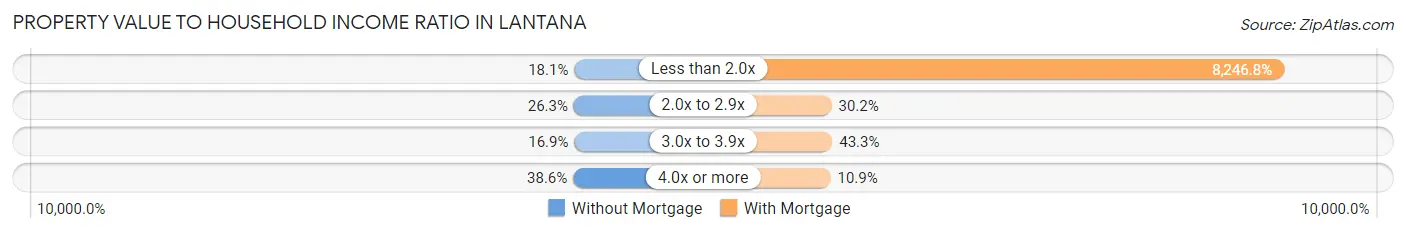
| Value-to-Income Ratio | Without Mortgage | With Mortgage |
| Less than 2.0x | 162 (18.1%) | 220,768 (8,246.8%) |
| 2.0x to 2.9x | 235 (26.3%) | 807 (30.1%) |
| 3.0x to 3.9x | 151 (16.9%) | 1,160 (43.3%) |
| 4.0x or more | 345 (38.6%) | 291 (10.9%) |
| Total | 893 (100.0%) | 2,677 (100.0%) |
Real Estate Taxes by Mortgage Status in Lantana
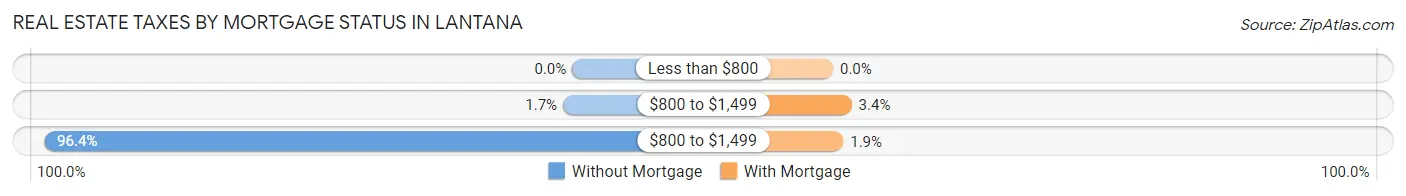
| Property Taxes | Without Mortgage | With Mortgage |
| Less than $800 | 0 (0.0%) | 0 (0.0%) |
| $800 to $1,499 | 15 (1.7%) | 91 (3.4%) |
| $800 to $1,499 | 861 (96.4%) | 50 (1.9%) |
| Total | 893 (100.0%) | 2,677 (100.0%) |
Health & Disability in Lantana
Health Insurance Coverage by Age in Lantana
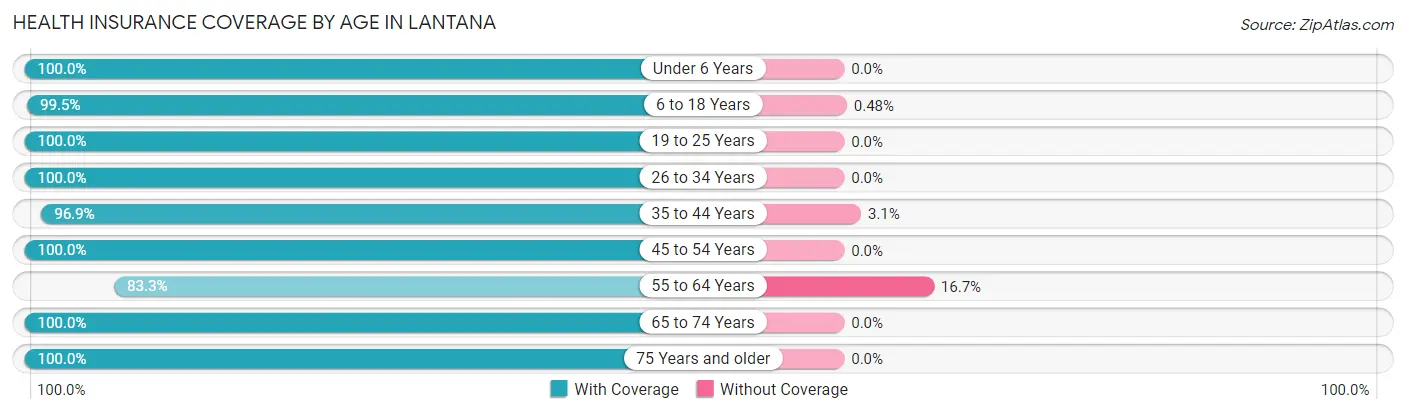
| Age Bracket | With Coverage | Without Coverage |
| Under 6 Years | 859 (100.0%) | 0 (0.0%) |
| 6 to 18 Years | 2,887 (99.5%) | 14 (0.5%) |
| 19 to 25 Years | 578 (100.0%) | 0 (0.0%) |
| 26 to 34 Years | 759 (100.0%) | 0 (0.0%) |
| 35 to 44 Years | 1,643 (96.9%) | 53 (3.1%) |
| 45 to 54 Years | 2,555 (100.0%) | 0 (0.0%) |
| 55 to 64 Years | 1,171 (83.3%) | 235 (16.7%) |
| 65 to 74 Years | 730 (100.0%) | 0 (0.0%) |
| 75 Years and older | 222 (100.0%) | 0 (0.0%) |
| Total | 11,404 (97.4%) | 302 (2.6%) |
Health Insurance Coverage by Citizenship Status in Lantana
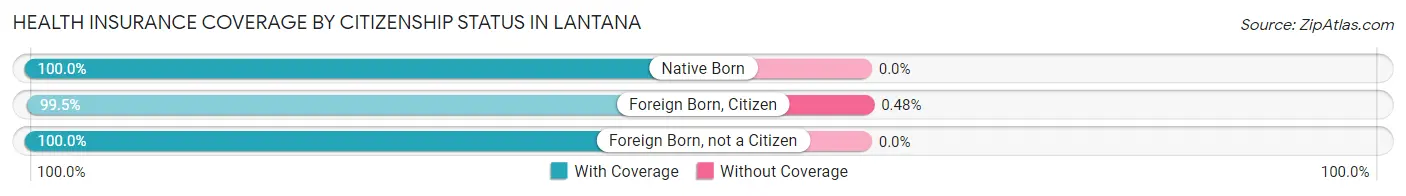
| Citizenship Status | With Coverage | Without Coverage |
| Native Born | 859 (100.0%) | 0 (0.0%) |
| Foreign Born, Citizen | 2,887 (99.5%) | 14 (0.5%) |
| Foreign Born, not a Citizen | 578 (100.0%) | 0 (0.0%) |
Health Insurance Coverage by Household Income in Lantana
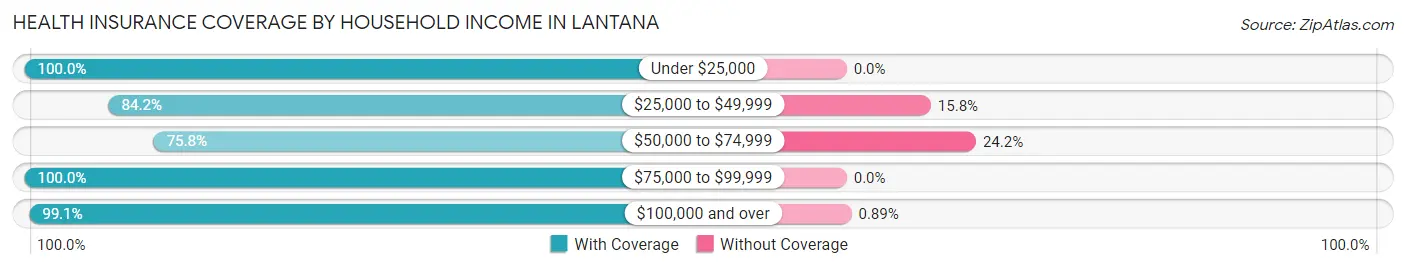
| Household Income | With Coverage | Without Coverage |
| Under $25,000 | 71 (100.0%) | 0 (0.0%) |
| $25,000 to $49,999 | 155 (84.2%) | 29 (15.8%) |
| $50,000 to $74,999 | 567 (75.8%) | 181 (24.2%) |
| $75,000 to $99,999 | 357 (100.0%) | 0 (0.0%) |
| $100,000 and over | 10,254 (99.1%) | 92 (0.9%) |
Public vs Private Health Insurance Coverage by Age in Lantana
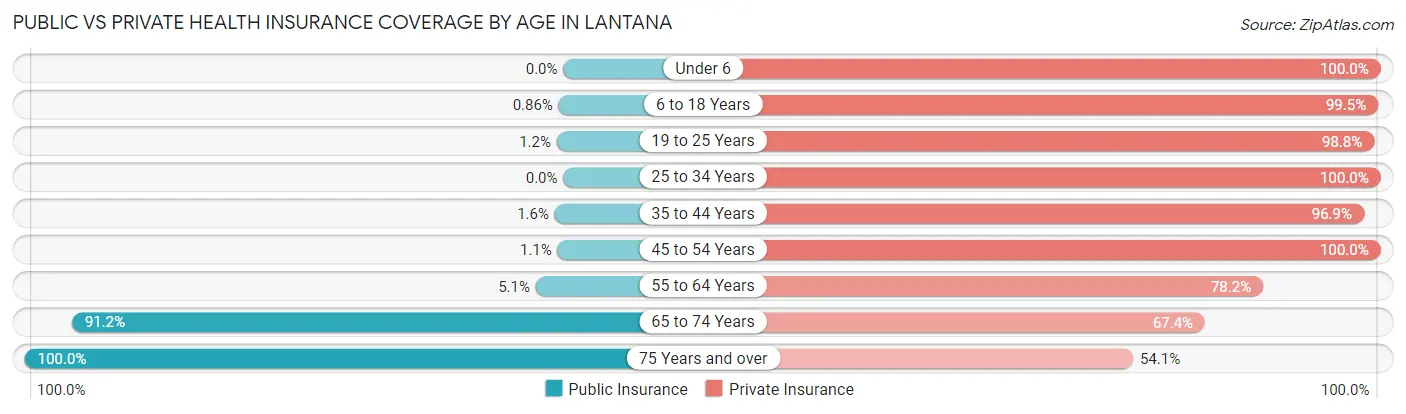
| Age Bracket | Public Insurance | Private Insurance |
| Under 6 | 0 (0.0%) | 859 (100.0%) |
| 6 to 18 Years | 25 (0.9%) | 2,887 (99.5%) |
| 19 to 25 Years | 7 (1.2%) | 571 (98.8%) |
| 25 to 34 Years | 0 (0.0%) | 759 (100.0%) |
| 35 to 44 Years | 27 (1.6%) | 1,643 (96.9%) |
| 45 to 54 Years | 27 (1.1%) | 2,555 (100.0%) |
| 55 to 64 Years | 72 (5.1%) | 1,099 (78.2%) |
| 65 to 74 Years | 666 (91.2%) | 492 (67.4%) |
| 75 Years and over | 222 (100.0%) | 120 (54.0%) |
| Total | 1,046 (8.9%) | 10,985 (93.8%) |
Disability Status by Sex by Age in Lantana
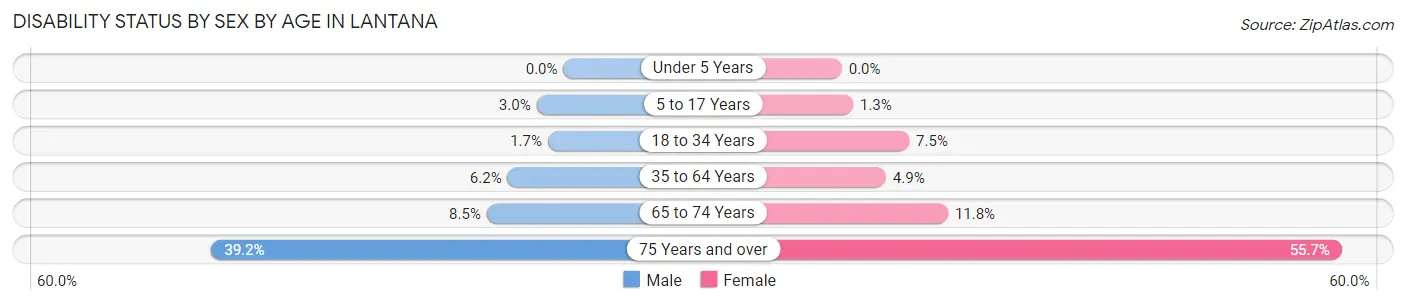
| Age Bracket | Male | Female |
| Under 5 Years | 0 (0.0%) | 0 (0.0%) |
| 5 to 17 Years | 28 (3.0%) | 25 (1.3%) |
| 18 to 34 Years | 14 (1.7%) | 45 (7.5%) |
| 35 to 64 Years | 157 (6.2%) | 154 (4.9%) |
| 65 to 74 Years | 37 (8.5%) | 35 (11.8%) |
| 75 Years and over | 49 (39.2%) | 54 (55.7%) |
Disability Class by Sex by Age in Lantana
Disability Class: Hearing Difficulty
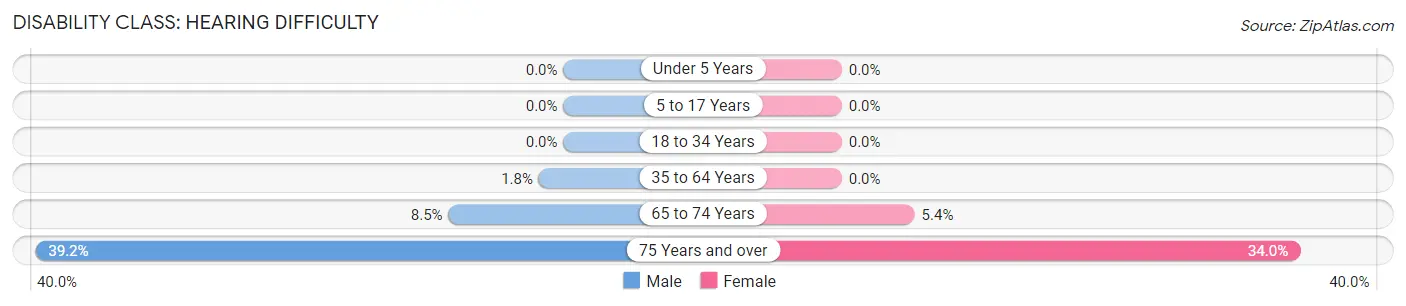
| Age Bracket | Male | Female |
| Under 5 Years | 0 (0.0%) | 0 (0.0%) |
| 5 to 17 Years | 0 (0.0%) | 0 (0.0%) |
| 18 to 34 Years | 0 (0.0%) | 0 (0.0%) |
| 35 to 64 Years | 46 (1.8%) | 0 (0.0%) |
| 65 to 74 Years | 37 (8.5%) | 16 (5.4%) |
| 75 Years and over | 49 (39.2%) | 33 (34.0%) |
Disability Class: Vision Difficulty
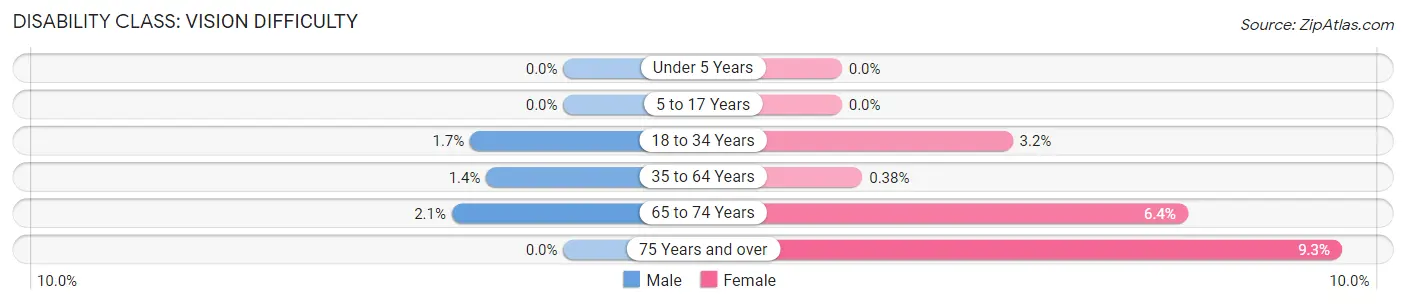
| Age Bracket | Male | Female |
| Under 5 Years | 0 (0.0%) | 0 (0.0%) |
| 5 to 17 Years | 0 (0.0%) | 0 (0.0%) |
| 18 to 34 Years | 14 (1.7%) | 19 (3.2%) |
| 35 to 64 Years | 36 (1.4%) | 12 (0.4%) |
| 65 to 74 Years | 9 (2.1%) | 19 (6.4%) |
| 75 Years and over | 0 (0.0%) | 9 (9.3%) |
Disability Class: Cognitive Difficulty
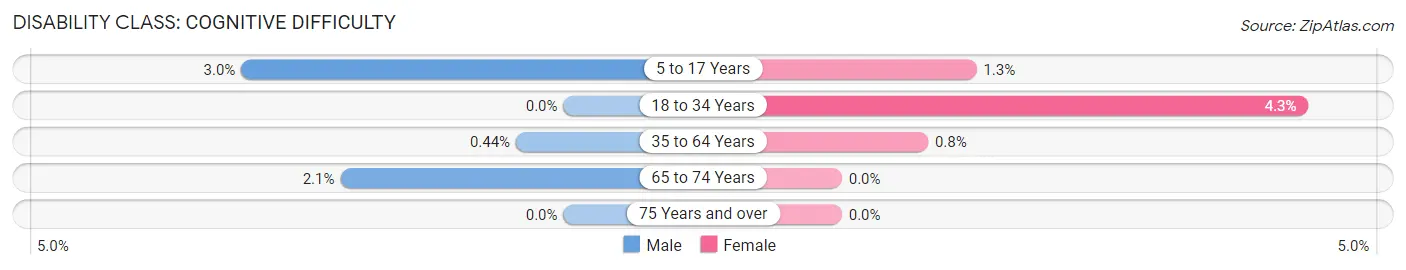
| Age Bracket | Male | Female |
| 5 to 17 Years | 28 (3.0%) | 25 (1.3%) |
| 18 to 34 Years | 0 (0.0%) | 26 (4.3%) |
| 35 to 64 Years | 11 (0.4%) | 25 (0.8%) |
| 65 to 74 Years | 9 (2.1%) | 0 (0.0%) |
| 75 Years and over | 0 (0.0%) | 0 (0.0%) |
Disability Class: Ambulatory Difficulty
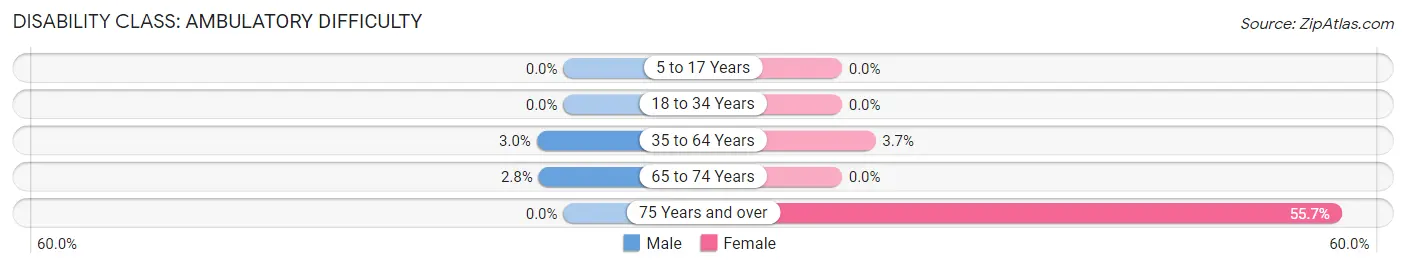
| Age Bracket | Male | Female |
| 5 to 17 Years | 0 (0.0%) | 0 (0.0%) |
| 18 to 34 Years | 0 (0.0%) | 0 (0.0%) |
| 35 to 64 Years | 75 (3.0%) | 117 (3.7%) |
| 65 to 74 Years | 12 (2.8%) | 0 (0.0%) |
| 75 Years and over | 0 (0.0%) | 54 (55.7%) |
Disability Class: Self-Care Difficulty
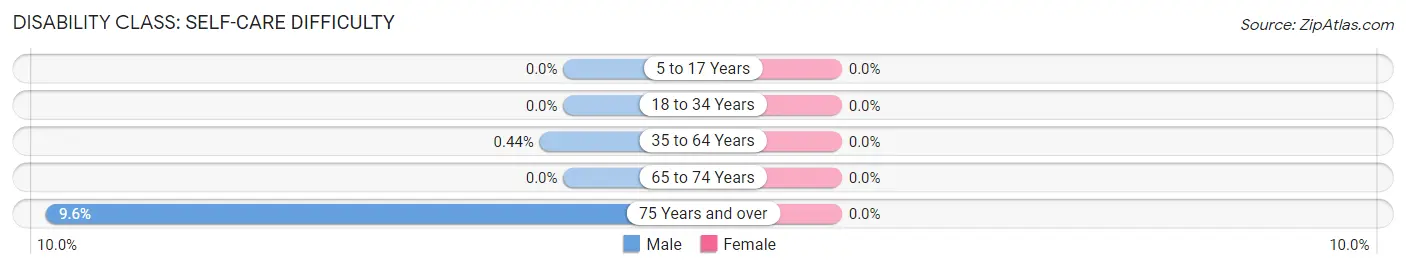
| Age Bracket | Male | Female |
| 5 to 17 Years | 0 (0.0%) | 0 (0.0%) |
| 18 to 34 Years | 0 (0.0%) | 0 (0.0%) |
| 35 to 64 Years | 11 (0.4%) | 0 (0.0%) |
| 65 to 74 Years | 0 (0.0%) | 0 (0.0%) |
| 75 Years and over | 12 (9.6%) | 0 (0.0%) |
Technology Access in Lantana
Computing Device Access in Lantana
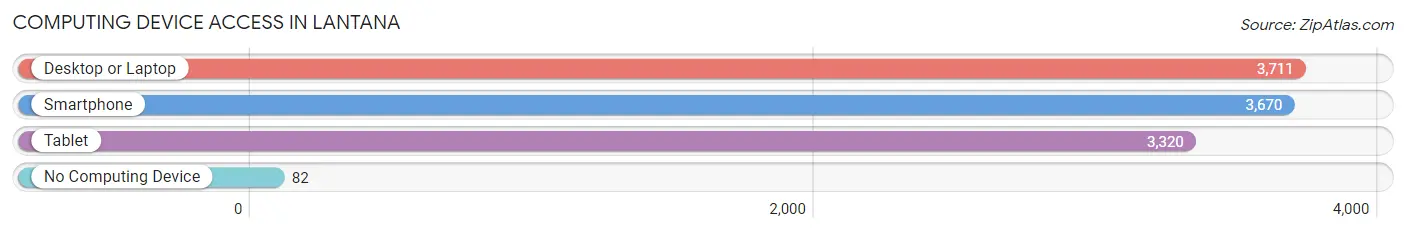
| Device Type | # Households | % Households |
| Desktop or Laptop | 3,711 | 96.9% |
| Smartphone | 3,670 | 95.8% |
| Tablet | 3,320 | 86.7% |
| No Computing Device | 82 | 2.1% |
| Total | 3,830 | 100.0% |
Internet Access in Lantana
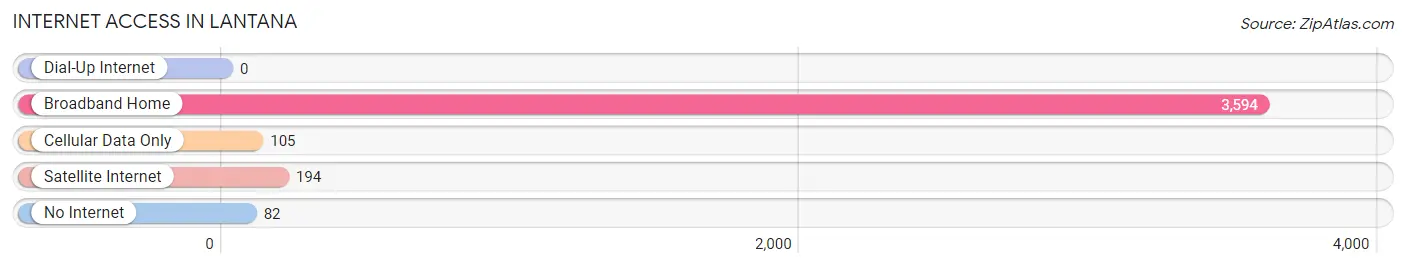
| Internet Type | # Households | % Households |
| Dial-Up Internet | 0 | 0.0% |
| Broadband Home | 3,594 | 93.8% |
| Cellular Data Only | 105 | 2.7% |
| Satellite Internet | 194 | 5.1% |
| No Internet | 82 | 2.1% |
| Total | 3,830 | 100.0% |
Lantana Summary
Lantana is a small town located in Denton County, Texas. It is situated about 30 miles north of Dallas and is part of the Dallas-Fort Worth-Arlington metropolitan area. The town was founded in 1881 and was named after the lantana flower, which is native to the area.
History
Lantana was founded in 1881 by a group of settlers from Kentucky. The town was originally called “Lantana Station” and was a stop on the Texas and Pacific Railway. The town was officially incorporated in 1884 and the first post office was established in 1885.
In the early 1900s, the town began to grow and prosper. The population increased from just over 200 in 1900 to over 1,000 by 1910. The town was home to several businesses, including a cotton gin, a blacksmith shop, a general store, and a hotel.
In the 1920s, the town experienced a period of growth and development. The population increased to over 1,500 and the town was home to several businesses, including a bank, a movie theater, and a school.
In the 1940s, the town experienced a period of decline. The population decreased to just over 1,000 and the town was home to fewer businesses.
In the 1950s, the town experienced a period of growth and development. The population increased to over 1,500 and the town was home to several businesses, including a grocery store, a hardware store, and a restaurant.
In the 1960s, the town experienced a period of decline. The population decreased to just over 1,000 and the town was home to fewer businesses.
In the 1970s, the town experienced a period of growth and development. The population increased to over 1,500 and the town was home to several businesses, including a gas station, a pharmacy, and a barber shop.
In the 1980s, the town experienced a period of decline. The population decreased to just over 1,000 and the town was home to fewer businesses.
In the 1990s, the town experienced a period of growth and development. The population increased to over 1,500 and the town was home to several businesses, including a grocery store, a hardware store, and a restaurant.
Geography
Lantana is located in Denton County, Texas. It is situated about 30 miles north of Dallas and is part of the Dallas-Fort Worth-Arlington metropolitan area. The town is located on the western edge of the Blackland Prairie region of Texas. The terrain is mostly flat with some rolling hills. The town is located near several lakes, including Lake Lewisville, Lake Ray Roberts, and Lake Grapevine.
Economy
The economy of Lantana is largely based on agriculture and manufacturing. The town is home to several farms, which produce a variety of crops, including cotton, corn, and hay. The town is also home to several manufacturing companies, which produce a variety of products, including furniture, clothing, and electronics.
Demographics
As of the 2010 census, the population of Lantana was 1,541. The racial makeup of the town was 79.3% White, 15.2% Hispanic or Latino, 2.2% African American, 0.7% Native American, 0.3% Asian, and 2.5% from other races. The median household income was $45,938 and the median family income was $51,938. The per capita income was $20,938. The town had a poverty rate of 11.3%.
Common Questions
What is the Total Population of Lantana?
Total Population of Lantana is 11,706.
What is the Total Male Population of Lantana?
Total Male Population of Lantana is 5,158.
What is the Total Female Population of Lantana?
Total Female Population of Lantana is 6,548.
What is the Ratio of Males per 100 Females in Lantana?
There are 78.77 Males per 100 Females in Lantana.
What is the Ratio of Females per 100 Males in Lantana?
There are 126.95 Females per 100 Males in Lantana.
What is the Median Population Age in Lantana?
Median Population Age in Lantana is 39.7 Years.
What is the Average Family Size in Lantana
Average Family Size in Lantana is 3.3 People.
What is the Average Household Size in Lantana
Average Household Size in Lantana is 3.1 People.
What is Per Capita Income in Lantana?
Per Capita income in Lantana is $67,244.
What is the Median Family Income in Lantana?
Median Family Income in Lantana is $216,761.
What is the Median Household income in Lantana?
Median Household Income in Lantana is $205,412.
What is Income or Wage Gap in Lantana?
Income or Wage Gap in Lantana is 50.1%.
Women in Lantana earn 49.9 cents for every dollar earned by a man.
What is Inequality or Gini Index in Lantana?
Inequality or Gini Index in Lantana is 0.30.
How Large is the Labor Force in Lantana?
There are 5,412 People in the Labor Forcein in Lantana.
What is the Percentage of People in the Labor Force in Lantana?
62.6% of People are in the Labor Force in Lantana.
What is the Unemployment Rate in Lantana?
Unemployment Rate in Lantana is 3.6%.