Taylor Lake Village, TX
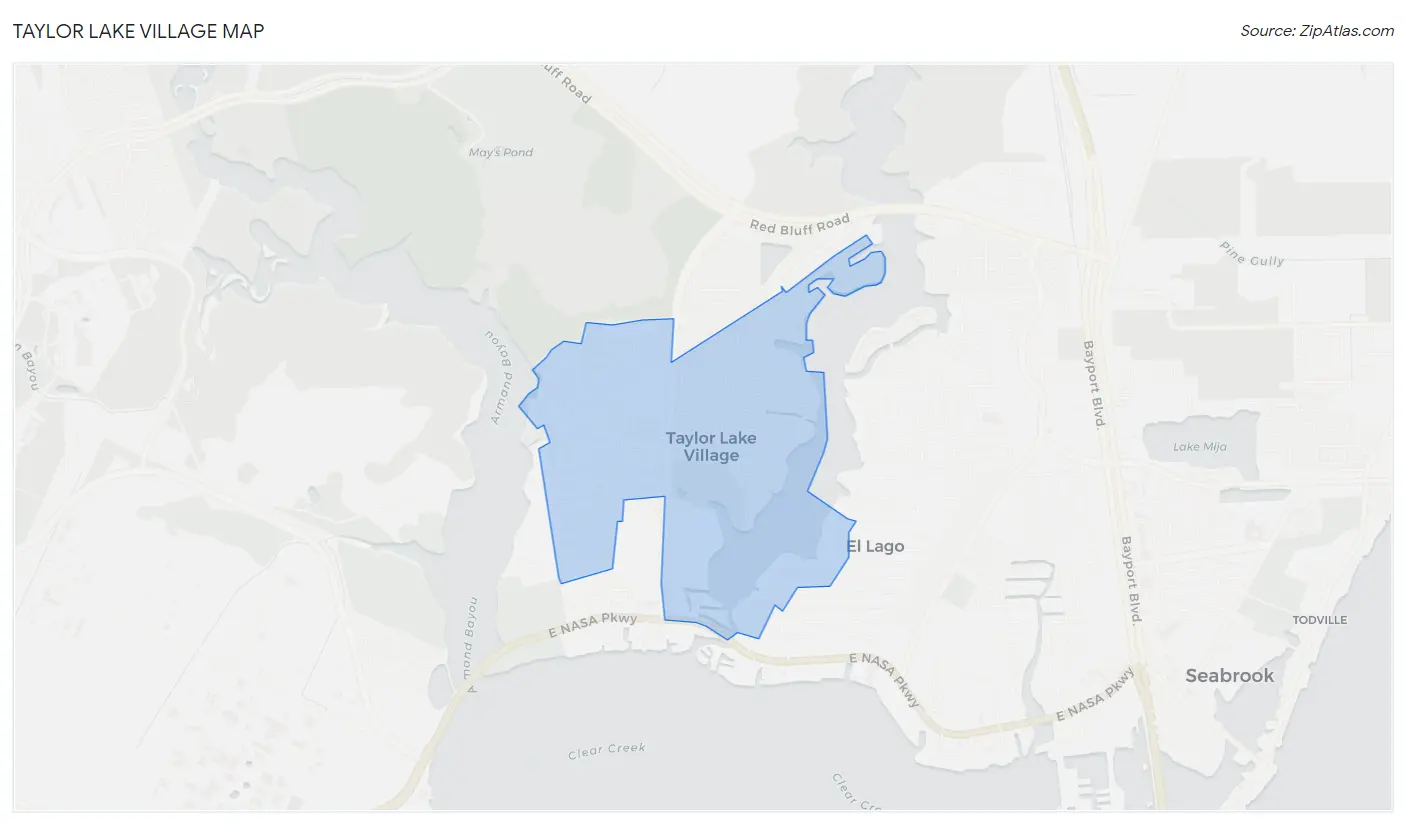
Taylor Lake Village Map
Taylor Lake Village Overview
3,677
TOTAL POPULATION
1,873
MALE POPULATION
1,804
FEMALE POPULATION
103.82
MALES / 100 FEMALES
96.32
FEMALES / 100 MALES
51.3
MEDIAN AGE
2.8
AVG FAMILY SIZE
2.6
AVG HOUSEHOLD SIZE
$64,403
PER CAPITA INCOME
$151,011
AVG FAMILY INCOME
$150,479
AVG HOUSEHOLD INCOME
48.4%
WAGE / INCOME GAP [ % ]
51.6¢/ $1
WAGE / INCOME GAP [ $ ]
0.32
INEQUALITY / GINI INDEX
1,756
LABOR FORCE [ PEOPLE ]
57.7%
PERCENT IN LABOR FORCE
2.8%
UNEMPLOYMENT RATE
Race in Taylor Lake Village
The most populous races in Taylor Lake Village are White / Caucasian (3,000 | 81.6%), Hispanic or Latino (956 | 26.0%), and Two or more Races (470 | 12.8%).
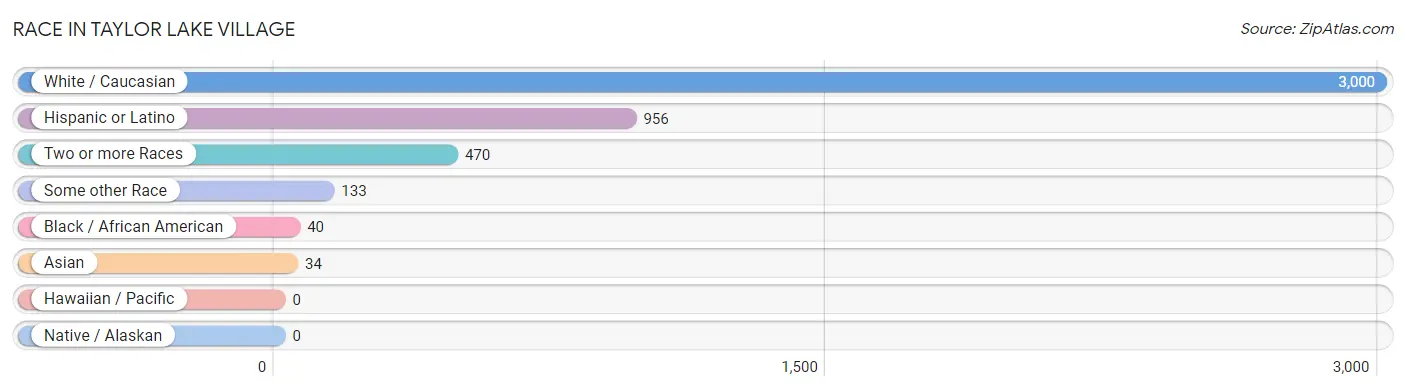
| Race | # Population | % Population |
| Asian | 34 | 0.9% |
| Black / African American | 40 | 1.1% |
| Hawaiian / Pacific | 0 | 0.0% |
| Hispanic or Latino | 956 | 26.0% |
| Native / Alaskan | 0 | 0.0% |
| White / Caucasian | 3,000 | 81.6% |
| Two or more Races | 470 | 12.8% |
| Some other Race | 133 | 3.6% |
| Total | 3,677 | 100.0% |
Ancestry in Taylor Lake Village
The most populous ancestries reported in Taylor Lake Village are English (828 | 22.5%), Mexican (720 | 19.6%), German (435 | 11.8%), Irish (425 | 11.6%), and Polish (257 | 7.0%), together accounting for 72.5% of all Taylor Lake Village residents.
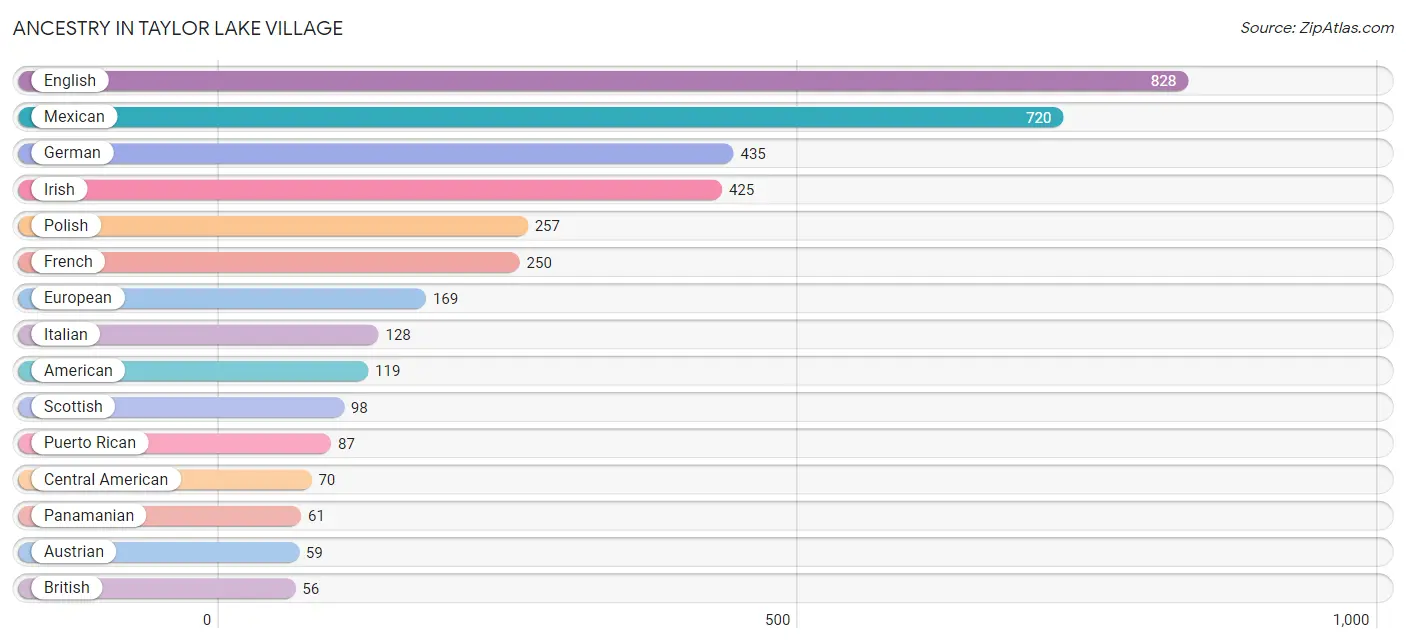
| Ancestry | # Population | % Population |
| American | 119 | 3.2% |
| Arab | 22 | 0.6% |
| Austrian | 59 | 1.6% |
| British | 56 | 1.5% |
| Canadian | 7 | 0.2% |
| Central American | 70 | 1.9% |
| Chilean | 31 | 0.8% |
| Colombian | 12 | 0.3% |
| Czech | 26 | 0.7% |
| Danish | 12 | 0.3% |
| Dutch | 16 | 0.4% |
| English | 828 | 22.5% |
| European | 169 | 4.6% |
| French | 250 | 6.8% |
| German | 435 | 11.8% |
| Greek | 55 | 1.5% |
| Guatemalan | 9 | 0.2% |
| Indian (Asian) | 16 | 0.4% |
| Irish | 425 | 11.6% |
| Italian | 128 | 3.5% |
| Jordanian | 11 | 0.3% |
| Korean | 11 | 0.3% |
| Mexican | 720 | 19.6% |
| Palestinian | 11 | 0.3% |
| Panamanian | 61 | 1.7% |
| Polish | 257 | 7.0% |
| Puerto Rican | 87 | 2.4% |
| Russian | 23 | 0.6% |
| Scandinavian | 34 | 0.9% |
| Scotch-Irish | 19 | 0.5% |
| Scottish | 98 | 2.7% |
| South American | 43 | 1.2% |
| Spaniard | 36 | 1.0% |
| Sri Lankan | 9 | 0.2% |
| Swiss | 48 | 1.3% |
| Thai | 9 | 0.2% |
| Welsh | 8 | 0.2% | View All 37 Rows |
Immigrants in Taylor Lake Village
The most numerous immigrant groups reported in Taylor Lake Village came from Latin America (118 | 3.2%), Central America (86 | 2.3%), Mexico (77 | 2.1%), Europe (55 | 1.5%), and Germany (55 | 1.5%), together accounting for 10.6% of all Taylor Lake Village residents.
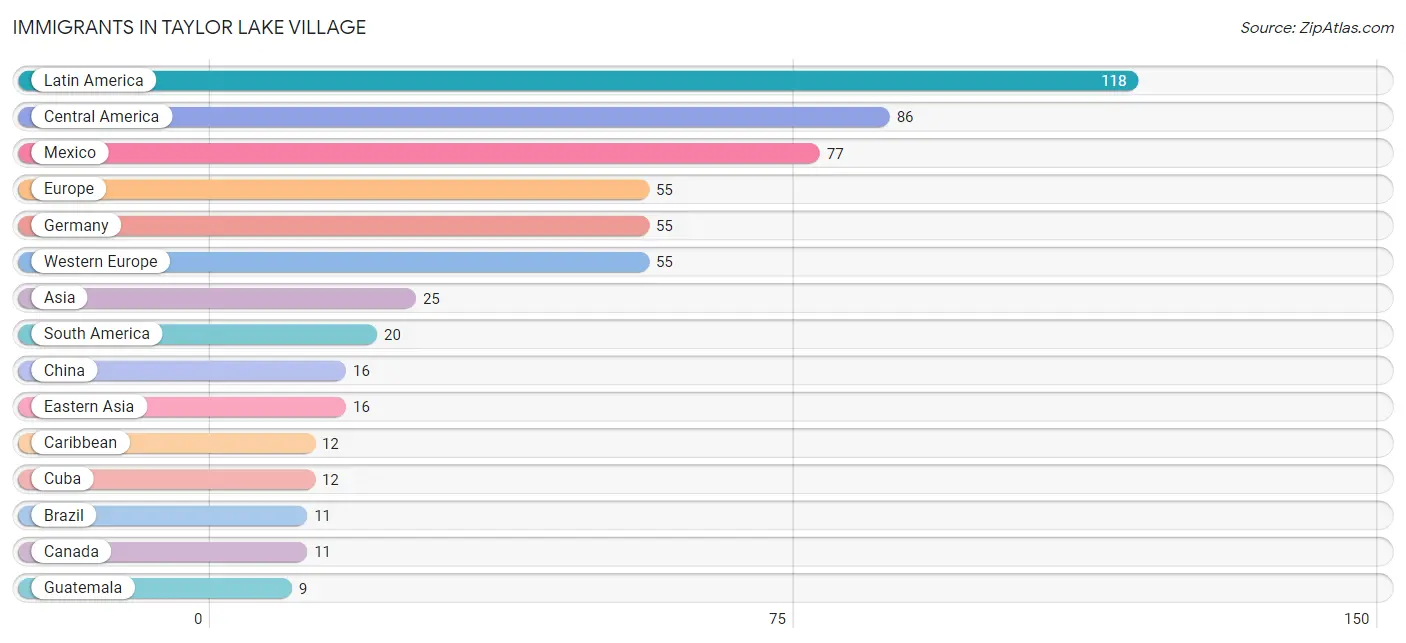
| Immigration Origin | # Population | % Population |
| Asia | 25 | 0.7% |
| Brazil | 11 | 0.3% |
| Canada | 11 | 0.3% |
| Caribbean | 12 | 0.3% |
| Central America | 86 | 2.3% |
| China | 16 | 0.4% |
| Cuba | 12 | 0.3% |
| Eastern Asia | 16 | 0.4% |
| Europe | 55 | 1.5% |
| Germany | 55 | 1.5% |
| Guatemala | 9 | 0.2% |
| Guyana | 9 | 0.2% |
| Latin America | 118 | 3.2% |
| Mexico | 77 | 2.1% |
| South America | 20 | 0.5% |
| South Eastern Asia | 9 | 0.2% |
| Vietnam | 9 | 0.2% |
| Western Europe | 55 | 1.5% | View All 18 Rows |
Sex and Age in Taylor Lake Village
Sex and Age in Taylor Lake Village
The most populous age groups in Taylor Lake Village are 70 to 74 Years (262 | 14.0%) for men and 65 to 69 Years (210 | 11.6%) for women.
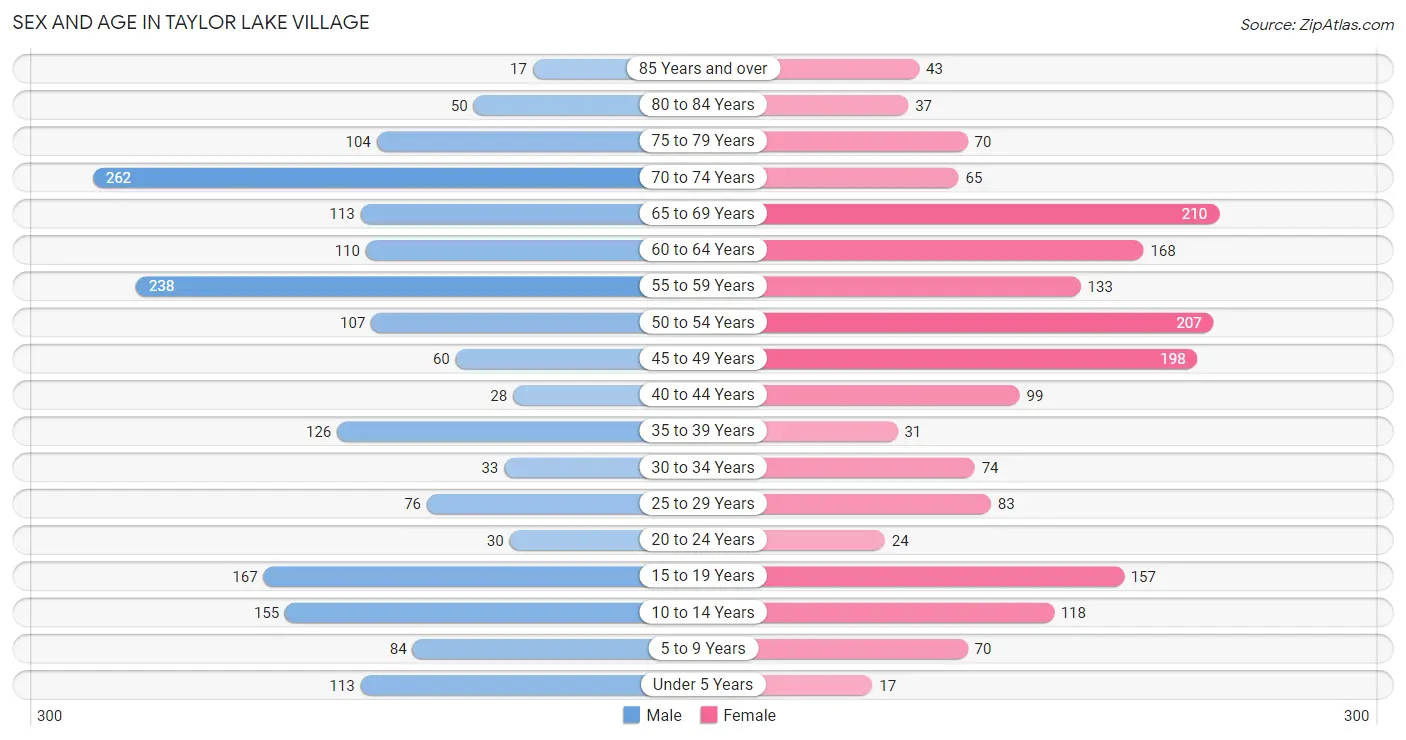
| Age Bracket | Male | Female |
| Under 5 Years | 113 (6.0%) | 17 (0.9%) |
| 5 to 9 Years | 84 (4.5%) | 70 (3.9%) |
| 10 to 14 Years | 155 (8.3%) | 118 (6.5%) |
| 15 to 19 Years | 167 (8.9%) | 157 (8.7%) |
| 20 to 24 Years | 30 (1.6%) | 24 (1.3%) |
| 25 to 29 Years | 76 (4.1%) | 83 (4.6%) |
| 30 to 34 Years | 33 (1.8%) | 74 (4.1%) |
| 35 to 39 Years | 126 (6.7%) | 31 (1.7%) |
| 40 to 44 Years | 28 (1.5%) | 99 (5.5%) |
| 45 to 49 Years | 60 (3.2%) | 198 (11.0%) |
| 50 to 54 Years | 107 (5.7%) | 207 (11.5%) |
| 55 to 59 Years | 238 (12.7%) | 133 (7.4%) |
| 60 to 64 Years | 110 (5.9%) | 168 (9.3%) |
| 65 to 69 Years | 113 (6.0%) | 210 (11.6%) |
| 70 to 74 Years | 262 (14.0%) | 65 (3.6%) |
| 75 to 79 Years | 104 (5.6%) | 70 (3.9%) |
| 80 to 84 Years | 50 (2.7%) | 37 (2.1%) |
| 85 Years and over | 17 (0.9%) | 43 (2.4%) |
| Total | 1,873 (100.0%) | 1,804 (100.0%) |
Families and Households in Taylor Lake Village
Median Family Size in Taylor Lake Village
The median family size in Taylor Lake Village is 2.84 persons per family, with married-couple families (1,067 | 88.6%) accounting for the largest median family size of 2.89 persons per family. On the other hand, single male/father families (16 | 1.3%) represent the smallest median family size with 2.00 persons per family.
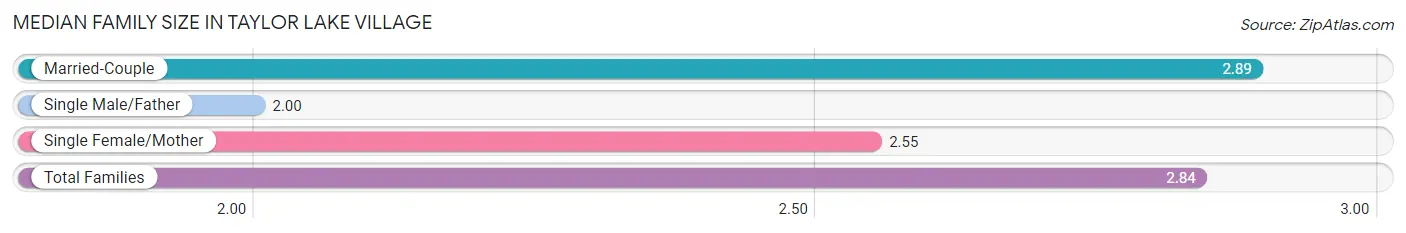
| Family Type | # Families | Family Size |
| Married-Couple | 1,067 (88.6%) | 2.89 |
| Single Male/Father | 16 (1.3%) | 2.00 |
| Single Female/Mother | 121 (10.1%) | 2.55 |
| Total Families | 1,204 (100.0%) | 2.84 |
Median Household Size in Taylor Lake Village
The median household size in Taylor Lake Village is 2.61 persons per household, with married-couple households (1,067 | 75.7%) accounting for the largest median household size of 2.91 persons per household. non-family households (206 | 14.6%) represent the smallest median household size with 1.13 persons per household.
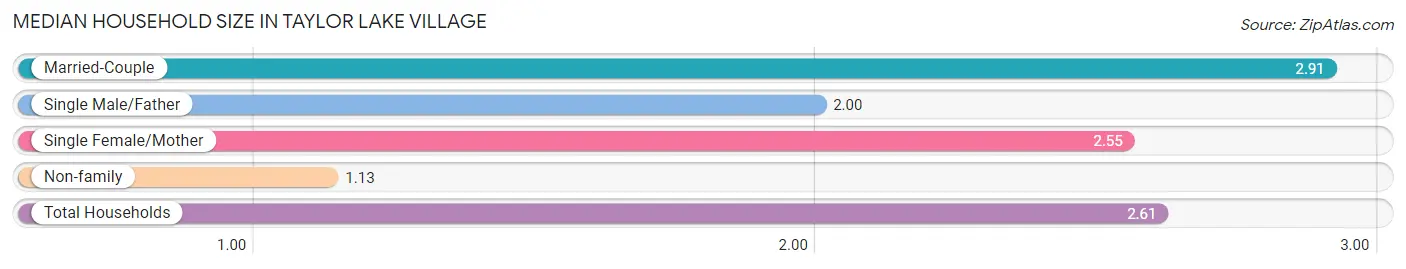
| Household Type | # Households | Household Size |
| Married-Couple | 1,067 (75.7%) | 2.91 |
| Single Male/Father | 16 (1.1%) | 2.00 |
| Single Female/Mother | 121 (8.6%) | 2.55 |
| Non-family | 206 (14.6%) | 1.13 |
| Total Households | 1,410 (100.0%) | 2.61 |
Household Size by Marriage Status in Taylor Lake Village
Out of a total of 1,410 households in Taylor Lake Village, 1,204 (85.4%) are family households, while 206 (14.6%) are nonfamily households. The most numerous type of family households are 2-person households, comprising 583, and the most common type of nonfamily households are 1-person households, comprising 180.
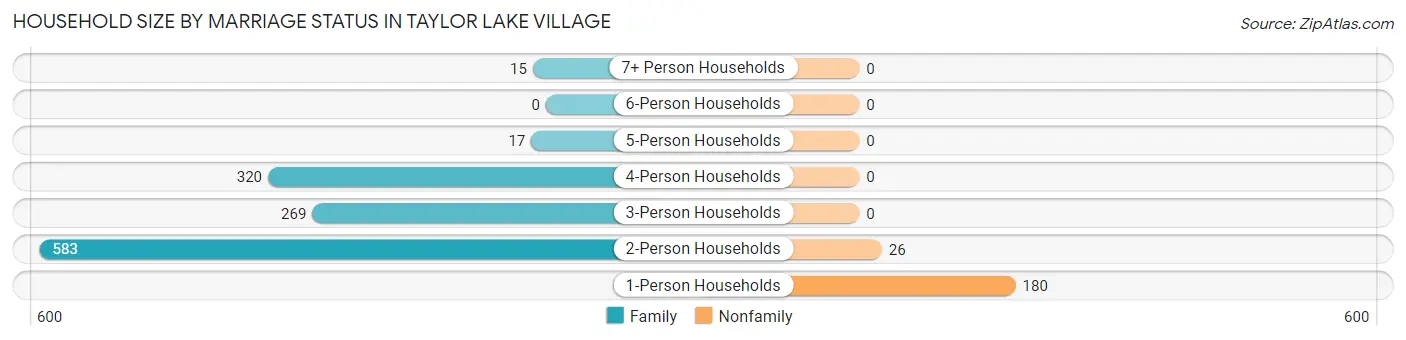
| Household Size | Family Households | Nonfamily Households |
| 1-Person Households | - | 180 (12.8%) |
| 2-Person Households | 583 (41.3%) | 26 (1.8%) |
| 3-Person Households | 269 (19.1%) | 0 (0.0%) |
| 4-Person Households | 320 (22.7%) | 0 (0.0%) |
| 5-Person Households | 17 (1.2%) | 0 (0.0%) |
| 6-Person Households | 0 (0.0%) | 0 (0.0%) |
| 7+ Person Households | 15 (1.1%) | 0 (0.0%) |
| Total | 1,204 (85.4%) | 206 (14.6%) |
Female Fertility in Taylor Lake Village
Fertility by Age in Taylor Lake Village
Average fertility rate in Taylor Lake Village is 17.0 births per 1,000 women. Women in the age bracket of 20 to 34 years have the highest fertility rate with 66.0 births per 1,000 women. Women in the age bracket of 20 to 34 years acount for 100.0% of all women with births.
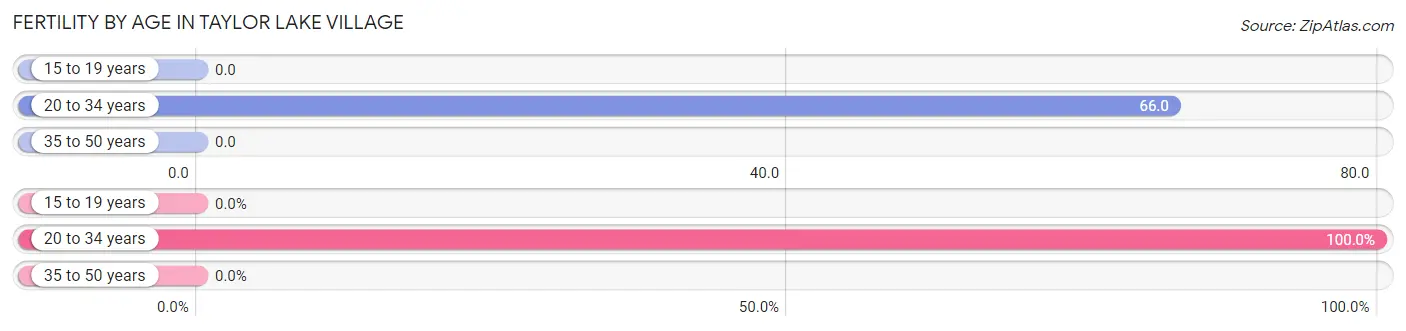
| Age Bracket | Women with Births | Births / 1,000 Women |
| 15 to 19 years | 0 (0.0%) | 0.0 |
| 20 to 34 years | 12 (100.0%) | 66.0 |
| 35 to 50 years | 0 (0.0%) | 0.0 |
| Total | 12 (100.0%) | 17.0 |
Fertility by Age by Marriage Status in Taylor Lake Village
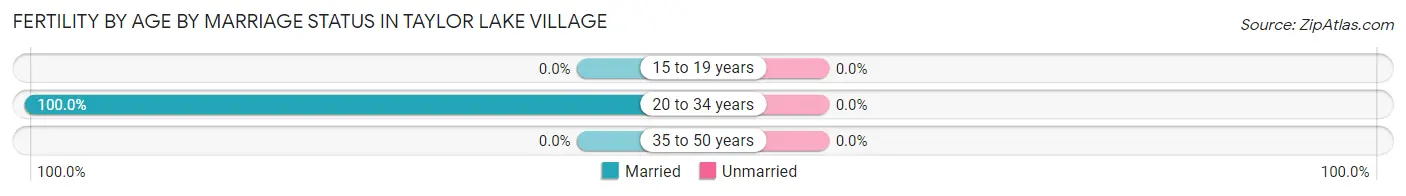
| Age Bracket | Married | Unmarried |
| 15 to 19 years | 0 (0.0%) | 0 (0.0%) |
| 20 to 34 years | 12 (100.0%) | 0 (0.0%) |
| 35 to 50 years | 0 (0.0%) | 0 (0.0%) |
| Total | 12 (100.0%) | 0 (0.0%) |
Fertility by Education in Taylor Lake Village
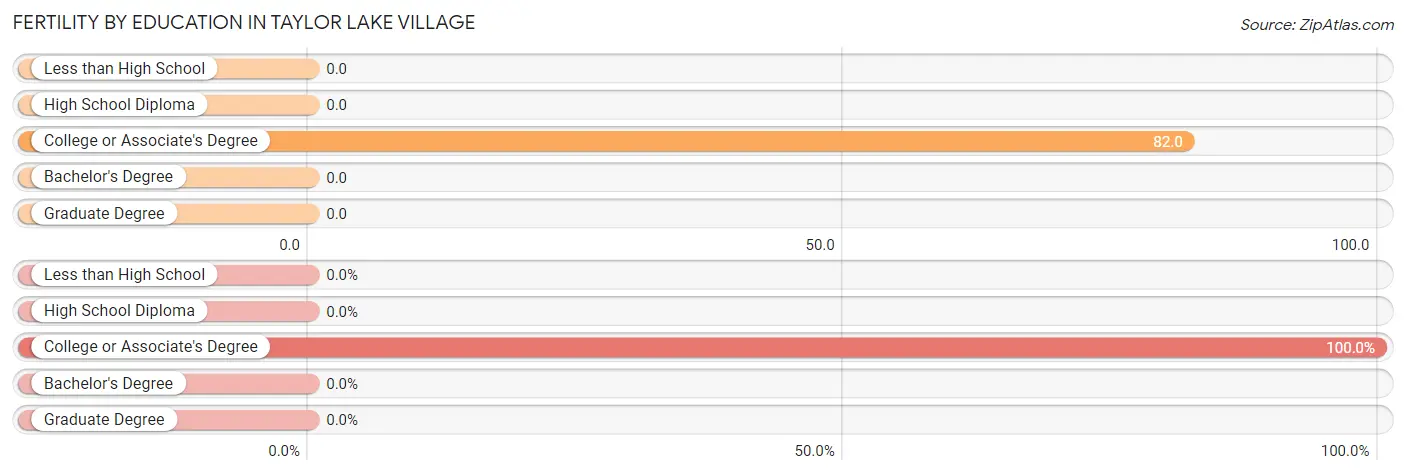
| Educational Attainment | Women with Births | Births / 1,000 Women |
| Less than High School | 0 (0.0%) | 0.0 |
| High School Diploma | 0 (0.0%) | 0.0 |
| College or Associate's Degree | 12 (100.0%) | 82.0 |
| Bachelor's Degree | 0 (0.0%) | 0.0 |
| Graduate Degree | 0 (0.0%) | 0.0 |
| Total | 12 (100.0%) | 17.0 |
Fertility by Education by Marriage Status in Taylor Lake Village
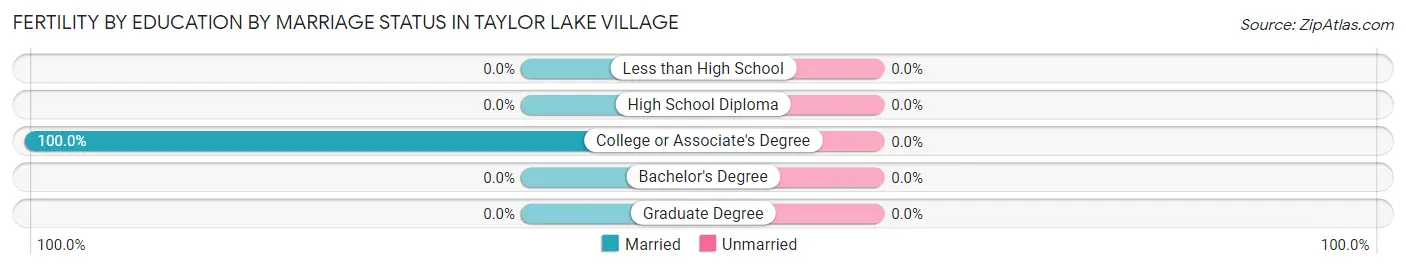
| Educational Attainment | Married | Unmarried |
| Less than High School | 0 (0.0%) | 0 (0.0%) |
| High School Diploma | 0 (0.0%) | 0 (0.0%) |
| College or Associate's Degree | 12 (100.0%) | 0 (0.0%) |
| Bachelor's Degree | 0 (0.0%) | 0 (0.0%) |
| Graduate Degree | 0 (0.0%) | 0 (0.0%) |
| Total | 12 (100.0%) | 0 (0.0%) |
Income in Taylor Lake Village
Income Overview in Taylor Lake Village
Per Capita Income in Taylor Lake Village is $64,403, while median incomes of families and households are $151,011 and $150,479 respectively.
| Characteristic | Number | Measure |
| Per Capita Income | 3,677 | $64,403 |
| Median Family Income | 1,204 | $151,011 |
| Mean Family Income | 1,204 | $161,080 |
| Median Household Income | 1,410 | $150,479 |
| Mean Household Income | 1,410 | $169,919 |
| Income Deficit | 1,204 | $0 |
| Wage / Income Gap (%) | 3,677 | 48.38% |
| Wage / Income Gap ($) | 3,677 | 51.62¢ per $1 |
| Gini / Inequality Index | 3,677 | 0.32 |
Earnings by Sex in Taylor Lake Village
Average Earnings in Taylor Lake Village are $79,440, $115,815 for men and $59,784 for women, a difference of 48.4%.
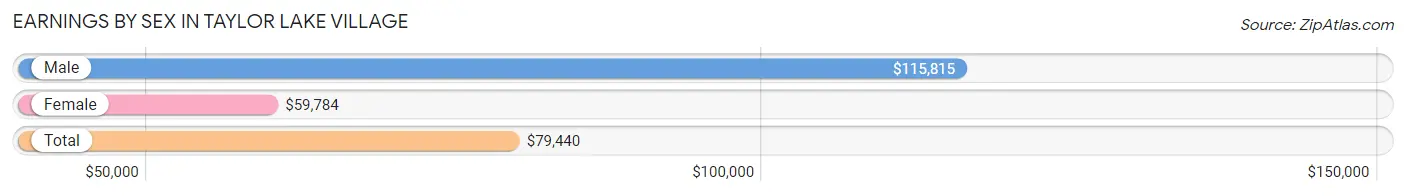
| Sex | Number | Average Earnings |
| Male | 945 (53.0%) | $115,815 |
| Female | 837 (47.0%) | $59,784 |
| Total | 1,782 (100.0%) | $79,440 |
Earnings by Sex by Income Bracket in Taylor Lake Village
The most common earnings brackets in Taylor Lake Village are $100,000+ for men (522 | 55.2%) and $100,000+ for women (193 | 23.1%).
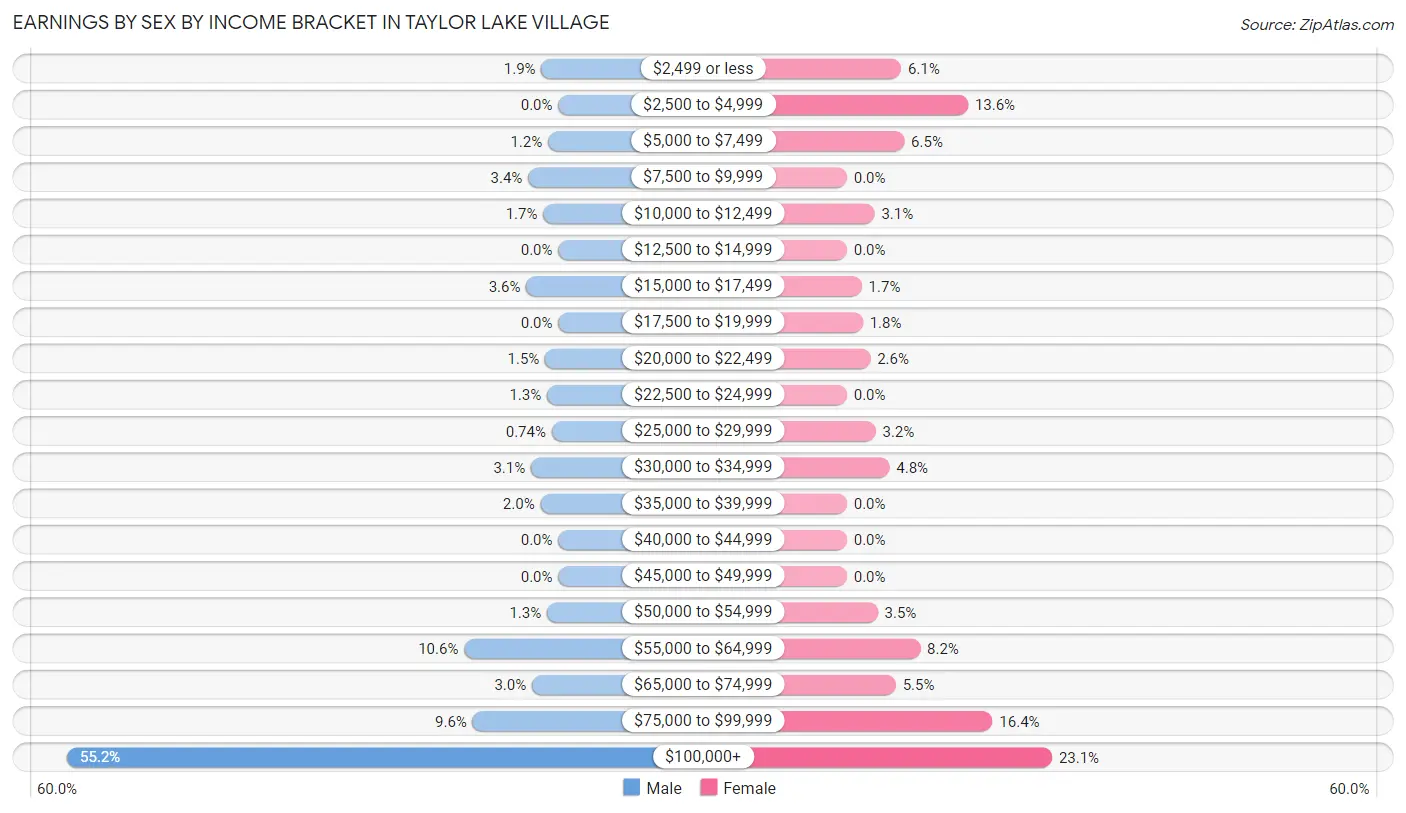
| Income | Male | Female |
| $2,499 or less | 18 (1.9%) | 51 (6.1%) |
| $2,500 to $4,999 | 0 (0.0%) | 114 (13.6%) |
| $5,000 to $7,499 | 11 (1.2%) | 54 (6.5%) |
| $7,500 to $9,999 | 32 (3.4%) | 0 (0.0%) |
| $10,000 to $12,499 | 16 (1.7%) | 26 (3.1%) |
| $12,500 to $14,999 | 0 (0.0%) | 0 (0.0%) |
| $15,000 to $17,499 | 34 (3.6%) | 14 (1.7%) |
| $17,500 to $19,999 | 0 (0.0%) | 15 (1.8%) |
| $20,000 to $22,499 | 14 (1.5%) | 22 (2.6%) |
| $22,500 to $24,999 | 12 (1.3%) | 0 (0.0%) |
| $25,000 to $29,999 | 7 (0.7%) | 27 (3.2%) |
| $30,000 to $34,999 | 29 (3.1%) | 40 (4.8%) |
| $35,000 to $39,999 | 19 (2.0%) | 0 (0.0%) |
| $40,000 to $44,999 | 0 (0.0%) | 0 (0.0%) |
| $45,000 to $49,999 | 0 (0.0%) | 0 (0.0%) |
| $50,000 to $54,999 | 12 (1.3%) | 29 (3.5%) |
| $55,000 to $64,999 | 100 (10.6%) | 69 (8.2%) |
| $65,000 to $74,999 | 28 (3.0%) | 46 (5.5%) |
| $75,000 to $99,999 | 91 (9.6%) | 137 (16.4%) |
| $100,000+ | 522 (55.2%) | 193 (23.1%) |
| Total | 945 (100.0%) | 837 (100.0%) |
Earnings by Sex by Educational Attainment in Taylor Lake Village
Average earnings in Taylor Lake Village are $121,563 for men and $60,302 for women, a difference of 50.4%. Men with an educational attainment of bachelor's degree enjoy the highest average annual earnings of $171,506, while those with college or associate's degree education earn the least with $81,500. Women with an educational attainment of bachelor's degree earn the most with the average annual earnings of $92,083, while those with bachelor's degree education have the smallest earnings of $92,083.
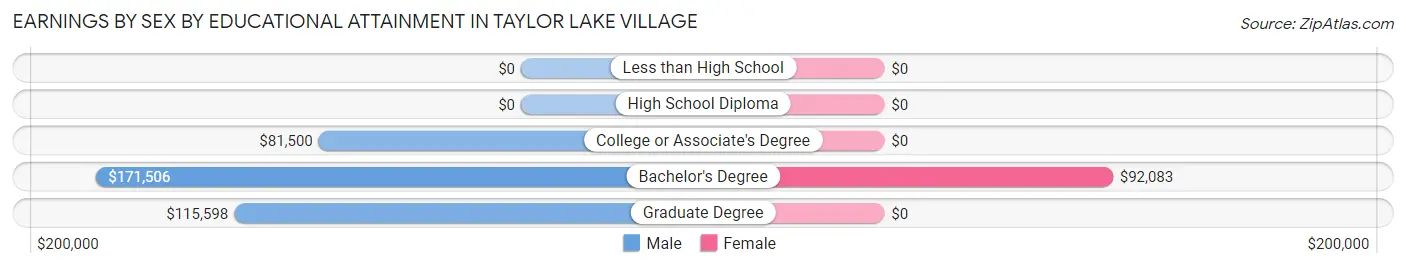
| Educational Attainment | Male Income | Female Income |
| Less than High School | - | - |
| High School Diploma | - | - |
| College or Associate's Degree | $81,500 | $0 |
| Bachelor's Degree | $171,506 | $92,083 |
| Graduate Degree | $115,598 | $0 |
| Total | $121,563 | $60,302 |
Family Income in Taylor Lake Village
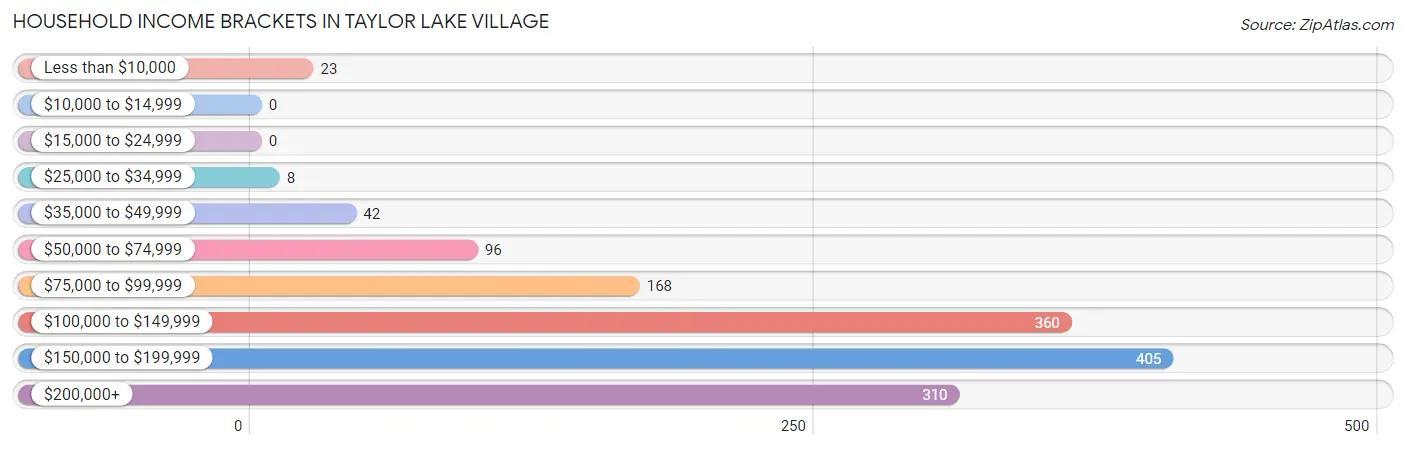
Family Income Brackets in Taylor Lake Village
According to the Taylor Lake Village family income data, there are 405 families falling into the $150,000 to $199,999 income range, which is the most common income bracket and makes up 33.6% of all families.
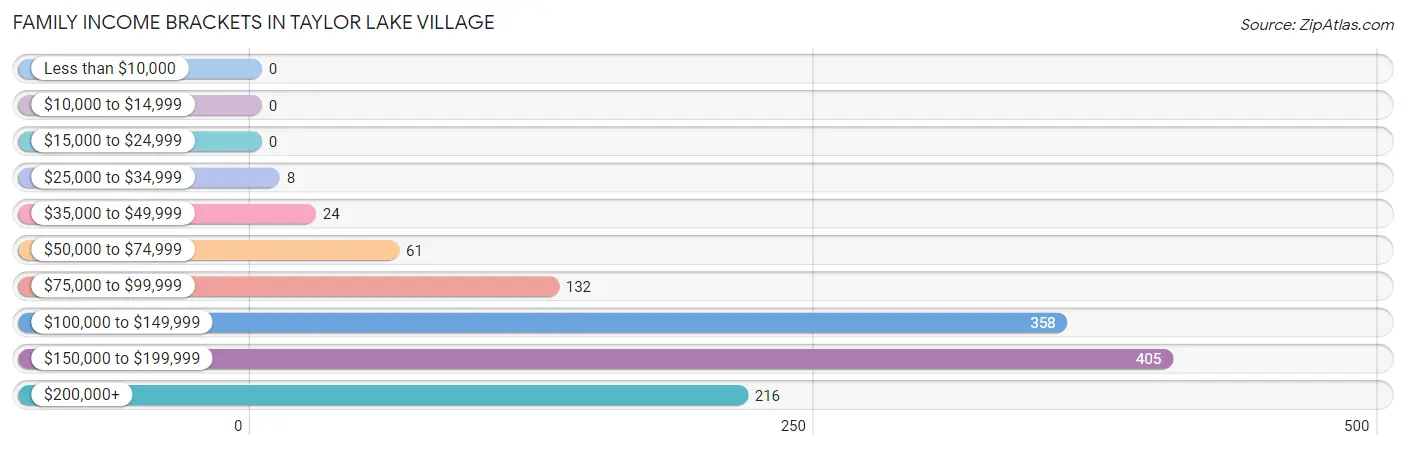
| Income Bracket | # Families | % Families |
| Less than $10,000 | 0 | 0.0% |
| $10,000 to $14,999 | 0 | 0.0% |
| $15,000 to $24,999 | 0 | 0.0% |
| $25,000 to $34,999 | 8 | 0.7% |
| $35,000 to $49,999 | 24 | 2.0% |
| $50,000 to $74,999 | 61 | 5.1% |
| $75,000 to $99,999 | 132 | 11.0% |
| $100,000 to $149,999 | 358 | 29.7% |
| $150,000 to $199,999 | 405 | 33.6% |
| $200,000+ | 216 | 17.9% |
Family Income by Famaliy Size in Taylor Lake Village
4-person families (328 | 27.2%) account for the highest median family income in Taylor Lake Village with $174,489 per family, while 2-person families (592 | 49.2%) have the highest median income of $62,868 per family member.
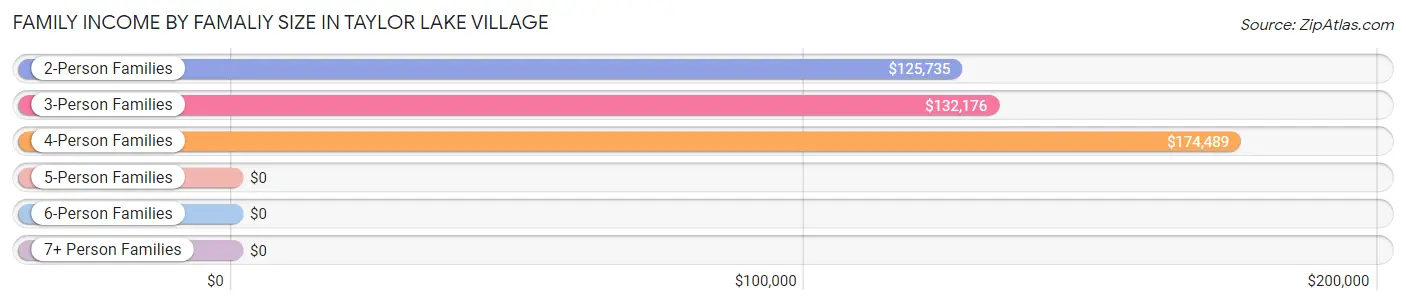
| Income Bracket | # Families | Median Income |
| 2-Person Families | 592 (49.2%) | $125,735 |
| 3-Person Families | 260 (21.6%) | $132,176 |
| 4-Person Families | 328 (27.2%) | $174,489 |
| 5-Person Families | 9 (0.7%) | $0 |
| 6-Person Families | 0 (0.0%) | $0 |
| 7+ Person Families | 15 (1.3%) | $0 |
| Total | 1,204 (100.0%) | $151,011 |
Family Income by Number of Earners in Taylor Lake Village
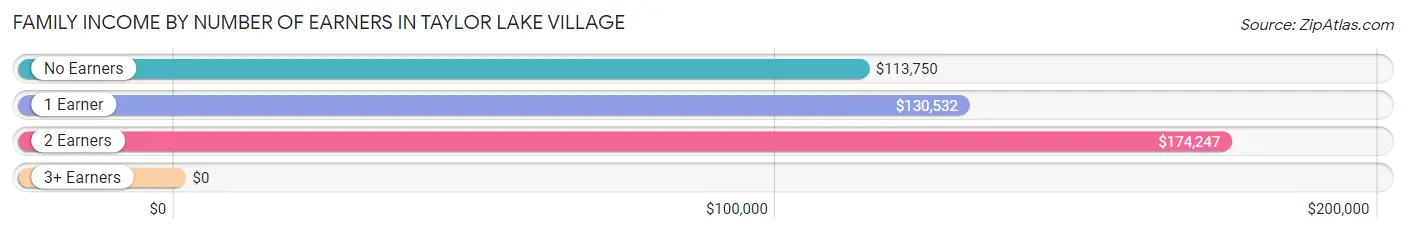
| Number of Earners | # Families | Median Income |
| No Earners | 122 (10.1%) | $113,750 |
| 1 Earner | 563 (46.8%) | $130,532 |
| 2 Earners | 465 (38.6%) | $174,247 |
| 3+ Earners | 54 (4.5%) | $0 |
| Total | 1,204 (100.0%) | $151,011 |
Household Income in Taylor Lake Village
Household Income Brackets in Taylor Lake Village
With 405 households falling in the category, the $150,000 to $199,999 income range is the most frequent in Taylor Lake Village, accounting for 28.7% of all households.
| Income Bracket | # Households | % Households |
| Less than $10,000 | 23 | 1.6% |
| $10,000 to $14,999 | 0 | 0.0% |
| $15,000 to $24,999 | 0 | 0.0% |
| $25,000 to $34,999 | 8 | 0.6% |
| $35,000 to $49,999 | 42 | 3.0% |
| $50,000 to $74,999 | 96 | 6.8% |
| $75,000 to $99,999 | 168 | 11.9% |
| $100,000 to $149,999 | 360 | 25.5% |
| $150,000 to $199,999 | 405 | 28.7% |
| $200,000+ | 310 | 22.0% |
Household Income by Householder Age in Taylor Lake Village
The median household income in Taylor Lake Village is $150,479, with the highest median household income of $175,156 found in the 25 to 44 years age bracket for the primary householder. A total of 212 households (15.0%) fall into this category.
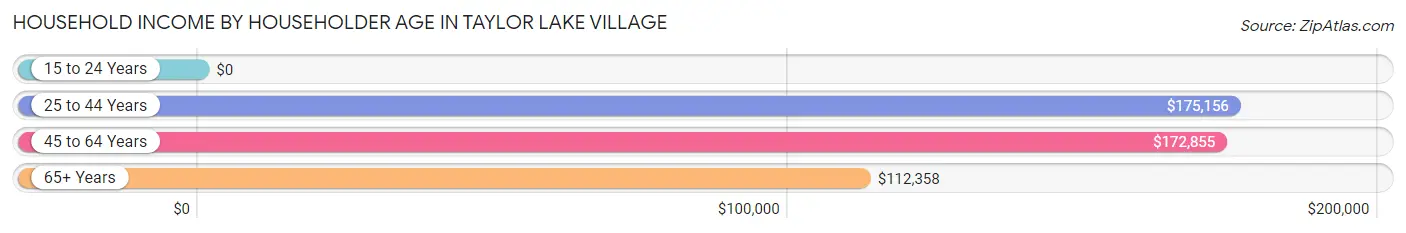
| Income Bracket | # Households | Median Income |
| 15 to 24 Years | 0 (0.0%) | $0 |
| 25 to 44 Years | 212 (15.0%) | $175,156 |
| 45 to 64 Years | 631 (44.8%) | $172,855 |
| 65+ Years | 567 (40.2%) | $112,358 |
| Total | 1,410 (100.0%) | $150,479 |
Poverty in Taylor Lake Village
Income Below Poverty by Sex and Age in Taylor Lake Village
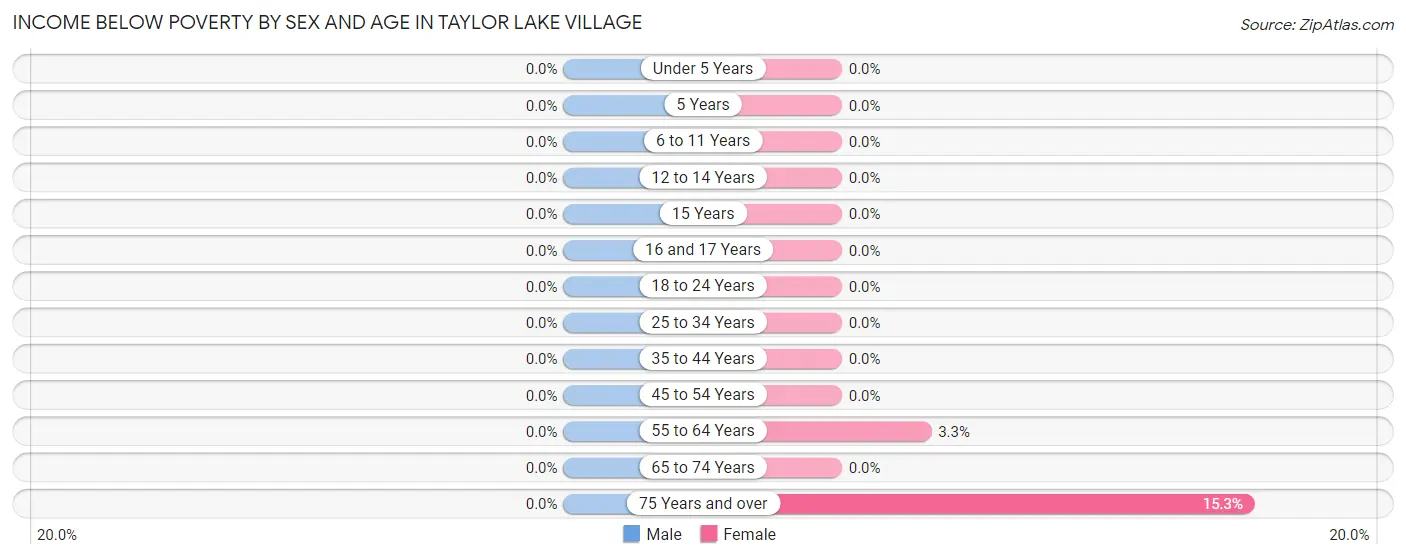
| Age Bracket | Male | Female |
| Under 5 Years | 0 (0.0%) | 0 (0.0%) |
| 5 Years | 0 (0.0%) | 0 (0.0%) |
| 6 to 11 Years | 0 (0.0%) | 0 (0.0%) |
| 12 to 14 Years | 0 (0.0%) | 0 (0.0%) |
| 15 Years | 0 (0.0%) | 0 (0.0%) |
| 16 and 17 Years | 0 (0.0%) | 0 (0.0%) |
| 18 to 24 Years | 0 (0.0%) | 0 (0.0%) |
| 25 to 34 Years | 0 (0.0%) | 0 (0.0%) |
| 35 to 44 Years | 0 (0.0%) | 0 (0.0%) |
| 45 to 54 Years | 0 (0.0%) | 0 (0.0%) |
| 55 to 64 Years | 0 (0.0%) | 10 (3.3%) |
| 65 to 74 Years | 0 (0.0%) | 0 (0.0%) |
| 75 Years and over | 0 (0.0%) | 23 (15.3%) |
| Total | 0 (0.0%) | 33 (1.8%) |
Income Above Poverty by Sex and Age in Taylor Lake Village
According to the poverty statistics in Taylor Lake Village, males aged under 5 years and females aged under 5 years are the age groups that are most secure financially, with 100.0% of males and 100.0% of females in these age groups living above the poverty line.
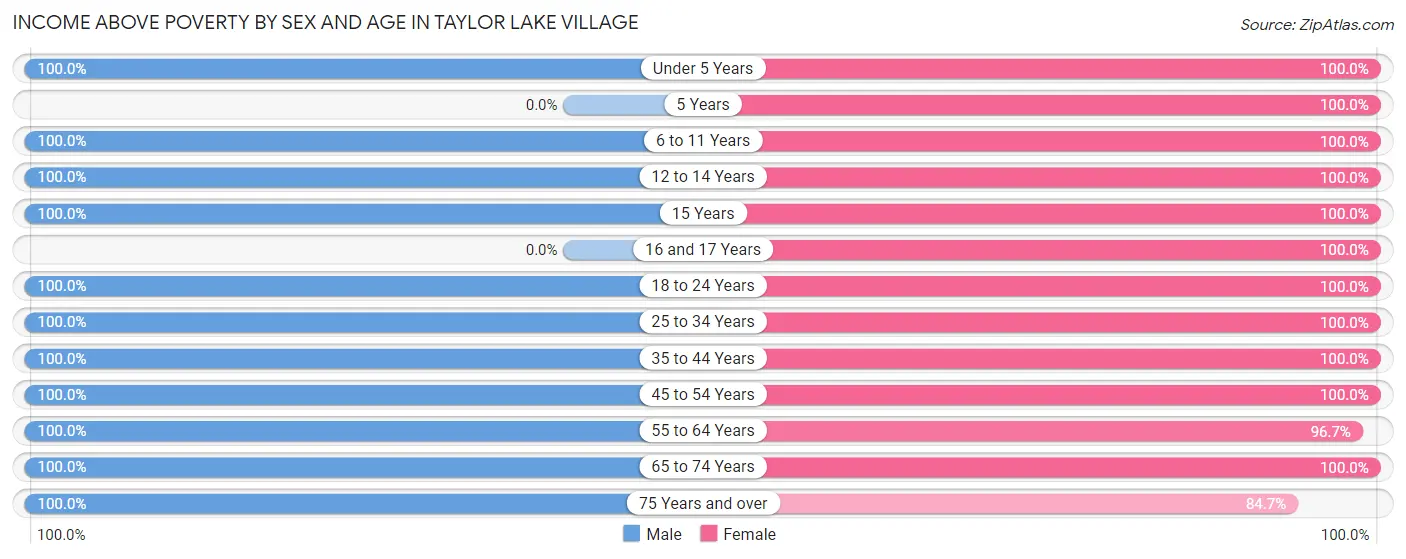
| Age Bracket | Male | Female |
| Under 5 Years | 113 (100.0%) | 17 (100.0%) |
| 5 Years | 0 (0.0%) | 18 (100.0%) |
| 6 to 11 Years | 146 (100.0%) | 101 (100.0%) |
| 12 to 14 Years | 93 (100.0%) | 69 (100.0%) |
| 15 Years | 46 (100.0%) | 31 (100.0%) |
| 16 and 17 Years | 0 (0.0%) | 126 (100.0%) |
| 18 to 24 Years | 151 (100.0%) | 24 (100.0%) |
| 25 to 34 Years | 109 (100.0%) | 157 (100.0%) |
| 35 to 44 Years | 154 (100.0%) | 130 (100.0%) |
| 45 to 54 Years | 167 (100.0%) | 405 (100.0%) |
| 55 to 64 Years | 348 (100.0%) | 291 (96.7%) |
| 65 to 74 Years | 375 (100.0%) | 275 (100.0%) |
| 75 Years and over | 171 (100.0%) | 127 (84.7%) |
| Total | 1,873 (100.0%) | 1,771 (98.2%) |
Income Below Poverty Among Married-Couple Families in Taylor Lake Village
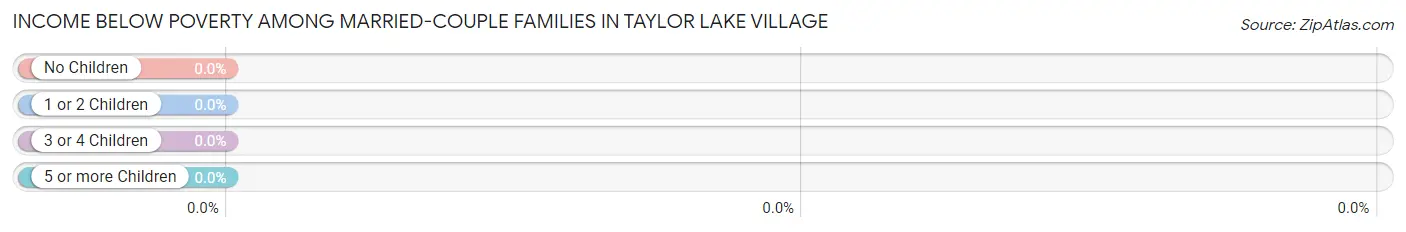
| Children | Above Poverty | Below Poverty |
| No Children | 685 (100.0%) | 0 (0.0%) |
| 1 or 2 Children | 367 (100.0%) | 0 (0.0%) |
| 3 or 4 Children | 15 (100.0%) | 0 (0.0%) |
| 5 or more Children | 0 (0.0%) | 0 (0.0%) |
| Total | 1,067 (100.0%) | 0 (0.0%) |
Income Below Poverty Among Single-Parent Households in Taylor Lake Village
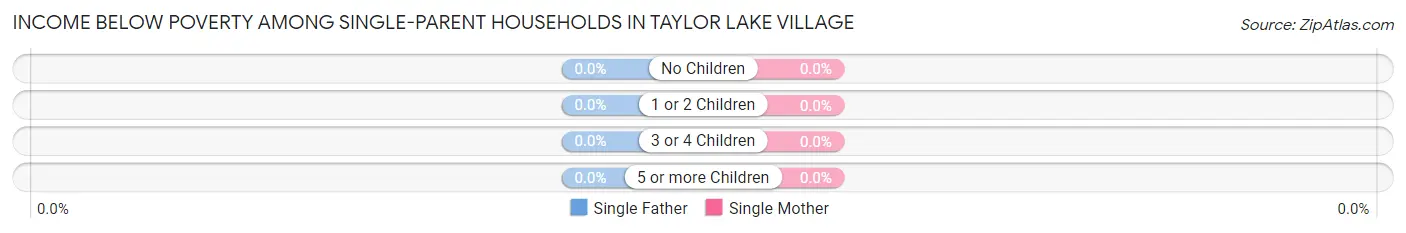
| Children | Single Father | Single Mother |
| No Children | 0 (0.0%) | 0 (0.0%) |
| 1 or 2 Children | 0 (0.0%) | 0 (0.0%) |
| 3 or 4 Children | 0 (0.0%) | 0 (0.0%) |
| 5 or more Children | 0 (0.0%) | 0 (0.0%) |
| Total | 0 (0.0%) | 0 (0.0%) |
Income Below Poverty Among Married-Couple vs Single-Parent Households in Taylor Lake Village
| Children | Married-Couple Families | Single-Parent Households |
| No Children | 0 (0.0%) | 0 (0.0%) |
| 1 or 2 Children | 0 (0.0%) | 0 (0.0%) |
| 3 or 4 Children | 0 (0.0%) | 0 (0.0%) |
| 5 or more Children | 0 (0.0%) | 0 (0.0%) |
| Total | 0 (0.0%) | 0 (0.0%) |
Employment Characteristics in Taylor Lake Village
Employment by Class of Employer in Taylor Lake Village
Among the 1,705 employed individuals in Taylor Lake Village, private company employees (1,130 | 66.3%), not-for-profit organizations (141 | 8.3%), and state government employees (118 | 6.9%) make up the most common classes of employment.
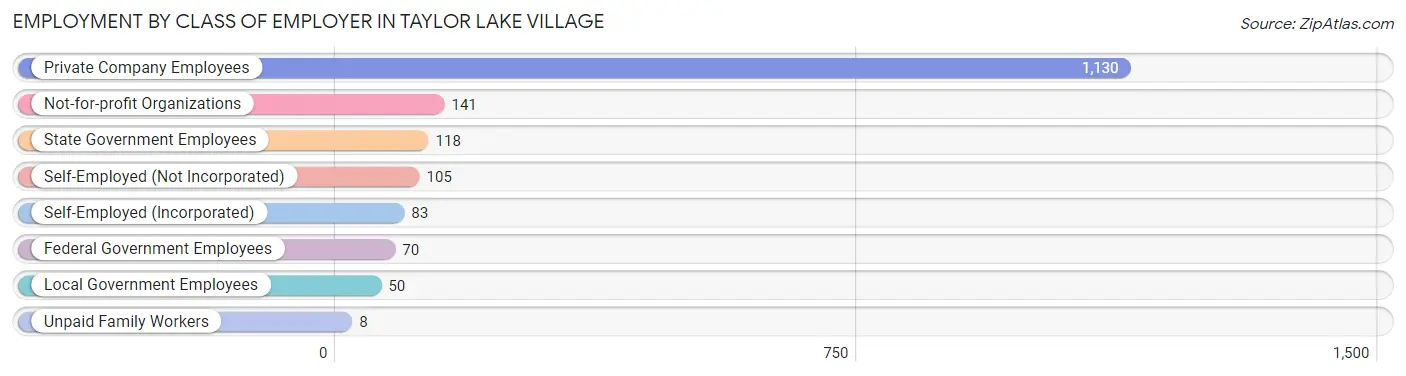
| Employer Class | # Employees | % Employees |
| Private Company Employees | 1,130 | 66.3% |
| Self-Employed (Incorporated) | 83 | 4.9% |
| Self-Employed (Not Incorporated) | 105 | 6.2% |
| Not-for-profit Organizations | 141 | 8.3% |
| Local Government Employees | 50 | 2.9% |
| State Government Employees | 118 | 6.9% |
| Federal Government Employees | 70 | 4.1% |
| Unpaid Family Workers | 8 | 0.5% |
| Total | 1,705 | 100.0% |
Employment Status by Age in Taylor Lake Village
According to the labor force statistics for Taylor Lake Village, out of the total population over 16 years of age (3,043), 57.7% or 1,756 individuals are in the labor force, with 2.8% or 49 of them unemployed. The age group with the highest labor force participation rate is 25 to 29 years, with 100.0% or 159 individuals in the labor force. Within the labor force, the 25 to 29 years age range has the highest percentage of unemployed individuals, with 25.2% or 40 of them being unemployed.
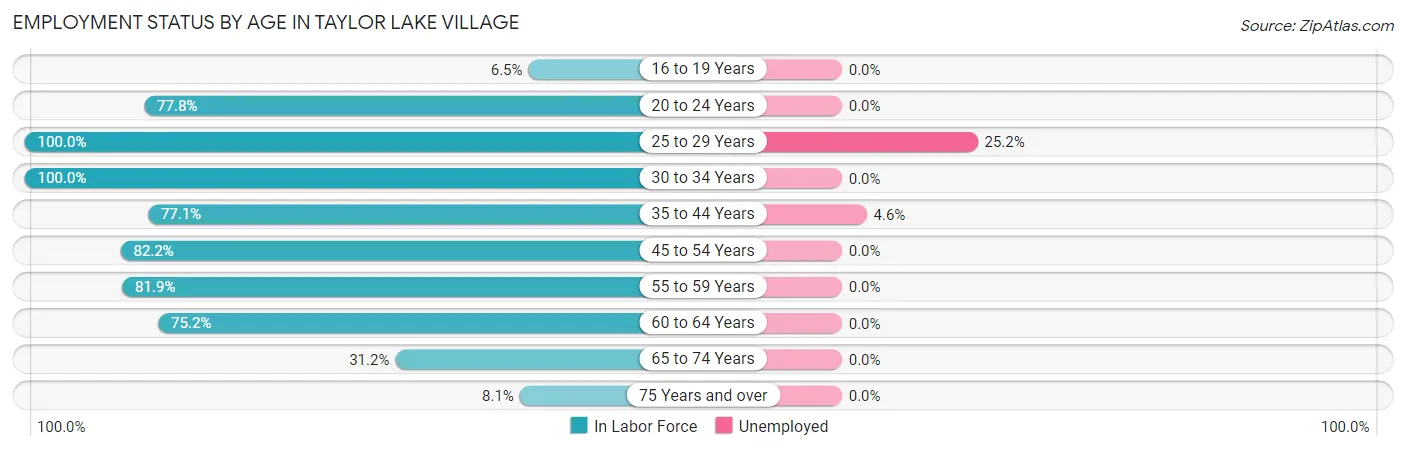
| Age Bracket | In Labor Force | Unemployed |
| 16 to 19 Years | 16 (6.5%) | 0 (0.0%) |
| 20 to 24 Years | 42 (77.8%) | 0 (0.0%) |
| 25 to 29 Years | 159 (100.0%) | 40 (25.2%) |
| 30 to 34 Years | 107 (100.0%) | 0 (0.0%) |
| 35 to 44 Years | 219 (77.1%) | 10 (4.6%) |
| 45 to 54 Years | 470 (82.2%) | 0 (0.0%) |
| 55 to 59 Years | 304 (81.9%) | 0 (0.0%) |
| 60 to 64 Years | 209 (75.2%) | 0 (0.0%) |
| 65 to 74 Years | 203 (31.2%) | 0 (0.0%) |
| 75 Years and over | 26 (8.1%) | 0 (0.0%) |
| Total | 1,756 (57.7%) | 49 (2.8%) |
Employment Status by Educational Attainment in Taylor Lake Village
According to labor force statistics for Taylor Lake Village, 82.9% of individuals (1,468) out of the total population between 25 and 64 years of age (1,771) are in the labor force, with 3.4% or 50 of them being unemployed. The group with the highest labor force participation rate are those with the educational attainment of less than high school, with 100.0% or 37 individuals in the labor force. Within the labor force, individuals with high school diploma education have the highest percentage of unemployment, with 30.2% or 29 of them being unemployed.
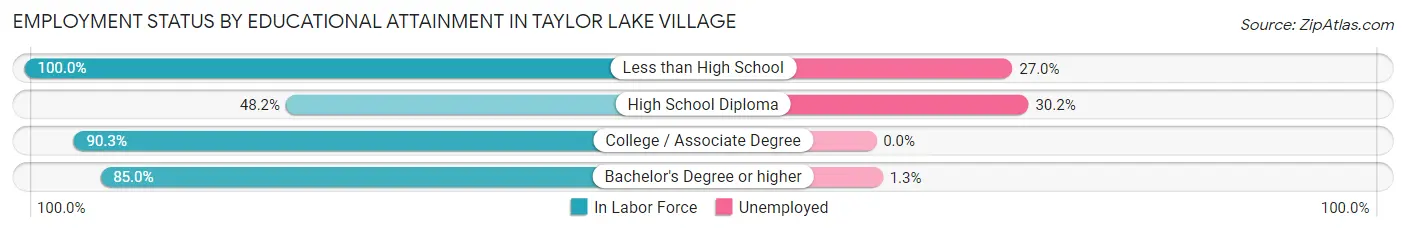
| Educational Attainment | In Labor Force | Unemployed |
| Less than High School | 37 (100.0%) | 10 (27.0%) |
| High School Diploma | 96 (48.2%) | 60 (30.2%) |
| College / Associate Degree | 512 (90.3%) | 0 (0.0%) |
| Bachelor's Degree or higher | 823 (85.0%) | 13 (1.3%) |
| Total | 1,468 (82.9%) | 60 (3.4%) |
Employment Occupations by Sex in Taylor Lake Village
Management, Business, Science and Arts Occupations
The most common Management, Business, Science and Arts occupations in Taylor Lake Village are Computers, Engineering & Science (353 | 20.7%), Community & Social Service (350 | 20.5%), Education Instruction & Library (261 | 15.3%), Architecture & Engineering (243 | 14.2%), and Management (216 | 12.7%).
Management, Business, Science and Arts Occupations by Sex
Within the Management, Business, Science and Arts occupations in Taylor Lake Village, the most male-oriented occupations are Education, Arts & Media (100.0%), Architecture & Engineering (93.4%), and Computers, Engineering & Science (86.7%), while the most female-oriented occupations are Arts, Media & Entertainment (100.0%), Health Technologists (100.0%), and Education Instruction & Library (68.2%).
| Occupation | Male | Female |
| Management | 150 (69.4%) | 66 (30.6%) |
| Business & Financial | 74 (36.6%) | 128 (63.4%) |
| Computers, Engineering & Science | 306 (86.7%) | 47 (13.3%) |
| Computers & Mathematics | 8 (47.1%) | 9 (52.9%) |
| Architecture & Engineering | 227 (93.4%) | 16 (6.6%) |
| Life, Physical & Social Science | 71 (76.3%) | 22 (23.7%) |
| Community & Social Service | 118 (33.7%) | 232 (66.3%) |
| Education, Arts & Media | 35 (100.0%) | 0 (0.0%) |
| Legal Services & Support | 0 (0.0%) | 0 (0.0%) |
| Education Instruction & Library | 83 (31.8%) | 178 (68.2%) |
| Arts, Media & Entertainment | 0 (0.0%) | 54 (100.0%) |
| Health Diagnosing & Treating | 39 (39.8%) | 59 (60.2%) |
| Health Technologists | 0 (0.0%) | 41 (100.0%) |
| Total (Category) | 687 (56.4%) | 532 (43.6%) |
| Total (Overall) | 916 (53.7%) | 789 (46.3%) |
Services Occupations
The most common Services occupations in Taylor Lake Village are Food Preparation & Serving (34 | 2.0%), and Personal Care & Service (19 | 1.1%).
Services Occupations by Sex
| Occupation | Male | Female |
| Healthcare Support | 0 (0.0%) | 0 (0.0%) |
| Security & Protection | 0 (0.0%) | 0 (0.0%) |
| Firefighting & Prevention | 0 (0.0%) | 0 (0.0%) |
| Law Enforcement | 0 (0.0%) | 0 (0.0%) |
| Food Preparation & Serving | 34 (100.0%) | 0 (0.0%) |
| Cleaning & Maintenance | 0 (0.0%) | 0 (0.0%) |
| Personal Care & Service | 11 (57.9%) | 8 (42.1%) |
| Total (Category) | 45 (84.9%) | 8 (15.1%) |
| Total (Overall) | 916 (53.7%) | 789 (46.3%) |
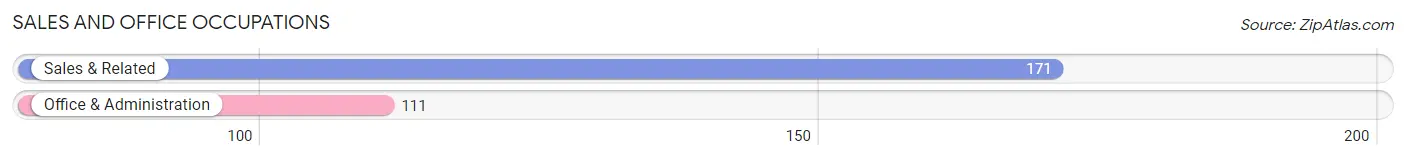
Sales and Office Occupations
The most common Sales and Office occupations in Taylor Lake Village are Sales & Related (171 | 10.0%), and Office & Administration (111 | 6.5%).
Sales and Office Occupations by Sex
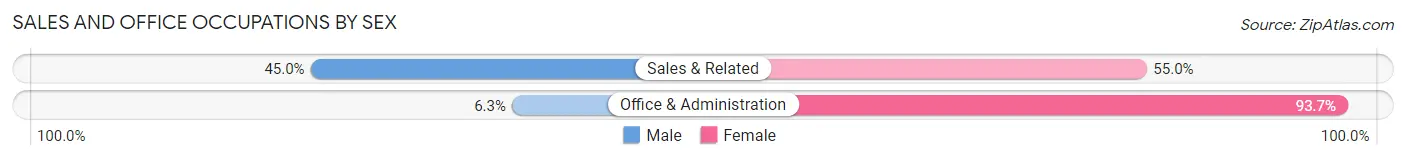
| Occupation | Male | Female |
| Sales & Related | 77 (45.0%) | 94 (55.0%) |
| Office & Administration | 7 (6.3%) | 104 (93.7%) |
| Total (Category) | 84 (29.8%) | 198 (70.2%) |
| Total (Overall) | 916 (53.7%) | 789 (46.3%) |
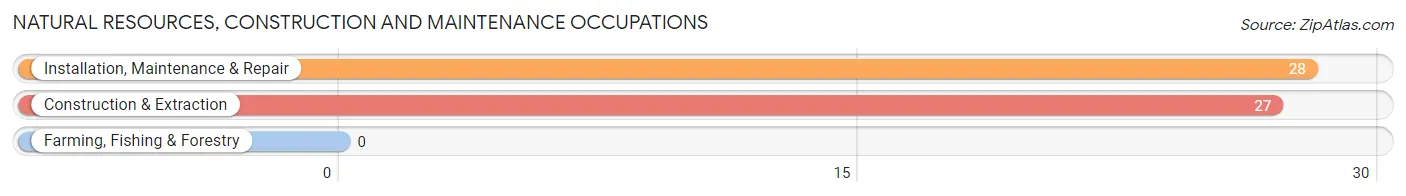
Natural Resources, Construction and Maintenance Occupations
The most common Natural Resources, Construction and Maintenance occupations in Taylor Lake Village are Installation, Maintenance & Repair (28 | 1.6%), and Construction & Extraction (27 | 1.6%).
Natural Resources, Construction and Maintenance Occupations by Sex
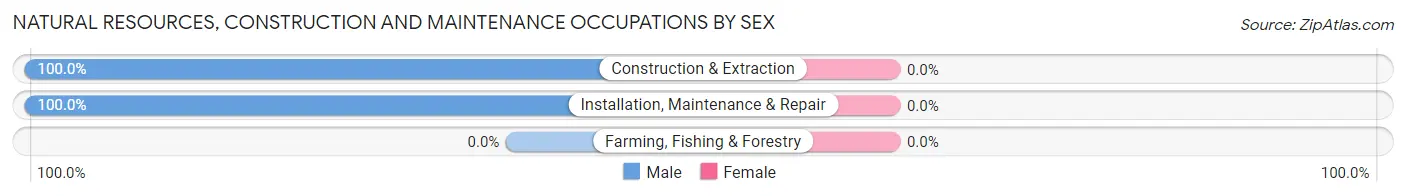
| Occupation | Male | Female |
| Farming, Fishing & Forestry | 0 (0.0%) | 0 (0.0%) |
| Construction & Extraction | 27 (100.0%) | 0 (0.0%) |
| Installation, Maintenance & Repair | 28 (100.0%) | 0 (0.0%) |
| Total (Category) | 55 (100.0%) | 0 (0.0%) |
| Total (Overall) | 916 (53.7%) | 789 (46.3%) |
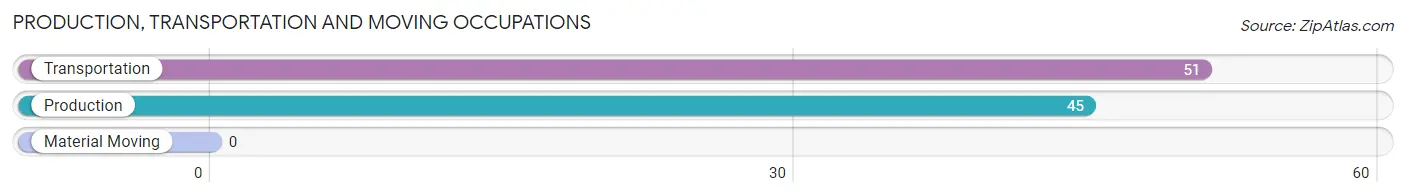
Production, Transportation and Moving Occupations
The most common Production, Transportation and Moving occupations in Taylor Lake Village are Transportation (51 | 3.0%), and Production (45 | 2.6%).
Production, Transportation and Moving Occupations by Sex
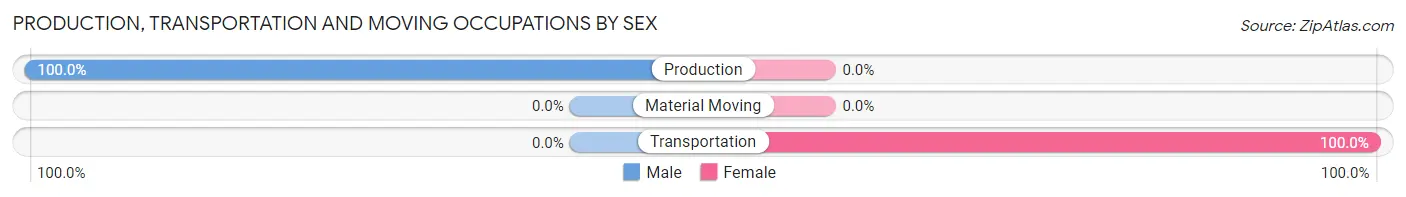
| Occupation | Male | Female |
| Production | 45 (100.0%) | 0 (0.0%) |
| Transportation | 0 (0.0%) | 51 (100.0%) |
| Material Moving | 0 (0.0%) | 0 (0.0%) |
| Total (Category) | 45 (46.9%) | 51 (53.1%) |
| Total (Overall) | 916 (53.7%) | 789 (46.3%) |
Employment Industries by Sex in Taylor Lake Village
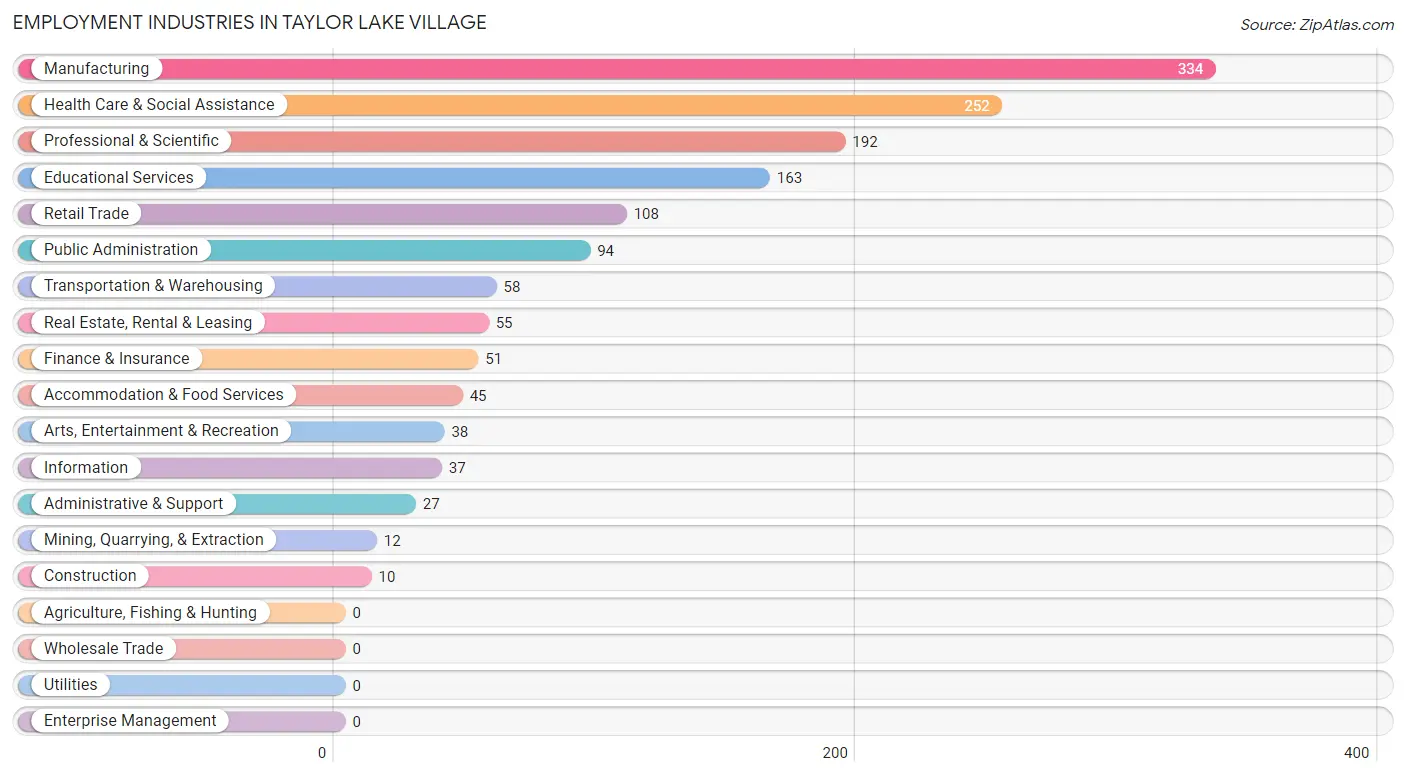
Employment Industries in Taylor Lake Village
The major employment industries in Taylor Lake Village include Manufacturing (334 | 19.6%), Health Care & Social Assistance (252 | 14.8%), Professional & Scientific (192 | 11.3%), Educational Services (163 | 9.6%), and Retail Trade (108 | 6.3%).
Employment Industries by Sex in Taylor Lake Village
The Taylor Lake Village industries that see more men than women are Mining, Quarrying, & Extraction (100.0%), Construction (100.0%), and Transportation & Warehousing (100.0%), whereas the industries that tend to have a higher number of women are Administrative & Support (100.0%), Health Care & Social Assistance (84.5%), and Retail Trade (75.9%).
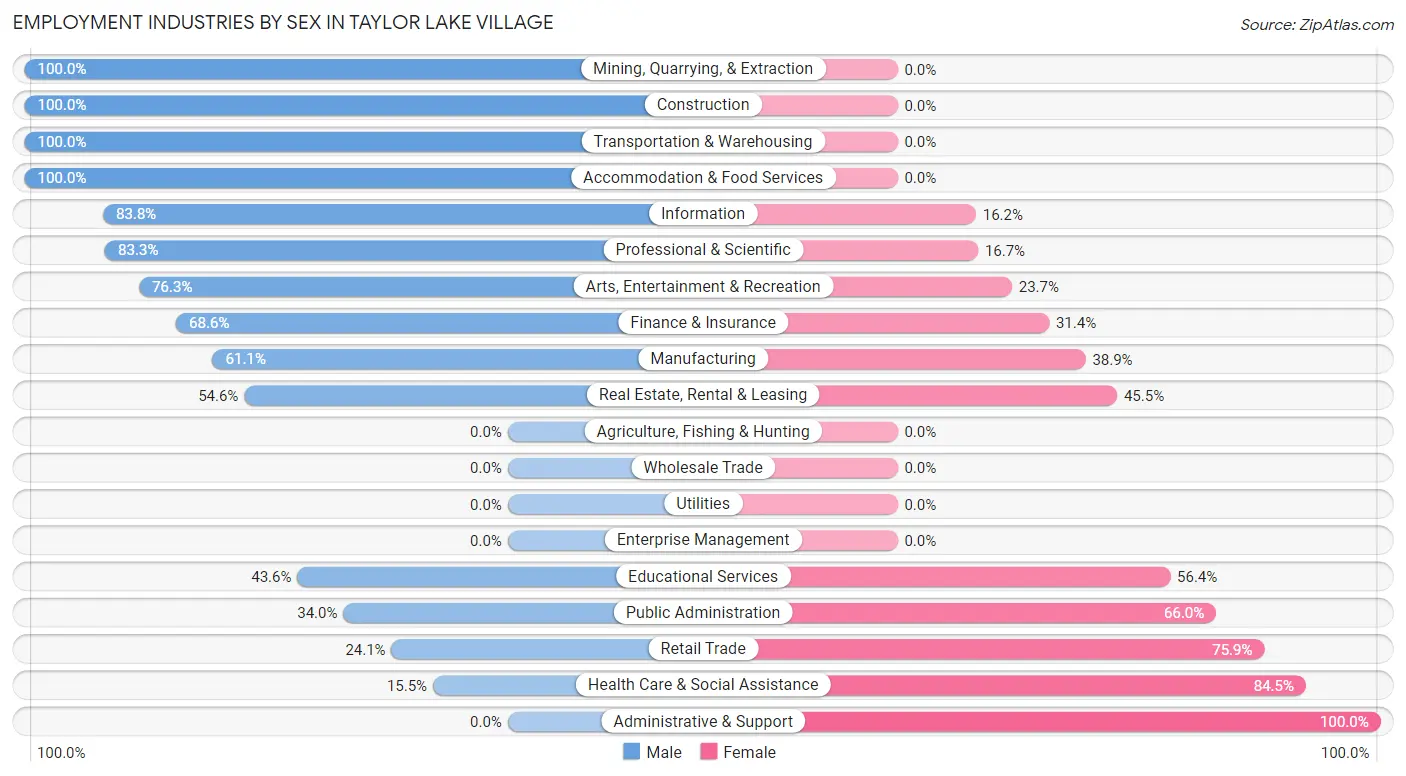
| Industry | Male | Female |
| Agriculture, Fishing & Hunting | 0 (0.0%) | 0 (0.0%) |
| Mining, Quarrying, & Extraction | 12 (100.0%) | 0 (0.0%) |
| Construction | 10 (100.0%) | 0 (0.0%) |
| Manufacturing | 204 (61.1%) | 130 (38.9%) |
| Wholesale Trade | 0 (0.0%) | 0 (0.0%) |
| Retail Trade | 26 (24.1%) | 82 (75.9%) |
| Transportation & Warehousing | 58 (100.0%) | 0 (0.0%) |
| Utilities | 0 (0.0%) | 0 (0.0%) |
| Information | 31 (83.8%) | 6 (16.2%) |
| Finance & Insurance | 35 (68.6%) | 16 (31.4%) |
| Real Estate, Rental & Leasing | 30 (54.5%) | 25 (45.5%) |
| Professional & Scientific | 160 (83.3%) | 32 (16.7%) |
| Enterprise Management | 0 (0.0%) | 0 (0.0%) |
| Administrative & Support | 0 (0.0%) | 27 (100.0%) |
| Educational Services | 71 (43.6%) | 92 (56.4%) |
| Health Care & Social Assistance | 39 (15.5%) | 213 (84.5%) |
| Arts, Entertainment & Recreation | 29 (76.3%) | 9 (23.7%) |
| Accommodation & Food Services | 45 (100.0%) | 0 (0.0%) |
| Public Administration | 32 (34.0%) | 62 (66.0%) |
| Total | 916 (53.7%) | 789 (46.3%) |
Education in Taylor Lake Village
School Enrollment in Taylor Lake Village
The most common levels of schooling among the 1,011 students in Taylor Lake Village are high school (235 | 23.2%), college / undergraduate (226 | 22.4%), and middle school (199 | 19.7%).
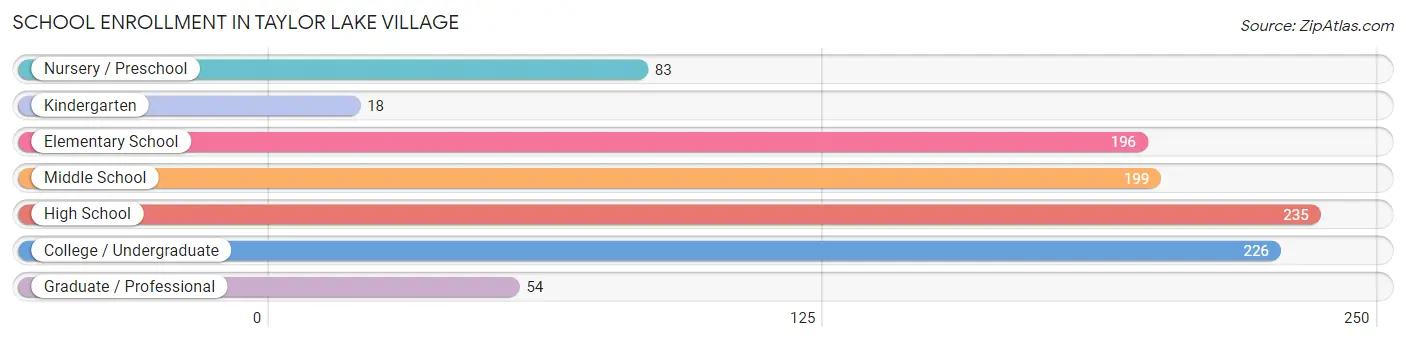
| School Level | # Students | % Students |
| Nursery / Preschool | 83 | 8.2% |
| Kindergarten | 18 | 1.8% |
| Elementary School | 196 | 19.4% |
| Middle School | 199 | 19.7% |
| High School | 235 | 23.2% |
| College / Undergraduate | 226 | 22.4% |
| Graduate / Professional | 54 | 5.3% |
| Total | 1,011 | 100.0% |
School Enrollment by Age by Funding Source in Taylor Lake Village
Out of a total of 1,011 students who are enrolled in schools in Taylor Lake Village, 190 (18.8%) attend a private institution, while the remaining 821 (81.2%) are enrolled in public schools. The age group of 25 to 34 year olds has the highest likelihood of being enrolled in private schools, with 54 (100.0% in the age bracket) enrolled. Conversely, the age group of 5 to 9 year old has the lowest likelihood of being enrolled in a private school, with 154 (100.0% in the age bracket) attending a public institution.
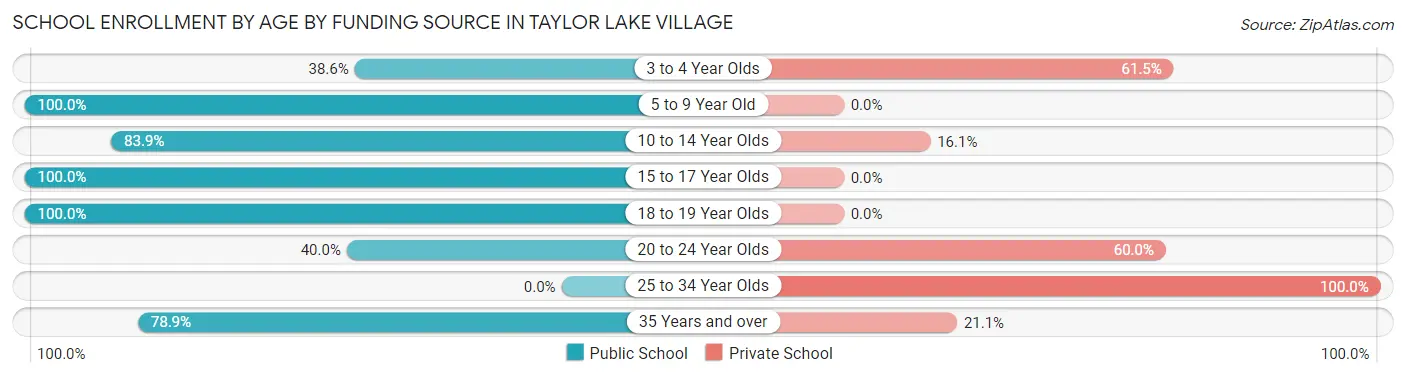
| Age Bracket | Public School | Private School |
| 3 to 4 Year Olds | 32 (38.6%) | 51 (61.5%) |
| 5 to 9 Year Old | 154 (100.0%) | 0 (0.0%) |
| 10 to 14 Year Olds | 229 (83.9%) | 44 (16.1%) |
| 15 to 17 Year Olds | 203 (100.0%) | 0 (0.0%) |
| 18 to 19 Year Olds | 105 (100.0%) | 0 (0.0%) |
| 20 to 24 Year Olds | 12 (40.0%) | 18 (60.0%) |
| 25 to 34 Year Olds | 0 (0.0%) | 54 (100.0%) |
| 35 Years and over | 86 (78.9%) | 23 (21.1%) |
| Total | 821 (81.2%) | 190 (18.8%) |
Educational Attainment by Field of Study in Taylor Lake Village
Engineering (311 | 17.0%), business (268 | 14.6%), psychology (214 | 11.7%), education (179 | 9.8%), and physical & health sciences (130 | 7.1%) are the most common fields of study among 1,832 individuals in Taylor Lake Village who have obtained a bachelor's degree or higher.
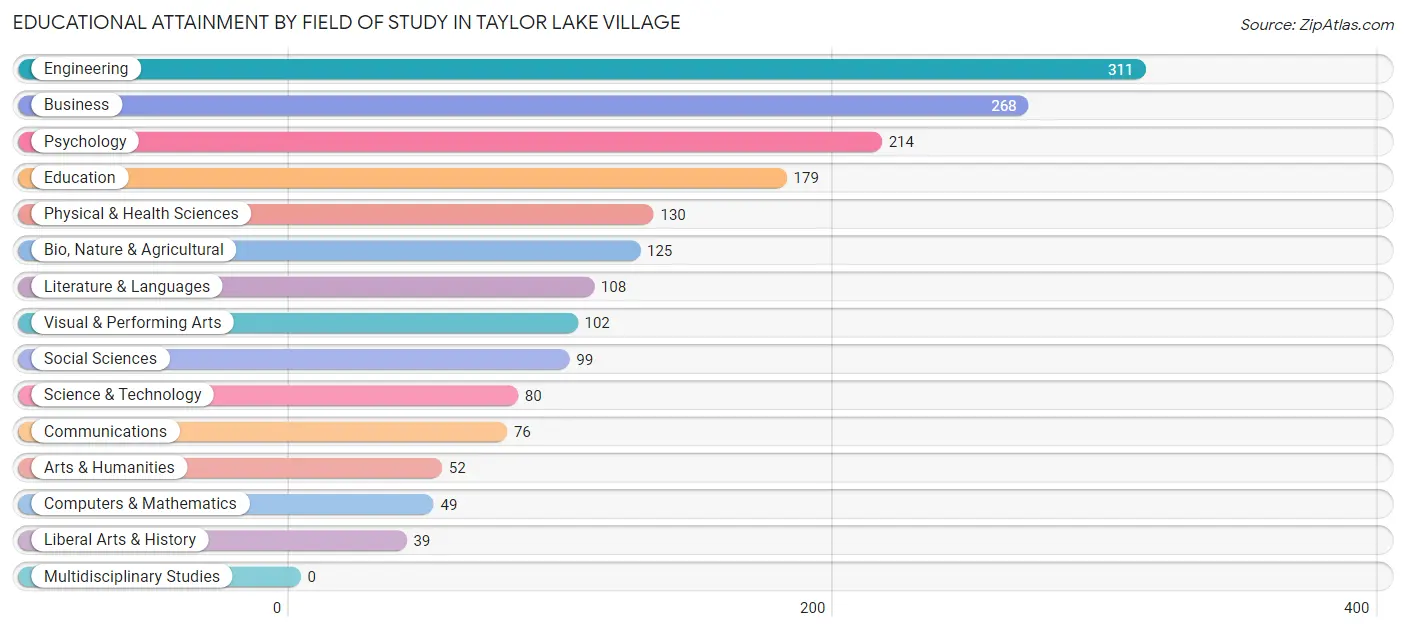
| Field of Study | # Graduates | % Graduates |
| Computers & Mathematics | 49 | 2.7% |
| Bio, Nature & Agricultural | 125 | 6.8% |
| Physical & Health Sciences | 130 | 7.1% |
| Psychology | 214 | 11.7% |
| Social Sciences | 99 | 5.4% |
| Engineering | 311 | 17.0% |
| Multidisciplinary Studies | 0 | 0.0% |
| Science & Technology | 80 | 4.4% |
| Business | 268 | 14.6% |
| Education | 179 | 9.8% |
| Literature & Languages | 108 | 5.9% |
| Liberal Arts & History | 39 | 2.1% |
| Visual & Performing Arts | 102 | 5.6% |
| Communications | 76 | 4.2% |
| Arts & Humanities | 52 | 2.8% |
| Total | 1,832 | 100.0% |
Transportation & Commute in Taylor Lake Village
Vehicle Availability by Sex in Taylor Lake Village
The most prevalent vehicle ownership categories in Taylor Lake Village are males with 2 vehicles (485, accounting for 52.9%) and females with 2 vehicles (449, making up 61.5%).
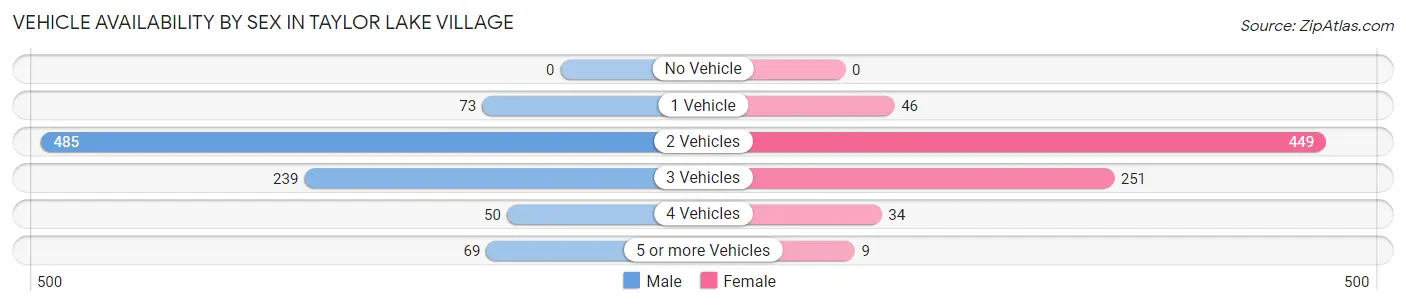
| Vehicles Available | Male | Female |
| No Vehicle | 0 (0.0%) | 0 (0.0%) |
| 1 Vehicle | 73 (8.0%) | 46 (5.8%) |
| 2 Vehicles | 485 (52.9%) | 449 (56.9%) |
| 3 Vehicles | 239 (26.1%) | 251 (31.8%) |
| 4 Vehicles | 50 (5.5%) | 34 (4.3%) |
| 5 or more Vehicles | 69 (7.5%) | 9 (1.1%) |
| Total | 916 (100.0%) | 789 (100.0%) |
Commute Time in Taylor Lake Village
The most frequently occuring commute durations in Taylor Lake Village are 30 to 34 minutes (322 commuters, 23.9%), 15 to 19 minutes (172 commuters, 12.8%), and 5 to 9 minutes (151 commuters, 11.2%).
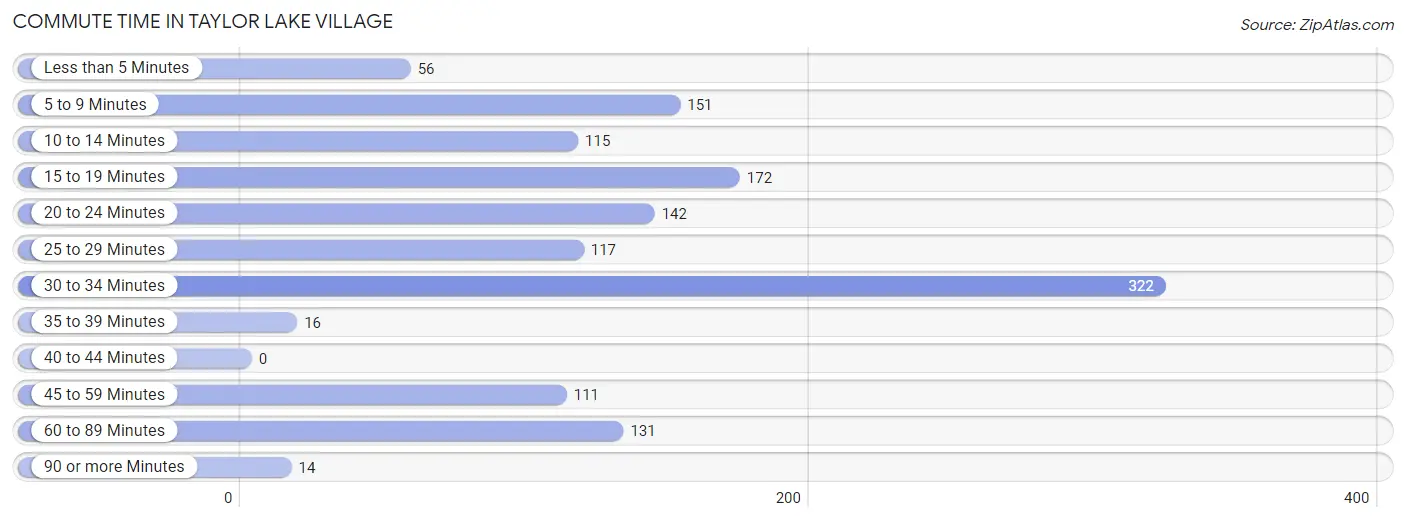
| Commute Time | # Commuters | % Commuters |
| Less than 5 Minutes | 56 | 4.2% |
| 5 to 9 Minutes | 151 | 11.2% |
| 10 to 14 Minutes | 115 | 8.5% |
| 15 to 19 Minutes | 172 | 12.8% |
| 20 to 24 Minutes | 142 | 10.5% |
| 25 to 29 Minutes | 117 | 8.7% |
| 30 to 34 Minutes | 322 | 23.9% |
| 35 to 39 Minutes | 16 | 1.2% |
| 40 to 44 Minutes | 0 | 0.0% |
| 45 to 59 Minutes | 111 | 8.2% |
| 60 to 89 Minutes | 131 | 9.7% |
| 90 or more Minutes | 14 | 1.0% |
Commute Time by Sex in Taylor Lake Village
The most common commute times in Taylor Lake Village are 30 to 34 minutes (239 commuters, 32.7%) for males and 5 to 9 minutes (105 commuters, 17.1%) for females.
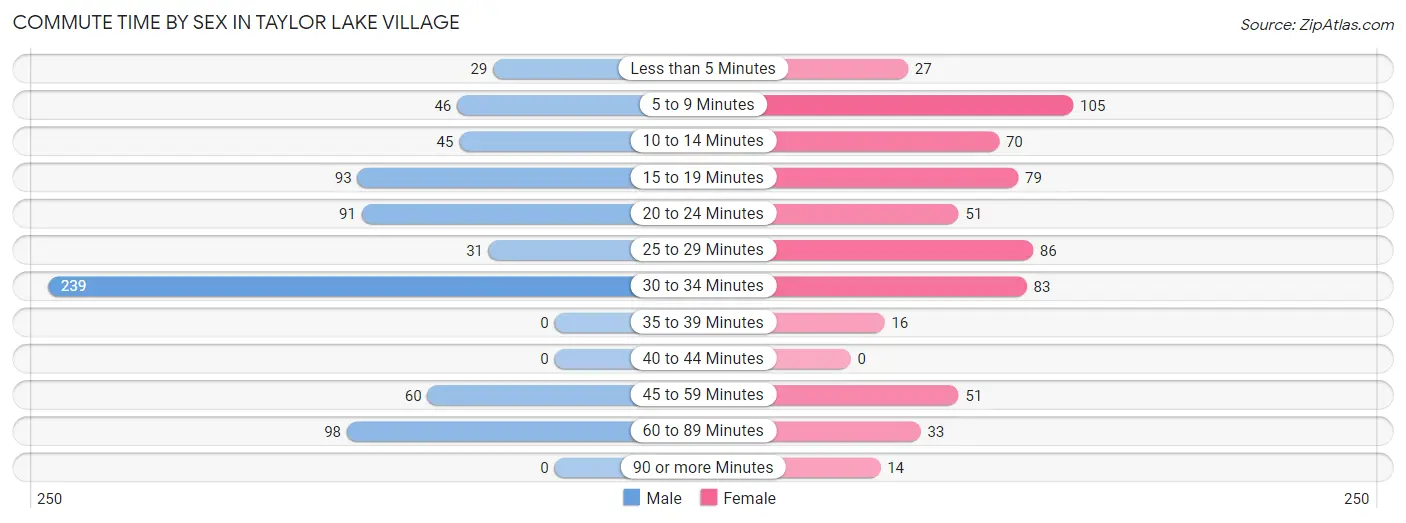
| Commute Time | Male | Female |
| Less than 5 Minutes | 29 (4.0%) | 27 (4.4%) |
| 5 to 9 Minutes | 46 (6.3%) | 105 (17.1%) |
| 10 to 14 Minutes | 45 (6.1%) | 70 (11.4%) |
| 15 to 19 Minutes | 93 (12.7%) | 79 (12.9%) |
| 20 to 24 Minutes | 91 (12.4%) | 51 (8.3%) |
| 25 to 29 Minutes | 31 (4.2%) | 86 (14.0%) |
| 30 to 34 Minutes | 239 (32.7%) | 83 (13.5%) |
| 35 to 39 Minutes | 0 (0.0%) | 16 (2.6%) |
| 40 to 44 Minutes | 0 (0.0%) | 0 (0.0%) |
| 45 to 59 Minutes | 60 (8.2%) | 51 (8.3%) |
| 60 to 89 Minutes | 98 (13.4%) | 33 (5.4%) |
| 90 or more Minutes | 0 (0.0%) | 14 (2.3%) |
Time of Departure to Work by Sex in Taylor Lake Village
The most frequent times of departure to work in Taylor Lake Village are 7:00 AM to 7:29 AM (115, 15.7%) for males and 7:30 AM to 7:59 AM (185, 30.1%) for females.
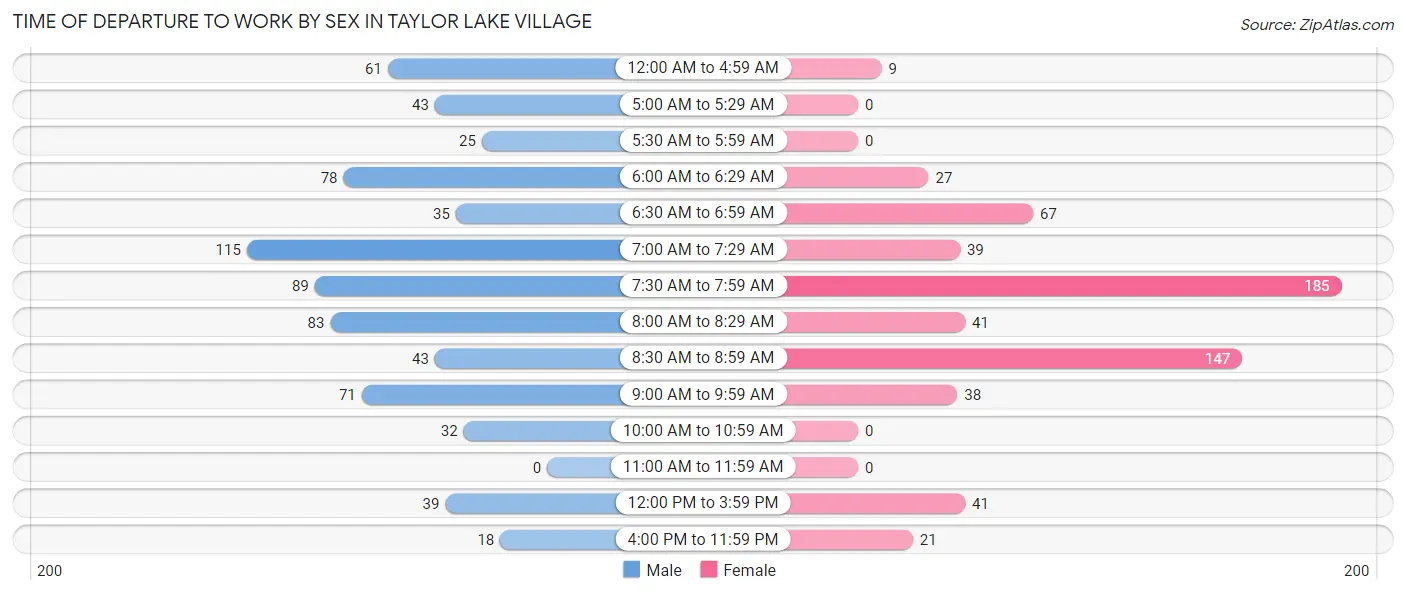
| Time of Departure | Male | Female |
| 12:00 AM to 4:59 AM | 61 (8.3%) | 9 (1.5%) |
| 5:00 AM to 5:29 AM | 43 (5.9%) | 0 (0.0%) |
| 5:30 AM to 5:59 AM | 25 (3.4%) | 0 (0.0%) |
| 6:00 AM to 6:29 AM | 78 (10.7%) | 27 (4.4%) |
| 6:30 AM to 6:59 AM | 35 (4.8%) | 67 (10.9%) |
| 7:00 AM to 7:29 AM | 115 (15.7%) | 39 (6.3%) |
| 7:30 AM to 7:59 AM | 89 (12.2%) | 185 (30.1%) |
| 8:00 AM to 8:29 AM | 83 (11.3%) | 41 (6.7%) |
| 8:30 AM to 8:59 AM | 43 (5.9%) | 147 (23.9%) |
| 9:00 AM to 9:59 AM | 71 (9.7%) | 38 (6.2%) |
| 10:00 AM to 10:59 AM | 32 (4.4%) | 0 (0.0%) |
| 11:00 AM to 11:59 AM | 0 (0.0%) | 0 (0.0%) |
| 12:00 PM to 3:59 PM | 39 (5.3%) | 41 (6.7%) |
| 4:00 PM to 11:59 PM | 18 (2.5%) | 21 (3.4%) |
| Total | 732 (100.0%) | 615 (100.0%) |
Housing Occupancy in Taylor Lake Village
Occupancy by Ownership in Taylor Lake Village
Of the total 1,410 dwellings in Taylor Lake Village, owner-occupied units account for 1,304 (92.5%), while renter-occupied units make up 106 (7.5%).
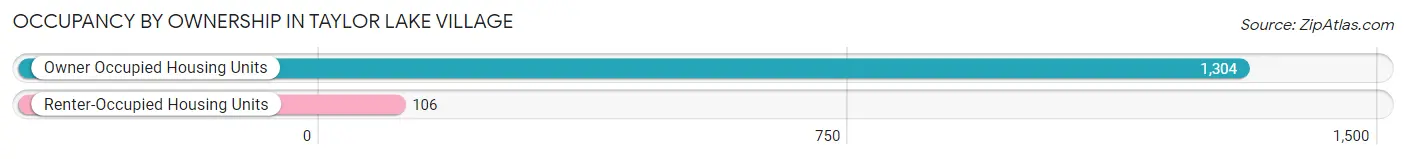
| Occupancy | # Housing Units | % Housing Units |
| Owner Occupied Housing Units | 1,304 | 92.5% |
| Renter-Occupied Housing Units | 106 | 7.5% |
| Total Occupied Housing Units | 1,410 | 100.0% |
Occupancy by Household Size in Taylor Lake Village
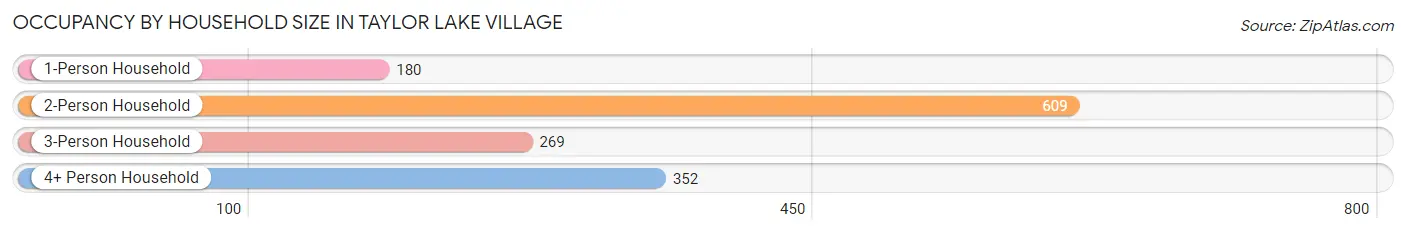
| Household Size | # Housing Units | % Housing Units |
| 1-Person Household | 180 | 12.8% |
| 2-Person Household | 609 | 43.2% |
| 3-Person Household | 269 | 19.1% |
| 4+ Person Household | 352 | 25.0% |
| Total Housing Units | 1,410 | 100.0% |
Occupancy by Ownership by Household Size in Taylor Lake Village
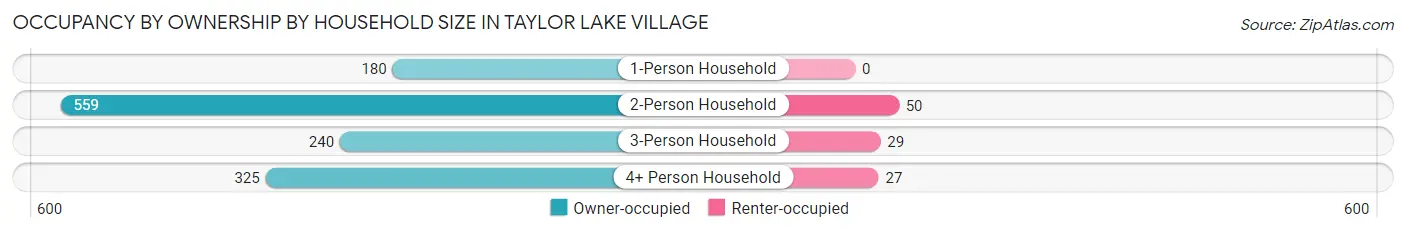
| Household Size | Owner-occupied | Renter-occupied |
| 1-Person Household | 180 (100.0%) | 0 (0.0%) |
| 2-Person Household | 559 (91.8%) | 50 (8.2%) |
| 3-Person Household | 240 (89.2%) | 29 (10.8%) |
| 4+ Person Household | 325 (92.3%) | 27 (7.7%) |
| Total Housing Units | 1,304 (92.5%) | 106 (7.5%) |
Occupancy by Educational Attainment in Taylor Lake Village
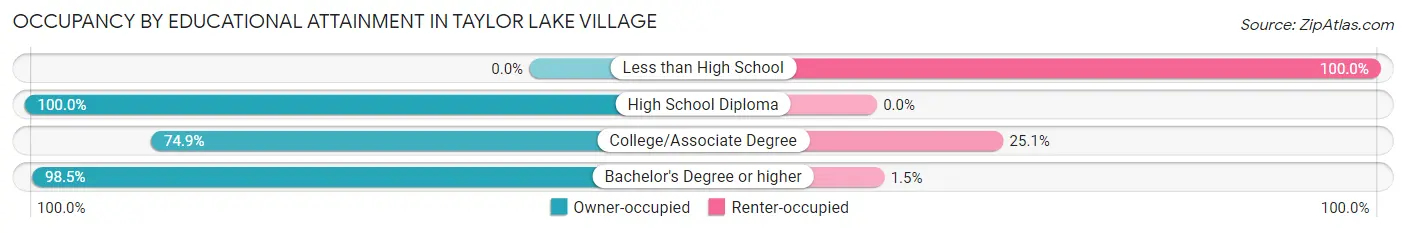
| Household Size | Owner-occupied | Renter-occupied |
| Less than High School | 0 (0.0%) | 8 (100.0%) |
| High School Diploma | 73 (100.0%) | 0 (0.0%) |
| College/Associate Degree | 248 (74.9%) | 83 (25.1%) |
| Bachelor's Degree or higher | 983 (98.5%) | 15 (1.5%) |
Occupancy by Age of Householder in Taylor Lake Village
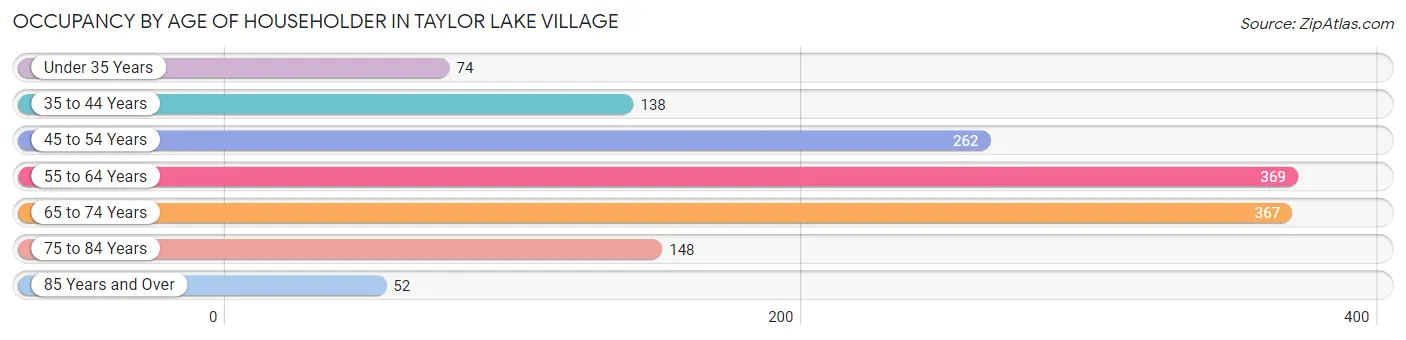
| Age Bracket | # Households | % Households |
| Under 35 Years | 74 | 5.2% |
| 35 to 44 Years | 138 | 9.8% |
| 45 to 54 Years | 262 | 18.6% |
| 55 to 64 Years | 369 | 26.2% |
| 65 to 74 Years | 367 | 26.0% |
| 75 to 84 Years | 148 | 10.5% |
| 85 Years and Over | 52 | 3.7% |
| Total | 1,410 | 100.0% |
Housing Finances in Taylor Lake Village
Median Income by Occupancy in Taylor Lake Village
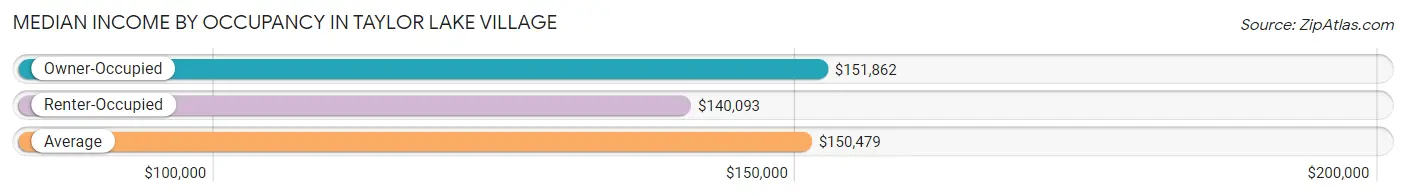
| Occupancy Type | # Households | Median Income |
| Owner-Occupied | 1,304 (92.5%) | $151,862 |
| Renter-Occupied | 106 (7.5%) | $140,093 |
| Average | 1,410 (100.0%) | $150,479 |
Occupancy by Householder Income Bracket in Taylor Lake Village
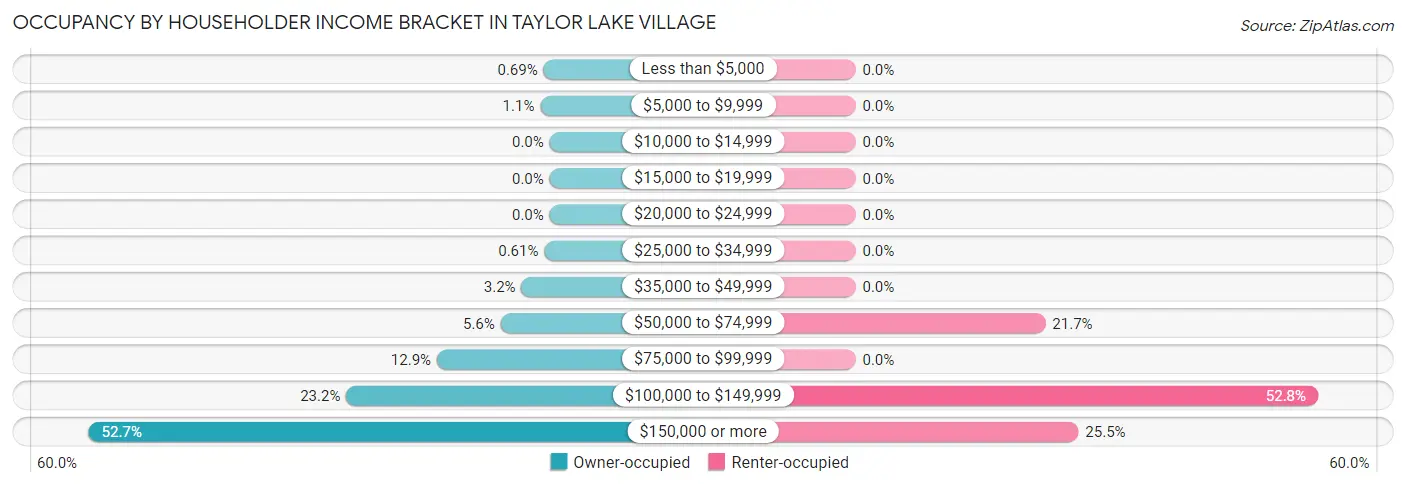
| Income Bracket | Owner-occupied | Renter-occupied |
| Less than $5,000 | 9 (0.7%) | 0 (0.0%) |
| $5,000 to $9,999 | 14 (1.1%) | 0 (0.0%) |
| $10,000 to $14,999 | 0 (0.0%) | 0 (0.0%) |
| $15,000 to $19,999 | 0 (0.0%) | 0 (0.0%) |
| $20,000 to $24,999 | 0 (0.0%) | 0 (0.0%) |
| $25,000 to $34,999 | 8 (0.6%) | 0 (0.0%) |
| $35,000 to $49,999 | 42 (3.2%) | 0 (0.0%) |
| $50,000 to $74,999 | 73 (5.6%) | 23 (21.7%) |
| $75,000 to $99,999 | 168 (12.9%) | 0 (0.0%) |
| $100,000 to $149,999 | 303 (23.2%) | 56 (52.8%) |
| $150,000 or more | 687 (52.7%) | 27 (25.5%) |
| Total | 1,304 (100.0%) | 106 (100.0%) |
Monthly Housing Cost Tiers in Taylor Lake Village
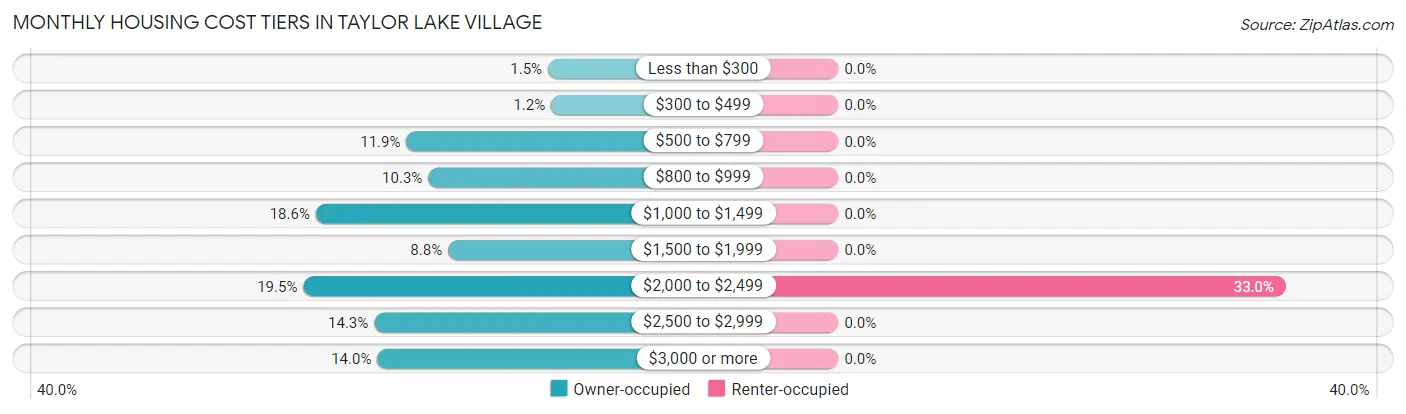
| Monthly Cost | Owner-occupied | Renter-occupied |
| Less than $300 | 19 (1.5%) | 0 (0.0%) |
| $300 to $499 | 16 (1.2%) | 0 (0.0%) |
| $500 to $799 | 155 (11.9%) | 0 (0.0%) |
| $800 to $999 | 134 (10.3%) | 0 (0.0%) |
| $1,000 to $1,499 | 242 (18.6%) | 0 (0.0%) |
| $1,500 to $1,999 | 115 (8.8%) | 0 (0.0%) |
| $2,000 to $2,499 | 254 (19.5%) | 35 (33.0%) |
| $2,500 to $2,999 | 186 (14.3%) | 0 (0.0%) |
| $3,000 or more | 183 (14.0%) | 0 (0.0%) |
| Total | 1,304 (100.0%) | 106 (100.0%) |
Physical Housing Characteristics in Taylor Lake Village
Housing Structures in Taylor Lake Village
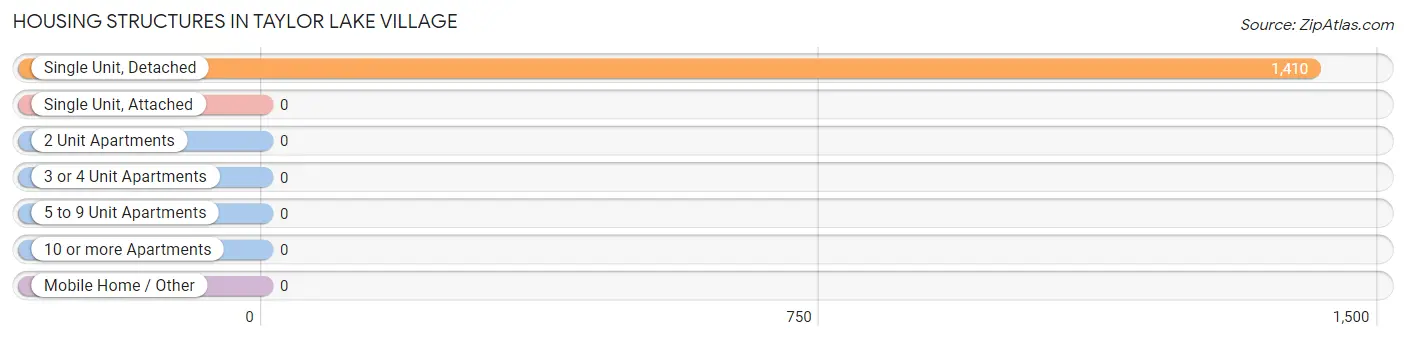
| Structure Type | # Housing Units | % Housing Units |
| Single Unit, Detached | 1,410 | 100.0% |
| Single Unit, Attached | 0 | 0.0% |
| 2 Unit Apartments | 0 | 0.0% |
| 3 or 4 Unit Apartments | 0 | 0.0% |
| 5 to 9 Unit Apartments | 0 | 0.0% |
| 10 or more Apartments | 0 | 0.0% |
| Mobile Home / Other | 0 | 0.0% |
| Total | 1,410 | 100.0% |
Housing Structures by Occupancy in Taylor Lake Village
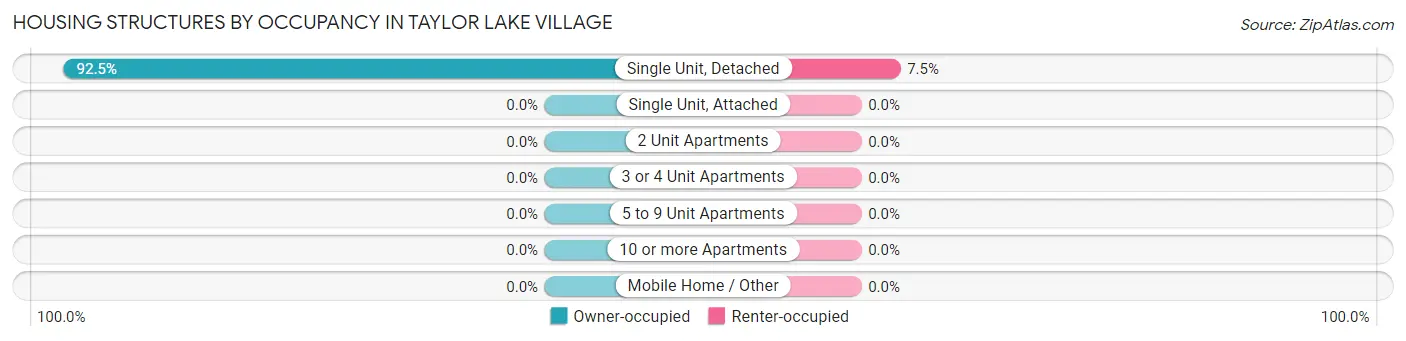
| Structure Type | Owner-occupied | Renter-occupied |
| Single Unit, Detached | 1,304 (92.5%) | 106 (7.5%) |
| Single Unit, Attached | 0 (0.0%) | 0 (0.0%) |
| 2 Unit Apartments | 0 (0.0%) | 0 (0.0%) |
| 3 or 4 Unit Apartments | 0 (0.0%) | 0 (0.0%) |
| 5 to 9 Unit Apartments | 0 (0.0%) | 0 (0.0%) |
| 10 or more Apartments | 0 (0.0%) | 0 (0.0%) |
| Mobile Home / Other | 0 (0.0%) | 0 (0.0%) |
| Total | 1,304 (92.5%) | 106 (7.5%) |
Housing Structures by Number of Rooms in Taylor Lake Village
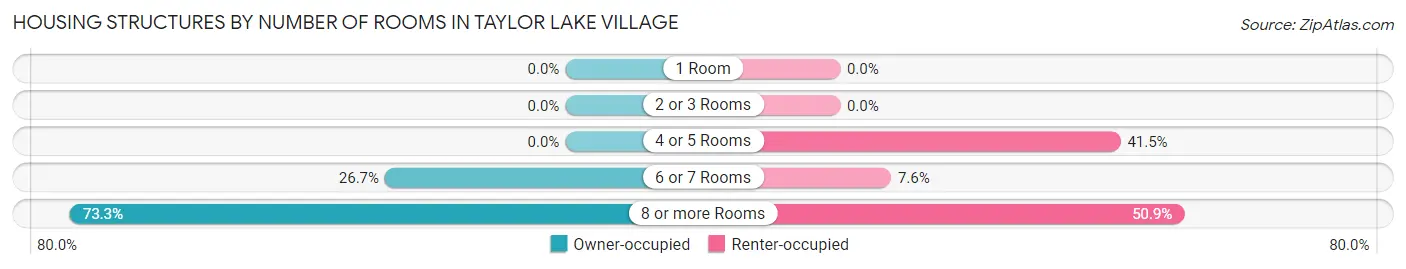
| Number of Rooms | Owner-occupied | Renter-occupied |
| 1 Room | 0 (0.0%) | 0 (0.0%) |
| 2 or 3 Rooms | 0 (0.0%) | 0 (0.0%) |
| 4 or 5 Rooms | 0 (0.0%) | 44 (41.5%) |
| 6 or 7 Rooms | 348 (26.7%) | 8 (7.5%) |
| 8 or more Rooms | 956 (73.3%) | 54 (50.9%) |
| Total | 1,304 (100.0%) | 106 (100.0%) |
Housing Structure by Heating Type in Taylor Lake Village
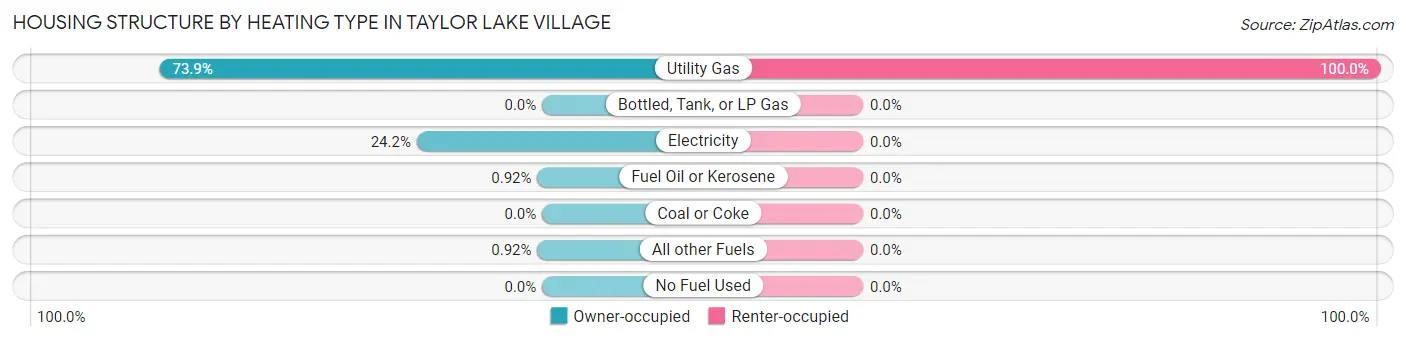
| Heating Type | Owner-occupied | Renter-occupied |
| Utility Gas | 964 (73.9%) | 106 (100.0%) |
| Bottled, Tank, or LP Gas | 0 (0.0%) | 0 (0.0%) |
| Electricity | 316 (24.2%) | 0 (0.0%) |
| Fuel Oil or Kerosene | 12 (0.9%) | 0 (0.0%) |
| Coal or Coke | 0 (0.0%) | 0 (0.0%) |
| All other Fuels | 12 (0.9%) | 0 (0.0%) |
| No Fuel Used | 0 (0.0%) | 0 (0.0%) |
| Total | 1,304 (100.0%) | 106 (100.0%) |
Household Vehicle Usage in Taylor Lake Village
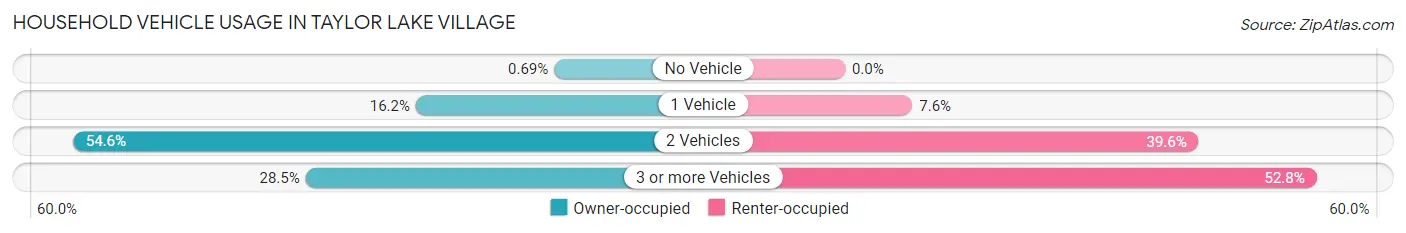
| Vehicles per Household | Owner-occupied | Renter-occupied |
| No Vehicle | 9 (0.7%) | 0 (0.0%) |
| 1 Vehicle | 211 (16.2%) | 8 (7.5%) |
| 2 Vehicles | 712 (54.6%) | 42 (39.6%) |
| 3 or more Vehicles | 372 (28.5%) | 56 (52.8%) |
| Total | 1,304 (100.0%) | 106 (100.0%) |
Real Estate & Mortgages in Taylor Lake Village
Real Estate and Mortgage Overview in Taylor Lake Village
| Characteristic | Without Mortgage | With Mortgage |
| Housing Units | 594 | 710 |
| Median Property Value | $348,800 | $337,100 |
| Median Household Income | $128,750 | $472 |
| Monthly Housing Costs | $1,024 | $163 |
| Real Estate Taxes | $5,625 | $0 |
Property Value by Mortgage Status in Taylor Lake Village
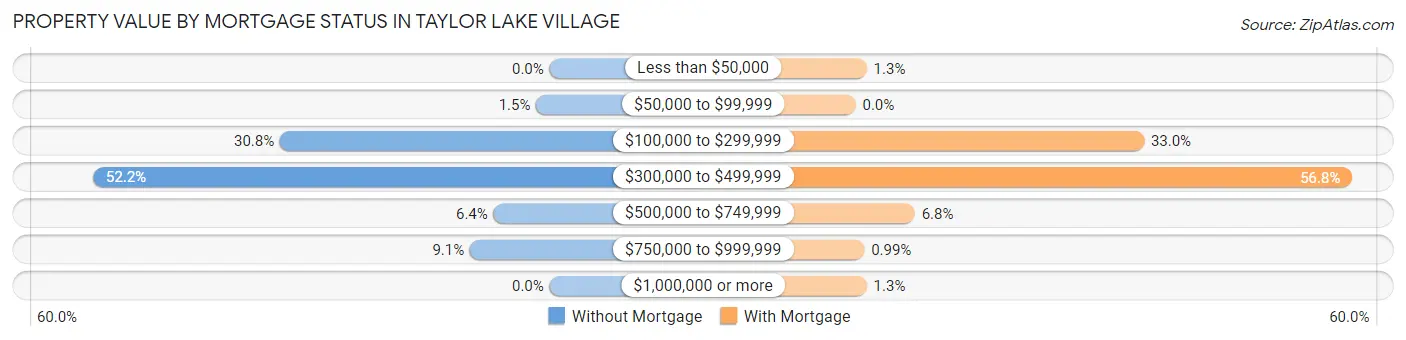
| Property Value | Without Mortgage | With Mortgage |
| Less than $50,000 | 0 (0.0%) | 9 (1.3%) |
| $50,000 to $99,999 | 9 (1.5%) | 0 (0.0%) |
| $100,000 to $299,999 | 183 (30.8%) | 234 (33.0%) |
| $300,000 to $499,999 | 310 (52.2%) | 403 (56.8%) |
| $500,000 to $749,999 | 38 (6.4%) | 48 (6.8%) |
| $750,000 to $999,999 | 54 (9.1%) | 7 (1.0%) |
| $1,000,000 or more | 0 (0.0%) | 9 (1.3%) |
| Total | 594 (100.0%) | 710 (100.0%) |
Household Income by Mortgage Status in Taylor Lake Village
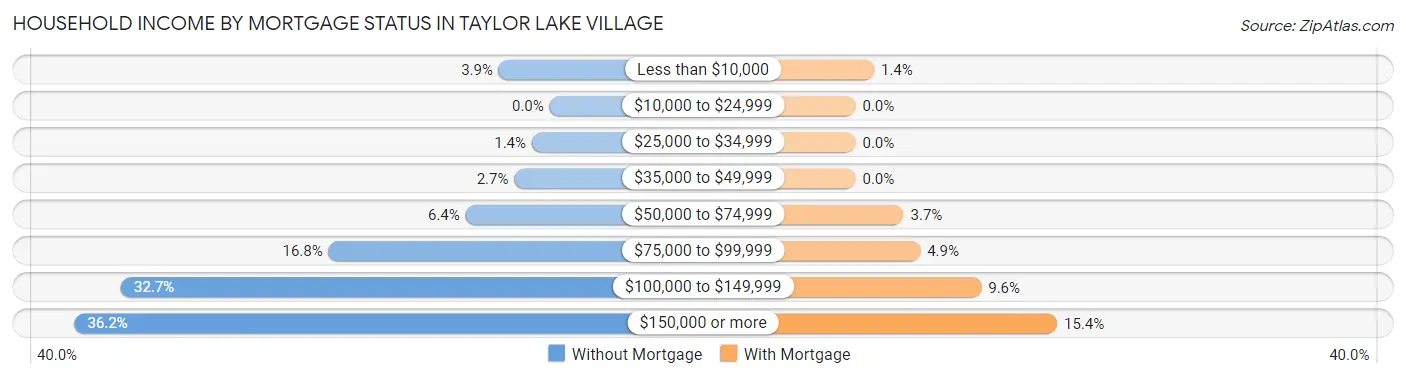
| Household Income | Without Mortgage | With Mortgage |
| Less than $10,000 | 23 (3.9%) | 10 (1.4%) |
| $10,000 to $24,999 | 0 (0.0%) | 0 (0.0%) |
| $25,000 to $34,999 | 8 (1.3%) | 0 (0.0%) |
| $35,000 to $49,999 | 16 (2.7%) | 0 (0.0%) |
| $50,000 to $74,999 | 38 (6.4%) | 26 (3.7%) |
| $75,000 to $99,999 | 100 (16.8%) | 35 (4.9%) |
| $100,000 to $149,999 | 194 (32.7%) | 68 (9.6%) |
| $150,000 or more | 215 (36.2%) | 109 (15.3%) |
| Total | 594 (100.0%) | 710 (100.0%) |
Property Value to Household Income Ratio in Taylor Lake Village
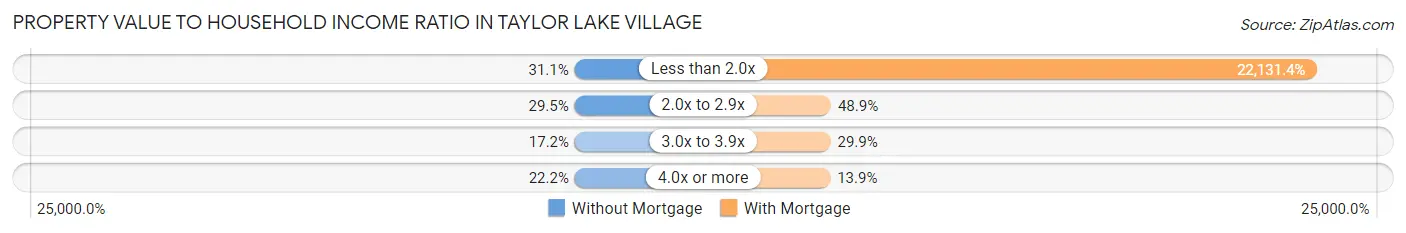
| Value-to-Income Ratio | Without Mortgage | With Mortgage |
| Less than 2.0x | 185 (31.1%) | 157,133 (22,131.4%) |
| 2.0x to 2.9x | 175 (29.5%) | 347 (48.9%) |
| 3.0x to 3.9x | 102 (17.2%) | 212 (29.9%) |
| 4.0x or more | 132 (22.2%) | 99 (13.9%) |
| Total | 594 (100.0%) | 710 (100.0%) |
Real Estate Taxes by Mortgage Status in Taylor Lake Village
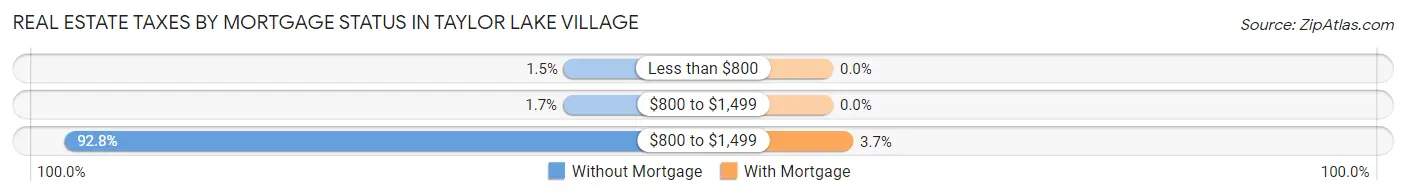
| Property Taxes | Without Mortgage | With Mortgage |
| Less than $800 | 9 (1.5%) | 0 (0.0%) |
| $800 to $1,499 | 10 (1.7%) | 0 (0.0%) |
| $800 to $1,499 | 551 (92.8%) | 26 (3.7%) |
| Total | 594 (100.0%) | 710 (100.0%) |
Health & Disability in Taylor Lake Village
Health Insurance Coverage by Age in Taylor Lake Village
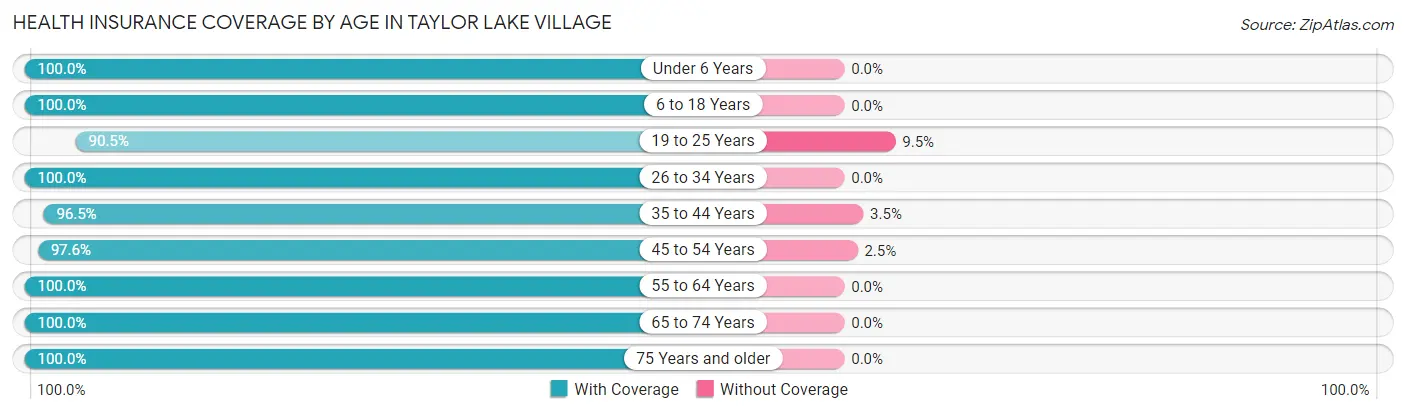
| Age Bracket | With Coverage | Without Coverage |
| Under 6 Years | 148 (100.0%) | 0 (0.0%) |
| 6 to 18 Years | 630 (100.0%) | 0 (0.0%) |
| 19 to 25 Years | 152 (90.5%) | 16 (9.5%) |
| 26 to 34 Years | 255 (100.0%) | 0 (0.0%) |
| 35 to 44 Years | 274 (96.5%) | 10 (3.5%) |
| 45 to 54 Years | 558 (97.6%) | 14 (2.5%) |
| 55 to 64 Years | 649 (100.0%) | 0 (0.0%) |
| 65 to 74 Years | 650 (100.0%) | 0 (0.0%) |
| 75 Years and older | 321 (100.0%) | 0 (0.0%) |
| Total | 3,637 (98.9%) | 40 (1.1%) |
Health Insurance Coverage by Citizenship Status in Taylor Lake Village
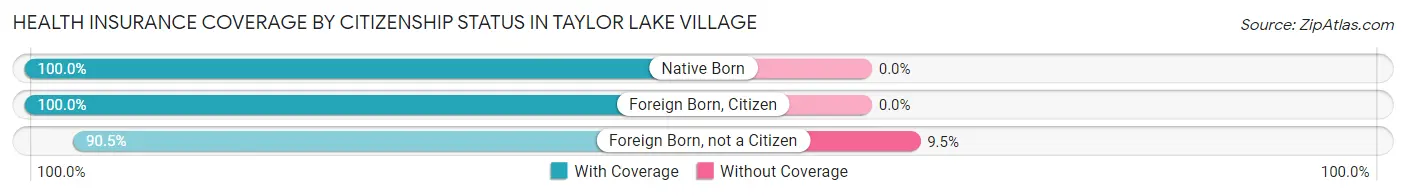
| Citizenship Status | With Coverage | Without Coverage |
| Native Born | 148 (100.0%) | 0 (0.0%) |
| Foreign Born, Citizen | 630 (100.0%) | 0 (0.0%) |
| Foreign Born, not a Citizen | 152 (90.5%) | 16 (9.5%) |
Health Insurance Coverage by Household Income in Taylor Lake Village
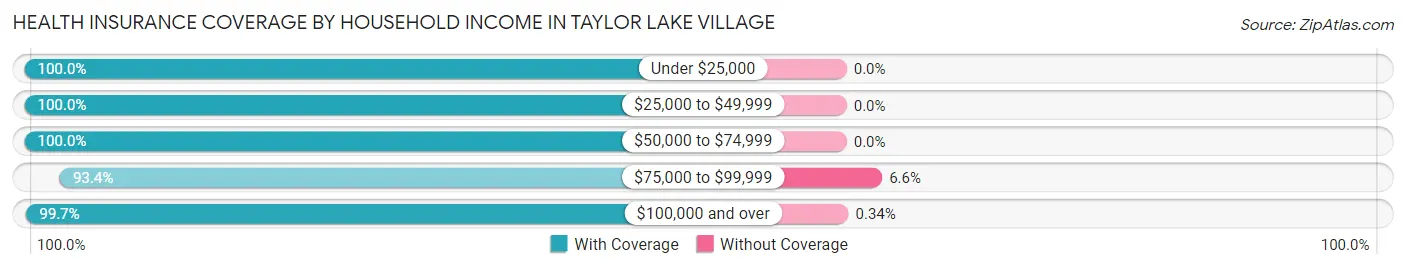
| Household Income | With Coverage | Without Coverage |
| Under $25,000 | 23 (100.0%) | 0 (0.0%) |
| $25,000 to $49,999 | 89 (100.0%) | 0 (0.0%) |
| $50,000 to $74,999 | 154 (100.0%) | 0 (0.0%) |
| $75,000 to $99,999 | 422 (93.4%) | 30 (6.6%) |
| $100,000 and over | 2,949 (99.7%) | 10 (0.3%) |
Public vs Private Health Insurance Coverage by Age in Taylor Lake Village
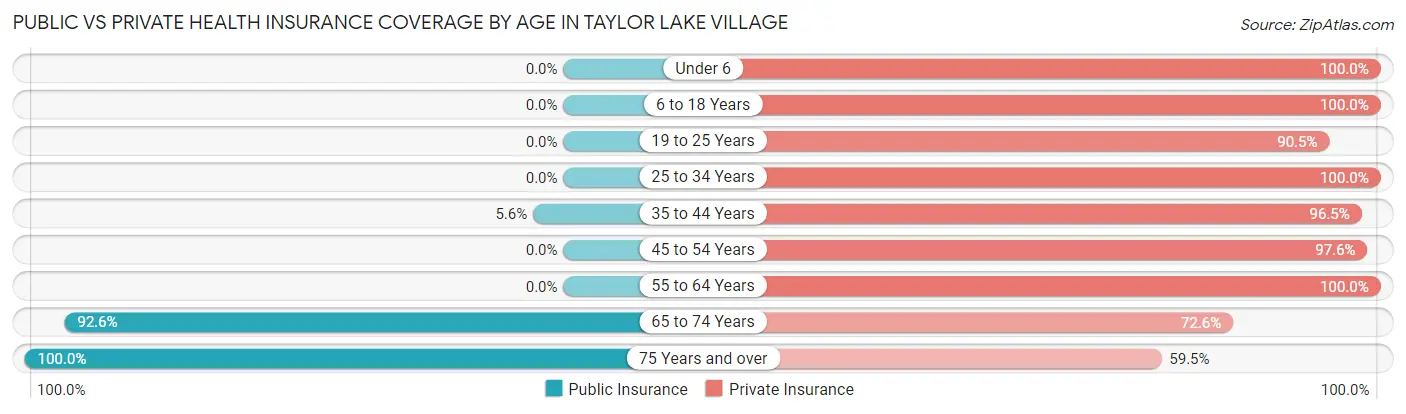
| Age Bracket | Public Insurance | Private Insurance |
| Under 6 | 0 (0.0%) | 148 (100.0%) |
| 6 to 18 Years | 0 (0.0%) | 630 (100.0%) |
| 19 to 25 Years | 0 (0.0%) | 152 (90.5%) |
| 25 to 34 Years | 0 (0.0%) | 255 (100.0%) |
| 35 to 44 Years | 16 (5.6%) | 274 (96.5%) |
| 45 to 54 Years | 0 (0.0%) | 558 (97.6%) |
| 55 to 64 Years | 0 (0.0%) | 649 (100.0%) |
| 65 to 74 Years | 602 (92.6%) | 472 (72.6%) |
| 75 Years and over | 321 (100.0%) | 191 (59.5%) |
| Total | 939 (25.5%) | 3,329 (90.5%) |
Disability Status by Sex by Age in Taylor Lake Village
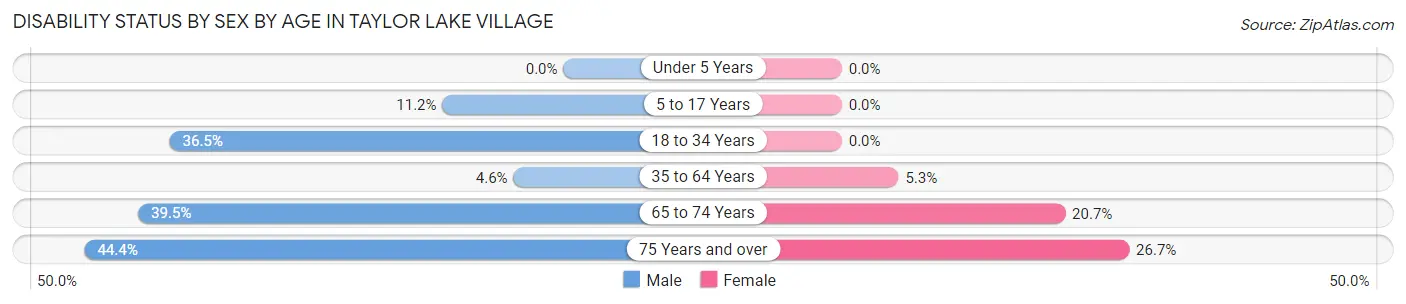
| Age Bracket | Male | Female |
| Under 5 Years | 0 (0.0%) | 0 (0.0%) |
| 5 to 17 Years | 32 (11.2%) | 0 (0.0%) |
| 18 to 34 Years | 95 (36.5%) | 0 (0.0%) |
| 35 to 64 Years | 31 (4.6%) | 44 (5.3%) |
| 65 to 74 Years | 148 (39.5%) | 57 (20.7%) |
| 75 Years and over | 76 (44.4%) | 40 (26.7%) |
Disability Class by Sex by Age in Taylor Lake Village
Disability Class: Hearing Difficulty
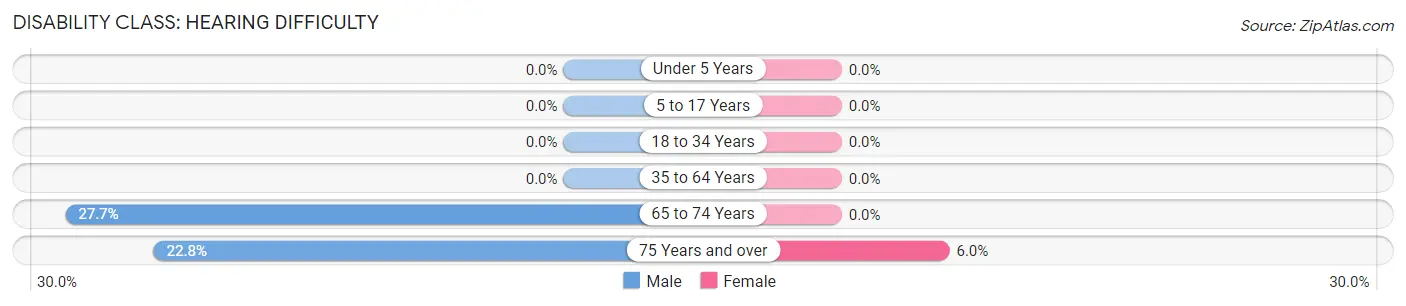
| Age Bracket | Male | Female |
| Under 5 Years | 0 (0.0%) | 0 (0.0%) |
| 5 to 17 Years | 0 (0.0%) | 0 (0.0%) |
| 18 to 34 Years | 0 (0.0%) | 0 (0.0%) |
| 35 to 64 Years | 0 (0.0%) | 0 (0.0%) |
| 65 to 74 Years | 104 (27.7%) | 0 (0.0%) |
| 75 Years and over | 39 (22.8%) | 9 (6.0%) |
Disability Class: Vision Difficulty
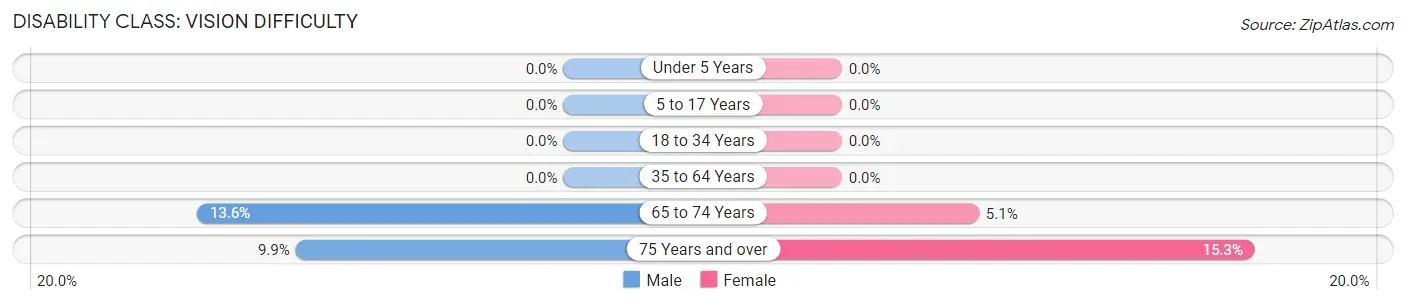
| Age Bracket | Male | Female |
| Under 5 Years | 0 (0.0%) | 0 (0.0%) |
| 5 to 17 Years | 0 (0.0%) | 0 (0.0%) |
| 18 to 34 Years | 0 (0.0%) | 0 (0.0%) |
| 35 to 64 Years | 0 (0.0%) | 0 (0.0%) |
| 65 to 74 Years | 51 (13.6%) | 14 (5.1%) |
| 75 Years and over | 17 (9.9%) | 23 (15.3%) |
Disability Class: Cognitive Difficulty
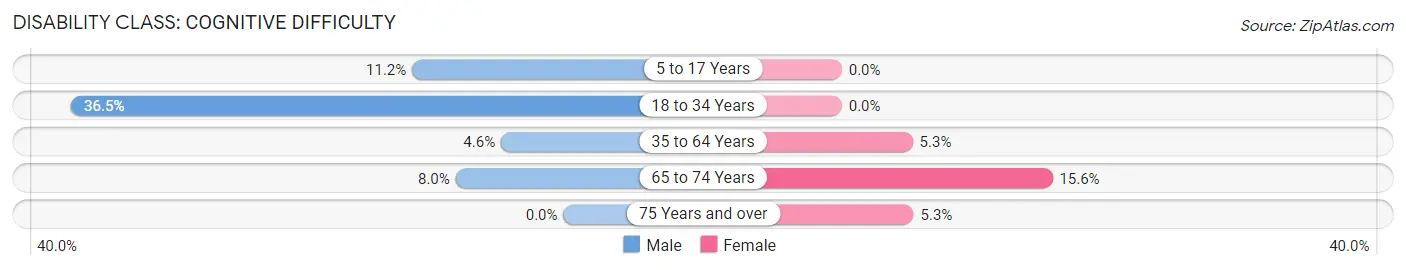
| Age Bracket | Male | Female |
| 5 to 17 Years | 32 (11.2%) | 0 (0.0%) |
| 18 to 34 Years | 95 (36.5%) | 0 (0.0%) |
| 35 to 64 Years | 31 (4.6%) | 44 (5.3%) |
| 65 to 74 Years | 30 (8.0%) | 43 (15.6%) |
| 75 Years and over | 0 (0.0%) | 8 (5.3%) |
Disability Class: Ambulatory Difficulty
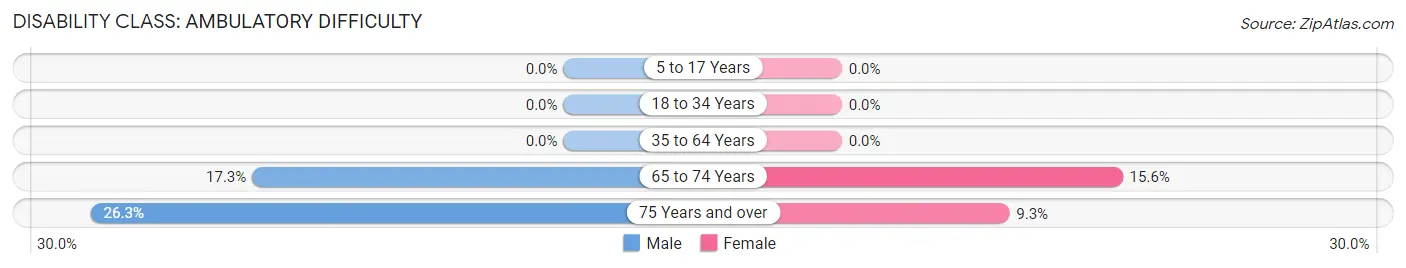
| Age Bracket | Male | Female |
| 5 to 17 Years | 0 (0.0%) | 0 (0.0%) |
| 18 to 34 Years | 0 (0.0%) | 0 (0.0%) |
| 35 to 64 Years | 0 (0.0%) | 0 (0.0%) |
| 65 to 74 Years | 65 (17.3%) | 43 (15.6%) |
| 75 Years and over | 45 (26.3%) | 14 (9.3%) |
Disability Class: Self-Care Difficulty
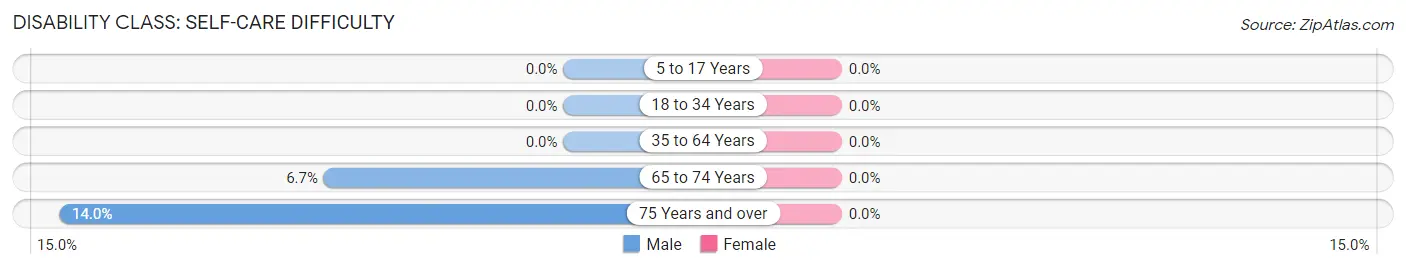
| Age Bracket | Male | Female |
| 5 to 17 Years | 0 (0.0%) | 0 (0.0%) |
| 18 to 34 Years | 0 (0.0%) | 0 (0.0%) |
| 35 to 64 Years | 0 (0.0%) | 0 (0.0%) |
| 65 to 74 Years | 25 (6.7%) | 0 (0.0%) |
| 75 Years and over | 24 (14.0%) | 0 (0.0%) |
Technology Access in Taylor Lake Village
Computing Device Access in Taylor Lake Village
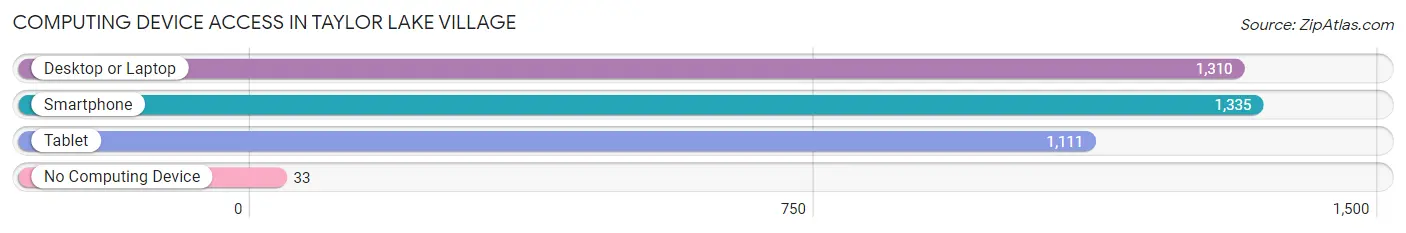
| Device Type | # Households | % Households |
| Desktop or Laptop | 1,310 | 92.9% |
| Smartphone | 1,335 | 94.7% |
| Tablet | 1,111 | 78.8% |
| No Computing Device | 33 | 2.3% |
| Total | 1,410 | 100.0% |
Internet Access in Taylor Lake Village
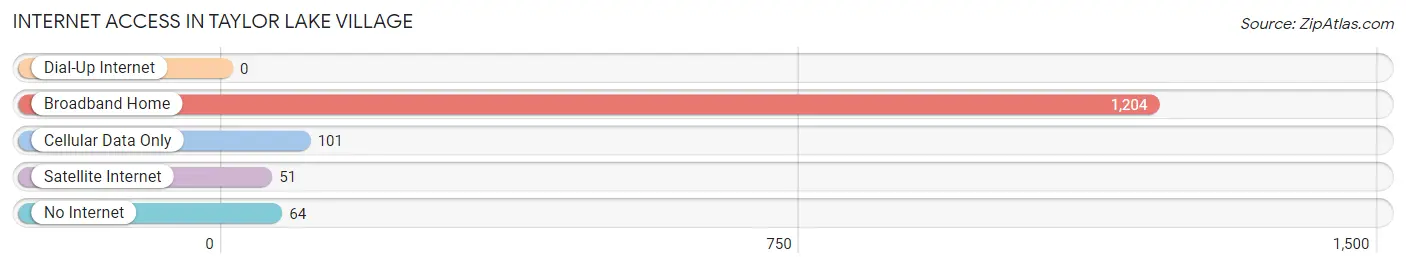
| Internet Type | # Households | % Households |
| Dial-Up Internet | 0 | 0.0% |
| Broadband Home | 1,204 | 85.4% |
| Cellular Data Only | 101 | 7.2% |
| Satellite Internet | 51 | 3.6% |
| No Internet | 64 | 4.5% |
| Total | 1,410 | 100.0% |
Taylor Lake Village Summary
History
Taylor Lake Village is a city located in Harris County, Texas, United States. It is located on the south shore of Taylor Lake, a small lake in the Clear Lake area of Houston. The city was incorporated in 1954 and is one of the smallest cities in the Houston metropolitan area.
The area that is now Taylor Lake Village was originally inhabited by the Karankawa Indians. The first European settlers arrived in the area in the early 1800s. The area was first known as Taylor’s Lake, named after a local settler, William Taylor. The area was later renamed Taylor Lake Village in 1954 when it was incorporated as a city.
The city of Taylor Lake Village is located in the Clear Lake area of Houston, which is known for its high-tech industry. The city is home to many businesses, including NASA’s Johnson Space Center, the University of Houston-Clear Lake, and the Bayport Industrial District.
Geography
Taylor Lake Village is located in Harris County, Texas, United States. It is located on the south shore of Taylor Lake, a small lake in the Clear Lake area of Houston. The city is bordered by Clear Lake City to the north, League City to the east, and El Lago to the south. The city has a total area of 2.2 square miles, all of which is land.
The city has a humid subtropical climate, with hot, humid summers and mild winters. The average temperature in the summer is around 90°F, and the average temperature in the winter is around 60°F.
Economy
Taylor Lake Village is home to many businesses, including NASA’s Johnson Space Center, the University of Houston-Clear Lake, and the Bayport Industrial District. The city is also home to several retail stores, restaurants, and other businesses.
The city’s economy is largely driven by the aerospace and technology industries. The city is home to many aerospace and technology companies, including Boeing, Lockheed Martin, and Raytheon. The city is also home to several medical centers, including the University of Texas Medical Branch and the Clear Lake Regional Medical Center.
Demographics
As of the 2010 census, the population of Taylor Lake Village was 3,638. The racial makeup of the city was 79.3% White, 8.2% African American, 0.3% Native American, 5.2% Asian, 0.1% Pacific Islander, 4.2% from other races, and 2.9% from two or more races. Hispanic or Latino of any race were 11.3% of the population.
The median household income in Taylor Lake Village was $76,944, and the median family income was $87,944. The per capita income for the city was $35,944. About 4.3% of families and 5.7% of the population were below the poverty line, including 6.3% of those under age 18 and 4.2% of those age 65 or over.
Common Questions
What is the Total Population of Taylor Lake Village?
Total Population of Taylor Lake Village is 3,677.
What is the Total Male Population of Taylor Lake Village?
Total Male Population of Taylor Lake Village is 1,873.
What is the Total Female Population of Taylor Lake Village?
Total Female Population of Taylor Lake Village is 1,804.
What is the Ratio of Males per 100 Females in Taylor Lake Village?
There are 103.82 Males per 100 Females in Taylor Lake Village.
What is the Ratio of Females per 100 Males in Taylor Lake Village?
There are 96.32 Females per 100 Males in Taylor Lake Village.
What is the Median Population Age in Taylor Lake Village?
Median Population Age in Taylor Lake Village is 51.3 Years.
What is the Average Family Size in Taylor Lake Village
Average Family Size in Taylor Lake Village is 2.8 People.
What is the Average Household Size in Taylor Lake Village
Average Household Size in Taylor Lake Village is 2.6 People.
What is Per Capita Income in Taylor Lake Village?
Per Capita income in Taylor Lake Village is $64,403.
What is the Median Family Income in Taylor Lake Village?
Median Family Income in Taylor Lake Village is $151,011.
What is the Median Household income in Taylor Lake Village?
Median Household Income in Taylor Lake Village is $150,479.
What is Income or Wage Gap in Taylor Lake Village?
Income or Wage Gap in Taylor Lake Village is 48.4%.
Women in Taylor Lake Village earn 51.6 cents for every dollar earned by a man.
What is Inequality or Gini Index in Taylor Lake Village?
Inequality or Gini Index in Taylor Lake Village is 0.32.
How Large is the Labor Force in Taylor Lake Village?
There are 1,756 People in the Labor Forcein in Taylor Lake Village.
What is the Percentage of People in the Labor Force in Taylor Lake Village?
57.7% of People are in the Labor Force in Taylor Lake Village.
What is the Unemployment Rate in Taylor Lake Village?
Unemployment Rate in Taylor Lake Village is 2.8%.