Sanctuary, TX
Sanctuary Map
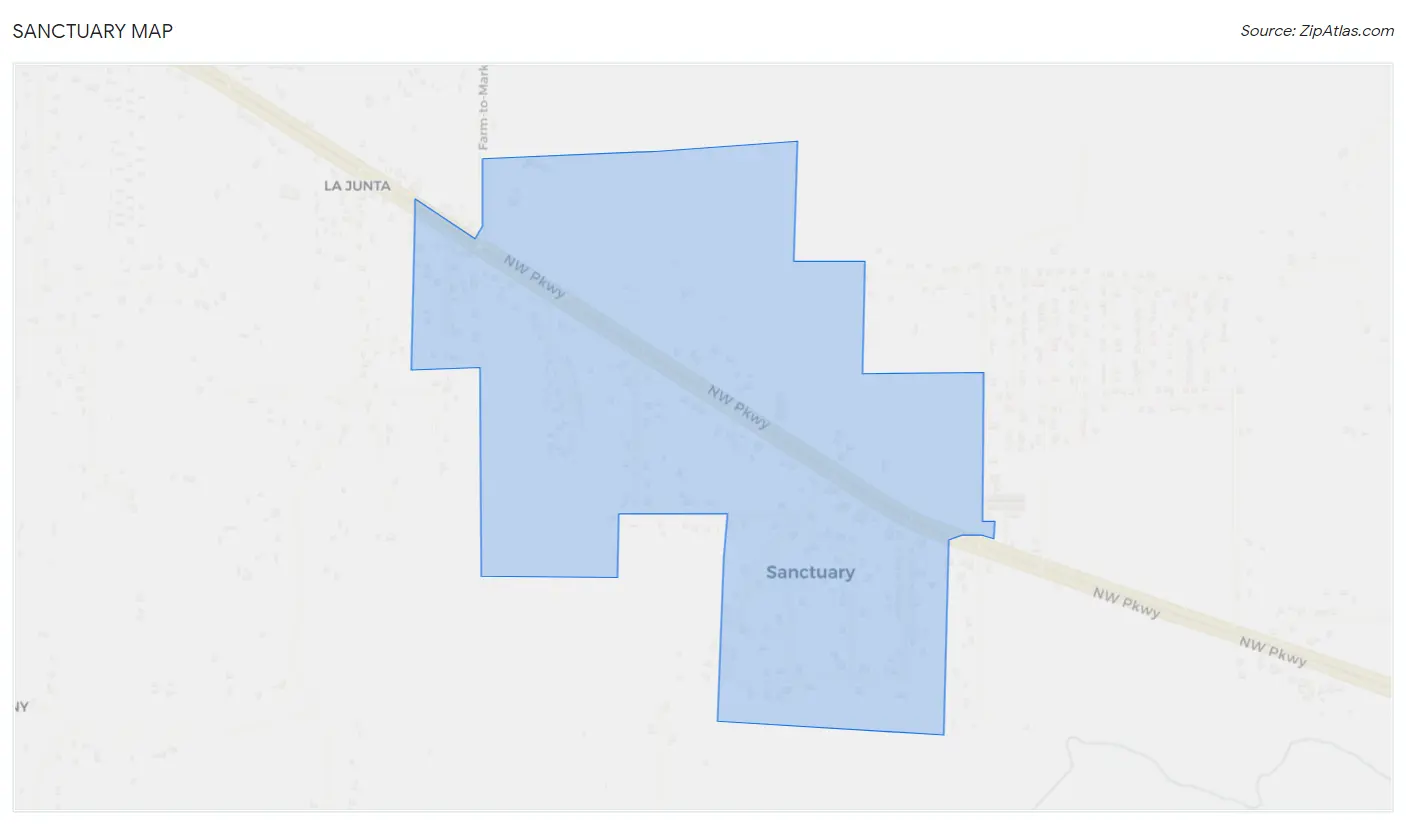
Sanctuary Overview
254
TOTAL POPULATION
128
MALE POPULATION
126
FEMALE POPULATION
101.59
MALES / 100 FEMALES
98.44
FEMALES / 100 MALES
50.5
MEDIAN AGE
3.0
AVG FAMILY SIZE
2.6
AVG HOUSEHOLD SIZE
$55,852
PER CAPITA INCOME
$118,750
AVG FAMILY INCOME
$108,750
AVG HOUSEHOLD INCOME
0.51
INEQUALITY / GINI INDEX
134
LABOR FORCE [ PEOPLE ]
59.3%
PERCENT IN LABOR FORCE
9.0%
UNEMPLOYMENT RATE
Sanctuary Area Codes
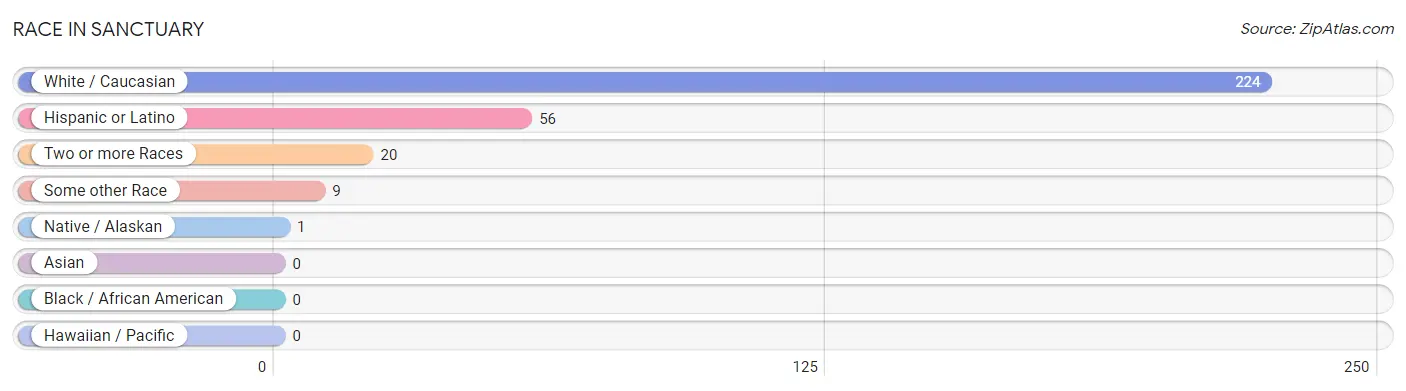
Race in Sanctuary
The most populous races in Sanctuary are White / Caucasian (224 | 88.2%), Hispanic or Latino (56 | 22.1%), and Two or more Races (20 | 7.9%).
| Race | # Population | % Population |
| Asian | 0 | 0.0% |
| Black / African American | 0 | 0.0% |
| Hawaiian / Pacific | 0 | 0.0% |
| Hispanic or Latino | 56 | 22.1% |
| Native / Alaskan | 1 | 0.4% |
| White / Caucasian | 224 | 88.2% |
| Two or more Races | 20 | 7.9% |
| Some other Race | 9 | 3.5% |
| Total | 254 | 100.0% |
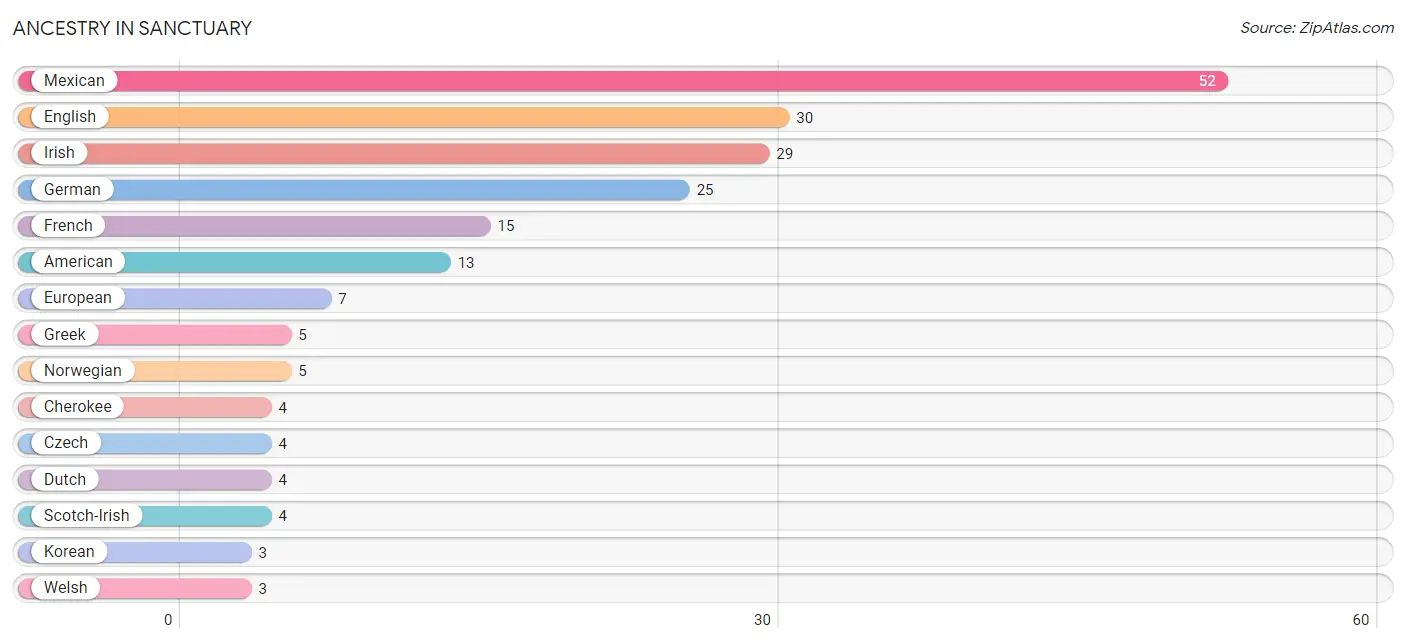
Ancestry in Sanctuary
The most populous ancestries reported in Sanctuary are Mexican (52 | 20.5%), English (30 | 11.8%), Irish (29 | 11.4%), German (25 | 9.8%), and French (15 | 5.9%), together accounting for 59.5% of all Sanctuary residents.
| Ancestry | # Population | % Population |
| American | 13 | 5.1% |
| Cajun | 1 | 0.4% |
| Cherokee | 4 | 1.6% |
| Choctaw | 1 | 0.4% |
| Czech | 4 | 1.6% |
| Dutch | 4 | 1.6% |
| English | 30 | 11.8% |
| European | 7 | 2.8% |
| French | 15 | 5.9% |
| German | 25 | 9.8% |
| Greek | 5 | 2.0% |
| Irish | 29 | 11.4% |
| Korean | 3 | 1.2% |
| Mexican | 52 | 20.5% |
| Norwegian | 5 | 2.0% |
| Russian | 1 | 0.4% |
| Scotch-Irish | 4 | 1.6% |
| Scottish | 1 | 0.4% |
| Sioux | 1 | 0.4% |
| Swedish | 1 | 0.4% |
| Welsh | 3 | 1.2% | View All 21 Rows |
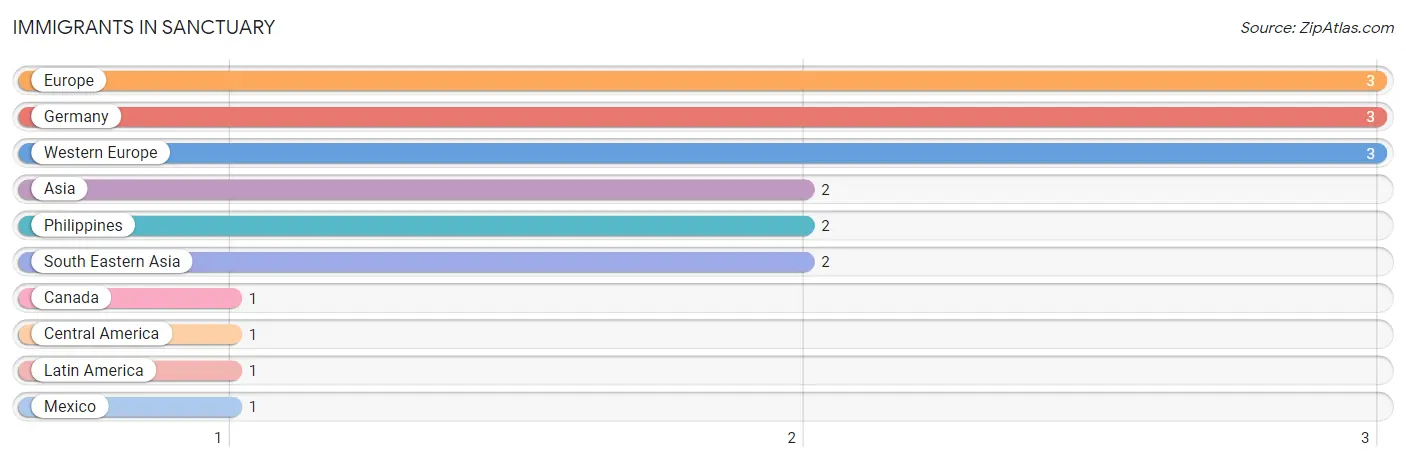
Immigrants in Sanctuary
The most numerous immigrant groups reported in Sanctuary came from Europe (3 | 1.2%), Germany (3 | 1.2%), Western Europe (3 | 1.2%), Asia (2 | 0.8%), and Philippines (2 | 0.8%), together accounting for 5.1% of all Sanctuary residents.
| Immigration Origin | # Population | % Population |
| Asia | 2 | 0.8% |
| Canada | 1 | 0.4% |
| Central America | 1 | 0.4% |
| Europe | 3 | 1.2% |
| Germany | 3 | 1.2% |
| Latin America | 1 | 0.4% |
| Mexico | 1 | 0.4% |
| Philippines | 2 | 0.8% |
| South Eastern Asia | 2 | 0.8% |
| Western Europe | 3 | 1.2% | View All 10 Rows |
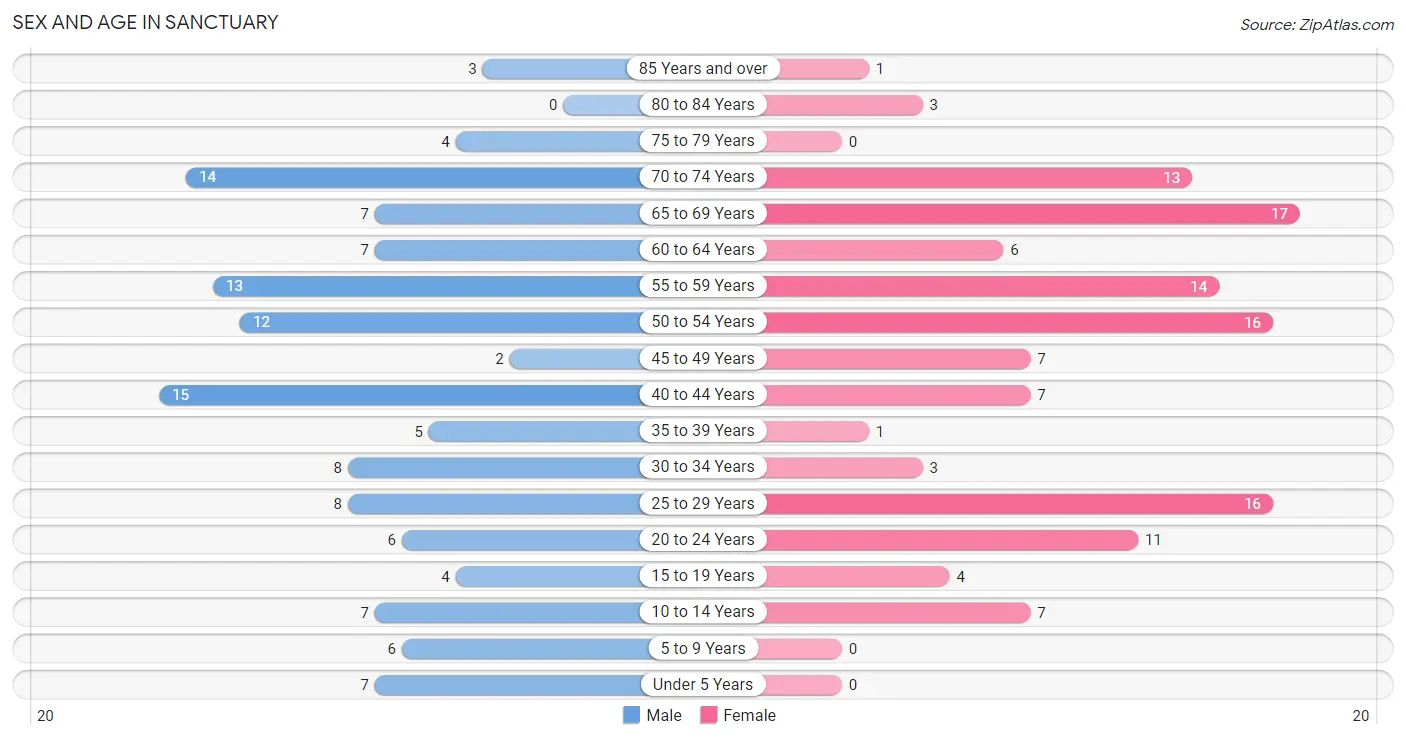
Sex and Age in Sanctuary
Sex and Age in Sanctuary
The most populous age groups in Sanctuary are 40 to 44 Years (15 | 11.7%) for men and 65 to 69 Years (17 | 13.5%) for women.
| Age Bracket | Male | Female |
| Under 5 Years | 7 (5.5%) | 0 (0.0%) |
| 5 to 9 Years | 6 (4.7%) | 0 (0.0%) |
| 10 to 14 Years | 7 (5.5%) | 7 (5.6%) |
| 15 to 19 Years | 4 (3.1%) | 4 (3.2%) |
| 20 to 24 Years | 6 (4.7%) | 11 (8.7%) |
| 25 to 29 Years | 8 (6.2%) | 16 (12.7%) |
| 30 to 34 Years | 8 (6.2%) | 3 (2.4%) |
| 35 to 39 Years | 5 (3.9%) | 1 (0.8%) |
| 40 to 44 Years | 15 (11.7%) | 7 (5.6%) |
| 45 to 49 Years | 2 (1.6%) | 7 (5.6%) |
| 50 to 54 Years | 12 (9.4%) | 16 (12.7%) |
| 55 to 59 Years | 13 (10.2%) | 14 (11.1%) |
| 60 to 64 Years | 7 (5.5%) | 6 (4.8%) |
| 65 to 69 Years | 7 (5.5%) | 17 (13.5%) |
| 70 to 74 Years | 14 (10.9%) | 13 (10.3%) |
| 75 to 79 Years | 4 (3.1%) | 0 (0.0%) |
| 80 to 84 Years | 0 (0.0%) | 3 (2.4%) |
| 85 Years and over | 3 (2.3%) | 1 (0.8%) |
| Total | 128 (100.0%) | 126 (100.0%) |
Families and Households in Sanctuary
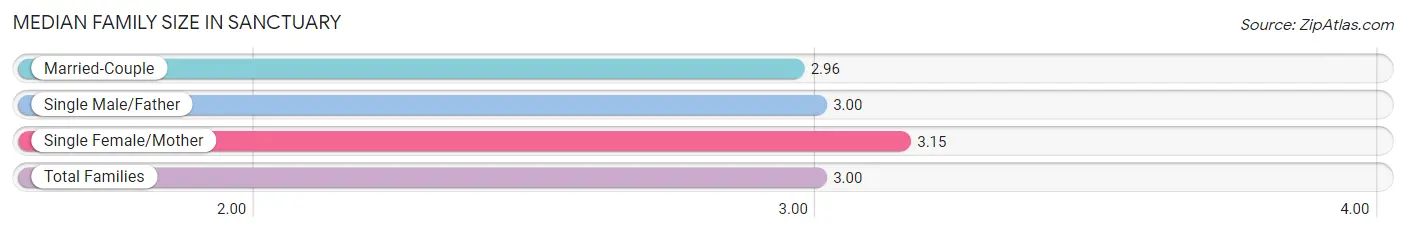
Median Family Size in Sanctuary
The median family size in Sanctuary is 3.00 persons per family, with single female/mother families (13 | 19.1%) accounting for the largest median family size of 3.15 persons per family. On the other hand, married-couple families (50 | 73.5%) represent the smallest median family size with 2.96 persons per family.
| Family Type | # Families | Family Size |
| Married-Couple | 50 (73.5%) | 2.96 |
| Single Male/Father | 5 (7.3%) | 3.00 |
| Single Female/Mother | 13 (19.1%) | 3.15 |
| Total Families | 68 (100.0%) | 3.00 |
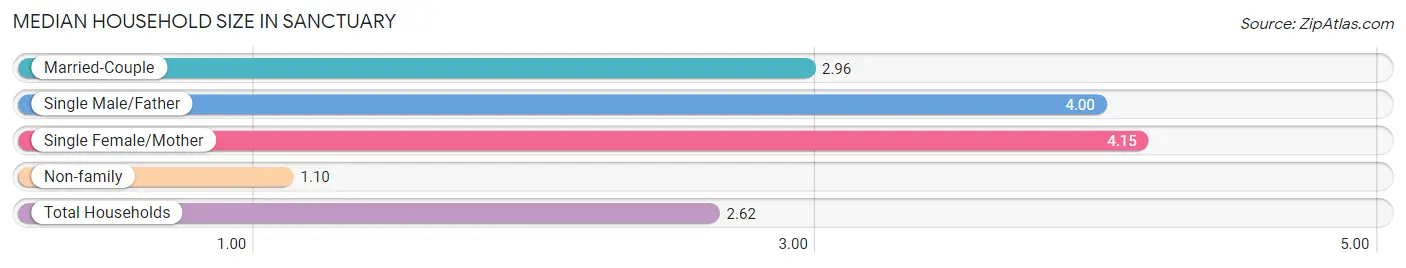
Median Household Size in Sanctuary
The median household size in Sanctuary is 2.62 persons per household, with single female/mother households (13 | 13.4%) accounting for the largest median household size of 4.15 persons per household. non-family households (29 | 29.9%) represent the smallest median household size with 1.10 persons per household.
| Household Type | # Households | Household Size |
| Married-Couple | 50 (51.5%) | 2.96 |
| Single Male/Father | 5 (5.1%) | 4.00 |
| Single Female/Mother | 13 (13.4%) | 4.15 |
| Non-family | 29 (29.9%) | 1.10 |
| Total Households | 97 (100.0%) | 2.62 |
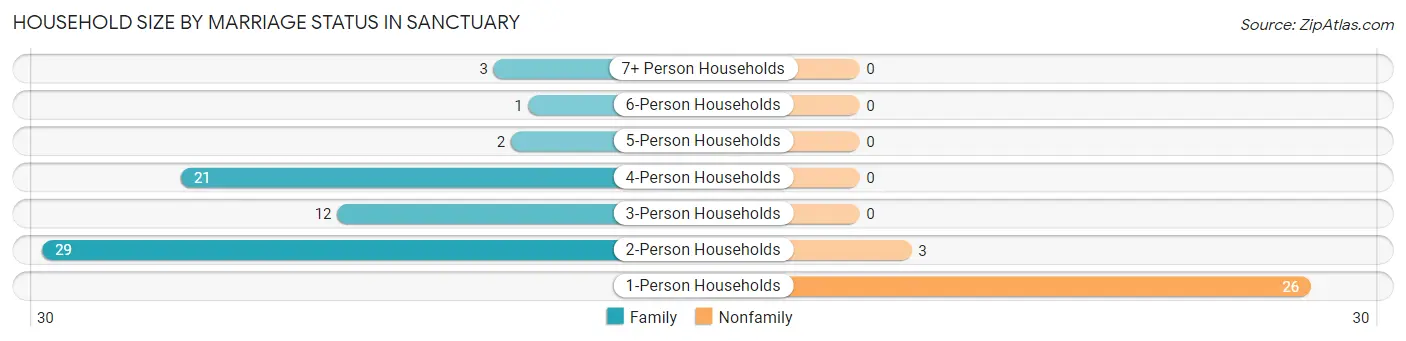
Household Size by Marriage Status in Sanctuary
Out of a total of 97 households in Sanctuary, 68 (70.1%) are family households, while 29 (29.9%) are nonfamily households. The most numerous type of family households are 2-person households, comprising 29, and the most common type of nonfamily households are 1-person households, comprising 26.
| Household Size | Family Households | Nonfamily Households |
| 1-Person Households | - | 26 (26.8%) |
| 2-Person Households | 29 (29.9%) | 3 (3.1%) |
| 3-Person Households | 12 (12.4%) | 0 (0.0%) |
| 4-Person Households | 21 (21.6%) | 0 (0.0%) |
| 5-Person Households | 2 (2.1%) | 0 (0.0%) |
| 6-Person Households | 1 (1.0%) | 0 (0.0%) |
| 7+ Person Households | 3 (3.1%) | 0 (0.0%) |
| Total | 68 (70.1%) | 29 (29.9%) |
Female Fertility in Sanctuary
Fertility by Age in Sanctuary
| Age Bracket | Women with Births | Births / 1,000 Women |
| 15 to 19 years | 0 (0.0%) | 0.0 |
| 20 to 34 years | 0 (0.0%) | 0.0 |
| 35 to 50 years | 0 (0.0%) | 0.0 |
| Total | 0 (0.0%) | 0.0 |
Fertility by Age by Marriage Status in Sanctuary
| Age Bracket | Married | Unmarried |
| 15 to 19 years | 0 (0.0%) | 0 (0.0%) |
| 20 to 34 years | 0 (0.0%) | 0 (0.0%) |
| 35 to 50 years | 0 (0.0%) | 0 (0.0%) |
| Total | 0 (0.0%) | 0 (0.0%) |
Fertility by Education in Sanctuary
| Educational Attainment | Women with Births | Births / 1,000 Women |
| Less than High School | 0 (0.0%) | 0.0 |
| High School Diploma | 0 (0.0%) | 0.0 |
| College or Associate's Degree | 0 (0.0%) | 0.0 |
| Bachelor's Degree | 0 (0.0%) | 0.0 |
| Graduate Degree | 0 (0.0%) | 0.0 |
| Total | 0 (0.0%) | 0.0 |
Fertility by Education by Marriage Status in Sanctuary
| Educational Attainment | Married | Unmarried |
| Less than High School | 0 (0.0%) | 0 (0.0%) |
| High School Diploma | 0 (0.0%) | 0 (0.0%) |
| College or Associate's Degree | 0 (0.0%) | 0 (0.0%) |
| Bachelor's Degree | 0 (0.0%) | 0 (0.0%) |
| Graduate Degree | 0 (0.0%) | 0 (0.0%) |
| Total | 0 (0.0%) | 0 (0.0%) |
Income in Sanctuary
Income Overview in Sanctuary
Per Capita Income in Sanctuary is $55,852, while median incomes of families and households are $118,750 and $108,750 respectively.
| Characteristic | Number | Measure |
| Per Capita Income | 254 | $55,852 |
| Median Family Income | 68 | $118,750 |
| Mean Family Income | 68 | $181,376 |
| Median Household Income | 97 | $108,750 |
| Mean Household Income | 97 | $145,644 |
| Income Deficit | 68 | $0 |
| Wage / Income Gap (%) | 254 | 0.00% |
| Wage / Income Gap ($) | 254 | 100.00¢ per $1 |
| Gini / Inequality Index | 254 | 0.51 |
Earnings by Sex in Sanctuary
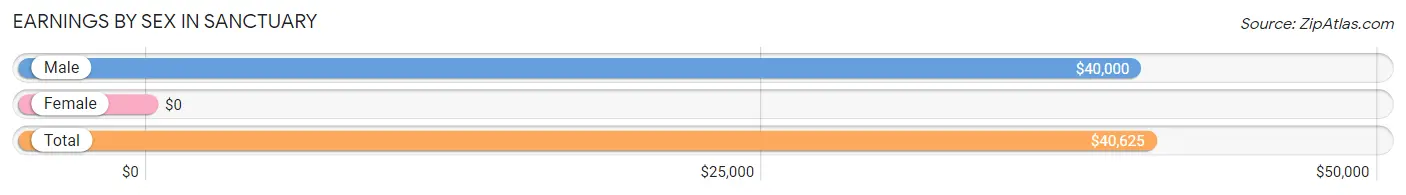
| Sex | Number | Average Earnings |
| Male | 64 (47.4%) | $40,000 |
| Female | 71 (52.6%) | $0 |
| Total | 135 (100.0%) | $40,625 |
Earnings by Sex by Income Bracket in Sanctuary
The most common earnings brackets in Sanctuary are $30,000 to $34,999 for men (13 | 20.3%) and $65,000 to $74,999 for women (16 | 22.5%).
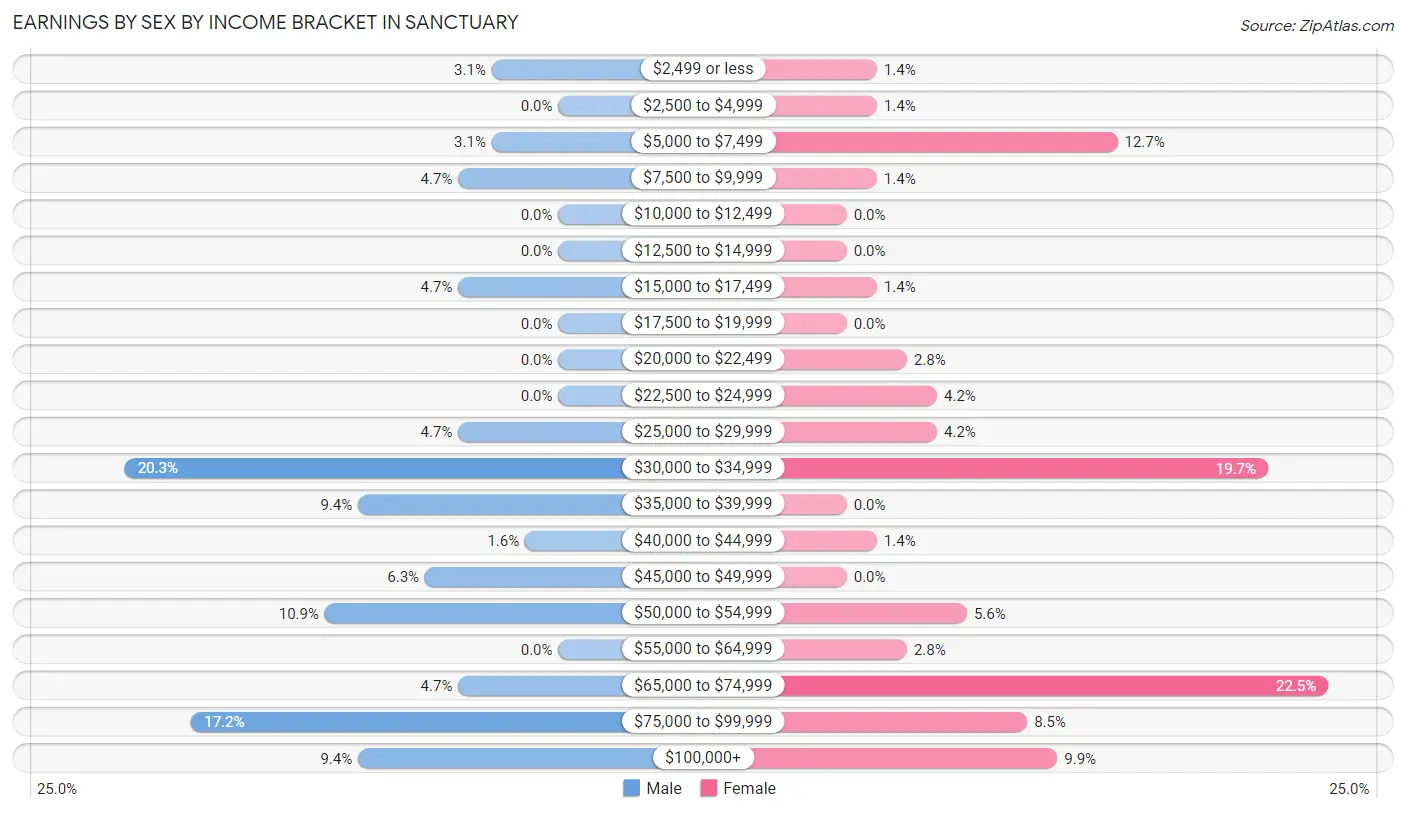
| Income | Male | Female |
| $2,499 or less | 2 (3.1%) | 1 (1.4%) |
| $2,500 to $4,999 | 0 (0.0%) | 1 (1.4%) |
| $5,000 to $7,499 | 2 (3.1%) | 9 (12.7%) |
| $7,500 to $9,999 | 3 (4.7%) | 1 (1.4%) |
| $10,000 to $12,499 | 0 (0.0%) | 0 (0.0%) |
| $12,500 to $14,999 | 0 (0.0%) | 0 (0.0%) |
| $15,000 to $17,499 | 3 (4.7%) | 1 (1.4%) |
| $17,500 to $19,999 | 0 (0.0%) | 0 (0.0%) |
| $20,000 to $22,499 | 0 (0.0%) | 2 (2.8%) |
| $22,500 to $24,999 | 0 (0.0%) | 3 (4.2%) |
| $25,000 to $29,999 | 3 (4.7%) | 3 (4.2%) |
| $30,000 to $34,999 | 13 (20.3%) | 14 (19.7%) |
| $35,000 to $39,999 | 6 (9.4%) | 0 (0.0%) |
| $40,000 to $44,999 | 1 (1.6%) | 1 (1.4%) |
| $45,000 to $49,999 | 4 (6.2%) | 0 (0.0%) |
| $50,000 to $54,999 | 7 (10.9%) | 4 (5.6%) |
| $55,000 to $64,999 | 0 (0.0%) | 2 (2.8%) |
| $65,000 to $74,999 | 3 (4.7%) | 16 (22.5%) |
| $75,000 to $99,999 | 11 (17.2%) | 6 (8.5%) |
| $100,000+ | 6 (9.4%) | 7 (9.9%) |
| Total | 64 (100.0%) | 71 (100.0%) |
Earnings by Sex by Educational Attainment in Sanctuary
Average earnings in Sanctuary are $46,563 for men and $57,500 for women, a difference of 19.0%. Men with an educational attainment of high school diploma enjoy the highest average annual earnings of $39,375, while those with high school diploma education earn the least with $39,375. Women with an educational attainment of graduate degree earn the most with the average annual earnings of $106,250, while those with high school diploma education have the smallest earnings of $31,750.
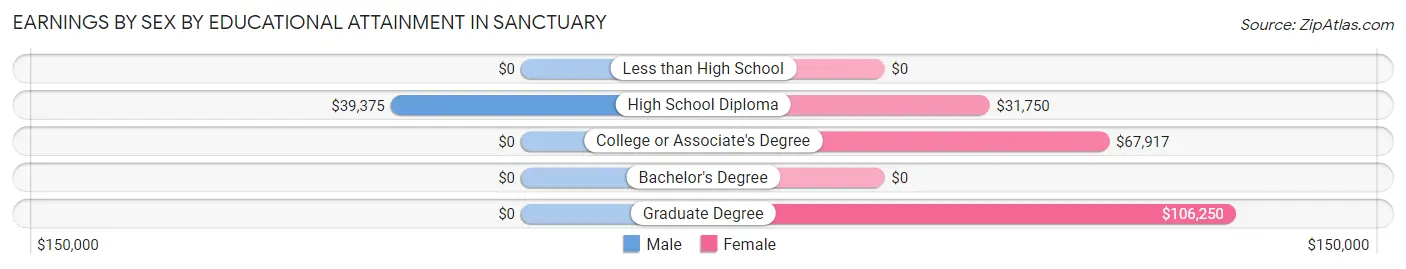
| Educational Attainment | Male Income | Female Income |
| Less than High School | - | - |
| High School Diploma | $39,375 | $31,750 |
| College or Associate's Degree | - | - |
| Bachelor's Degree | - | - |
| Graduate Degree | - | - |
| Total | $46,563 | $57,500 |
Family Income in Sanctuary
Family Income Brackets in Sanctuary
According to the Sanctuary family income data, there are 31 families falling into the $100,000 to $149,999 income range, which is the most common income bracket and makes up 45.6% of all families.
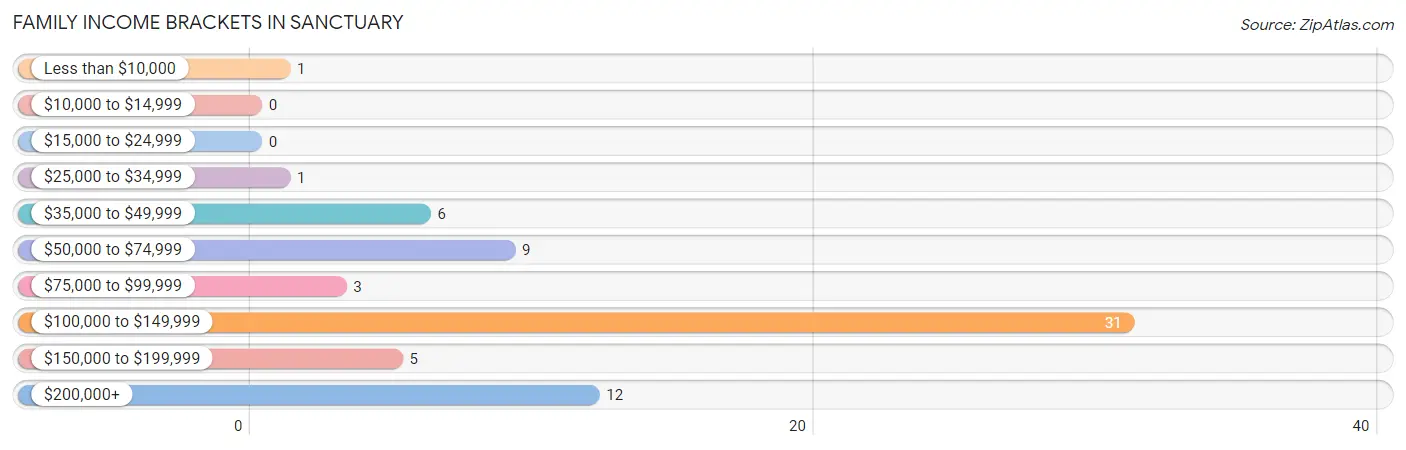
| Income Bracket | # Families | % Families |
| Less than $10,000 | 1 | 1.5% |
| $10,000 to $14,999 | 0 | 0.0% |
| $15,000 to $24,999 | 0 | 0.0% |
| $25,000 to $34,999 | 1 | 1.5% |
| $35,000 to $49,999 | 6 | 8.8% |
| $50,000 to $74,999 | 9 | 13.2% |
| $75,000 to $99,999 | 3 | 4.4% |
| $100,000 to $149,999 | 31 | 45.6% |
| $150,000 to $199,999 | 5 | 7.4% |
| $200,000+ | 12 | 17.6% |
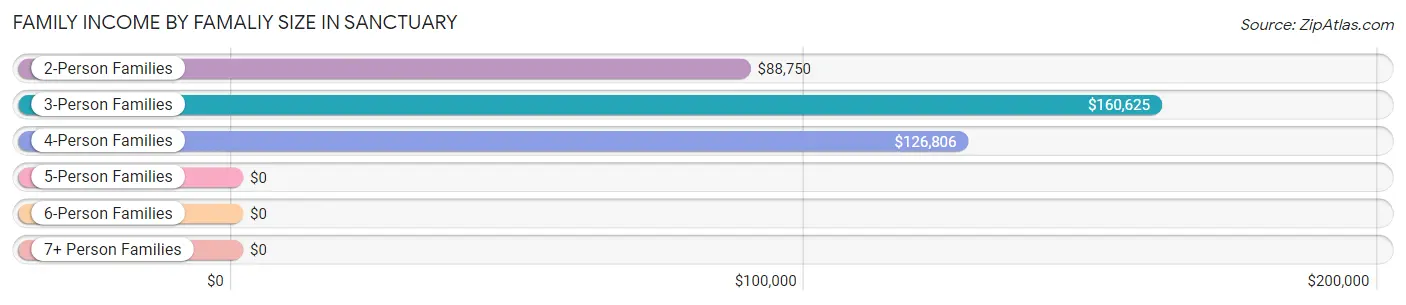
Family Income by Famaliy Size in Sanctuary
3-person families (15 | 22.1%) account for the highest median family income in Sanctuary with $160,625 per family, while 3-person families (15 | 22.1%) have the highest median income of $53,542 per family member.
| Income Bracket | # Families | Median Income |
| 2-Person Families | 31 (45.6%) | $88,750 |
| 3-Person Families | 15 (22.1%) | $160,625 |
| 4-Person Families | 19 (27.9%) | $126,806 |
| 5-Person Families | 2 (2.9%) | $0 |
| 6-Person Families | 1 (1.5%) | $0 |
| 7+ Person Families | 0 (0.0%) | $0 |
| Total | 68 (100.0%) | $118,750 |
Family Income by Number of Earners in Sanctuary
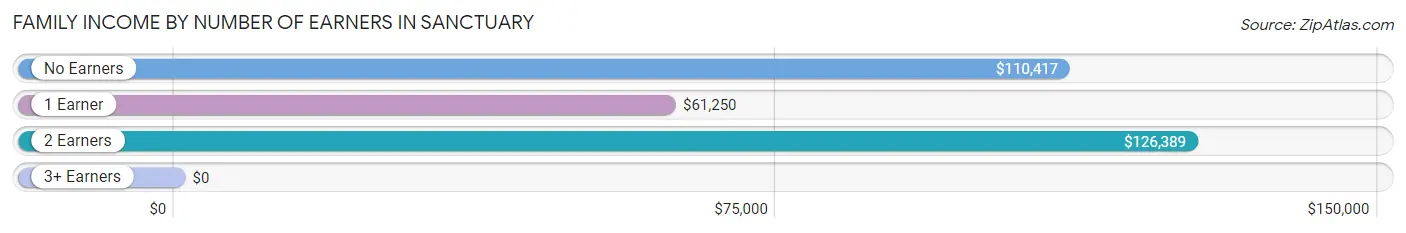
| Number of Earners | # Families | Median Income |
| No Earners | 14 (20.6%) | $110,417 |
| 1 Earner | 10 (14.7%) | $61,250 |
| 2 Earners | 38 (55.9%) | $126,389 |
| 3+ Earners | 6 (8.8%) | $0 |
| Total | 68 (100.0%) | $118,750 |
Household Income in Sanctuary
Household Income Brackets in Sanctuary
With 32 households falling in the category, the $100,000 to $149,999 income range is the most frequent in Sanctuary, accounting for 33.0% of all households.
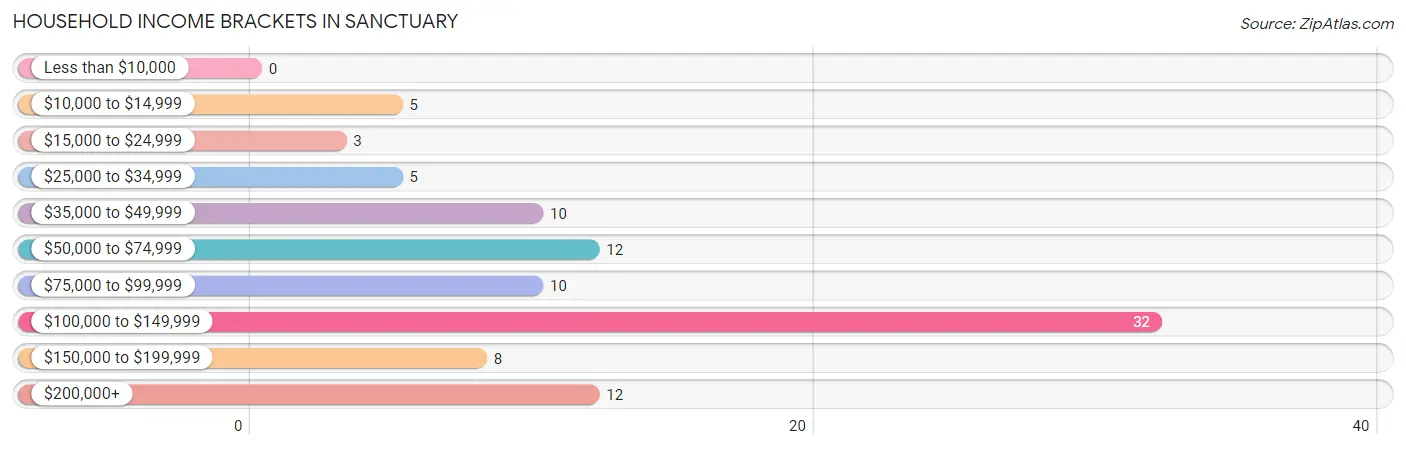
| Income Bracket | # Households | % Households |
| Less than $10,000 | 0 | 0.0% |
| $10,000 to $14,999 | 5 | 5.2% |
| $15,000 to $24,999 | 3 | 3.1% |
| $25,000 to $34,999 | 5 | 5.2% |
| $35,000 to $49,999 | 10 | 10.3% |
| $50,000 to $74,999 | 12 | 12.4% |
| $75,000 to $99,999 | 10 | 10.3% |
| $100,000 to $149,999 | 32 | 33.0% |
| $150,000 to $199,999 | 8 | 8.2% |
| $200,000+ | 12 | 12.4% |
Household Income by Householder Age in Sanctuary
The median household income in Sanctuary is $108,750, with the highest median household income of $117,188 found in the 25 to 44 years age bracket for the primary householder. A total of 27 households (27.8%) fall into this category. Meanwhile, the 15 to 24 years age bracket for the primary householder has the lowest median household income of $0, with 1 households (1.0%) in this group.
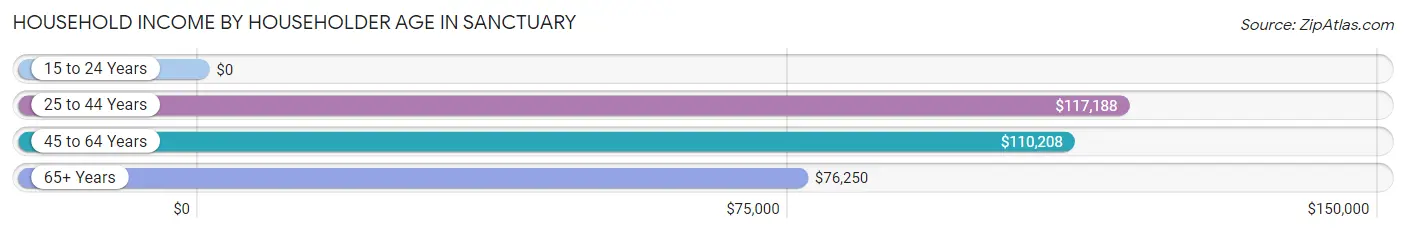
| Income Bracket | # Households | Median Income |
| 15 to 24 Years | 1 (1.0%) | $0 |
| 25 to 44 Years | 27 (27.8%) | $117,188 |
| 45 to 64 Years | 35 (36.1%) | $110,208 |
| 65+ Years | 34 (35.0%) | $76,250 |
| Total | 97 (100.0%) | $108,750 |
Poverty in Sanctuary
Income Below Poverty by Sex and Age in Sanctuary
With 10.4% poverty level for males and 7.1% for females among the residents of Sanctuary, 16 and 17 year old males and 16 and 17 year old females are the most vulnerable to poverty, with 1 males (33.3%) and 3 females (100.0%) in their respective age groups living below the poverty level.
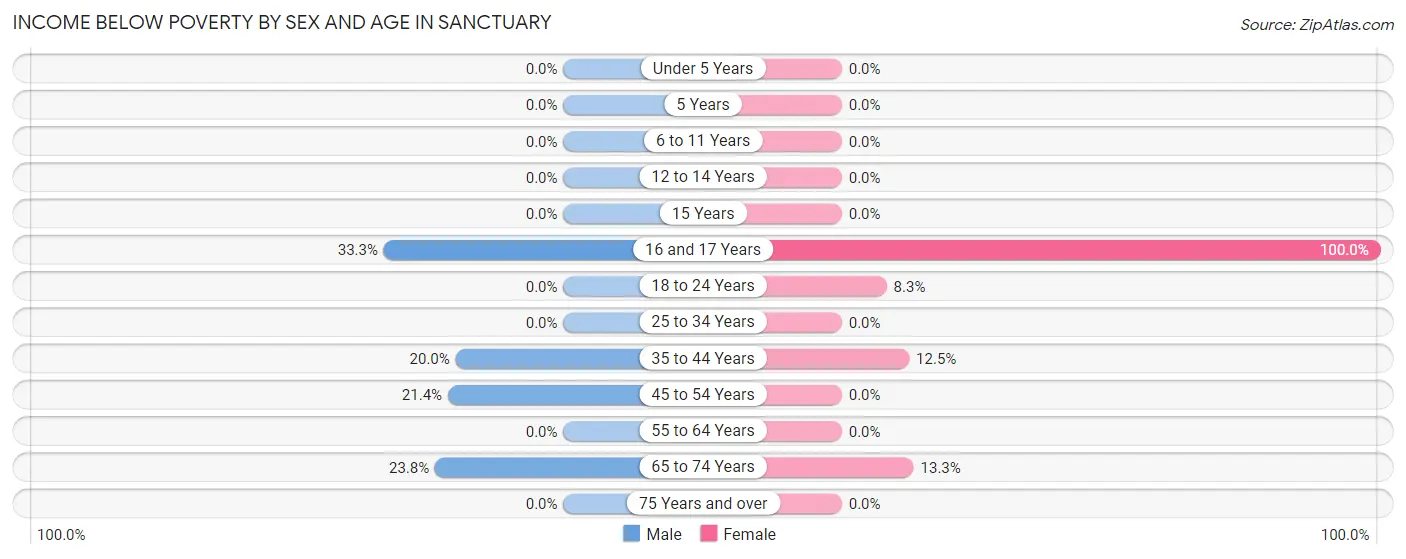
| Age Bracket | Male | Female |
| Under 5 Years | 0 (0.0%) | 0 (0.0%) |
| 5 Years | 0 (0.0%) | 0 (0.0%) |
| 6 to 11 Years | 0 (0.0%) | 0 (0.0%) |
| 12 to 14 Years | 0 (0.0%) | 0 (0.0%) |
| 15 Years | 0 (0.0%) | 0 (0.0%) |
| 16 and 17 Years | 1 (33.3%) | 3 (100.0%) |
| 18 to 24 Years | 0 (0.0%) | 1 (8.3%) |
| 25 to 34 Years | 0 (0.0%) | 0 (0.0%) |
| 35 to 44 Years | 4 (20.0%) | 1 (12.5%) |
| 45 to 54 Years | 3 (21.4%) | 0 (0.0%) |
| 55 to 64 Years | 0 (0.0%) | 0 (0.0%) |
| 65 to 74 Years | 5 (23.8%) | 4 (13.3%) |
| 75 Years and over | 0 (0.0%) | 0 (0.0%) |
| Total | 13 (10.4%) | 9 (7.1%) |
Income Above Poverty by Sex and Age in Sanctuary
According to the poverty statistics in Sanctuary, males aged under 5 years and females aged 6 to 11 years are the age groups that are most secure financially, with 100.0% of males and 100.0% of females in these age groups living above the poverty line.
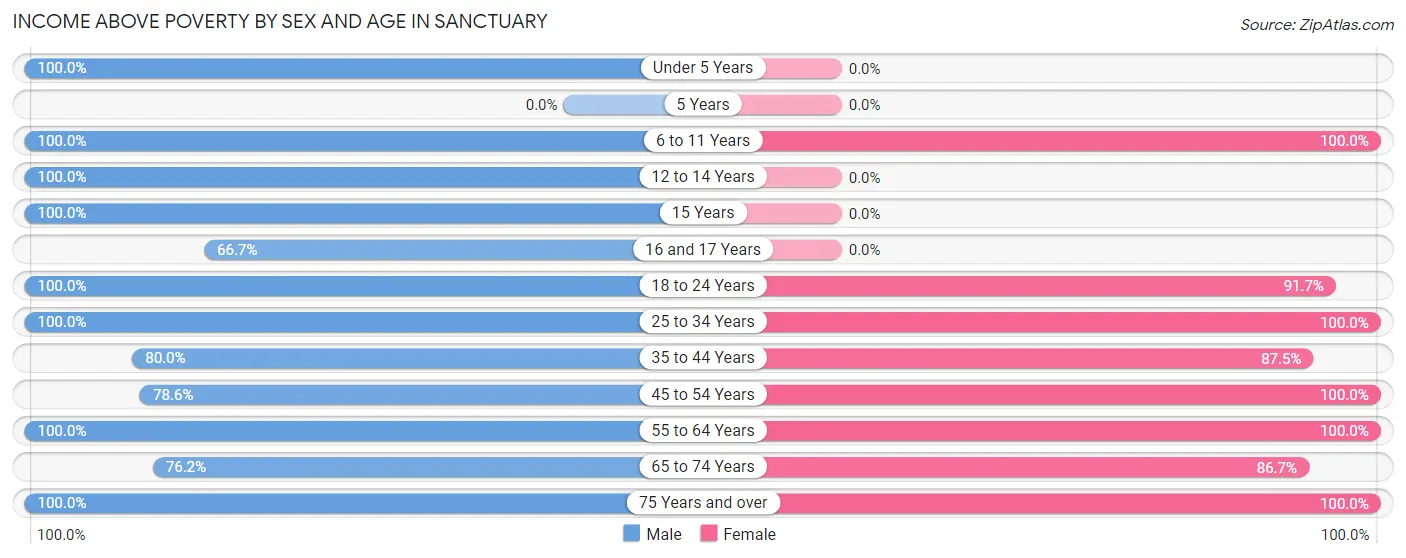
| Age Bracket | Male | Female |
| Under 5 Years | 7 (100.0%) | 0 (0.0%) |
| 5 Years | 0 (0.0%) | 0 (0.0%) |
| 6 to 11 Years | 8 (100.0%) | 7 (100.0%) |
| 12 to 14 Years | 2 (100.0%) | 0 (0.0%) |
| 15 Years | 1 (100.0%) | 0 (0.0%) |
| 16 and 17 Years | 2 (66.7%) | 0 (0.0%) |
| 18 to 24 Years | 6 (100.0%) | 11 (91.7%) |
| 25 to 34 Years | 16 (100.0%) | 19 (100.0%) |
| 35 to 44 Years | 16 (80.0%) | 7 (87.5%) |
| 45 to 54 Years | 11 (78.6%) | 23 (100.0%) |
| 55 to 64 Years | 20 (100.0%) | 20 (100.0%) |
| 65 to 74 Years | 16 (76.2%) | 26 (86.7%) |
| 75 Years and over | 7 (100.0%) | 4 (100.0%) |
| Total | 112 (89.6%) | 117 (92.9%) |
Income Below Poverty Among Married-Couple Families in Sanctuary
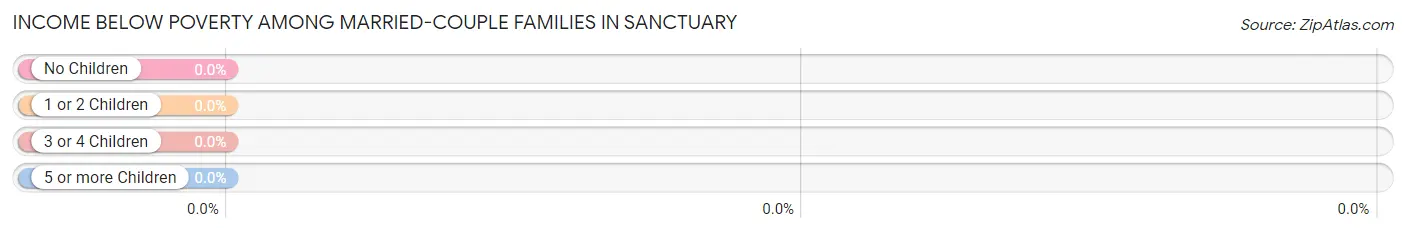
| Children | Above Poverty | Below Poverty |
| No Children | 30 (100.0%) | 0 (0.0%) |
| 1 or 2 Children | 18 (100.0%) | 0 (0.0%) |
| 3 or 4 Children | 2 (100.0%) | 0 (0.0%) |
| 5 or more Children | 0 (0.0%) | 0 (0.0%) |
| Total | 50 (100.0%) | 0 (0.0%) |
Income Below Poverty Among Single-Parent Households in Sanctuary
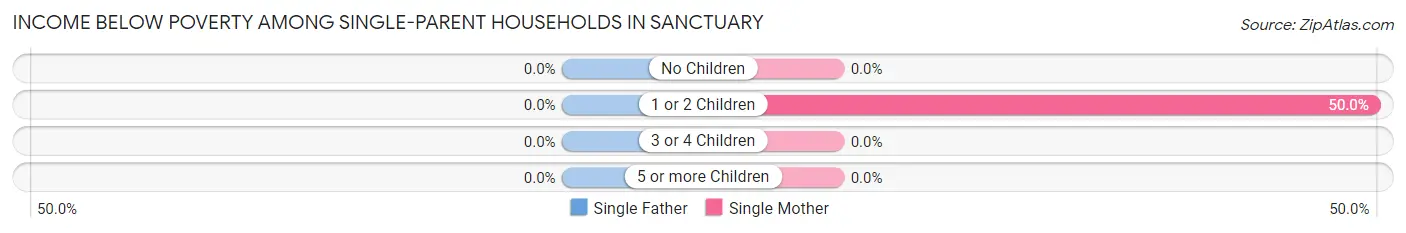
| Children | Single Father | Single Mother |
| No Children | 0 (0.0%) | 0 (0.0%) |
| 1 or 2 Children | 0 (0.0%) | 1 (50.0%) |
| 3 or 4 Children | 0 (0.0%) | 0 (0.0%) |
| 5 or more Children | 0 (0.0%) | 0 (0.0%) |
| Total | 0 (0.0%) | 1 (7.7%) |
Income Below Poverty Among Married-Couple vs Single-Parent Households in Sanctuary
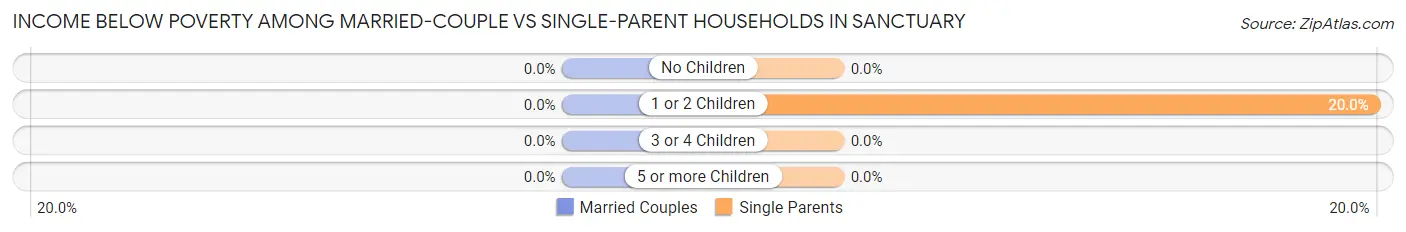
| Children | Married-Couple Families | Single-Parent Households |
| No Children | 0 (0.0%) | 0 (0.0%) |
| 1 or 2 Children | 0 (0.0%) | 1 (20.0%) |
| 3 or 4 Children | 0 (0.0%) | 0 (0.0%) |
| 5 or more Children | 0 (0.0%) | 0 (0.0%) |
| Total | 0 (0.0%) | 1 (5.6%) |
Employment Characteristics in Sanctuary
Employment by Class of Employer in Sanctuary
Among the 122 employed individuals in Sanctuary, private company employees (83 | 68.0%), state government employees (13 | 10.7%), and self-employed (not incorporated) (12 | 9.8%) make up the most common classes of employment.
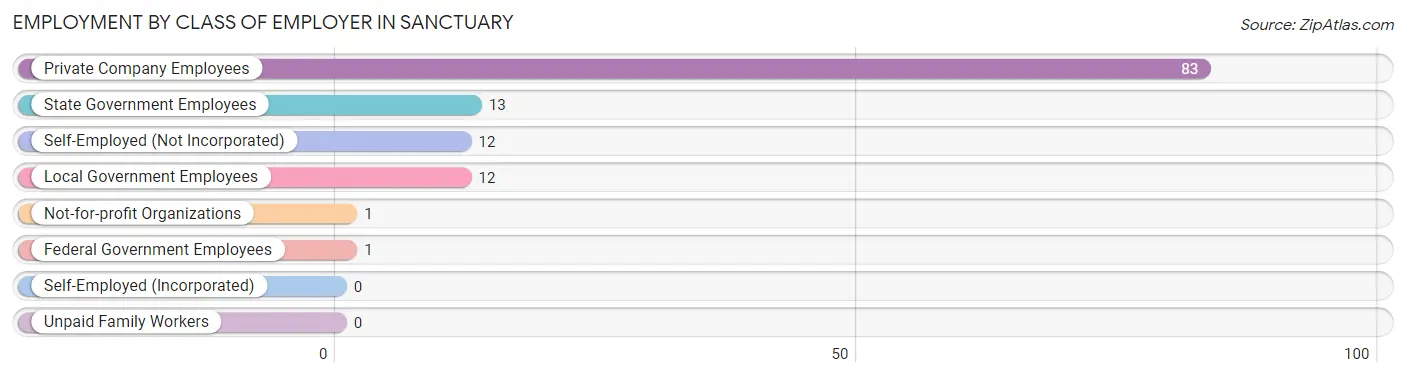
| Employer Class | # Employees | % Employees |
| Private Company Employees | 83 | 68.0% |
| Self-Employed (Incorporated) | 0 | 0.0% |
| Self-Employed (Not Incorporated) | 12 | 9.8% |
| Not-for-profit Organizations | 1 | 0.8% |
| Local Government Employees | 12 | 9.8% |
| State Government Employees | 13 | 10.7% |
| Federal Government Employees | 1 | 0.8% |
| Unpaid Family Workers | 0 | 0.0% |
| Total | 122 | 100.0% |
Employment Status by Age in Sanctuary
According to the labor force statistics for Sanctuary, out of the total population over 16 years of age (226), 59.3% or 134 individuals are in the labor force, with 9.0% or 12 of them unemployed. The age group with the highest labor force participation rate is 20 to 24 years, with 100.0% or 17 individuals in the labor force. Within the labor force, the 55 to 59 years age range has the highest percentage of unemployed individuals, with 41.7% or 5 of them being unemployed.
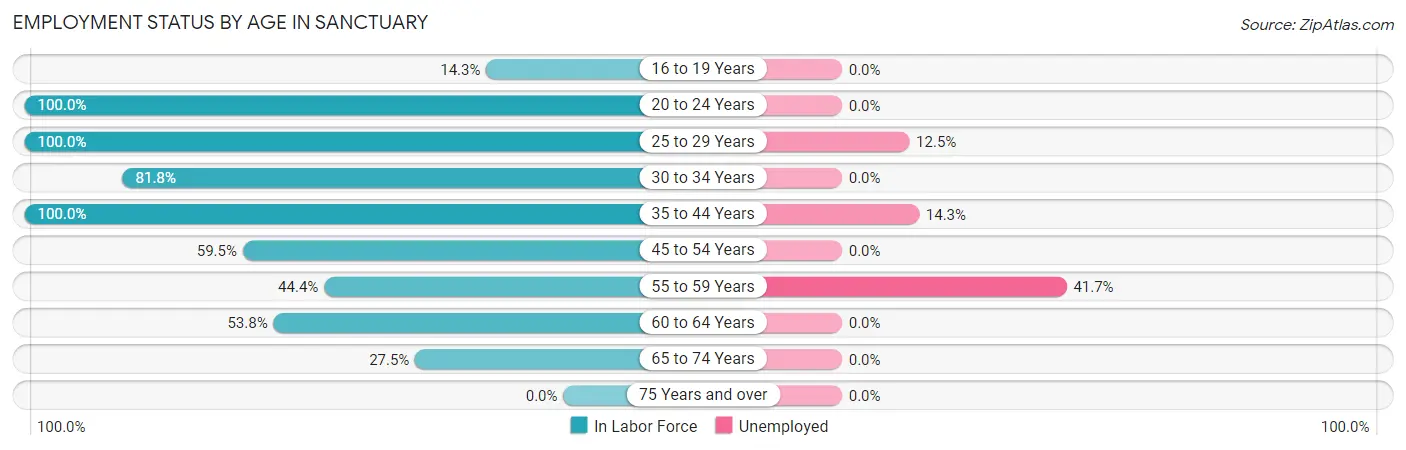
| Age Bracket | In Labor Force | Unemployed |
| 16 to 19 Years | 1 (14.3%) | 0 (0.0%) |
| 20 to 24 Years | 17 (100.0%) | 0 (0.0%) |
| 25 to 29 Years | 24 (100.0%) | 3 (12.5%) |
| 30 to 34 Years | 9 (81.8%) | 0 (0.0%) |
| 35 to 44 Years | 28 (100.0%) | 4 (14.3%) |
| 45 to 54 Years | 22 (59.5%) | 0 (0.0%) |
| 55 to 59 Years | 12 (44.4%) | 5 (41.7%) |
| 60 to 64 Years | 7 (53.8%) | 0 (0.0%) |
| 65 to 74 Years | 14 (27.5%) | 0 (0.0%) |
| 75 Years and over | 0 (0.0%) | 0 (0.0%) |
| Total | 134 (59.3%) | 12 (9.0%) |
Employment Status by Educational Attainment in Sanctuary
According to labor force statistics for Sanctuary, 72.9% of individuals (102) out of the total population between 25 and 64 years of age (140) are in the labor force, with 11.8% or 12 of them being unemployed. The group with the highest labor force participation rate are those with the educational attainment of less than high school, with 100.0% or 10 individuals in the labor force. Within the labor force, individuals with bachelor's degree or higher education have the highest percentage of unemployment, with 33.3% or 3 of them being unemployed.
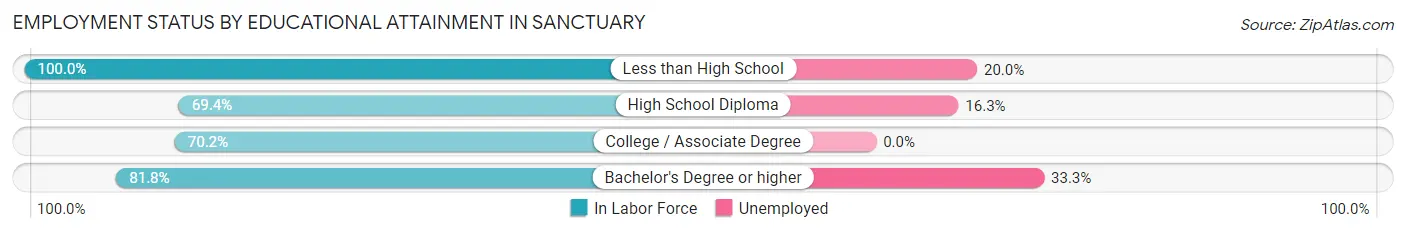
| Educational Attainment | In Labor Force | Unemployed |
| Less than High School | 10 (100.0%) | 2 (20.0%) |
| High School Diploma | 43 (69.4%) | 10 (16.3%) |
| College / Associate Degree | 40 (70.2%) | 0 (0.0%) |
| Bachelor's Degree or higher | 9 (81.8%) | 4 (33.3%) |
| Total | 102 (72.9%) | 17 (11.8%) |
Employment Occupations by Sex in Sanctuary
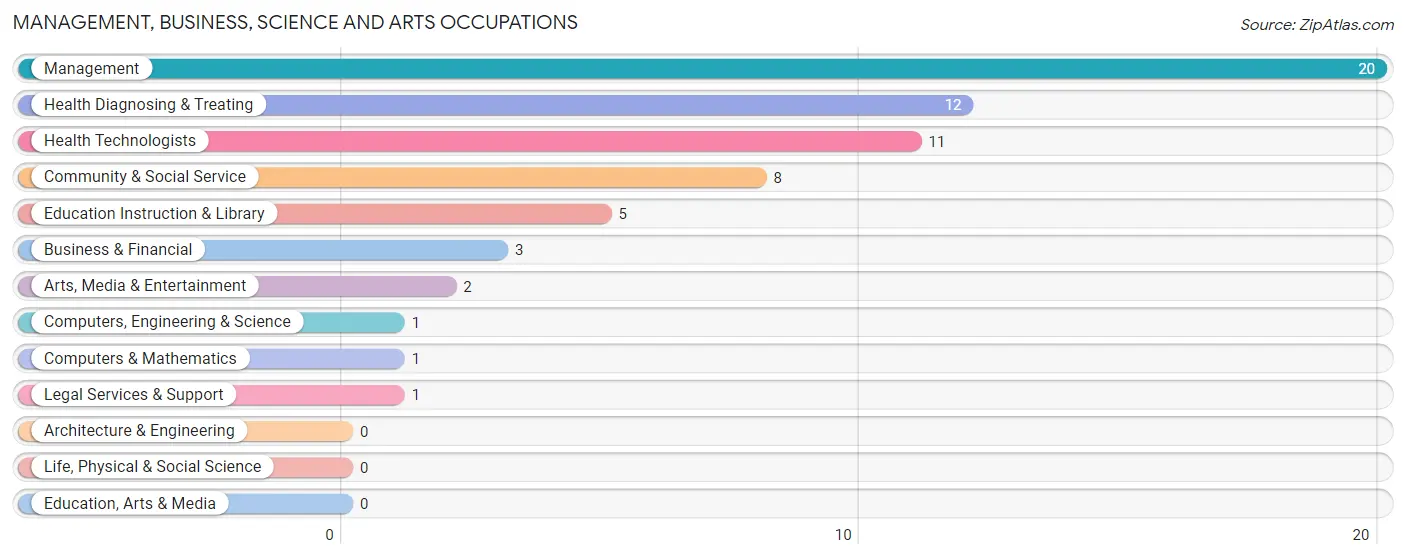
Management, Business, Science and Arts Occupations
The most common Management, Business, Science and Arts occupations in Sanctuary are Management (20 | 16.4%), Health Diagnosing & Treating (12 | 9.8%), Health Technologists (11 | 9.0%), Community & Social Service (8 | 6.6%), and Education Instruction & Library (5 | 4.1%).
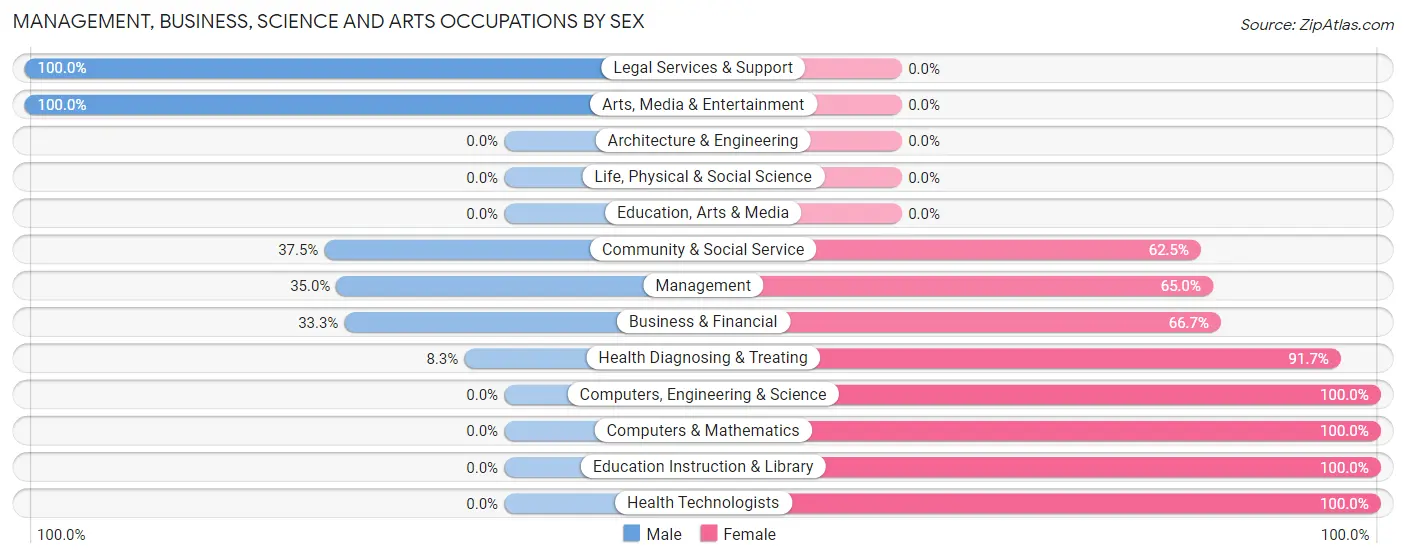
Management, Business, Science and Arts Occupations by Sex
Within the Management, Business, Science and Arts occupations in Sanctuary, the most male-oriented occupations are Legal Services & Support (100.0%), Arts, Media & Entertainment (100.0%), and Community & Social Service (37.5%), while the most female-oriented occupations are Computers, Engineering & Science (100.0%), Computers & Mathematics (100.0%), and Education Instruction & Library (100.0%).
| Occupation | Male | Female |
| Management | 7 (35.0%) | 13 (65.0%) |
| Business & Financial | 1 (33.3%) | 2 (66.7%) |
| Computers, Engineering & Science | 0 (0.0%) | 1 (100.0%) |
| Computers & Mathematics | 0 (0.0%) | 1 (100.0%) |
| Architecture & Engineering | 0 (0.0%) | 0 (0.0%) |
| Life, Physical & Social Science | 0 (0.0%) | 0 (0.0%) |
| Community & Social Service | 3 (37.5%) | 5 (62.5%) |
| Education, Arts & Media | 0 (0.0%) | 0 (0.0%) |
| Legal Services & Support | 1 (100.0%) | 0 (0.0%) |
| Education Instruction & Library | 0 (0.0%) | 5 (100.0%) |
| Arts, Media & Entertainment | 2 (100.0%) | 0 (0.0%) |
| Health Diagnosing & Treating | 1 (8.3%) | 11 (91.7%) |
| Health Technologists | 0 (0.0%) | 11 (100.0%) |
| Total (Category) | 12 (27.3%) | 32 (72.7%) |
| Total (Overall) | 56 (45.9%) | 66 (54.1%) |
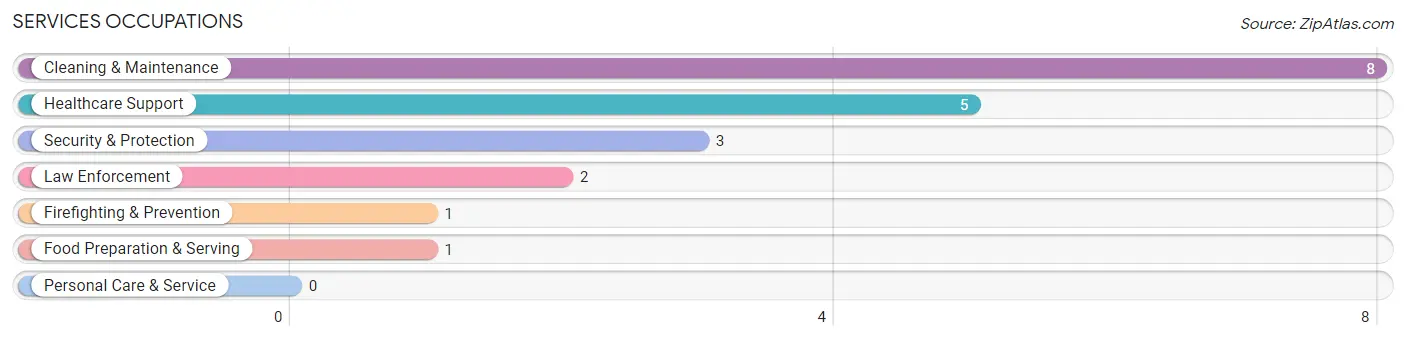
Services Occupations
The most common Services occupations in Sanctuary are Cleaning & Maintenance (8 | 6.6%), Healthcare Support (5 | 4.1%), Security & Protection (3 | 2.5%), Law Enforcement (2 | 1.6%), and Firefighting & Prevention (1 | 0.8%).
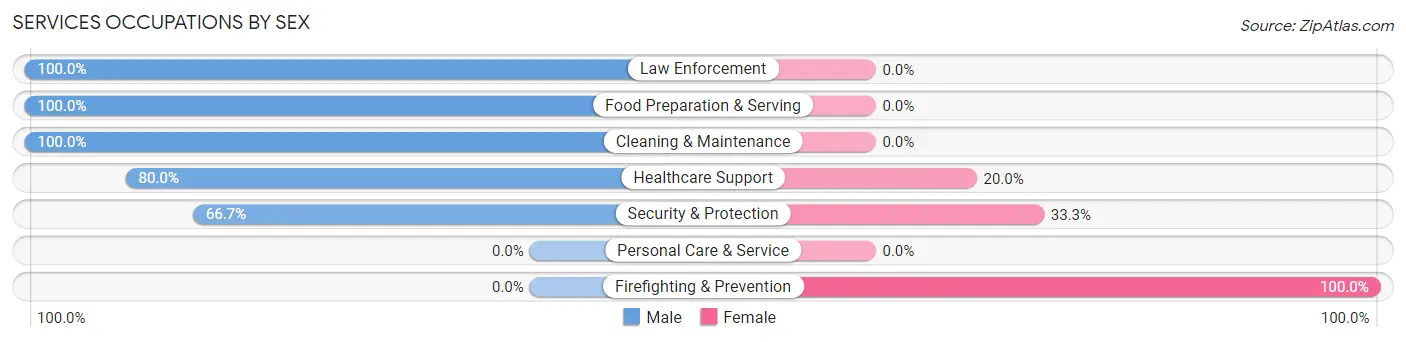
Services Occupations by Sex
Within the Services occupations in Sanctuary, the most male-oriented occupations are Law Enforcement (100.0%), Food Preparation & Serving (100.0%), and Cleaning & Maintenance (100.0%), while the most female-oriented occupations are Firefighting & Prevention (100.0%), Security & Protection (33.3%), and Healthcare Support (20.0%).
| Occupation | Male | Female |
| Healthcare Support | 4 (80.0%) | 1 (20.0%) |
| Security & Protection | 2 (66.7%) | 1 (33.3%) |
| Firefighting & Prevention | 0 (0.0%) | 1 (100.0%) |
| Law Enforcement | 2 (100.0%) | 0 (0.0%) |
| Food Preparation & Serving | 1 (100.0%) | 0 (0.0%) |
| Cleaning & Maintenance | 8 (100.0%) | 0 (0.0%) |
| Personal Care & Service | 0 (0.0%) | 0 (0.0%) |
| Total (Category) | 15 (88.2%) | 2 (11.8%) |
| Total (Overall) | 56 (45.9%) | 66 (54.1%) |
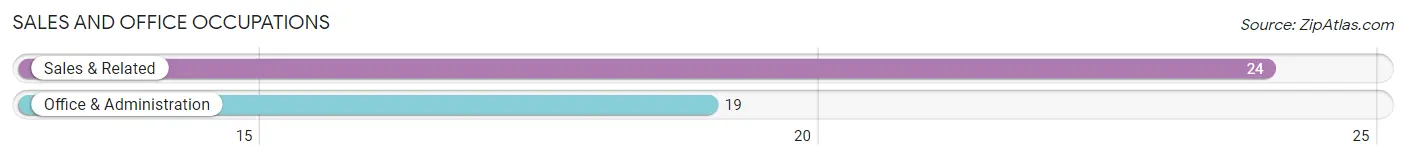
Sales and Office Occupations
The most common Sales and Office occupations in Sanctuary are Sales & Related (24 | 19.7%), and Office & Administration (19 | 15.6%).
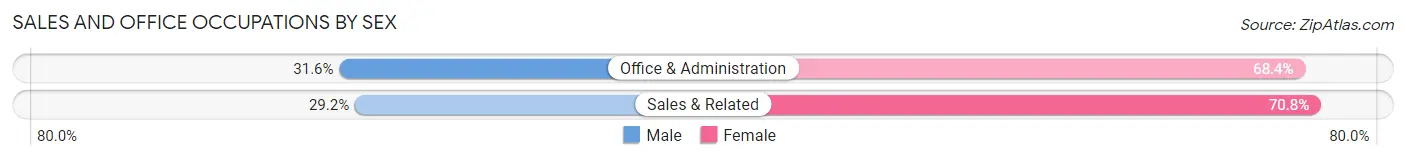
Sales and Office Occupations by Sex
| Occupation | Male | Female |
| Sales & Related | 7 (29.2%) | 17 (70.8%) |
| Office & Administration | 6 (31.6%) | 13 (68.4%) |
| Total (Category) | 13 (30.2%) | 30 (69.8%) |
| Total (Overall) | 56 (45.9%) | 66 (54.1%) |
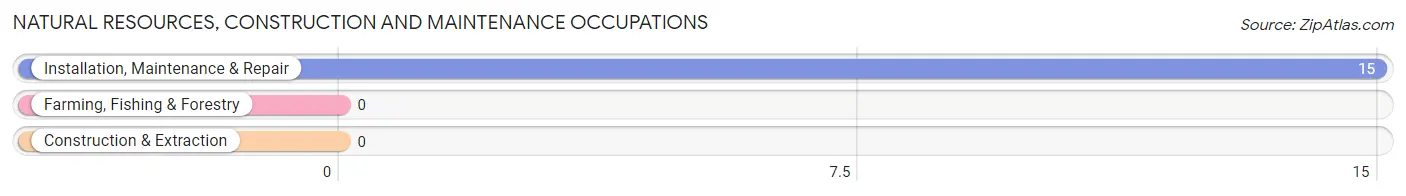
Natural Resources, Construction and Maintenance Occupations
The most common Natural Resources, Construction and Maintenance occupations in Sanctuary are , and Installation, Maintenance & Repair (15 | 12.3%).
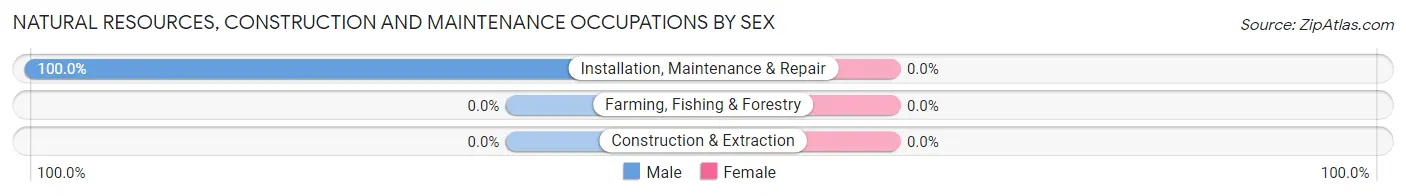
Natural Resources, Construction and Maintenance Occupations by Sex
| Occupation | Male | Female |
| Farming, Fishing & Forestry | 0 (0.0%) | 0 (0.0%) |
| Construction & Extraction | 0 (0.0%) | 0 (0.0%) |
| Installation, Maintenance & Repair | 15 (100.0%) | 0 (0.0%) |
| Total (Category) | 15 (100.0%) | 0 (0.0%) |
| Total (Overall) | 56 (45.9%) | 66 (54.1%) |
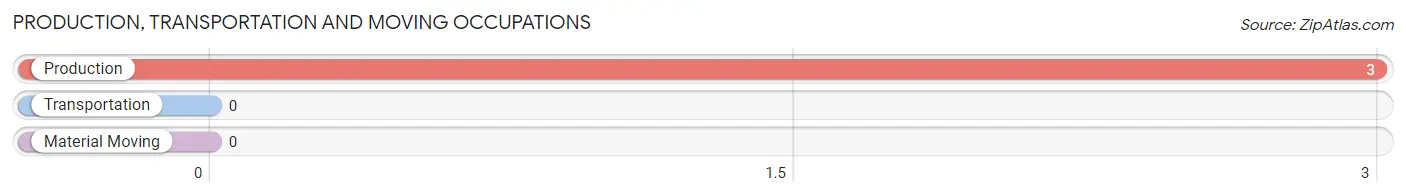
Production, Transportation and Moving Occupations
The most common Production, Transportation and Moving occupations in Sanctuary are , and Production (3 | 2.5%).
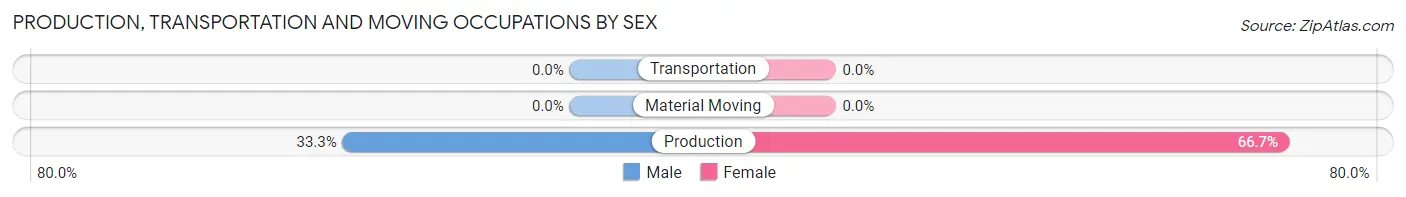
Production, Transportation and Moving Occupations by Sex
| Occupation | Male | Female |
| Production | 1 (33.3%) | 2 (66.7%) |
| Transportation | 0 (0.0%) | 0 (0.0%) |
| Material Moving | 0 (0.0%) | 0 (0.0%) |
| Total (Category) | 1 (33.3%) | 2 (66.7%) |
| Total (Overall) | 56 (45.9%) | 66 (54.1%) |
Employment Industries by Sex in Sanctuary
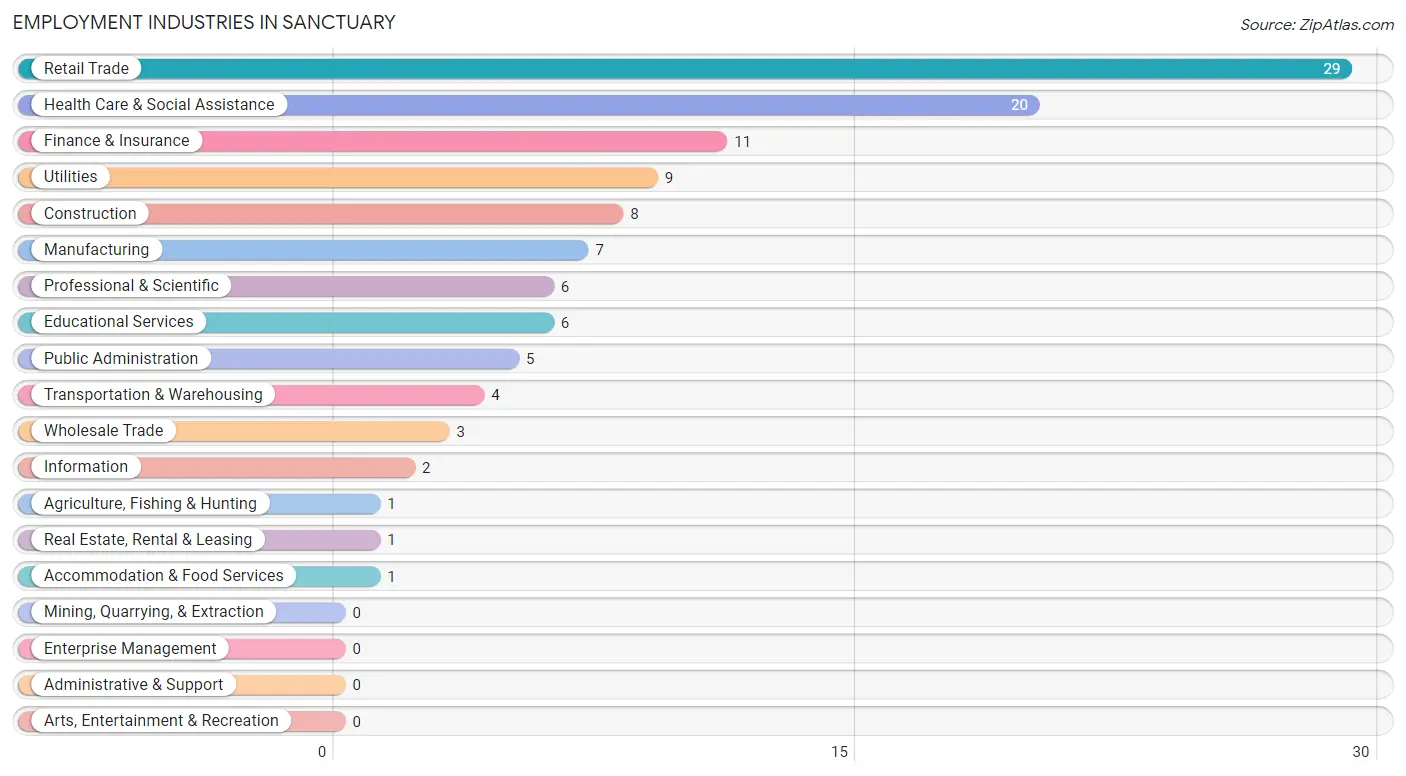
Employment Industries in Sanctuary
The major employment industries in Sanctuary include Retail Trade (29 | 23.8%), Health Care & Social Assistance (20 | 16.4%), Finance & Insurance (11 | 9.0%), Utilities (9 | 7.4%), and Construction (8 | 6.6%).
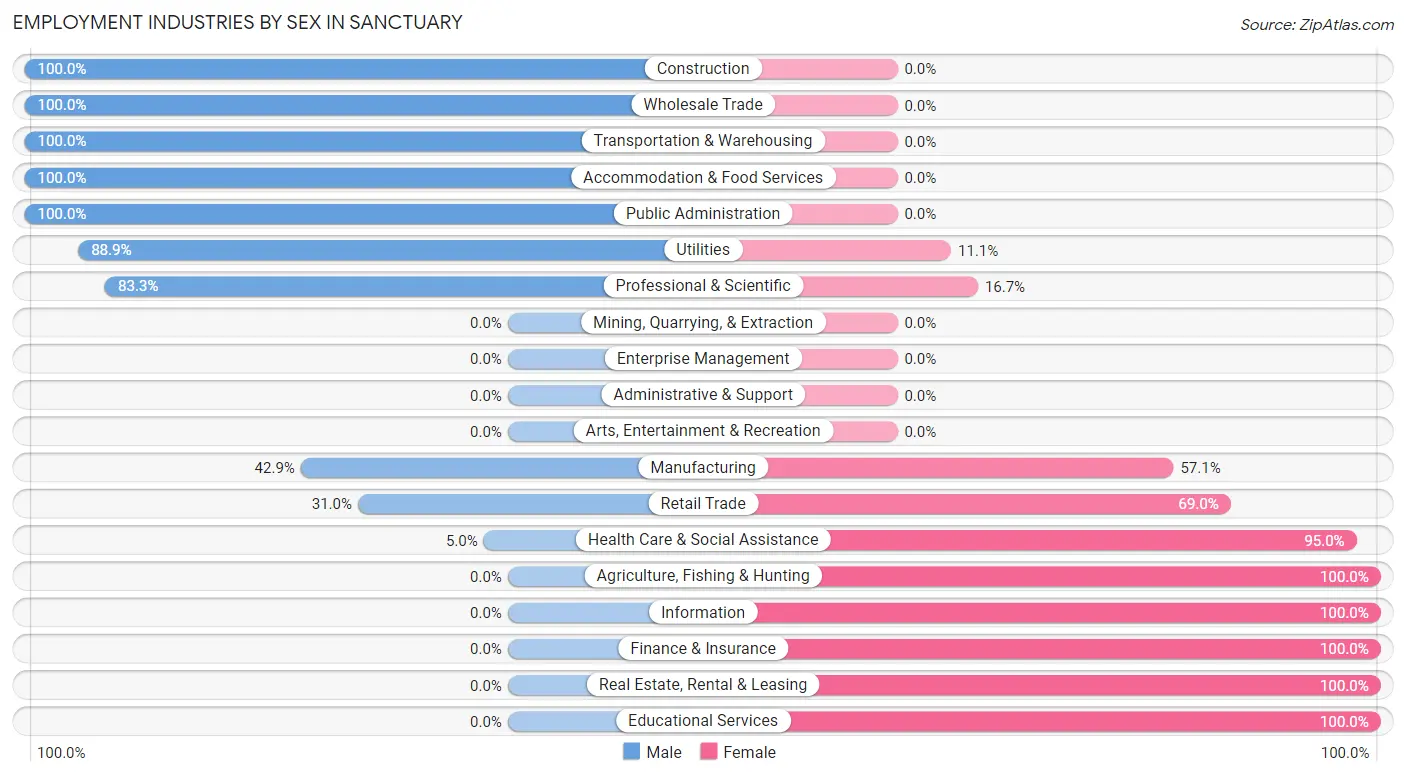
Employment Industries by Sex in Sanctuary
The Sanctuary industries that see more men than women are Construction (100.0%), Wholesale Trade (100.0%), and Transportation & Warehousing (100.0%), whereas the industries that tend to have a higher number of women are Agriculture, Fishing & Hunting (100.0%), Information (100.0%), and Finance & Insurance (100.0%).
| Industry | Male | Female |
| Agriculture, Fishing & Hunting | 0 (0.0%) | 1 (100.0%) |
| Mining, Quarrying, & Extraction | 0 (0.0%) | 0 (0.0%) |
| Construction | 8 (100.0%) | 0 (0.0%) |
| Manufacturing | 3 (42.9%) | 4 (57.1%) |
| Wholesale Trade | 3 (100.0%) | 0 (0.0%) |
| Retail Trade | 9 (31.0%) | 20 (69.0%) |
| Transportation & Warehousing | 4 (100.0%) | 0 (0.0%) |
| Utilities | 8 (88.9%) | 1 (11.1%) |
| Information | 0 (0.0%) | 2 (100.0%) |
| Finance & Insurance | 0 (0.0%) | 11 (100.0%) |
| Real Estate, Rental & Leasing | 0 (0.0%) | 1 (100.0%) |
| Professional & Scientific | 5 (83.3%) | 1 (16.7%) |
| Enterprise Management | 0 (0.0%) | 0 (0.0%) |
| Administrative & Support | 0 (0.0%) | 0 (0.0%) |
| Educational Services | 0 (0.0%) | 6 (100.0%) |
| Health Care & Social Assistance | 1 (5.0%) | 19 (95.0%) |
| Arts, Entertainment & Recreation | 0 (0.0%) | 0 (0.0%) |
| Accommodation & Food Services | 1 (100.0%) | 0 (0.0%) |
| Public Administration | 5 (100.0%) | 0 (0.0%) |
| Total | 56 (45.9%) | 66 (54.1%) |
Education in Sanctuary
School Enrollment in Sanctuary
The most common levels of schooling among the 51 students in Sanctuary are college / undergraduate (16 | 31.4%), elementary school (9 | 17.6%), and middle school (7 | 13.7%).
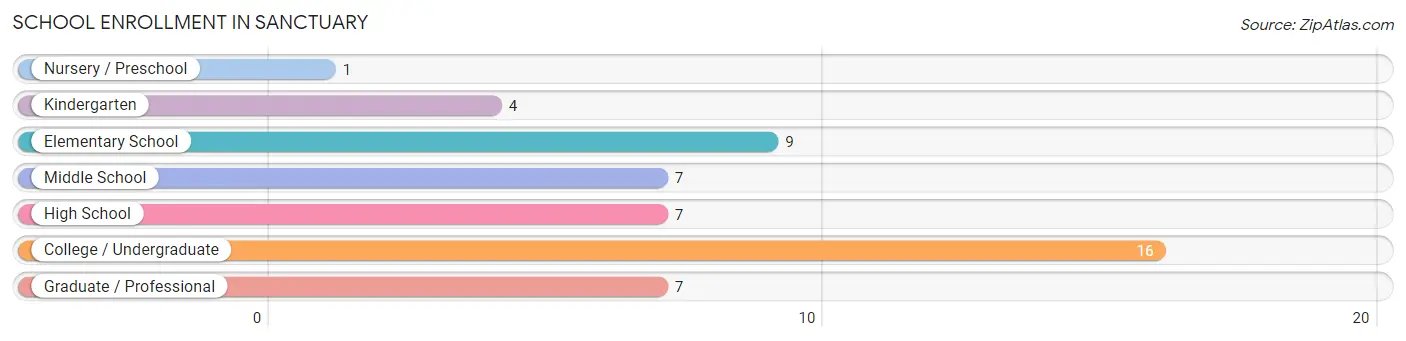
| School Level | # Students | % Students |
| Nursery / Preschool | 1 | 2.0% |
| Kindergarten | 4 | 7.8% |
| Elementary School | 9 | 17.6% |
| Middle School | 7 | 13.7% |
| High School | 7 | 13.7% |
| College / Undergraduate | 16 | 31.4% |
| Graduate / Professional | 7 | 13.7% |
| Total | 51 | 100.0% |
School Enrollment by Age by Funding Source in Sanctuary
Out of a total of 51 students who are enrolled in schools in Sanctuary, 7 (13.7%) attend a private institution, while the remaining 44 (86.3%) are enrolled in public schools. The age group of 25 to 34 year olds has the highest likelihood of being enrolled in private schools, with 3 (42.9% in the age bracket) enrolled. Conversely, the age group of 3 to 4 year olds has the lowest likelihood of being enrolled in a private school, with 1 (100.0% in the age bracket) attending a public institution.
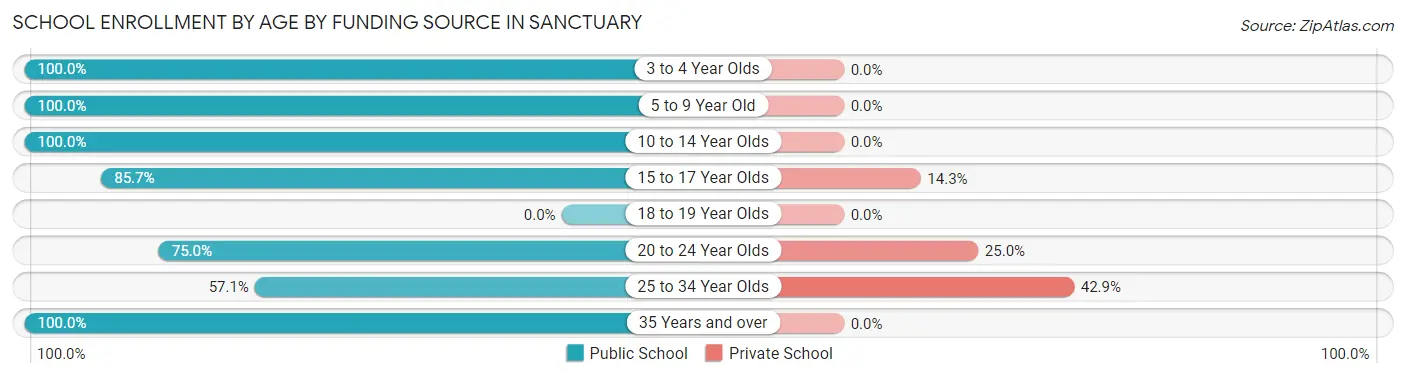
| Age Bracket | Public School | Private School |
| 3 to 4 Year Olds | 1 (100.0%) | 0 (0.0%) |
| 5 to 9 Year Old | 6 (100.0%) | 0 (0.0%) |
| 10 to 14 Year Olds | 14 (100.0%) | 0 (0.0%) |
| 15 to 17 Year Olds | 6 (85.7%) | 1 (14.3%) |
| 18 to 19 Year Olds | 0 (0.0%) | 0 (0.0%) |
| 20 to 24 Year Olds | 9 (75.0%) | 3 (25.0%) |
| 25 to 34 Year Olds | 4 (57.1%) | 3 (42.9%) |
| 35 Years and over | 4 (100.0%) | 0 (0.0%) |
| Total | 44 (86.3%) | 7 (13.7%) |
Educational Attainment by Field of Study in Sanctuary
Education (6 | 24.0%), computers & mathematics (4 | 16.0%), bio, nature & agricultural (4 | 16.0%), business (4 | 16.0%), and arts & humanities (3 | 12.0%) are the most common fields of study among 25 individuals in Sanctuary who have obtained a bachelor's degree or higher.
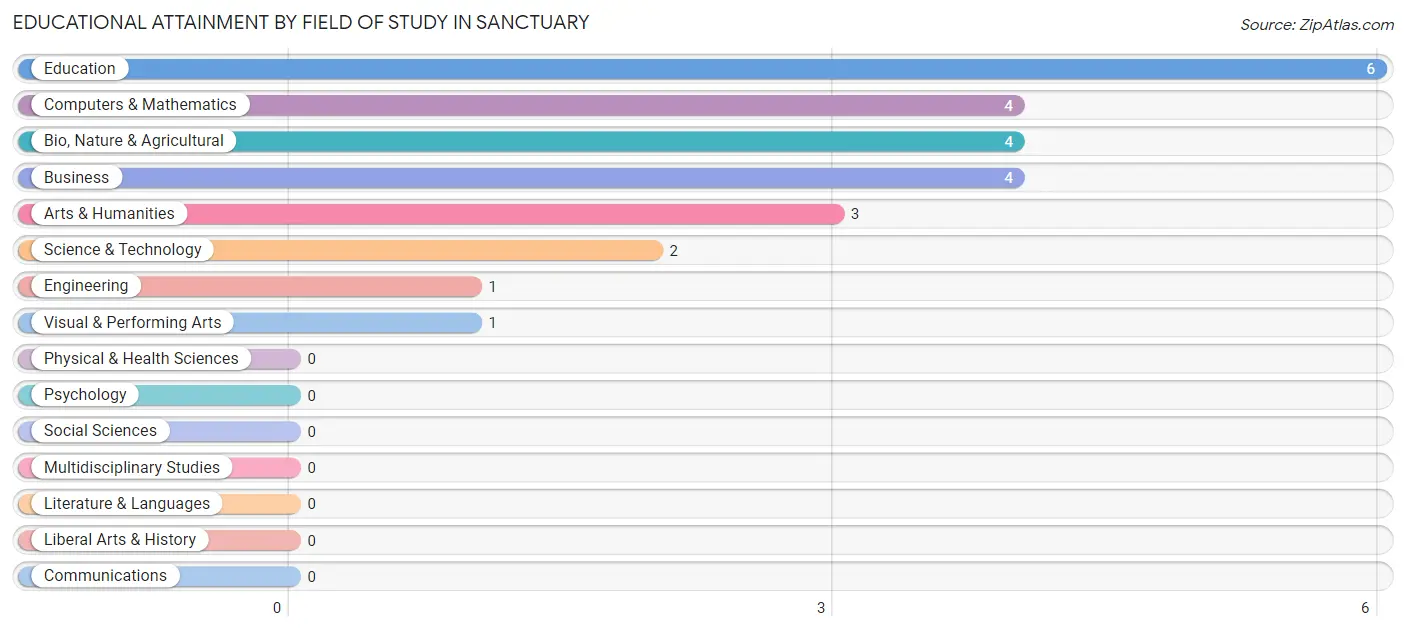
| Field of Study | # Graduates | % Graduates |
| Computers & Mathematics | 4 | 16.0% |
| Bio, Nature & Agricultural | 4 | 16.0% |
| Physical & Health Sciences | 0 | 0.0% |
| Psychology | 0 | 0.0% |
| Social Sciences | 0 | 0.0% |
| Engineering | 1 | 4.0% |
| Multidisciplinary Studies | 0 | 0.0% |
| Science & Technology | 2 | 8.0% |
| Business | 4 | 16.0% |
| Education | 6 | 24.0% |
| Literature & Languages | 0 | 0.0% |
| Liberal Arts & History | 0 | 0.0% |
| Visual & Performing Arts | 1 | 4.0% |
| Communications | 0 | 0.0% |
| Arts & Humanities | 3 | 12.0% |
| Total | 25 | 100.0% |
Transportation & Commute in Sanctuary
Vehicle Availability by Sex in Sanctuary
The most prevalent vehicle ownership categories in Sanctuary are males with 3 vehicles (24, accounting for 42.9%) and females with 3 vehicles (40, making up 36.4%).
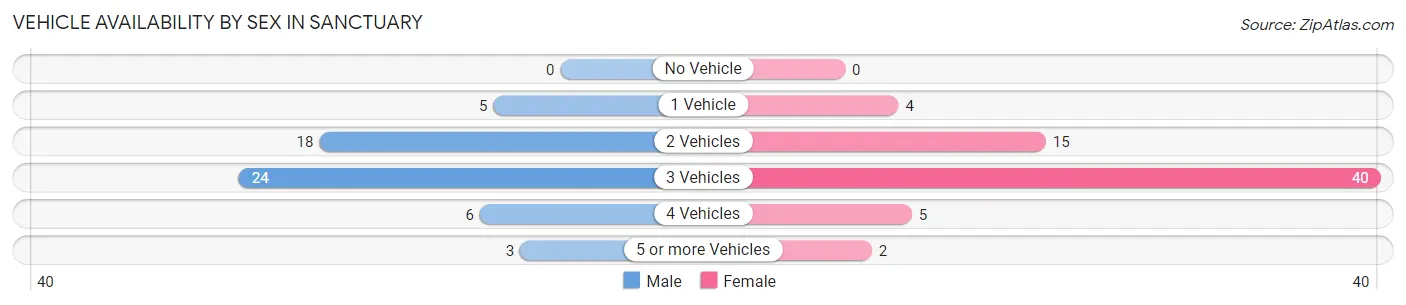
| Vehicles Available | Male | Female |
| No Vehicle | 0 (0.0%) | 0 (0.0%) |
| 1 Vehicle | 5 (8.9%) | 4 (6.1%) |
| 2 Vehicles | 18 (32.1%) | 15 (22.7%) |
| 3 Vehicles | 24 (42.9%) | 40 (60.6%) |
| 4 Vehicles | 6 (10.7%) | 5 (7.6%) |
| 5 or more Vehicles | 3 (5.4%) | 2 (3.0%) |
| Total | 56 (100.0%) | 66 (100.0%) |
Commute Time in Sanctuary
The most frequently occuring commute durations in Sanctuary are 45 to 59 minutes (26 commuters, 21.8%), 30 to 34 minutes (23 commuters, 19.3%), and 10 to 14 minutes (15 commuters, 12.6%).
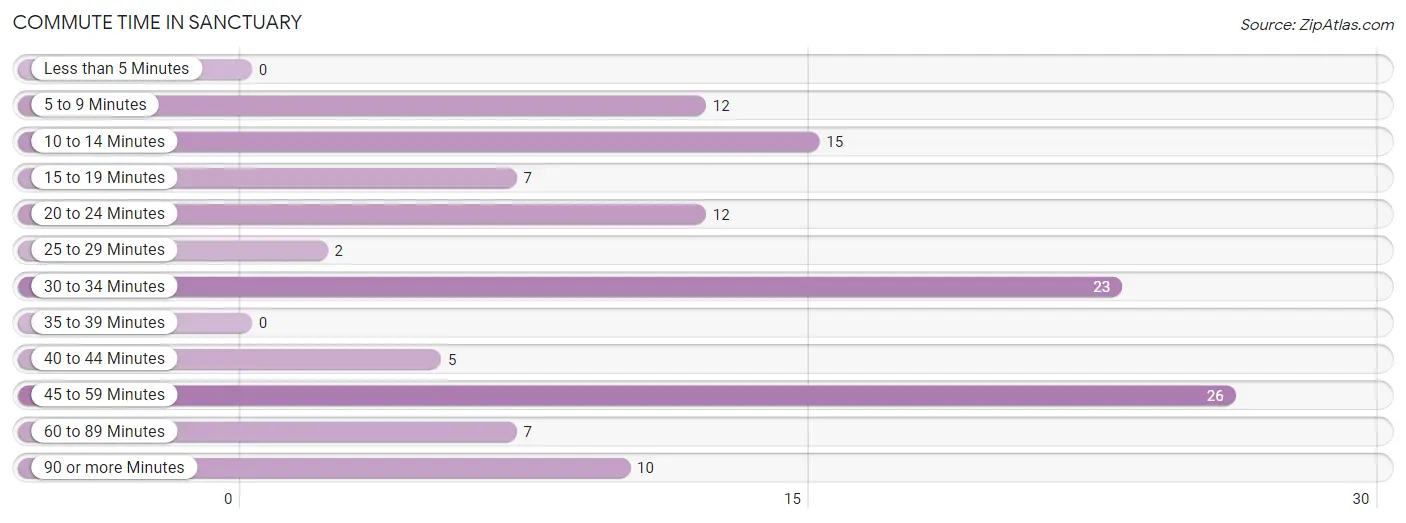
| Commute Time | # Commuters | % Commuters |
| Less than 5 Minutes | 0 | 0.0% |
| 5 to 9 Minutes | 12 | 10.1% |
| 10 to 14 Minutes | 15 | 12.6% |
| 15 to 19 Minutes | 7 | 5.9% |
| 20 to 24 Minutes | 12 | 10.1% |
| 25 to 29 Minutes | 2 | 1.7% |
| 30 to 34 Minutes | 23 | 19.3% |
| 35 to 39 Minutes | 0 | 0.0% |
| 40 to 44 Minutes | 5 | 4.2% |
| 45 to 59 Minutes | 26 | 21.8% |
| 60 to 89 Minutes | 7 | 5.9% |
| 90 or more Minutes | 10 | 8.4% |
Commute Time by Sex in Sanctuary
The most common commute times in Sanctuary are 45 to 59 minutes (19 commuters, 34.5%) for males and 30 to 34 minutes (16 commuters, 25.0%) for females.
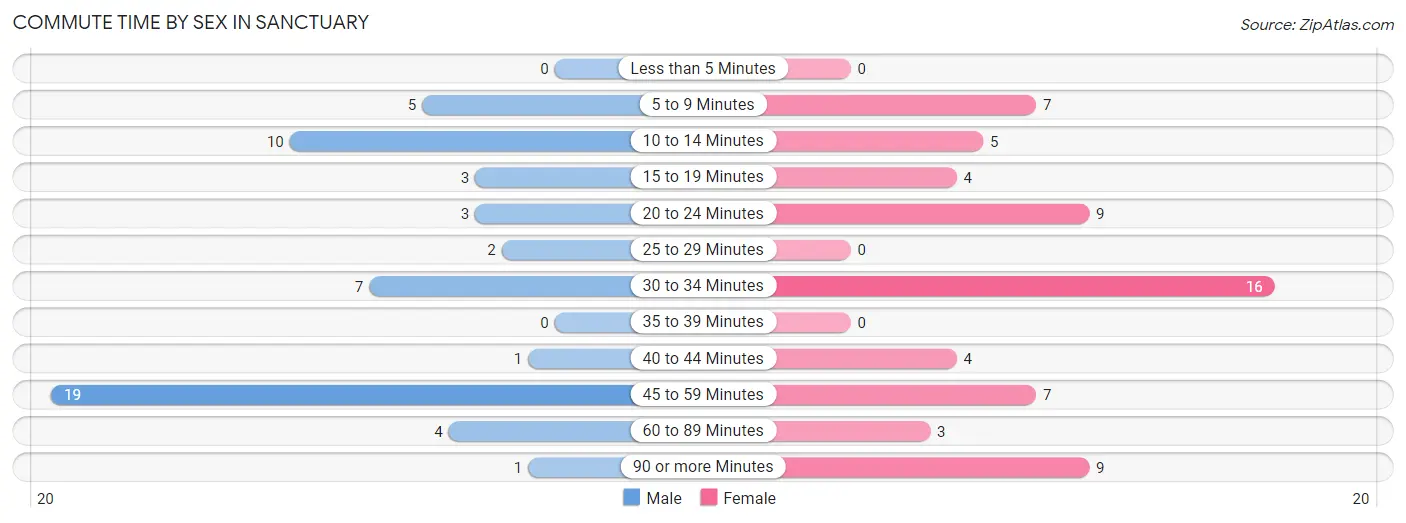
| Commute Time | Male | Female |
| Less than 5 Minutes | 0 (0.0%) | 0 (0.0%) |
| 5 to 9 Minutes | 5 (9.1%) | 7 (10.9%) |
| 10 to 14 Minutes | 10 (18.2%) | 5 (7.8%) |
| 15 to 19 Minutes | 3 (5.4%) | 4 (6.2%) |
| 20 to 24 Minutes | 3 (5.4%) | 9 (14.1%) |
| 25 to 29 Minutes | 2 (3.6%) | 0 (0.0%) |
| 30 to 34 Minutes | 7 (12.7%) | 16 (25.0%) |
| 35 to 39 Minutes | 0 (0.0%) | 0 (0.0%) |
| 40 to 44 Minutes | 1 (1.8%) | 4 (6.2%) |
| 45 to 59 Minutes | 19 (34.5%) | 7 (10.9%) |
| 60 to 89 Minutes | 4 (7.3%) | 3 (4.7%) |
| 90 or more Minutes | 1 (1.8%) | 9 (14.1%) |
Time of Departure to Work by Sex in Sanctuary
The most frequent times of departure to work in Sanctuary are 7:00 AM to 7:29 AM (28, 50.9%) for males and 7:00 AM to 7:29 AM (18, 28.1%) for females.
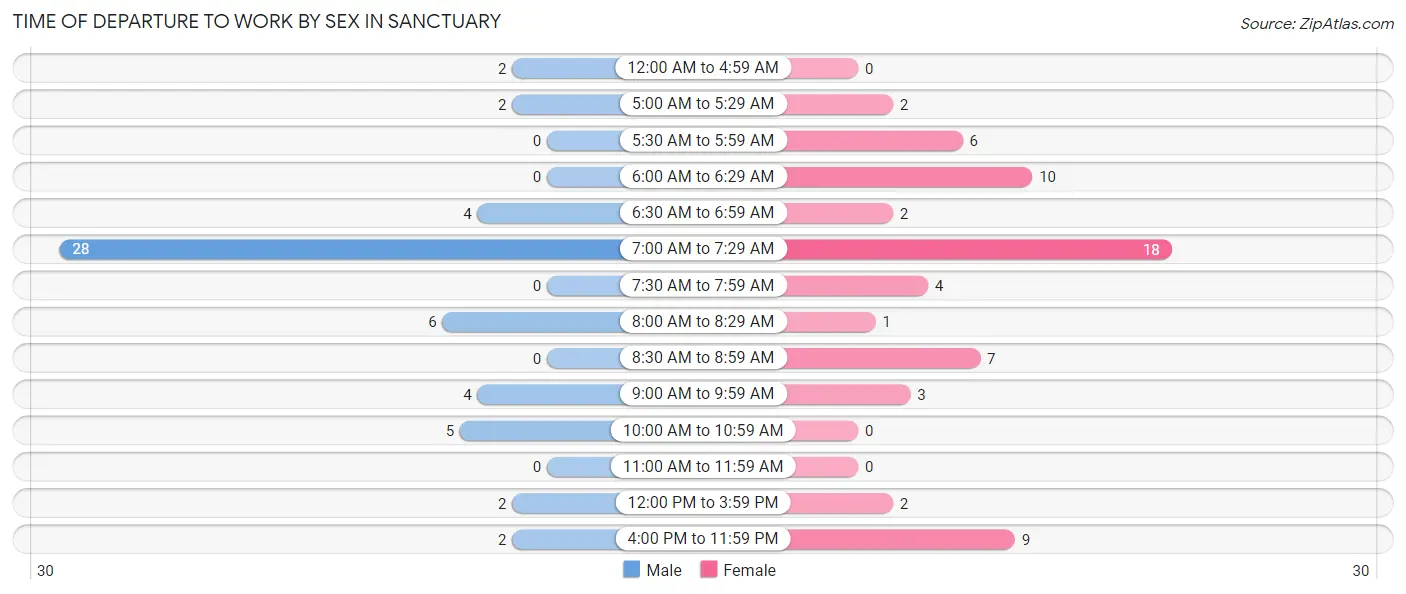
| Time of Departure | Male | Female |
| 12:00 AM to 4:59 AM | 2 (3.6%) | 0 (0.0%) |
| 5:00 AM to 5:29 AM | 2 (3.6%) | 2 (3.1%) |
| 5:30 AM to 5:59 AM | 0 (0.0%) | 6 (9.4%) |
| 6:00 AM to 6:29 AM | 0 (0.0%) | 10 (15.6%) |
| 6:30 AM to 6:59 AM | 4 (7.3%) | 2 (3.1%) |
| 7:00 AM to 7:29 AM | 28 (50.9%) | 18 (28.1%) |
| 7:30 AM to 7:59 AM | 0 (0.0%) | 4 (6.2%) |
| 8:00 AM to 8:29 AM | 6 (10.9%) | 1 (1.6%) |
| 8:30 AM to 8:59 AM | 0 (0.0%) | 7 (10.9%) |
| 9:00 AM to 9:59 AM | 4 (7.3%) | 3 (4.7%) |
| 10:00 AM to 10:59 AM | 5 (9.1%) | 0 (0.0%) |
| 11:00 AM to 11:59 AM | 0 (0.0%) | 0 (0.0%) |
| 12:00 PM to 3:59 PM | 2 (3.6%) | 2 (3.1%) |
| 4:00 PM to 11:59 PM | 2 (3.6%) | 9 (14.1%) |
| Total | 55 (100.0%) | 64 (100.0%) |
Housing Occupancy in Sanctuary
Occupancy by Ownership in Sanctuary
Of the total 97 dwellings in Sanctuary, owner-occupied units account for 84 (86.6%), while renter-occupied units make up 13 (13.4%).
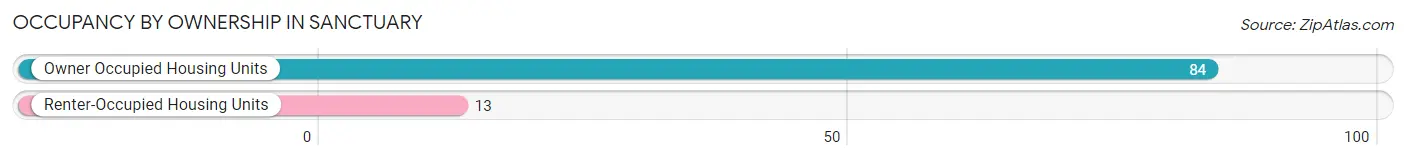
| Occupancy | # Housing Units | % Housing Units |
| Owner Occupied Housing Units | 84 | 86.6% |
| Renter-Occupied Housing Units | 13 | 13.4% |
| Total Occupied Housing Units | 97 | 100.0% |
Occupancy by Household Size in Sanctuary
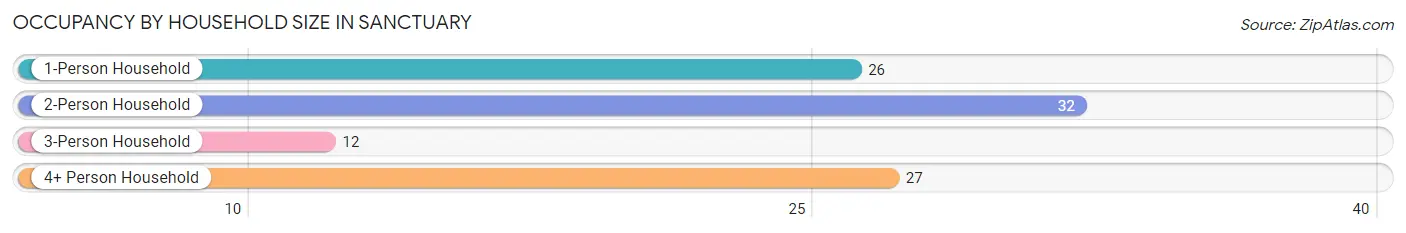
| Household Size | # Housing Units | % Housing Units |
| 1-Person Household | 26 | 26.8% |
| 2-Person Household | 32 | 33.0% |
| 3-Person Household | 12 | 12.4% |
| 4+ Person Household | 27 | 27.8% |
| Total Housing Units | 97 | 100.0% |
Occupancy by Ownership by Household Size in Sanctuary
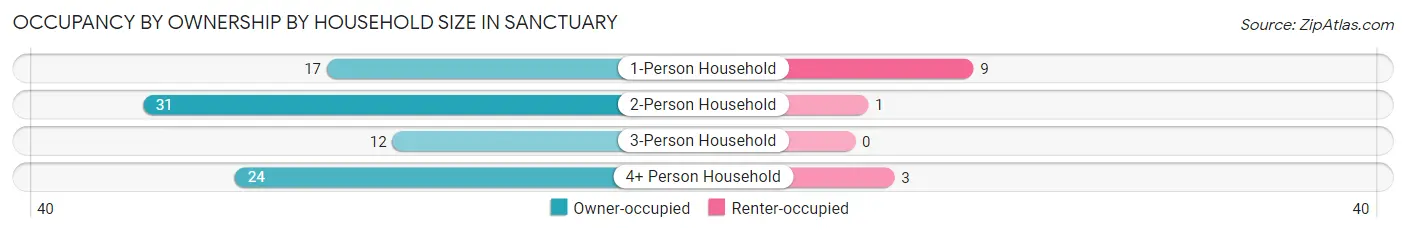
| Household Size | Owner-occupied | Renter-occupied |
| 1-Person Household | 17 (65.4%) | 9 (34.6%) |
| 2-Person Household | 31 (96.9%) | 1 (3.1%) |
| 3-Person Household | 12 (100.0%) | 0 (0.0%) |
| 4+ Person Household | 24 (88.9%) | 3 (11.1%) |
| Total Housing Units | 84 (86.6%) | 13 (13.4%) |
Occupancy by Educational Attainment in Sanctuary
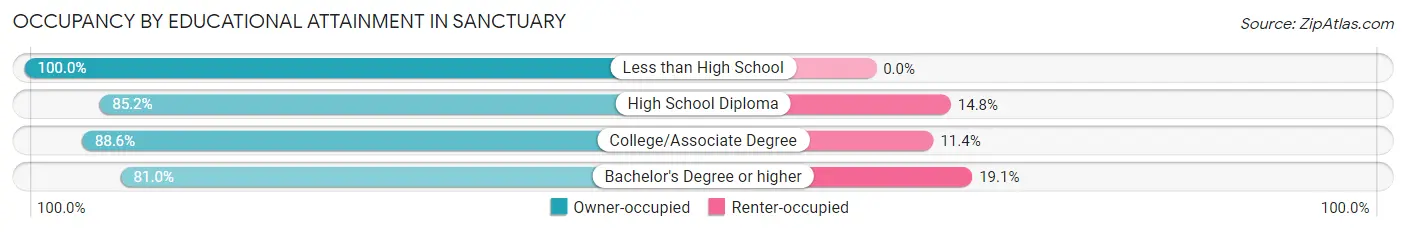
| Household Size | Owner-occupied | Renter-occupied |
| Less than High School | 5 (100.0%) | 0 (0.0%) |
| High School Diploma | 23 (85.2%) | 4 (14.8%) |
| College/Associate Degree | 39 (88.6%) | 5 (11.4%) |
| Bachelor's Degree or higher | 17 (80.9%) | 4 (19.1%) |
Occupancy by Age of Householder in Sanctuary
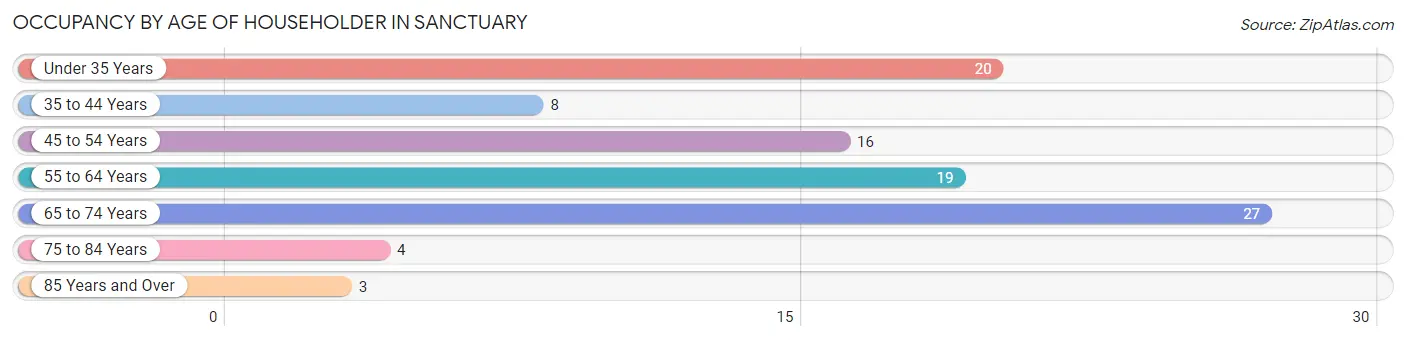
| Age Bracket | # Households | % Households |
| Under 35 Years | 20 | 20.6% |
| 35 to 44 Years | 8 | 8.3% |
| 45 to 54 Years | 16 | 16.5% |
| 55 to 64 Years | 19 | 19.6% |
| 65 to 74 Years | 27 | 27.8% |
| 75 to 84 Years | 4 | 4.1% |
| 85 Years and Over | 3 | 3.1% |
| Total | 97 | 100.0% |
Housing Finances in Sanctuary
Median Income by Occupancy in Sanctuary
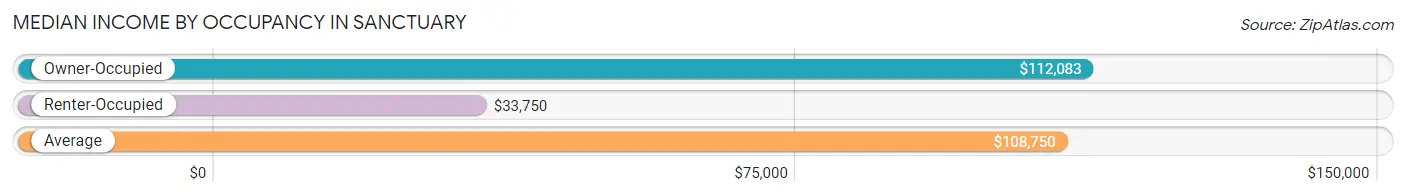
| Occupancy Type | # Households | Median Income |
| Owner-Occupied | 84 (86.6%) | $112,083 |
| Renter-Occupied | 13 (13.4%) | $33,750 |
| Average | 97 (100.0%) | $108,750 |
Occupancy by Householder Income Bracket in Sanctuary
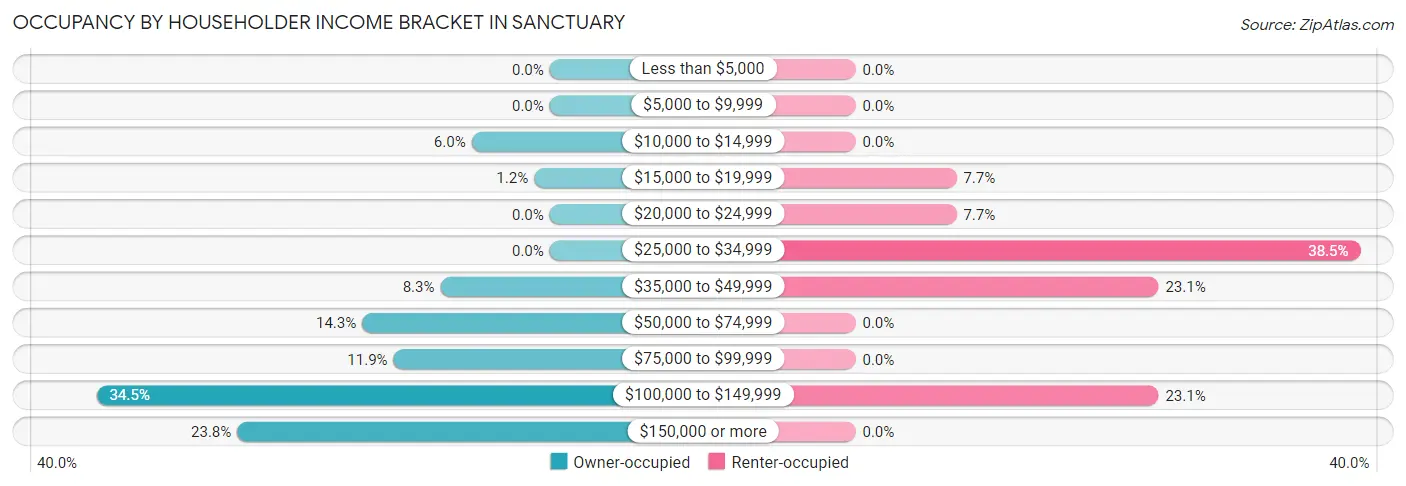
| Income Bracket | Owner-occupied | Renter-occupied |
| Less than $5,000 | 0 (0.0%) | 0 (0.0%) |
| $5,000 to $9,999 | 0 (0.0%) | 0 (0.0%) |
| $10,000 to $14,999 | 5 (5.9%) | 0 (0.0%) |
| $15,000 to $19,999 | 1 (1.2%) | 1 (7.7%) |
| $20,000 to $24,999 | 0 (0.0%) | 1 (7.7%) |
| $25,000 to $34,999 | 0 (0.0%) | 5 (38.5%) |
| $35,000 to $49,999 | 7 (8.3%) | 3 (23.1%) |
| $50,000 to $74,999 | 12 (14.3%) | 0 (0.0%) |
| $75,000 to $99,999 | 10 (11.9%) | 0 (0.0%) |
| $100,000 to $149,999 | 29 (34.5%) | 3 (23.1%) |
| $150,000 or more | 20 (23.8%) | 0 (0.0%) |
| Total | 84 (100.0%) | 13 (100.0%) |
Monthly Housing Cost Tiers in Sanctuary
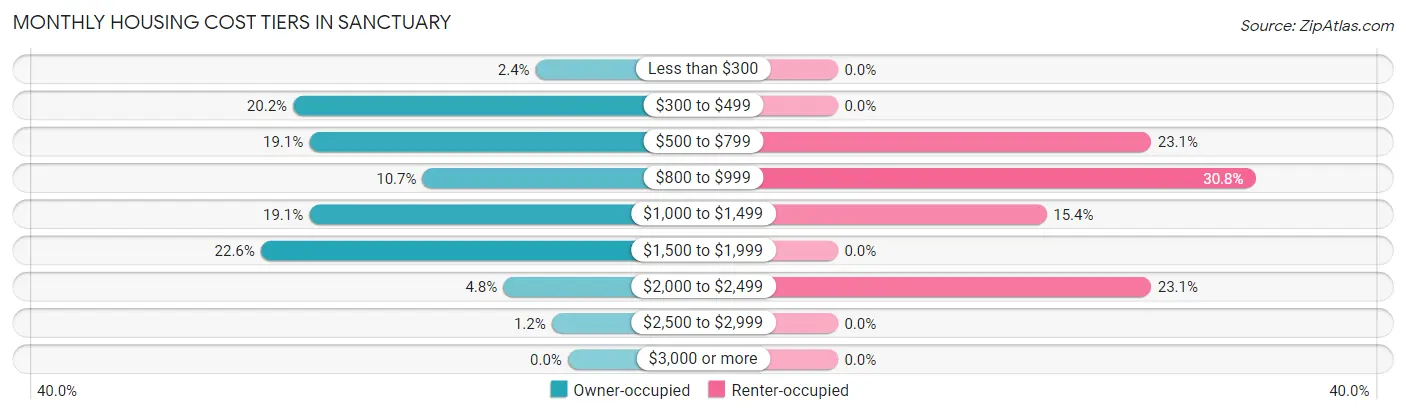
| Monthly Cost | Owner-occupied | Renter-occupied |
| Less than $300 | 2 (2.4%) | 0 (0.0%) |
| $300 to $499 | 17 (20.2%) | 0 (0.0%) |
| $500 to $799 | 16 (19.1%) | 3 (23.1%) |
| $800 to $999 | 9 (10.7%) | 4 (30.8%) |
| $1,000 to $1,499 | 16 (19.1%) | 2 (15.4%) |
| $1,500 to $1,999 | 19 (22.6%) | 0 (0.0%) |
| $2,000 to $2,499 | 4 (4.8%) | 3 (23.1%) |
| $2,500 to $2,999 | 1 (1.2%) | 0 (0.0%) |
| $3,000 or more | 0 (0.0%) | 0 (0.0%) |
| Total | 84 (100.0%) | 13 (100.0%) |
Physical Housing Characteristics in Sanctuary
Housing Structures in Sanctuary
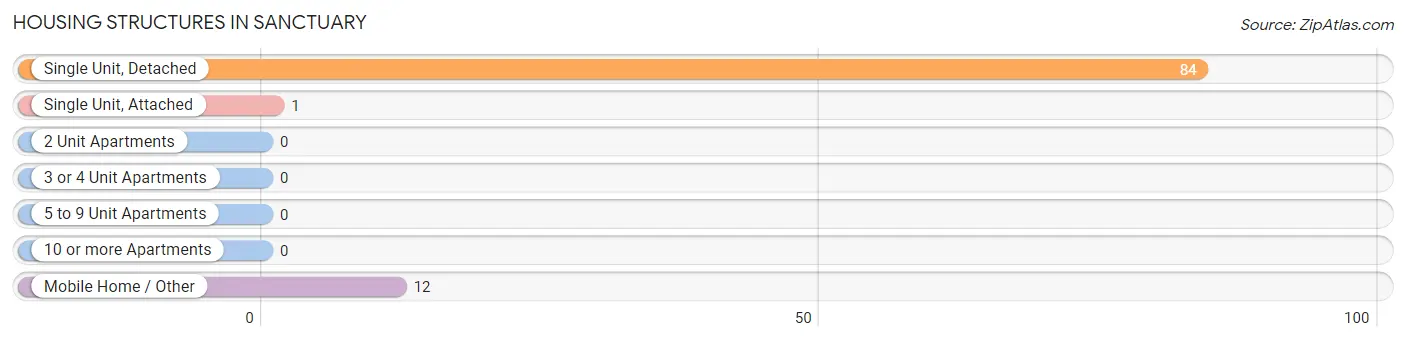
| Structure Type | # Housing Units | % Housing Units |
| Single Unit, Detached | 84 | 86.6% |
| Single Unit, Attached | 1 | 1.0% |
| 2 Unit Apartments | 0 | 0.0% |
| 3 or 4 Unit Apartments | 0 | 0.0% |
| 5 to 9 Unit Apartments | 0 | 0.0% |
| 10 or more Apartments | 0 | 0.0% |
| Mobile Home / Other | 12 | 12.4% |
| Total | 97 | 100.0% |
Housing Structures by Occupancy in Sanctuary
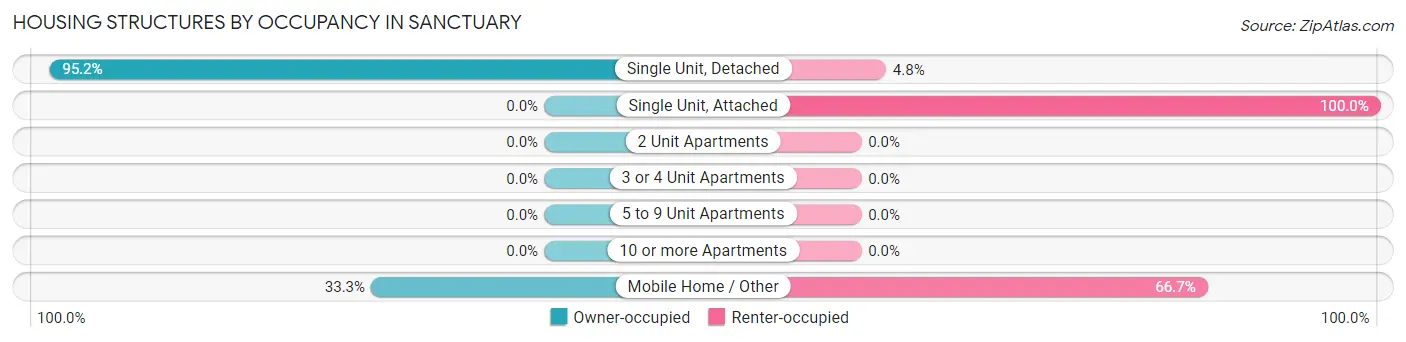
| Structure Type | Owner-occupied | Renter-occupied |
| Single Unit, Detached | 80 (95.2%) | 4 (4.8%) |
| Single Unit, Attached | 0 (0.0%) | 1 (100.0%) |
| 2 Unit Apartments | 0 (0.0%) | 0 (0.0%) |
| 3 or 4 Unit Apartments | 0 (0.0%) | 0 (0.0%) |
| 5 to 9 Unit Apartments | 0 (0.0%) | 0 (0.0%) |
| 10 or more Apartments | 0 (0.0%) | 0 (0.0%) |
| Mobile Home / Other | 4 (33.3%) | 8 (66.7%) |
| Total | 84 (86.6%) | 13 (13.4%) |
Housing Structures by Number of Rooms in Sanctuary
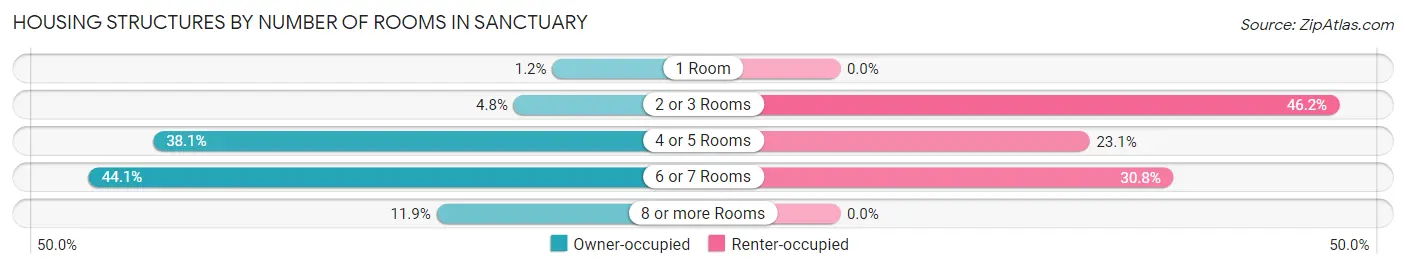
| Number of Rooms | Owner-occupied | Renter-occupied |
| 1 Room | 1 (1.2%) | 0 (0.0%) |
| 2 or 3 Rooms | 4 (4.8%) | 6 (46.2%) |
| 4 or 5 Rooms | 32 (38.1%) | 3 (23.1%) |
| 6 or 7 Rooms | 37 (44.1%) | 4 (30.8%) |
| 8 or more Rooms | 10 (11.9%) | 0 (0.0%) |
| Total | 84 (100.0%) | 13 (100.0%) |
Housing Structure by Heating Type in Sanctuary
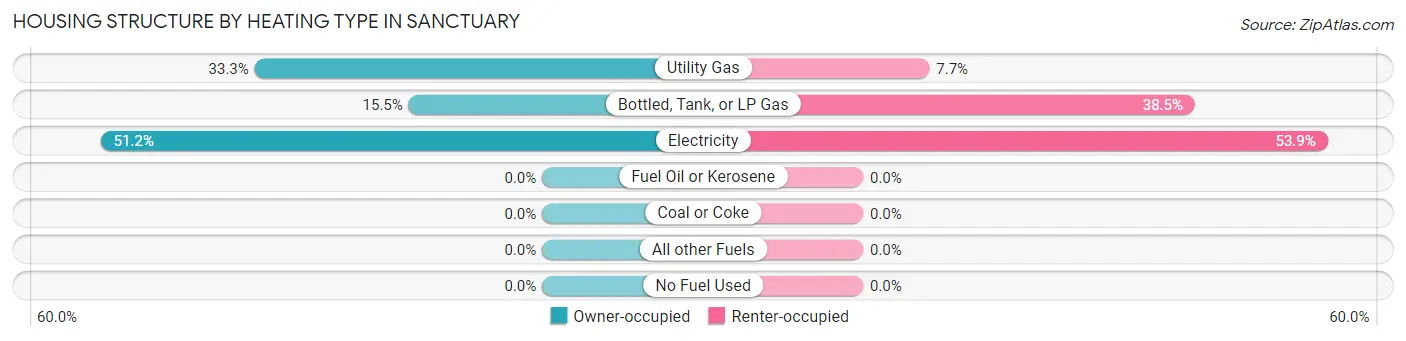
| Heating Type | Owner-occupied | Renter-occupied |
| Utility Gas | 28 (33.3%) | 1 (7.7%) |
| Bottled, Tank, or LP Gas | 13 (15.5%) | 5 (38.5%) |
| Electricity | 43 (51.2%) | 7 (53.8%) |
| Fuel Oil or Kerosene | 0 (0.0%) | 0 (0.0%) |
| Coal or Coke | 0 (0.0%) | 0 (0.0%) |
| All other Fuels | 0 (0.0%) | 0 (0.0%) |
| No Fuel Used | 0 (0.0%) | 0 (0.0%) |
| Total | 84 (100.0%) | 13 (100.0%) |
Household Vehicle Usage in Sanctuary
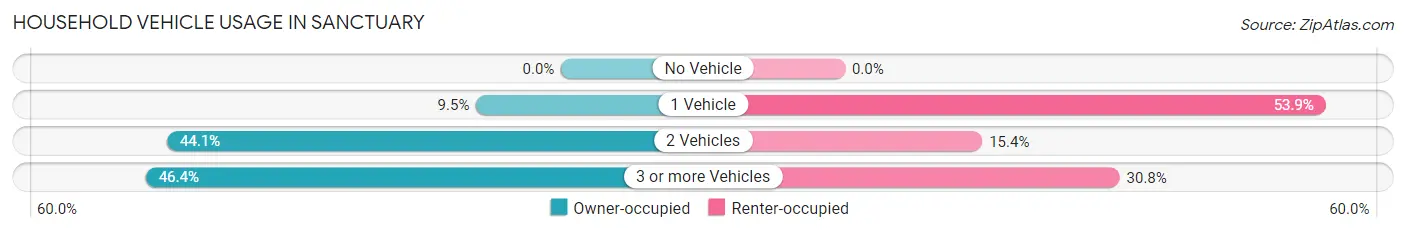
| Vehicles per Household | Owner-occupied | Renter-occupied |
| No Vehicle | 0 (0.0%) | 0 (0.0%) |
| 1 Vehicle | 8 (9.5%) | 7 (53.8%) |
| 2 Vehicles | 37 (44.1%) | 2 (15.4%) |
| 3 or more Vehicles | 39 (46.4%) | 4 (30.8%) |
| Total | 84 (100.0%) | 13 (100.0%) |
Real Estate & Mortgages in Sanctuary
Real Estate and Mortgage Overview in Sanctuary
| Characteristic | Without Mortgage | With Mortgage |
| Housing Units | 46 | 38 |
| Median Property Value | $220,000 | $225,000 |
| Median Household Income | $105,000 | $7 |
| Monthly Housing Costs | $622 | $0 |
| Real Estate Taxes | $2,467 | $2 |
Property Value by Mortgage Status in Sanctuary
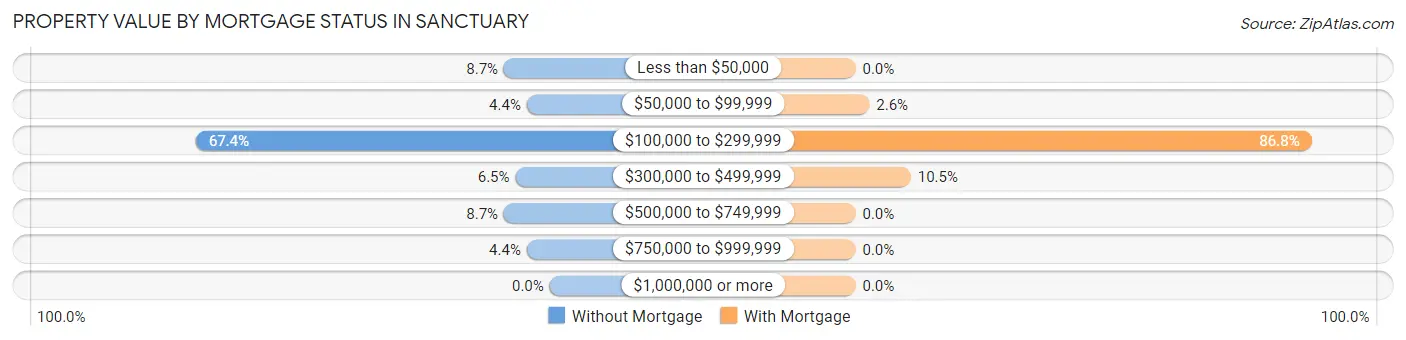
| Property Value | Without Mortgage | With Mortgage |
| Less than $50,000 | 4 (8.7%) | 0 (0.0%) |
| $50,000 to $99,999 | 2 (4.3%) | 1 (2.6%) |
| $100,000 to $299,999 | 31 (67.4%) | 33 (86.8%) |
| $300,000 to $499,999 | 3 (6.5%) | 4 (10.5%) |
| $500,000 to $749,999 | 4 (8.7%) | 0 (0.0%) |
| $750,000 to $999,999 | 2 (4.3%) | 0 (0.0%) |
| $1,000,000 or more | 0 (0.0%) | 0 (0.0%) |
| Total | 46 (100.0%) | 38 (100.0%) |
Household Income by Mortgage Status in Sanctuary
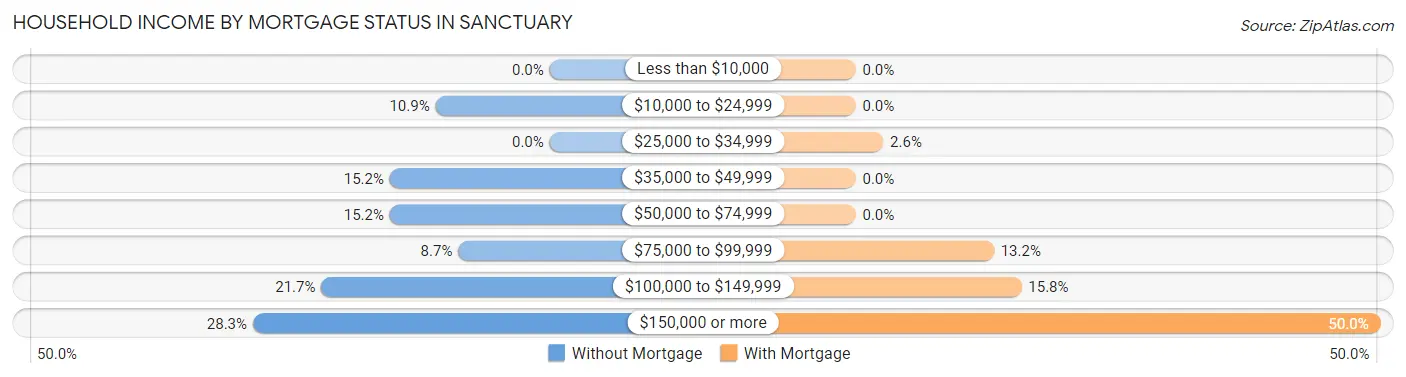
| Household Income | Without Mortgage | With Mortgage |
| Less than $10,000 | 0 (0.0%) | 0 (0.0%) |
| $10,000 to $24,999 | 5 (10.9%) | 0 (0.0%) |
| $25,000 to $34,999 | 0 (0.0%) | 1 (2.6%) |
| $35,000 to $49,999 | 7 (15.2%) | 0 (0.0%) |
| $50,000 to $74,999 | 7 (15.2%) | 0 (0.0%) |
| $75,000 to $99,999 | 4 (8.7%) | 5 (13.2%) |
| $100,000 to $149,999 | 10 (21.7%) | 6 (15.8%) |
| $150,000 or more | 13 (28.3%) | 19 (50.0%) |
| Total | 46 (100.0%) | 38 (100.0%) |
Property Value to Household Income Ratio in Sanctuary
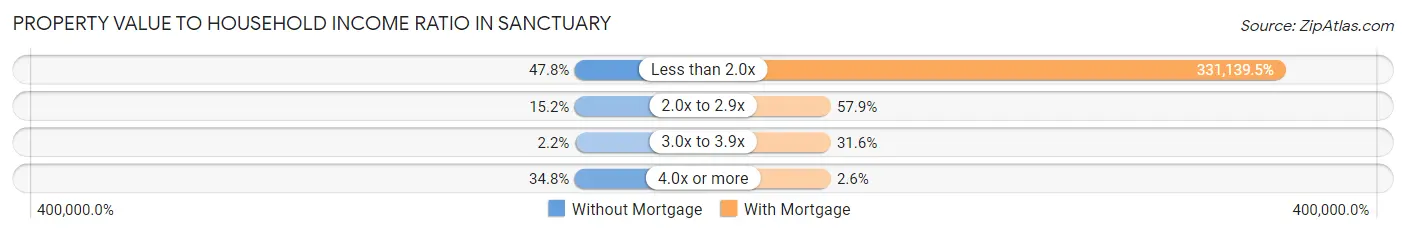
| Value-to-Income Ratio | Without Mortgage | With Mortgage |
| Less than 2.0x | 22 (47.8%) | 125,833 (331,139.5%) |
| 2.0x to 2.9x | 7 (15.2%) | 22 (57.9%) |
| 3.0x to 3.9x | 1 (2.2%) | 12 (31.6%) |
| 4.0x or more | 16 (34.8%) | 1 (2.6%) |
| Total | 46 (100.0%) | 38 (100.0%) |
Real Estate Taxes by Mortgage Status in Sanctuary
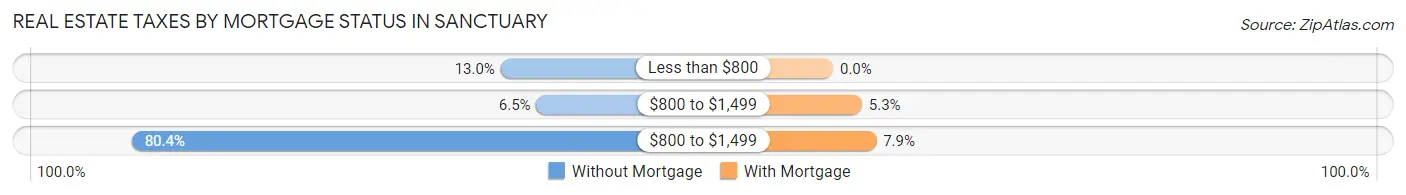
| Property Taxes | Without Mortgage | With Mortgage |
| Less than $800 | 6 (13.0%) | 0 (0.0%) |
| $800 to $1,499 | 3 (6.5%) | 2 (5.3%) |
| $800 to $1,499 | 37 (80.4%) | 3 (7.9%) |
| Total | 46 (100.0%) | 38 (100.0%) |
Health & Disability in Sanctuary
Health Insurance Coverage by Age in Sanctuary
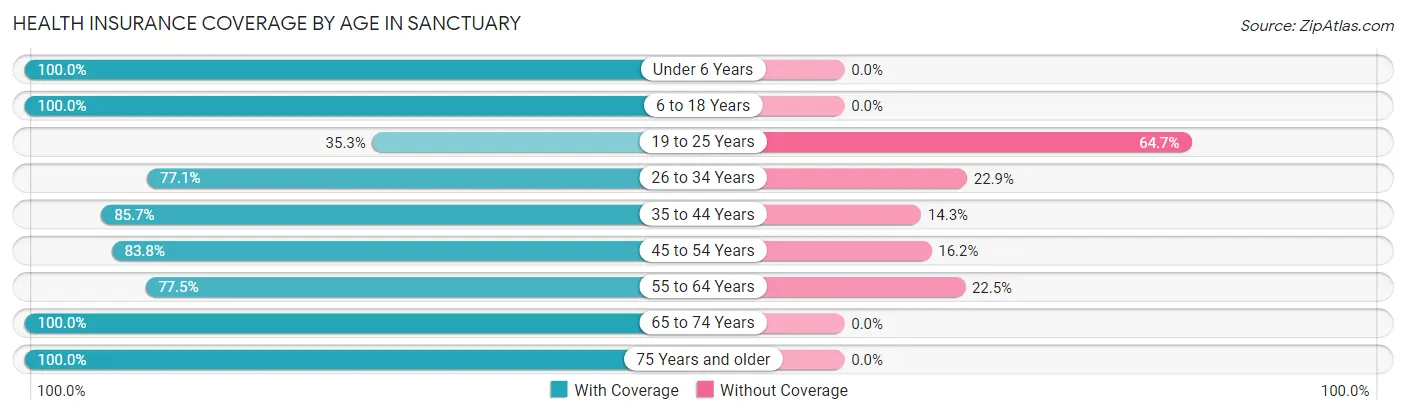
| Age Bracket | With Coverage | Without Coverage |
| Under 6 Years | 7 (100.0%) | 0 (0.0%) |
| 6 to 18 Years | 28 (100.0%) | 0 (0.0%) |
| 19 to 25 Years | 6 (35.3%) | 11 (64.7%) |
| 26 to 34 Years | 27 (77.1%) | 8 (22.9%) |
| 35 to 44 Years | 24 (85.7%) | 4 (14.3%) |
| 45 to 54 Years | 31 (83.8%) | 6 (16.2%) |
| 55 to 64 Years | 31 (77.5%) | 9 (22.5%) |
| 65 to 74 Years | 51 (100.0%) | 0 (0.0%) |
| 75 Years and older | 11 (100.0%) | 0 (0.0%) |
| Total | 216 (85.0%) | 38 (15.0%) |
Health Insurance Coverage by Citizenship Status in Sanctuary
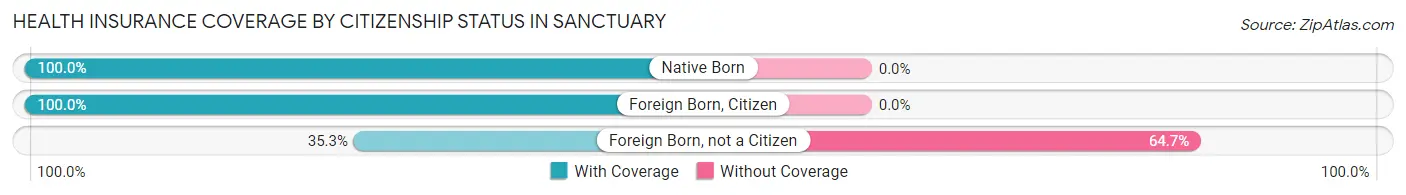
| Citizenship Status | With Coverage | Without Coverage |
| Native Born | 7 (100.0%) | 0 (0.0%) |
| Foreign Born, Citizen | 28 (100.0%) | 0 (0.0%) |
| Foreign Born, not a Citizen | 6 (35.3%) | 11 (64.7%) |
Health Insurance Coverage by Household Income in Sanctuary
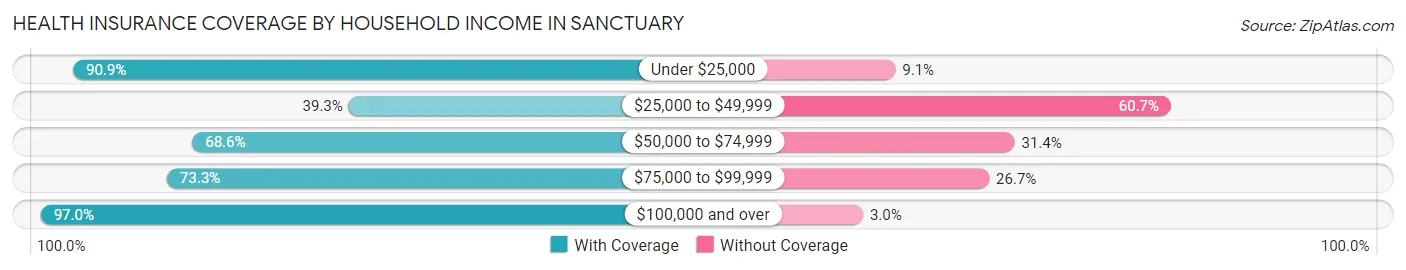
| Household Income | With Coverage | Without Coverage |
| Under $25,000 | 10 (90.9%) | 1 (9.1%) |
| $25,000 to $49,999 | 11 (39.3%) | 17 (60.7%) |
| $50,000 to $74,999 | 24 (68.6%) | 11 (31.4%) |
| $75,000 to $99,999 | 11 (73.3%) | 4 (26.7%) |
| $100,000 and over | 160 (97.0%) | 5 (3.0%) |
Public vs Private Health Insurance Coverage by Age in Sanctuary
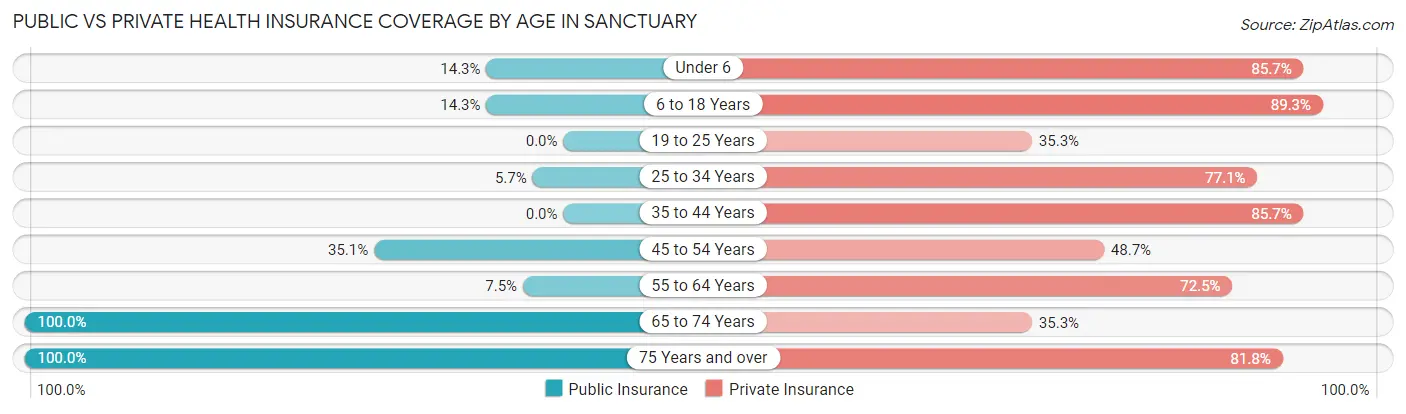
| Age Bracket | Public Insurance | Private Insurance |
| Under 6 | 1 (14.3%) | 6 (85.7%) |
| 6 to 18 Years | 4 (14.3%) | 25 (89.3%) |
| 19 to 25 Years | 0 (0.0%) | 6 (35.3%) |
| 25 to 34 Years | 2 (5.7%) | 27 (77.1%) |
| 35 to 44 Years | 0 (0.0%) | 24 (85.7%) |
| 45 to 54 Years | 13 (35.1%) | 18 (48.6%) |
| 55 to 64 Years | 3 (7.5%) | 29 (72.5%) |
| 65 to 74 Years | 51 (100.0%) | 18 (35.3%) |
| 75 Years and over | 11 (100.0%) | 9 (81.8%) |
| Total | 85 (33.5%) | 162 (63.8%) |
Disability Status by Sex by Age in Sanctuary
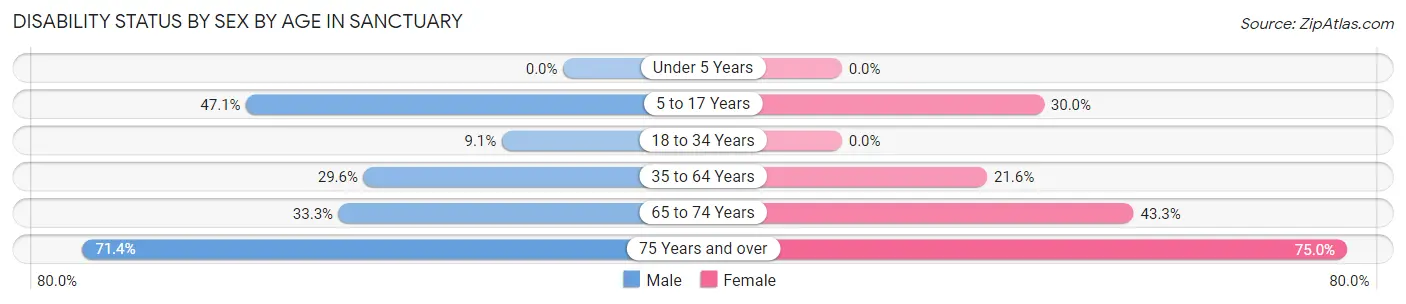
| Age Bracket | Male | Female |
| Under 5 Years | 0 (0.0%) | 0 (0.0%) |
| 5 to 17 Years | 8 (47.1%) | 3 (30.0%) |
| 18 to 34 Years | 2 (9.1%) | 0 (0.0%) |
| 35 to 64 Years | 16 (29.6%) | 11 (21.6%) |
| 65 to 74 Years | 7 (33.3%) | 13 (43.3%) |
| 75 Years and over | 5 (71.4%) | 3 (75.0%) |
Disability Class by Sex by Age in Sanctuary
Disability Class: Hearing Difficulty
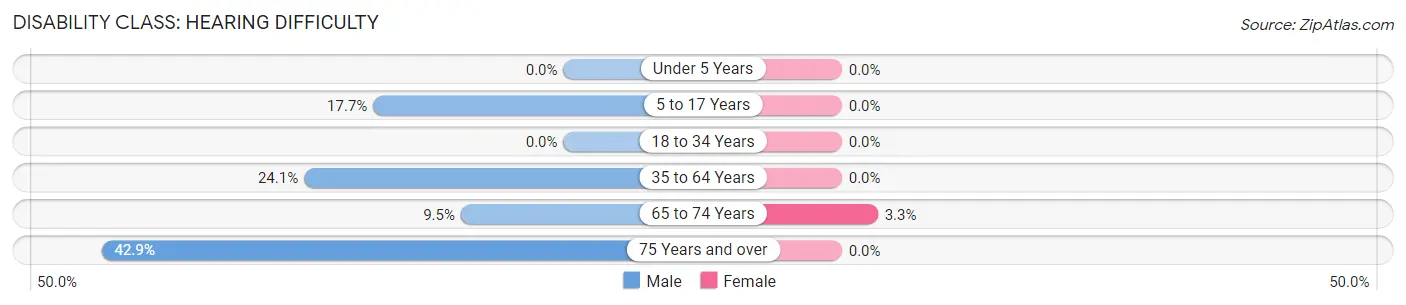
| Age Bracket | Male | Female |
| Under 5 Years | 0 (0.0%) | 0 (0.0%) |
| 5 to 17 Years | 3 (17.6%) | 0 (0.0%) |
| 18 to 34 Years | 0 (0.0%) | 0 (0.0%) |
| 35 to 64 Years | 13 (24.1%) | 0 (0.0%) |
| 65 to 74 Years | 2 (9.5%) | 1 (3.3%) |
| 75 Years and over | 3 (42.9%) | 0 (0.0%) |
Disability Class: Vision Difficulty
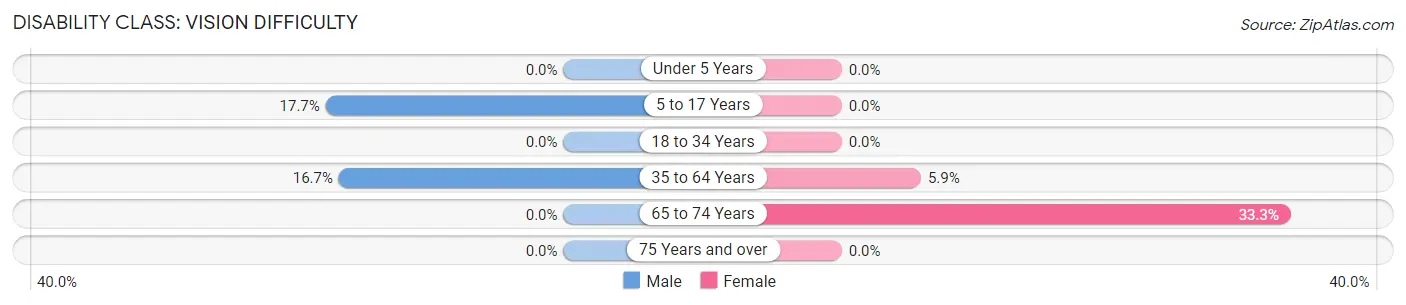
| Age Bracket | Male | Female |
| Under 5 Years | 0 (0.0%) | 0 (0.0%) |
| 5 to 17 Years | 3 (17.6%) | 0 (0.0%) |
| 18 to 34 Years | 0 (0.0%) | 0 (0.0%) |
| 35 to 64 Years | 9 (16.7%) | 3 (5.9%) |
| 65 to 74 Years | 0 (0.0%) | 10 (33.3%) |
| 75 Years and over | 0 (0.0%) | 0 (0.0%) |
Disability Class: Cognitive Difficulty
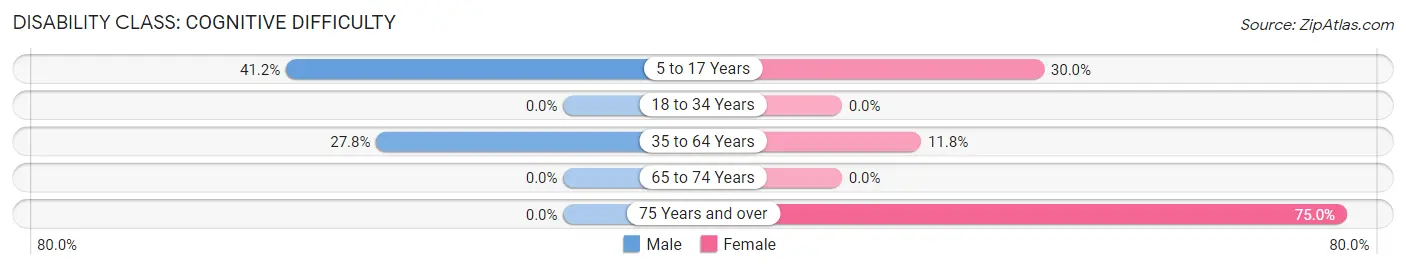
| Age Bracket | Male | Female |
| 5 to 17 Years | 7 (41.2%) | 3 (30.0%) |
| 18 to 34 Years | 0 (0.0%) | 0 (0.0%) |
| 35 to 64 Years | 15 (27.8%) | 6 (11.8%) |
| 65 to 74 Years | 0 (0.0%) | 0 (0.0%) |
| 75 Years and over | 0 (0.0%) | 3 (75.0%) |
Disability Class: Ambulatory Difficulty
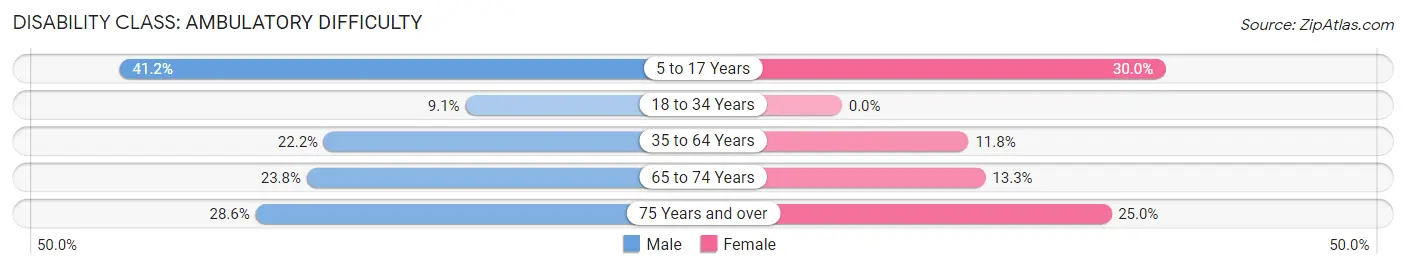
| Age Bracket | Male | Female |
| 5 to 17 Years | 7 (41.2%) | 3 (30.0%) |
| 18 to 34 Years | 2 (9.1%) | 0 (0.0%) |
| 35 to 64 Years | 12 (22.2%) | 6 (11.8%) |
| 65 to 74 Years | 5 (23.8%) | 4 (13.3%) |
| 75 Years and over | 2 (28.6%) | 1 (25.0%) |
Disability Class: Self-Care Difficulty
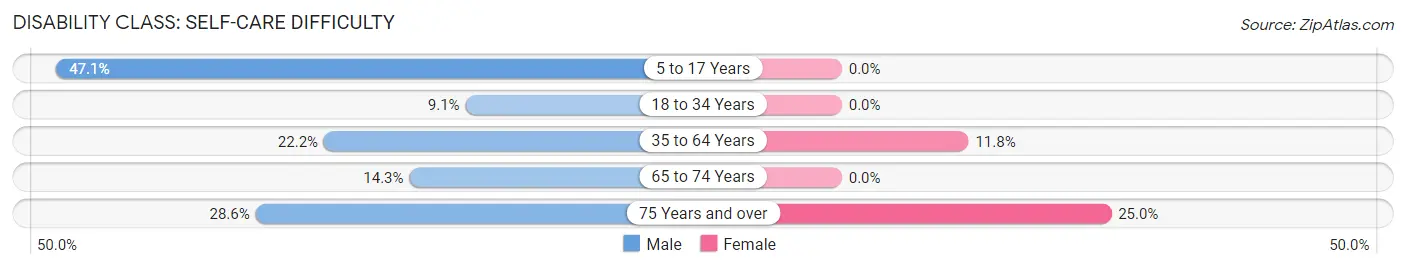
| Age Bracket | Male | Female |
| 5 to 17 Years | 8 (47.1%) | 0 (0.0%) |
| 18 to 34 Years | 2 (9.1%) | 0 (0.0%) |
| 35 to 64 Years | 12 (22.2%) | 6 (11.8%) |
| 65 to 74 Years | 3 (14.3%) | 0 (0.0%) |
| 75 Years and over | 2 (28.6%) | 1 (25.0%) |
Technology Access in Sanctuary
Computing Device Access in Sanctuary
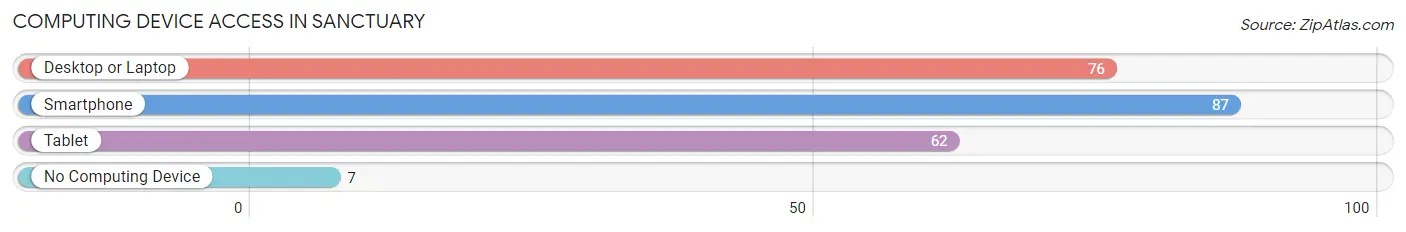
| Device Type | # Households | % Households |
| Desktop or Laptop | 76 | 78.3% |
| Smartphone | 87 | 89.7% |
| Tablet | 62 | 63.9% |
| No Computing Device | 7 | 7.2% |
| Total | 97 | 100.0% |
Internet Access in Sanctuary
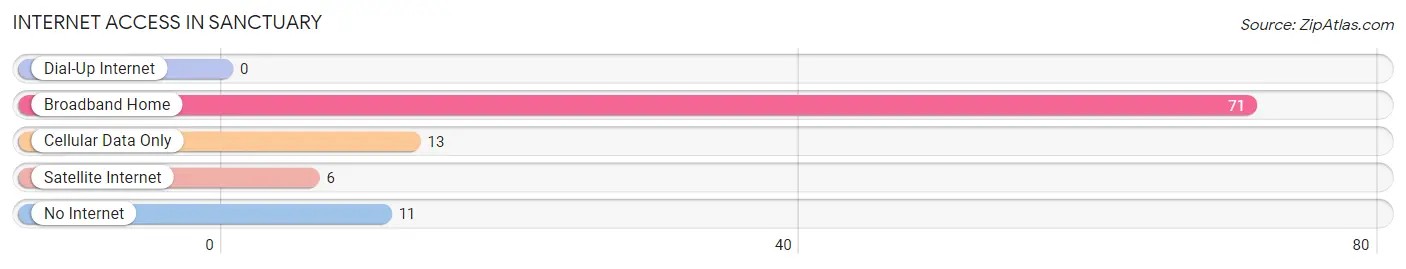
| Internet Type | # Households | % Households |
| Dial-Up Internet | 0 | 0.0% |
| Broadband Home | 71 | 73.2% |
| Cellular Data Only | 13 | 13.4% |
| Satellite Internet | 6 | 6.2% |
| No Internet | 11 | 11.3% |
| Total | 97 | 100.0% |
Sanctuary Summary
Sanctuary, Texas is a small town located in the southeastern corner of Texas, in the county of San Patricio. It is situated on the banks of the Nueces River, approximately 30 miles from Corpus Christi. The town has a population of approximately 1,000 people, and is known for its rural charm and small-town atmosphere.
History
Sanctuary, Texas was founded in 1854 by a group of settlers from the nearby town of Refugio. The settlers were looking for a place to settle and raise their families, and they chose the area around the Nueces River as their new home. The town was originally called “Sanctuary” because of its proximity to the river, which provided a safe haven for the settlers.
The town grew slowly over the years, and by the early 1900s, it had become a thriving community. The town was home to several businesses, including a general store, a blacksmith shop, and a cotton gin. The town also had a school, a post office, and a church.
In the 1950s, the town began to decline as many of its residents moved away in search of better opportunities. By the 1970s, the population had dropped to just over 500 people. In the 1980s, the town began to experience a resurgence, as new businesses and residents moved into the area. Today, Sanctuary is a vibrant community with a population of approximately 1,000 people.
Geography
Sanctuary is located in the southeastern corner of Texas, in the county of San Patricio. It is situated on the banks of the Nueces River, approximately 30 miles from Corpus Christi. The town is surrounded by rolling hills and lush vegetation, and is home to a variety of wildlife, including deer, wild turkeys, and armadillos.
The climate in Sanctuary is generally mild, with temperatures ranging from the mid-50s in the winter to the mid-90s in the summer. The town receives an average of 35 inches of rain per year, and is prone to occasional flooding due to its proximity to the river.
Economy
The economy of Sanctuary is largely based on agriculture and tourism. The town is home to several farms, which produce a variety of crops, including cotton, corn, and soybeans. The town is also home to several tourist attractions, including a historic church, a museum, and a nature preserve.
In addition to agriculture and tourism, Sanctuary is home to several small businesses, including a general store, a hardware store, and a restaurant. The town also has a post office, a bank, and a library.
Demographics
As of the 2010 census, the population of Sanctuary was 1,000 people. The racial makeup of the town was 94.2% White, 0.7% African American, 0.3% Native American, 0.2% Asian, 0.1% Pacific Islander, and 4.5% from other races. The median household income was $31,250, and the median age was 37.
Sanctuary is a small, rural town with a strong sense of community. The town is home to a variety of churches, and is known for its friendly atmosphere and welcoming attitude. The town is also home to a variety of festivals and events, including the annual Nueces River Festival, which celebrates the town’s history and culture.
Common Questions
What is the Total Population of Sanctuary?
Total Population of Sanctuary is 254.
What is the Total Male Population of Sanctuary?
Total Male Population of Sanctuary is 128.
What is the Total Female Population of Sanctuary?
Total Female Population of Sanctuary is 126.
What is the Ratio of Males per 100 Females in Sanctuary?
There are 101.59 Males per 100 Females in Sanctuary.
What is the Ratio of Females per 100 Males in Sanctuary?
There are 98.44 Females per 100 Males in Sanctuary.
What is the Median Population Age in Sanctuary?
Median Population Age in Sanctuary is 50.5 Years.
What is the Average Family Size in Sanctuary
Average Family Size in Sanctuary is 3.0 People.
What is the Average Household Size in Sanctuary
Average Household Size in Sanctuary is 2.6 People.
What is Per Capita Income in Sanctuary?
Per Capita income in Sanctuary is $55,852.
What is the Median Family Income in Sanctuary?
Median Family Income in Sanctuary is $118,750.
What is the Median Household income in Sanctuary?
Median Household Income in Sanctuary is $108,750.
What is Inequality or Gini Index in Sanctuary?
Inequality or Gini Index in Sanctuary is 0.51.
How Large is the Labor Force in Sanctuary?
There are 134 People in the Labor Forcein in Sanctuary.
What is the Percentage of People in the Labor Force in Sanctuary?
59.3% of People are in the Labor Force in Sanctuary.
What is the Unemployment Rate in Sanctuary?
Unemployment Rate in Sanctuary is 9.0%.