Tool, TX
Tool Map
Tool Overview
2,356
TOTAL POPULATION
1,238
MALE POPULATION
1,118
FEMALE POPULATION
110.73
MALES / 100 FEMALES
90.31
FEMALES / 100 MALES
53.0
MEDIAN AGE
2.6
AVG FAMILY SIZE
2.3
AVG HOUSEHOLD SIZE
$40,553
PER CAPITA INCOME
$73,056
AVG FAMILY INCOME
$65,417
AVG HOUSEHOLD INCOME
52.0%
WAGE / INCOME GAP [ % ]
48.0¢/ $1
WAGE / INCOME GAP [ $ ]
$7,219
FAMILY INCOME DEFICIT
0.49
INEQUALITY / GINI INDEX
1,157
LABOR FORCE [ PEOPLE ]
57.9%
PERCENT IN LABOR FORCE
3.7%
UNEMPLOYMENT RATE
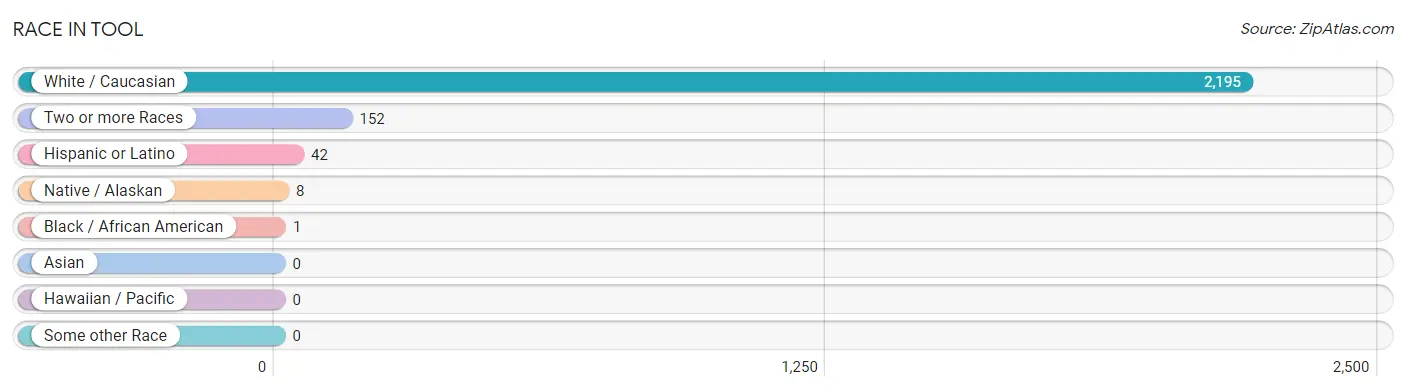
Race in Tool
The most populous races in Tool are White / Caucasian (2,195 | 93.2%), Two or more Races (152 | 6.5%), and Hispanic or Latino (42 | 1.8%).
| Race | # Population | % Population |
| Asian | 0 | 0.0% |
| Black / African American | 1 | 0.0% |
| Hawaiian / Pacific | 0 | 0.0% |
| Hispanic or Latino | 42 | 1.8% |
| Native / Alaskan | 8 | 0.3% |
| White / Caucasian | 2,195 | 93.2% |
| Two or more Races | 152 | 6.5% |
| Some other Race | 0 | 0.0% |
| Total | 2,356 | 100.0% |
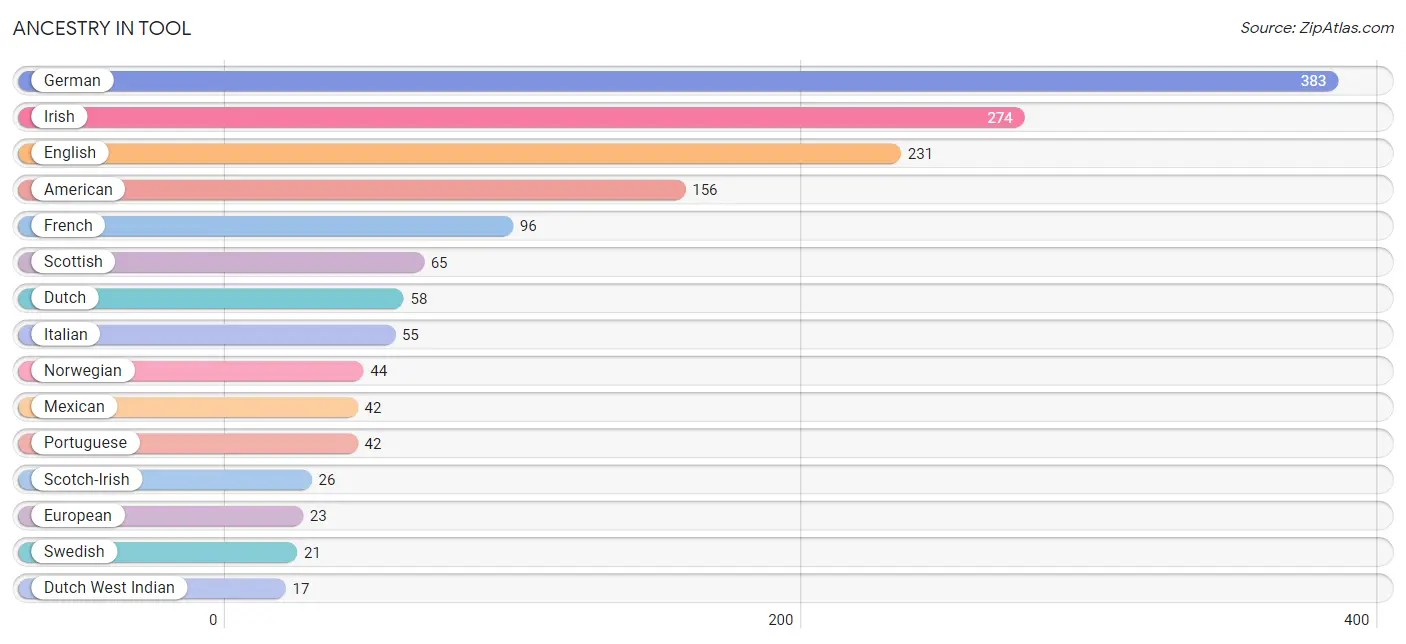
Ancestry in Tool
The most populous ancestries reported in Tool are German (383 | 16.3%), Irish (274 | 11.6%), English (231 | 9.8%), American (156 | 6.6%), and French (96 | 4.1%), together accounting for 48.4% of all Tool residents.
| Ancestry | # Population | % Population |
| American | 156 | 6.6% |
| Austrian | 9 | 0.4% |
| Burmese | 10 | 0.4% |
| Canadian | 7 | 0.3% |
| Chickasaw | 4 | 0.2% |
| Czech | 13 | 0.5% |
| Dutch | 58 | 2.5% |
| Dutch West Indian | 17 | 0.7% |
| English | 231 | 9.8% |
| European | 23 | 1.0% |
| French | 96 | 4.1% |
| German | 383 | 16.3% |
| Irish | 274 | 11.6% |
| Italian | 55 | 2.3% |
| Mexican | 42 | 1.8% |
| Norwegian | 44 | 1.9% |
| Polish | 6 | 0.3% |
| Portuguese | 42 | 1.8% |
| Scotch-Irish | 26 | 1.1% |
| Scottish | 65 | 2.8% |
| Swedish | 21 | 0.9% |
| Ukrainian | 7 | 0.3% | View All 22 Rows |
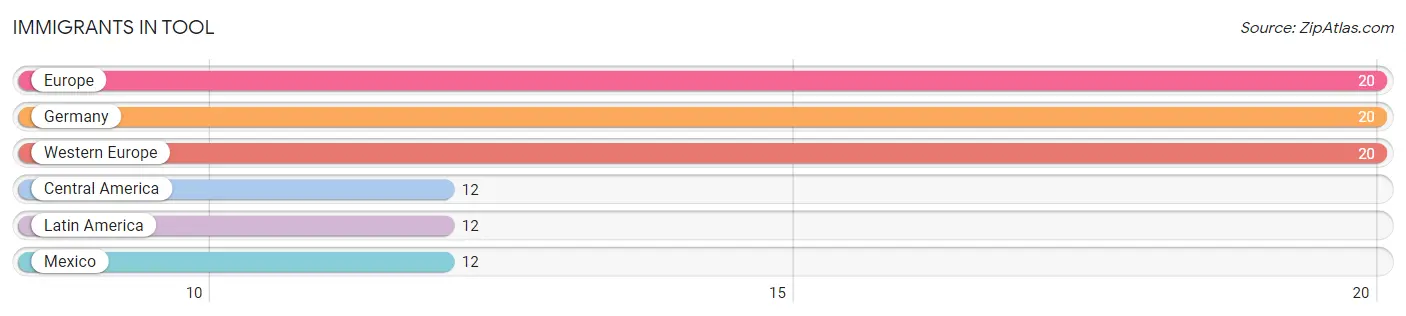
Immigrants in Tool
The most numerous immigrant groups reported in Tool came from Europe (20 | 0.9%), Germany (20 | 0.9%), Western Europe (20 | 0.9%), Central America (12 | 0.5%), and Latin America (12 | 0.5%), together accounting for 3.6% of all Tool residents.
| Immigration Origin | # Population | % Population |
| Central America | 12 | 0.5% |
| Europe | 20 | 0.9% |
| Germany | 20 | 0.9% |
| Latin America | 12 | 0.5% |
| Mexico | 12 | 0.5% |
| Western Europe | 20 | 0.9% | View All 6 Rows |
Sex and Age in Tool
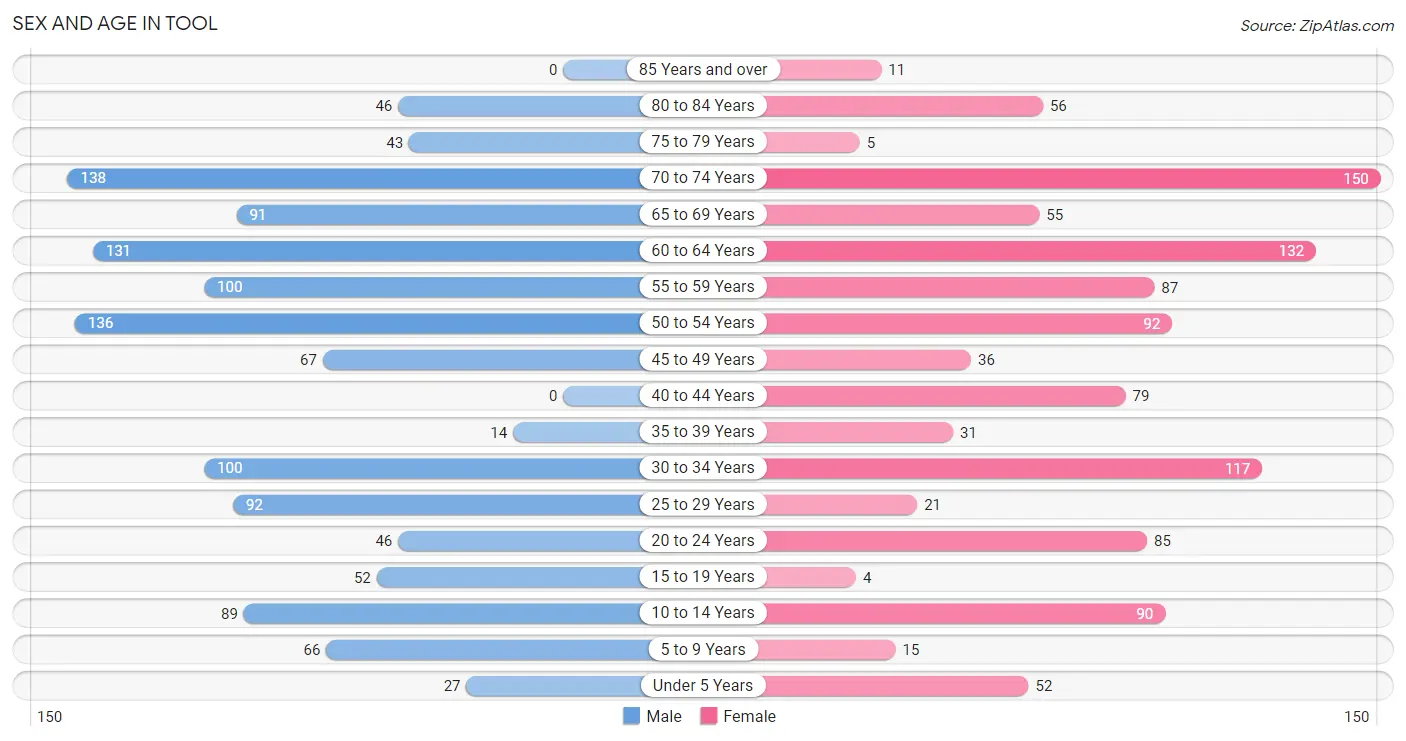
Sex and Age in Tool
The most populous age groups in Tool are 70 to 74 Years (138 | 11.2%) for men and 70 to 74 Years (150 | 13.4%) for women.
| Age Bracket | Male | Female |
| Under 5 Years | 27 (2.2%) | 52 (4.6%) |
| 5 to 9 Years | 66 (5.3%) | 15 (1.3%) |
| 10 to 14 Years | 89 (7.2%) | 90 (8.1%) |
| 15 to 19 Years | 52 (4.2%) | 4 (0.4%) |
| 20 to 24 Years | 46 (3.7%) | 85 (7.6%) |
| 25 to 29 Years | 92 (7.4%) | 21 (1.9%) |
| 30 to 34 Years | 100 (8.1%) | 117 (10.5%) |
| 35 to 39 Years | 14 (1.1%) | 31 (2.8%) |
| 40 to 44 Years | 0 (0.0%) | 79 (7.1%) |
| 45 to 49 Years | 67 (5.4%) | 36 (3.2%) |
| 50 to 54 Years | 136 (11.0%) | 92 (8.2%) |
| 55 to 59 Years | 100 (8.1%) | 87 (7.8%) |
| 60 to 64 Years | 131 (10.6%) | 132 (11.8%) |
| 65 to 69 Years | 91 (7.3%) | 55 (4.9%) |
| 70 to 74 Years | 138 (11.2%) | 150 (13.4%) |
| 75 to 79 Years | 43 (3.5%) | 5 (0.4%) |
| 80 to 84 Years | 46 (3.7%) | 56 (5.0%) |
| 85 Years and over | 0 (0.0%) | 11 (1.0%) |
| Total | 1,238 (100.0%) | 1,118 (100.0%) |
Families and Households in Tool
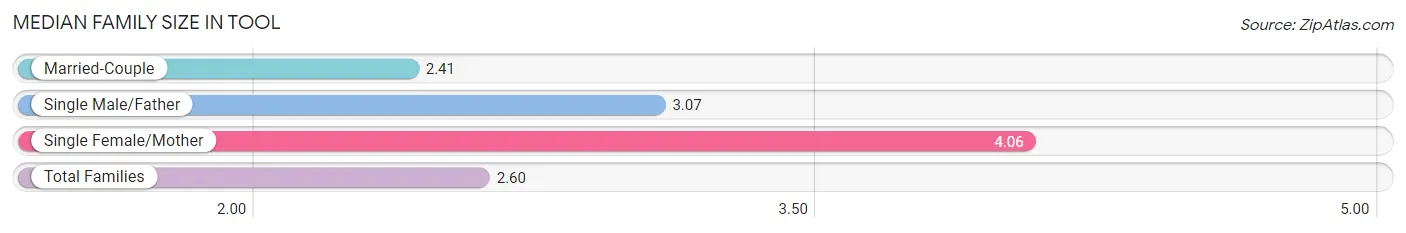
Median Family Size in Tool
The median family size in Tool is 2.60 persons per family, with single female/mother families (77 | 10.1%) accounting for the largest median family size of 4.06 persons per family. On the other hand, married-couple families (656 | 86.1%) represent the smallest median family size with 2.41 persons per family.
| Family Type | # Families | Family Size |
| Married-Couple | 656 (86.1%) | 2.41 |
| Single Male/Father | 29 (3.8%) | 3.07 |
| Single Female/Mother | 77 (10.1%) | 4.06 |
| Total Families | 762 (100.0%) | 2.60 |
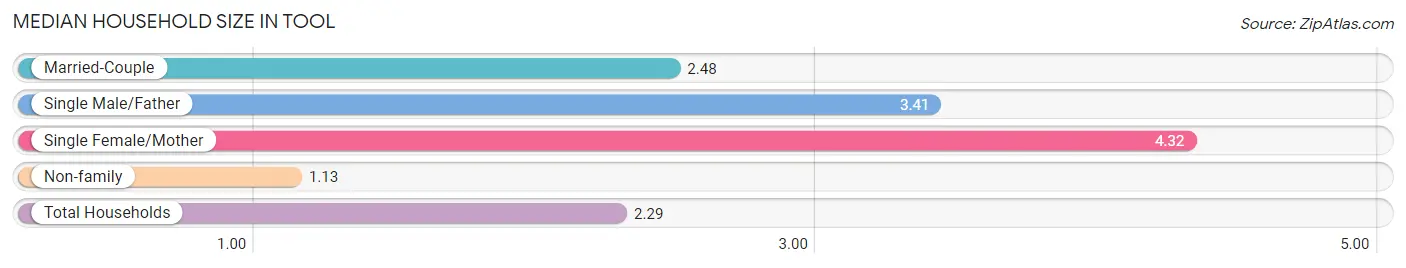
Median Household Size in Tool
The median household size in Tool is 2.29 persons per household, with single female/mother households (77 | 7.5%) accounting for the largest median household size of 4.32 persons per household. non-family households (266 | 25.9%) represent the smallest median household size with 1.13 persons per household.
| Household Type | # Households | Household Size |
| Married-Couple | 656 (63.8%) | 2.48 |
| Single Male/Father | 29 (2.8%) | 3.41 |
| Single Female/Mother | 77 (7.5%) | 4.32 |
| Non-family | 266 (25.9%) | 1.13 |
| Total Households | 1,028 (100.0%) | 2.29 |
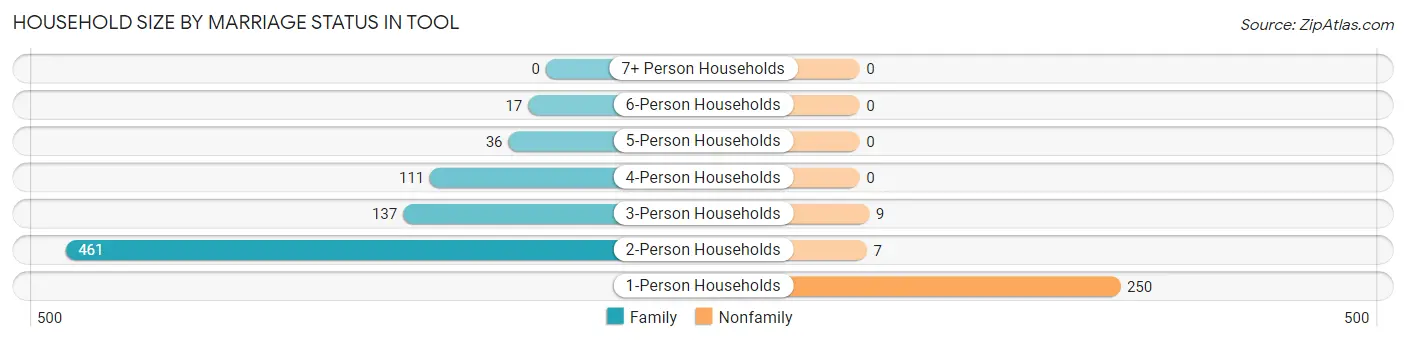
Household Size by Marriage Status in Tool
Out of a total of 1,028 households in Tool, 762 (74.1%) are family households, while 266 (25.9%) are nonfamily households. The most numerous type of family households are 2-person households, comprising 461, and the most common type of nonfamily households are 1-person households, comprising 250.
| Household Size | Family Households | Nonfamily Households |
| 1-Person Households | - | 250 (24.3%) |
| 2-Person Households | 461 (44.8%) | 7 (0.7%) |
| 3-Person Households | 137 (13.3%) | 9 (0.9%) |
| 4-Person Households | 111 (10.8%) | 0 (0.0%) |
| 5-Person Households | 36 (3.5%) | 0 (0.0%) |
| 6-Person Households | 17 (1.7%) | 0 (0.0%) |
| 7+ Person Households | 0 (0.0%) | 0 (0.0%) |
| Total | 762 (74.1%) | 266 (25.9%) |
Female Fertility in Tool
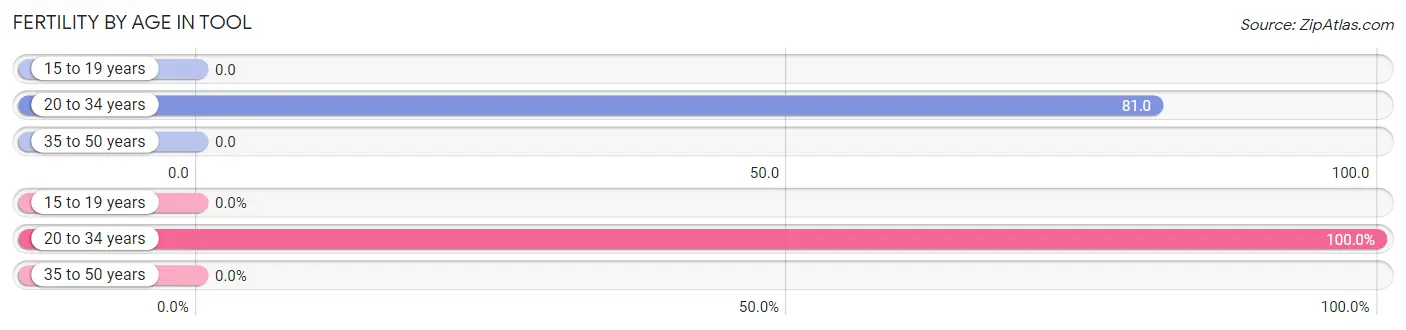
Fertility by Age in Tool
Average fertility rate in Tool is 47.0 births per 1,000 women. Women in the age bracket of 20 to 34 years have the highest fertility rate with 81.0 births per 1,000 women. Women in the age bracket of 20 to 34 years acount for 100.0% of all women with births.
| Age Bracket | Women with Births | Births / 1,000 Women |
| 15 to 19 years | 0 (0.0%) | 0.0 |
| 20 to 34 years | 18 (100.0%) | 81.0 |
| 35 to 50 years | 0 (0.0%) | 0.0 |
| Total | 18 (100.0%) | 47.0 |
Fertility by Age by Marriage Status in Tool
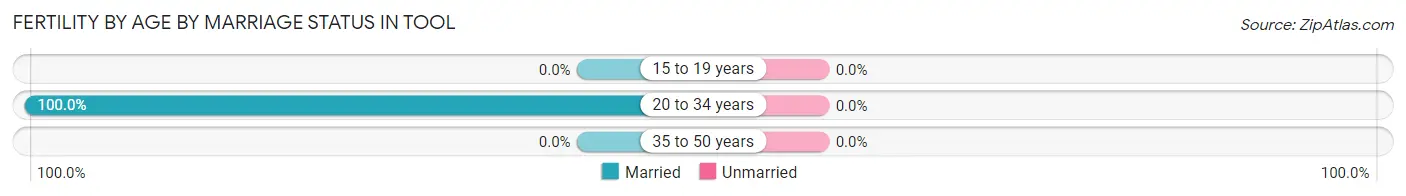
| Age Bracket | Married | Unmarried |
| 15 to 19 years | 0 (0.0%) | 0 (0.0%) |
| 20 to 34 years | 18 (100.0%) | 0 (0.0%) |
| 35 to 50 years | 0 (0.0%) | 0 (0.0%) |
| Total | 18 (100.0%) | 0 (0.0%) |
Fertility by Education in Tool
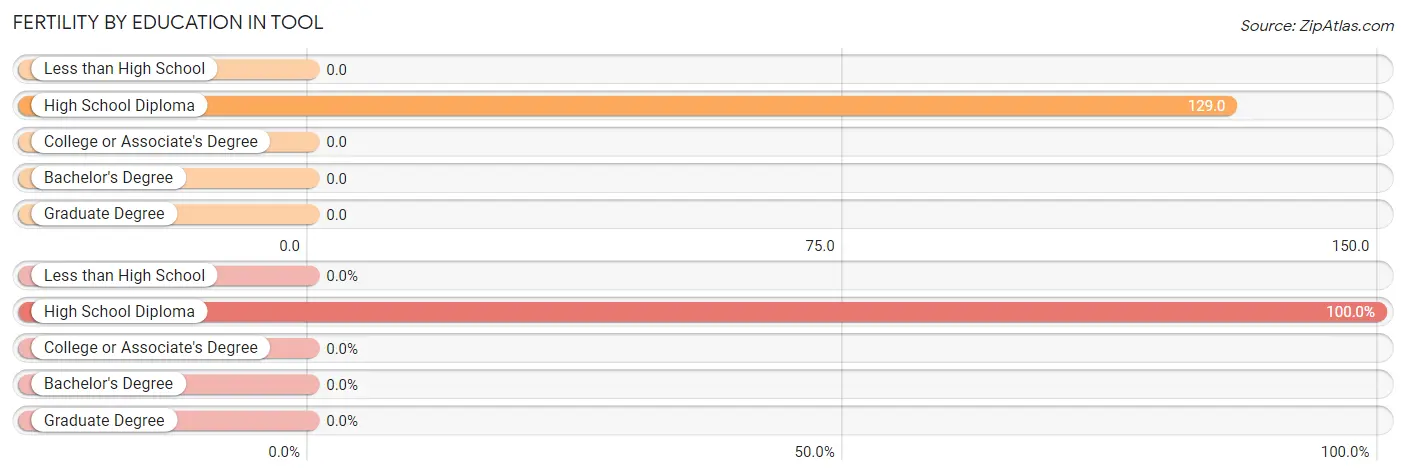
| Educational Attainment | Women with Births | Births / 1,000 Women |
| Less than High School | 0 (0.0%) | 0.0 |
| High School Diploma | 18 (100.0%) | 129.0 |
| College or Associate's Degree | 0 (0.0%) | 0.0 |
| Bachelor's Degree | 0 (0.0%) | 0.0 |
| Graduate Degree | 0 (0.0%) | 0.0 |
| Total | 18 (100.0%) | 47.0 |
Fertility by Education by Marriage Status in Tool
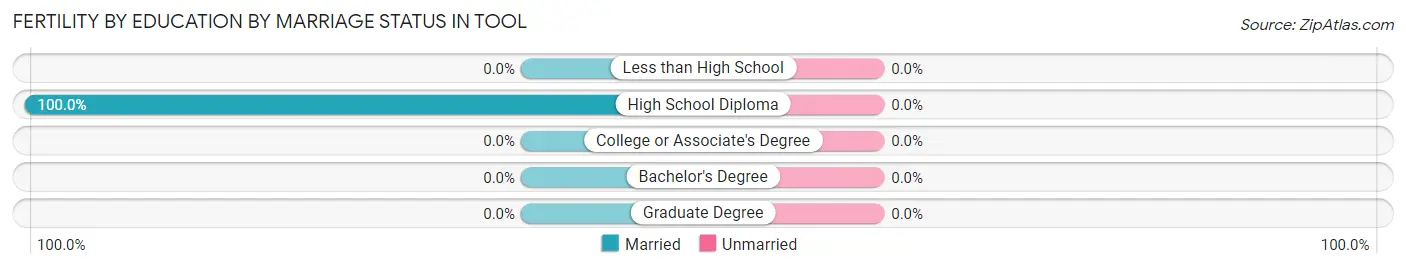
| Educational Attainment | Married | Unmarried |
| Less than High School | 0 (0.0%) | 0 (0.0%) |
| High School Diploma | 18 (100.0%) | 0 (0.0%) |
| College or Associate's Degree | 0 (0.0%) | 0 (0.0%) |
| Bachelor's Degree | 0 (0.0%) | 0 (0.0%) |
| Graduate Degree | 0 (0.0%) | 0 (0.0%) |
| Total | 18 (100.0%) | 0 (0.0%) |
Income in Tool
Income Overview in Tool
Per Capita Income in Tool is $40,553, while median incomes of families and households are $73,056 and $65,417 respectively.
| Characteristic | Number | Measure |
| Per Capita Income | 2,356 | $40,553 |
| Median Family Income | 762 | $73,056 |
| Mean Family Income | 762 | $116,282 |
| Median Household Income | 1,028 | $65,417 |
| Mean Household Income | 1,028 | $97,831 |
| Income Deficit | 762 | $7,219 |
| Wage / Income Gap (%) | 2,356 | 52.00% |
| Wage / Income Gap ($) | 2,356 | 48.00¢ per $1 |
| Gini / Inequality Index | 2,356 | 0.49 |
Earnings by Sex in Tool
Average Earnings in Tool are $42,750, $48,750 for men and $23,400 for women, a difference of 52.0%.
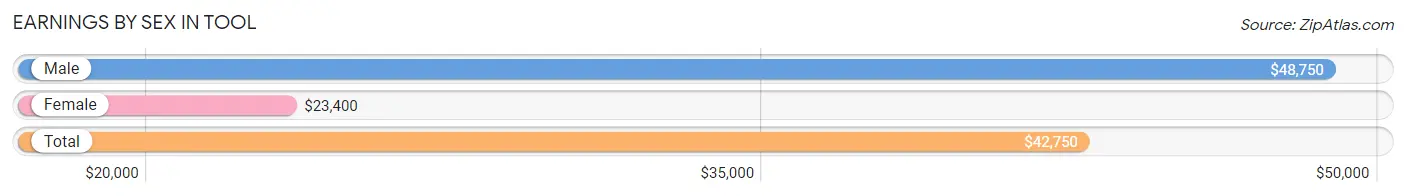
| Sex | Number | Average Earnings |
| Male | 627 (52.8%) | $48,750 |
| Female | 560 (47.2%) | $23,400 |
| Total | 1,187 (100.0%) | $42,750 |
Earnings by Sex by Income Bracket in Tool
The most common earnings brackets in Tool are $100,000+ for men (151 | 24.1%) and $17,500 to $19,999 for women (85 | 15.2%).
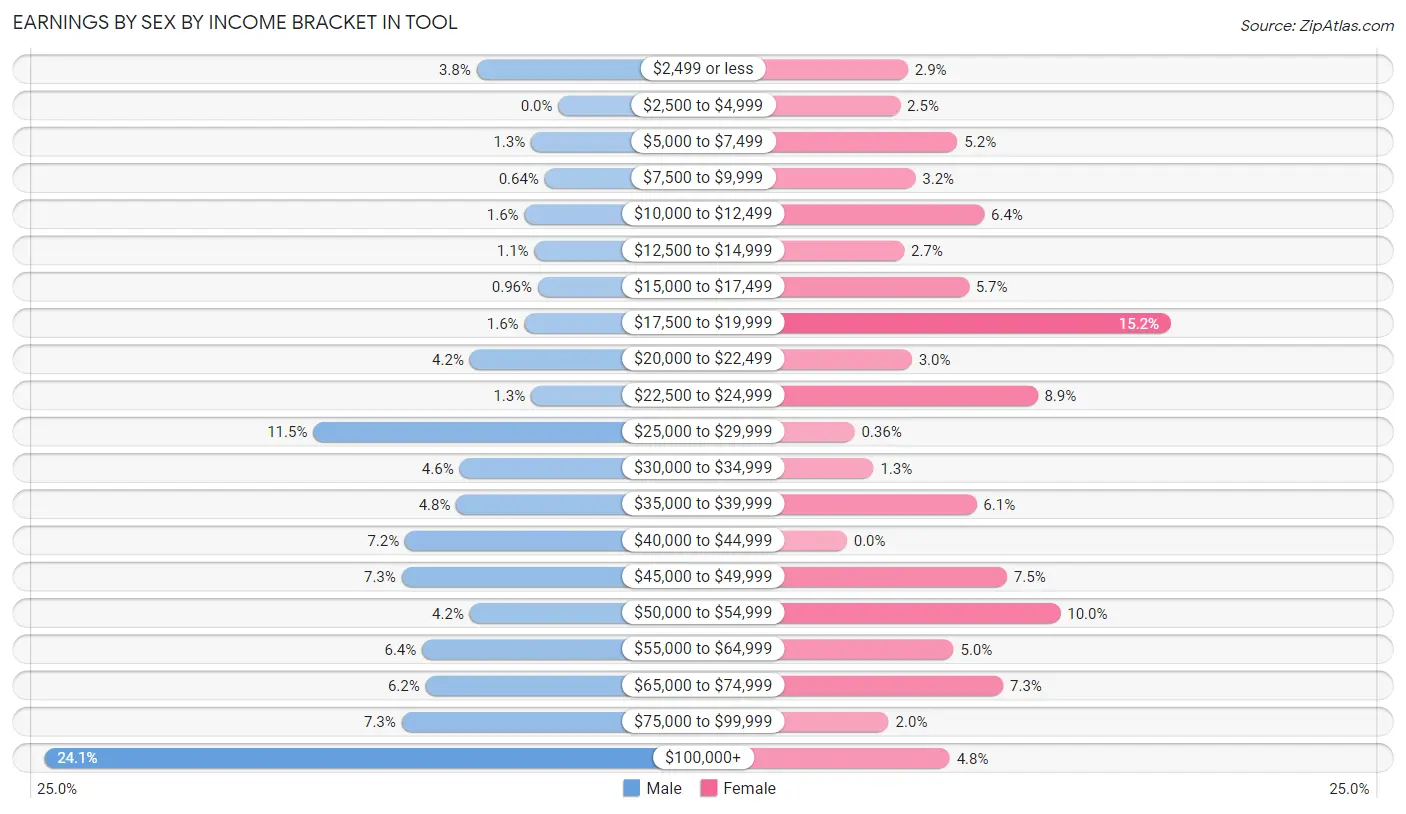
| Income | Male | Female |
| $2,499 or less | 24 (3.8%) | 16 (2.9%) |
| $2,500 to $4,999 | 0 (0.0%) | 14 (2.5%) |
| $5,000 to $7,499 | 8 (1.3%) | 29 (5.2%) |
| $7,500 to $9,999 | 4 (0.6%) | 18 (3.2%) |
| $10,000 to $12,499 | 10 (1.6%) | 36 (6.4%) |
| $12,500 to $14,999 | 7 (1.1%) | 15 (2.7%) |
| $15,000 to $17,499 | 6 (1.0%) | 32 (5.7%) |
| $17,500 to $19,999 | 10 (1.6%) | 85 (15.2%) |
| $20,000 to $22,499 | 26 (4.2%) | 17 (3.0%) |
| $22,500 to $24,999 | 8 (1.3%) | 50 (8.9%) |
| $25,000 to $29,999 | 72 (11.5%) | 2 (0.4%) |
| $30,000 to $34,999 | 29 (4.6%) | 7 (1.3%) |
| $35,000 to $39,999 | 30 (4.8%) | 34 (6.1%) |
| $40,000 to $44,999 | 45 (7.2%) | 0 (0.0%) |
| $45,000 to $49,999 | 46 (7.3%) | 42 (7.5%) |
| $50,000 to $54,999 | 26 (4.2%) | 56 (10.0%) |
| $55,000 to $64,999 | 40 (6.4%) | 28 (5.0%) |
| $65,000 to $74,999 | 39 (6.2%) | 41 (7.3%) |
| $75,000 to $99,999 | 46 (7.3%) | 11 (2.0%) |
| $100,000+ | 151 (24.1%) | 27 (4.8%) |
| Total | 627 (100.0%) | 560 (100.0%) |
Earnings by Sex by Educational Attainment in Tool
Average earnings in Tool are $50,536 for men and $28,125 for women, a difference of 44.4%. Men with an educational attainment of graduate degree enjoy the highest average annual earnings of $137,137, while those with college or associate's degree education earn the least with $29,534. Women with an educational attainment of bachelor's degree earn the most with the average annual earnings of $50,625, while those with high school diploma education have the smallest earnings of $15,978.
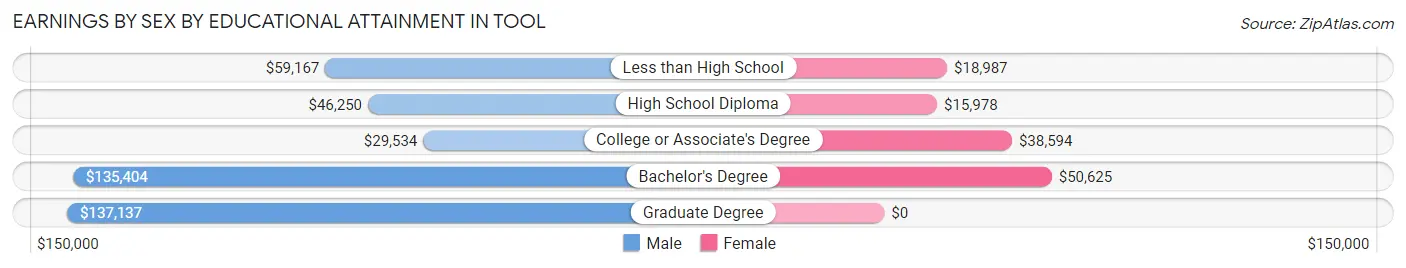
| Educational Attainment | Male Income | Female Income |
| Less than High School | $59,167 | $18,987 |
| High School Diploma | $46,250 | $15,978 |
| College or Associate's Degree | $29,534 | $38,594 |
| Bachelor's Degree | $135,404 | $50,625 |
| Graduate Degree | $137,137 | $0 |
| Total | $50,536 | $28,125 |
Family Income in Tool
Family Income Brackets in Tool
According to the Tool family income data, there are 152 families falling into the $50,000 to $74,999 income range, which is the most common income bracket and makes up 20.0% of all families. Conversely, the $10,000 to $14,999 income bracket is the least frequent group with only 7 families (0.9%) belonging to this category.
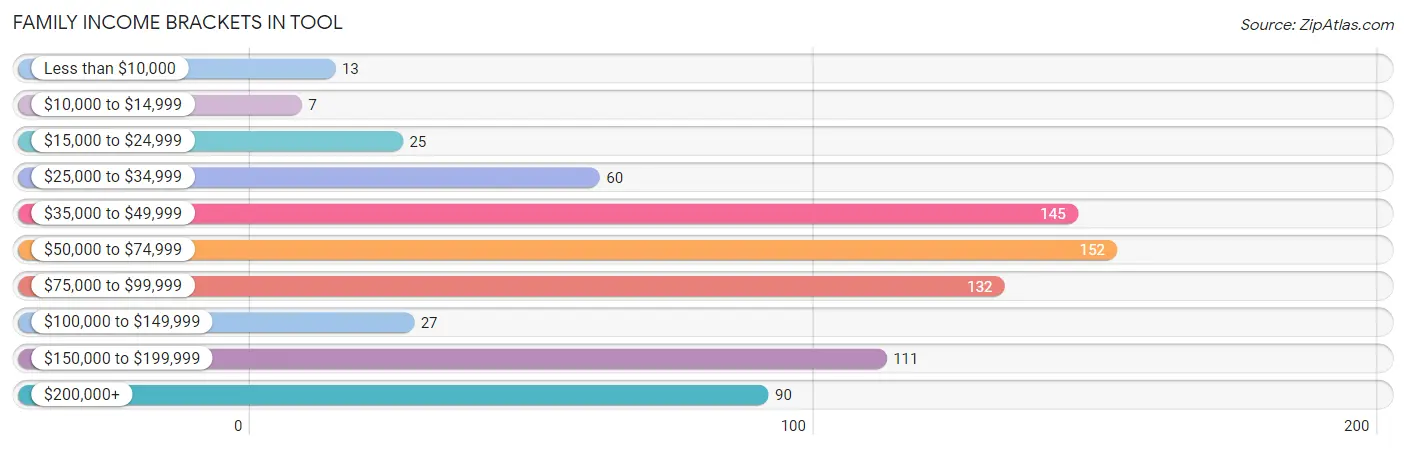
| Income Bracket | # Families | % Families |
| Less than $10,000 | 13 | 1.7% |
| $10,000 to $14,999 | 7 | 0.9% |
| $15,000 to $24,999 | 25 | 3.3% |
| $25,000 to $34,999 | 60 | 7.9% |
| $35,000 to $49,999 | 145 | 19.0% |
| $50,000 to $74,999 | 152 | 19.9% |
| $75,000 to $99,999 | 132 | 17.3% |
| $100,000 to $149,999 | 27 | 3.5% |
| $150,000 to $199,999 | 111 | 14.6% |
| $200,000+ | 90 | 11.8% |
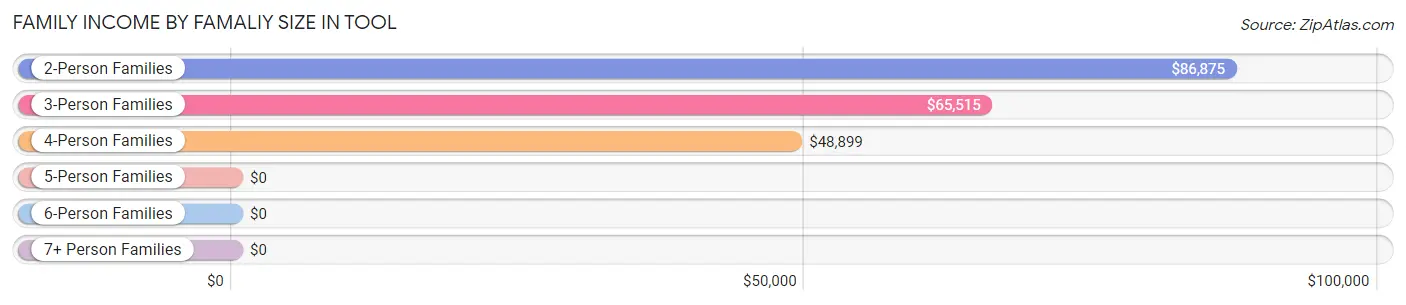
Family Income by Famaliy Size in Tool
2-person families (469 | 61.6%) account for the highest median family income in Tool with $86,875 per family, while 2-person families (469 | 61.6%) have the highest median income of $43,438 per family member.
| Income Bracket | # Families | Median Income |
| 2-Person Families | 469 (61.6%) | $86,875 |
| 3-Person Families | 163 (21.4%) | $65,515 |
| 4-Person Families | 113 (14.8%) | $48,899 |
| 5-Person Families | 0 (0.0%) | $0 |
| 6-Person Families | 17 (2.2%) | $0 |
| 7+ Person Families | 0 (0.0%) | $0 |
| Total | 762 (100.0%) | $73,056 |
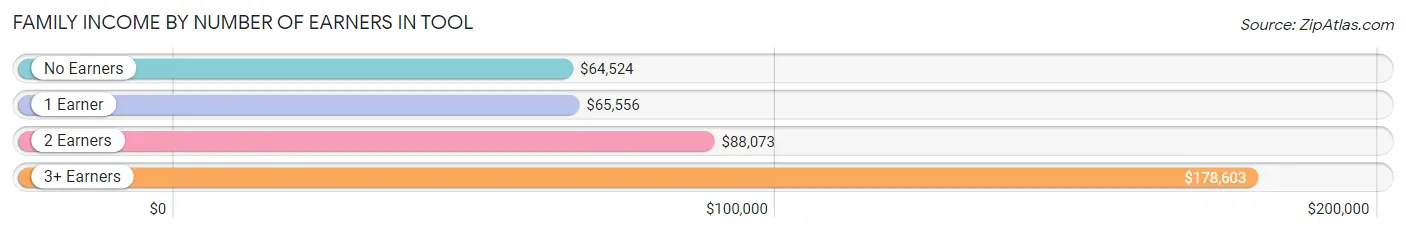
Family Income by Number of Earners in Tool
The median family income in Tool is $73,056, with families comprising 3+ earners (61) having the highest median family income of $178,603, while families with no earners (154) have the lowest median family income of $64,524, accounting for 8.0% and 20.2% of families, respectively.
| Number of Earners | # Families | Median Income |
| No Earners | 154 (20.2%) | $64,524 |
| 1 Earner | 216 (28.3%) | $65,556 |
| 2 Earners | 331 (43.4%) | $88,073 |
| 3+ Earners | 61 (8.0%) | $178,603 |
| Total | 762 (100.0%) | $73,056 |
Household Income in Tool
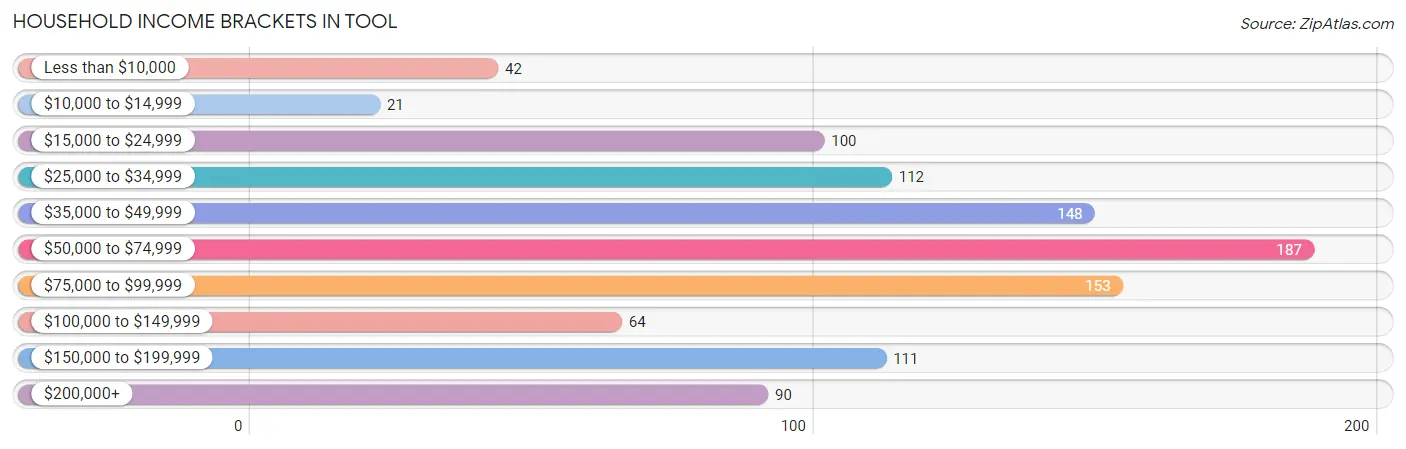
Household Income Brackets in Tool
With 187 households falling in the category, the $50,000 to $74,999 income range is the most frequent in Tool, accounting for 18.2% of all households. In contrast, only 21 households (2.0%) fall into the $10,000 to $14,999 income bracket, making it the least populous group.
| Income Bracket | # Households | % Households |
| Less than $10,000 | 42 | 4.1% |
| $10,000 to $14,999 | 21 | 2.0% |
| $15,000 to $24,999 | 100 | 9.7% |
| $25,000 to $34,999 | 112 | 10.9% |
| $35,000 to $49,999 | 148 | 14.4% |
| $50,000 to $74,999 | 187 | 18.2% |
| $75,000 to $99,999 | 153 | 14.9% |
| $100,000 to $149,999 | 64 | 6.2% |
| $150,000 to $199,999 | 111 | 10.8% |
| $200,000+ | 90 | 8.8% |
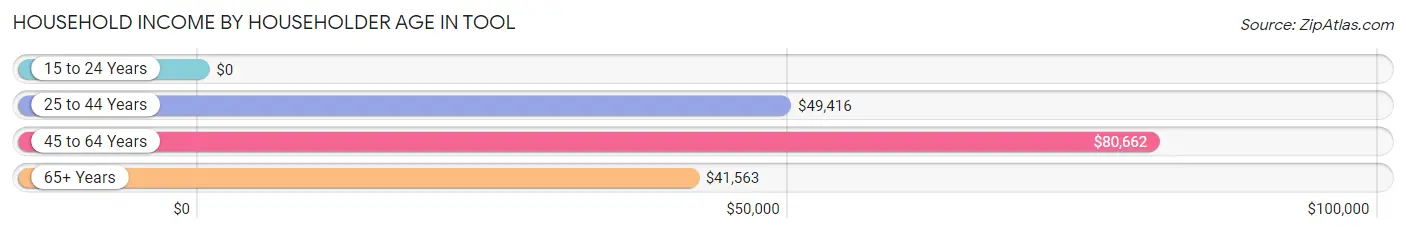
Household Income by Householder Age in Tool
The median household income in Tool is $65,417, with the highest median household income of $80,662 found in the 45 to 64 years age bracket for the primary householder. A total of 439 households (42.7%) fall into this category. Meanwhile, the 15 to 24 years age bracket for the primary householder has the lowest median household income of $0, with 27 households (2.6%) in this group.
| Income Bracket | # Households | Median Income |
| 15 to 24 Years | 27 (2.6%) | $0 |
| 25 to 44 Years | 168 (16.3%) | $49,416 |
| 45 to 64 Years | 439 (42.7%) | $80,662 |
| 65+ Years | 394 (38.3%) | $41,563 |
| Total | 1,028 (100.0%) | $65,417 |
Poverty in Tool
Income Below Poverty by Sex and Age in Tool
With 7.1% poverty level for males and 8.7% for females among the residents of Tool, 35 to 44 year old males and 35 to 44 year old females are the most vulnerable to poverty, with 4 males (28.6%) and 22 females (20.0%) in their respective age groups living below the poverty level.
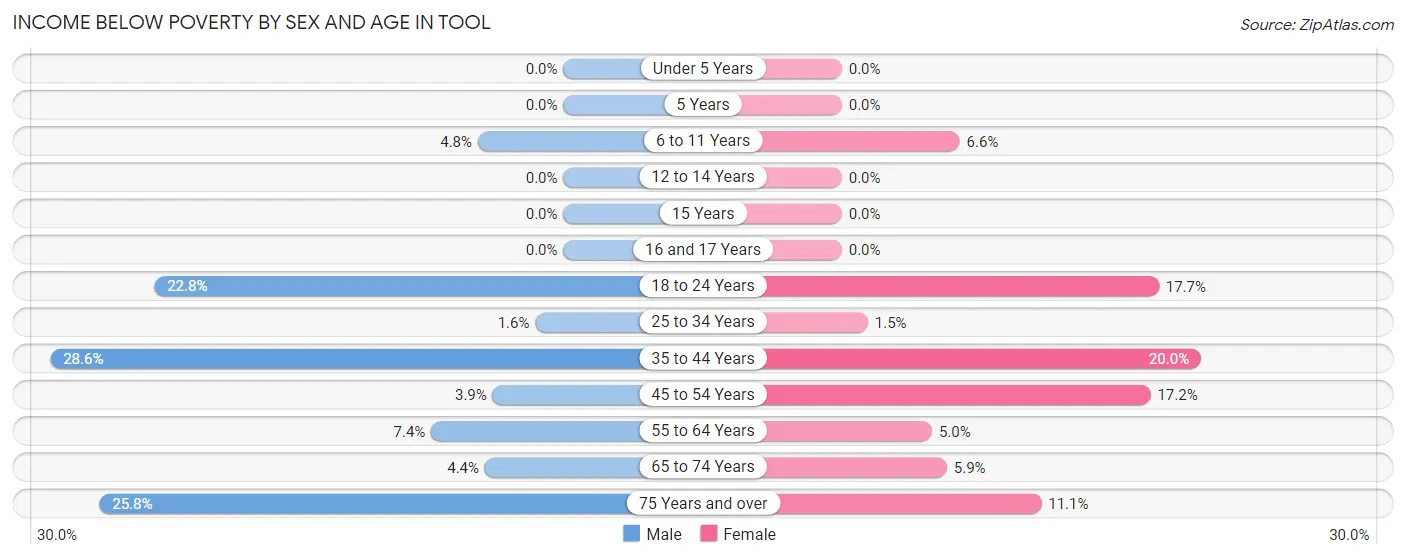
| Age Bracket | Male | Female |
| Under 5 Years | 0 (0.0%) | 0 (0.0%) |
| 5 Years | 0 (0.0%) | 0 (0.0%) |
| 6 to 11 Years | 4 (4.8%) | 4 (6.6%) |
| 12 to 14 Years | 0 (0.0%) | 0 (0.0%) |
| 15 Years | 0 (0.0%) | 0 (0.0%) |
| 16 and 17 Years | 0 (0.0%) | 0 (0.0%) |
| 18 to 24 Years | 18 (22.8%) | 15 (17.6%) |
| 25 to 34 Years | 3 (1.6%) | 2 (1.5%) |
| 35 to 44 Years | 4 (28.6%) | 22 (20.0%) |
| 45 to 54 Years | 8 (3.9%) | 22 (17.2%) |
| 55 to 64 Years | 17 (7.4%) | 11 (5.0%) |
| 65 to 74 Years | 10 (4.4%) | 12 (5.9%) |
| 75 Years and over | 23 (25.8%) | 8 (11.1%) |
| Total | 87 (7.1%) | 96 (8.7%) |
Income Above Poverty by Sex and Age in Tool
According to the poverty statistics in Tool, males aged under 5 years and females aged under 5 years are the age groups that are most secure financially, with 100.0% of males and 100.0% of females in these age groups living above the poverty line.
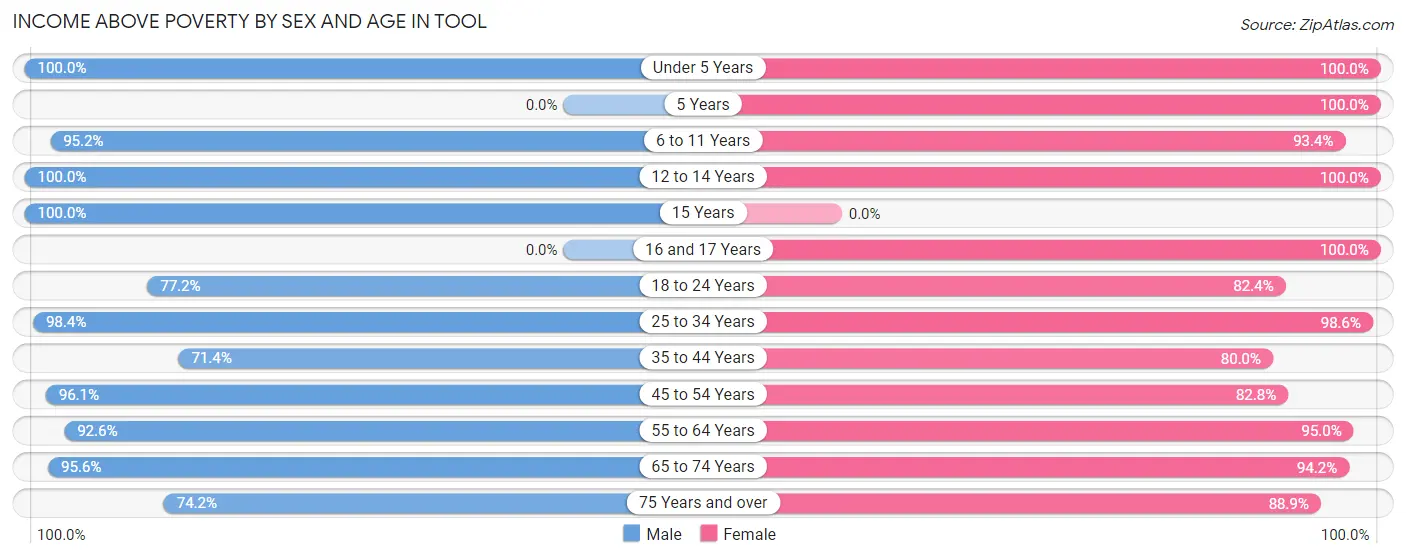
| Age Bracket | Male | Female |
| Under 5 Years | 27 (100.0%) | 52 (100.0%) |
| 5 Years | 0 (0.0%) | 11 (100.0%) |
| 6 to 11 Years | 80 (95.2%) | 57 (93.4%) |
| 12 to 14 Years | 50 (100.0%) | 13 (100.0%) |
| 15 Years | 19 (100.0%) | 0 (0.0%) |
| 16 and 17 Years | 0 (0.0%) | 4 (100.0%) |
| 18 to 24 Years | 61 (77.2%) | 70 (82.4%) |
| 25 to 34 Years | 189 (98.4%) | 136 (98.6%) |
| 35 to 44 Years | 10 (71.4%) | 88 (80.0%) |
| 45 to 54 Years | 195 (96.1%) | 106 (82.8%) |
| 55 to 64 Years | 214 (92.6%) | 208 (95.0%) |
| 65 to 74 Years | 219 (95.6%) | 193 (94.2%) |
| 75 Years and over | 66 (74.2%) | 64 (88.9%) |
| Total | 1,130 (92.8%) | 1,002 (91.3%) |
Income Below Poverty Among Married-Couple Families in Tool
The poverty statistics for married-couple families in Tool show that 4.9% or 32 of the total 656 families live below the poverty line. Families with no children have the highest poverty rate of 5.9%, comprising of 30 families. On the other hand, families with 1 or 2 children have the lowest poverty rate of 1.4%, which includes 2 families.
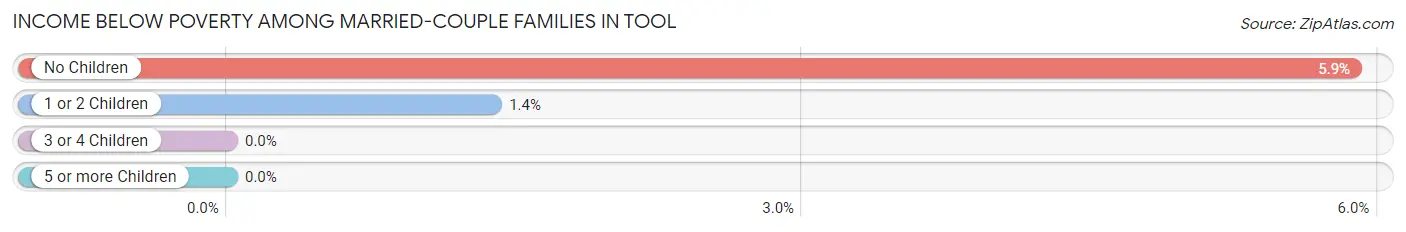
| Children | Above Poverty | Below Poverty |
| No Children | 481 (94.1%) | 30 (5.9%) |
| 1 or 2 Children | 143 (98.6%) | 2 (1.4%) |
| 3 or 4 Children | 0 (0.0%) | 0 (0.0%) |
| 5 or more Children | 0 (0.0%) | 0 (0.0%) |
| Total | 624 (95.1%) | 32 (4.9%) |
Income Below Poverty Among Single-Parent Households in Tool
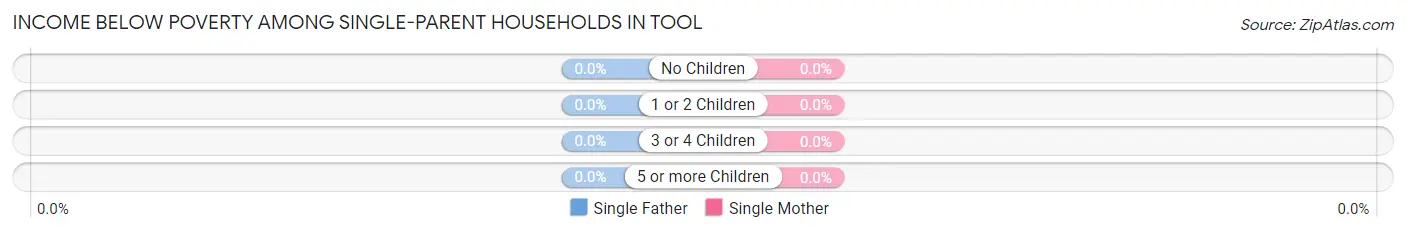
| Children | Single Father | Single Mother |
| No Children | 0 (0.0%) | 0 (0.0%) |
| 1 or 2 Children | 0 (0.0%) | 0 (0.0%) |
| 3 or 4 Children | 0 (0.0%) | 0 (0.0%) |
| 5 or more Children | 0 (0.0%) | 0 (0.0%) |
| Total | 0 (0.0%) | 0 (0.0%) |
Income Below Poverty Among Married-Couple vs Single-Parent Households in Tool
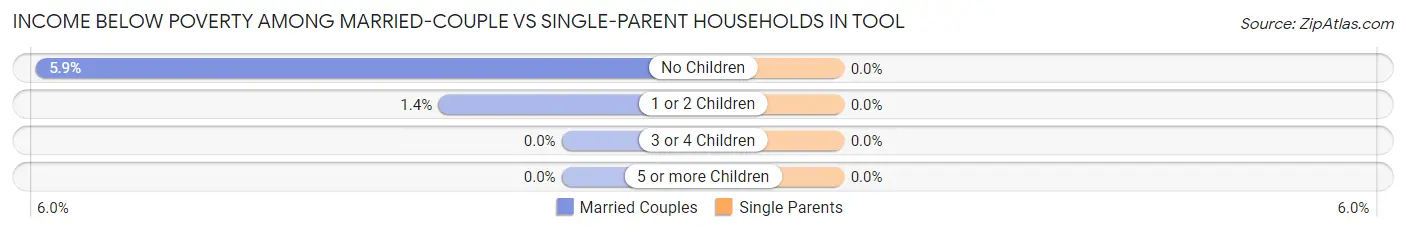
| Children | Married-Couple Families | Single-Parent Households |
| No Children | 30 (5.9%) | 0 (0.0%) |
| 1 or 2 Children | 2 (1.4%) | 0 (0.0%) |
| 3 or 4 Children | 0 (0.0%) | 0 (0.0%) |
| 5 or more Children | 0 (0.0%) | 0 (0.0%) |
| Total | 32 (4.9%) | 0 (0.0%) |
Employment Characteristics in Tool
Employment by Class of Employer in Tool
Among the 1,097 employed individuals in Tool, private company employees (644 | 58.7%), local government employees (159 | 14.5%), and self-employed (not incorporated) (131 | 11.9%) make up the most common classes of employment.
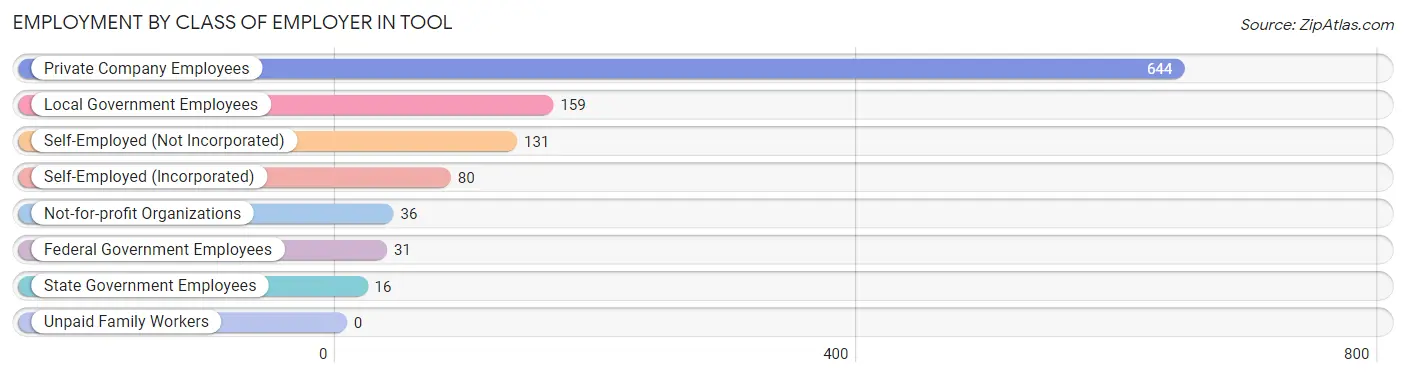
| Employer Class | # Employees | % Employees |
| Private Company Employees | 644 | 58.7% |
| Self-Employed (Incorporated) | 80 | 7.3% |
| Self-Employed (Not Incorporated) | 131 | 11.9% |
| Not-for-profit Organizations | 36 | 3.3% |
| Local Government Employees | 159 | 14.5% |
| State Government Employees | 16 | 1.5% |
| Federal Government Employees | 31 | 2.8% |
| Unpaid Family Workers | 0 | 0.0% |
| Total | 1,097 | 100.0% |
Employment Status by Age in Tool
According to the labor force statistics for Tool, out of the total population over 16 years of age (1,998), 57.9% or 1,157 individuals are in the labor force, with 3.7% or 43 of them unemployed. The age group with the highest labor force participation rate is 25 to 29 years, with 99.1% or 112 individuals in the labor force. Within the labor force, the 35 to 44 years age range has the highest percentage of unemployed individuals, with 12.0% or 12 of them being unemployed.
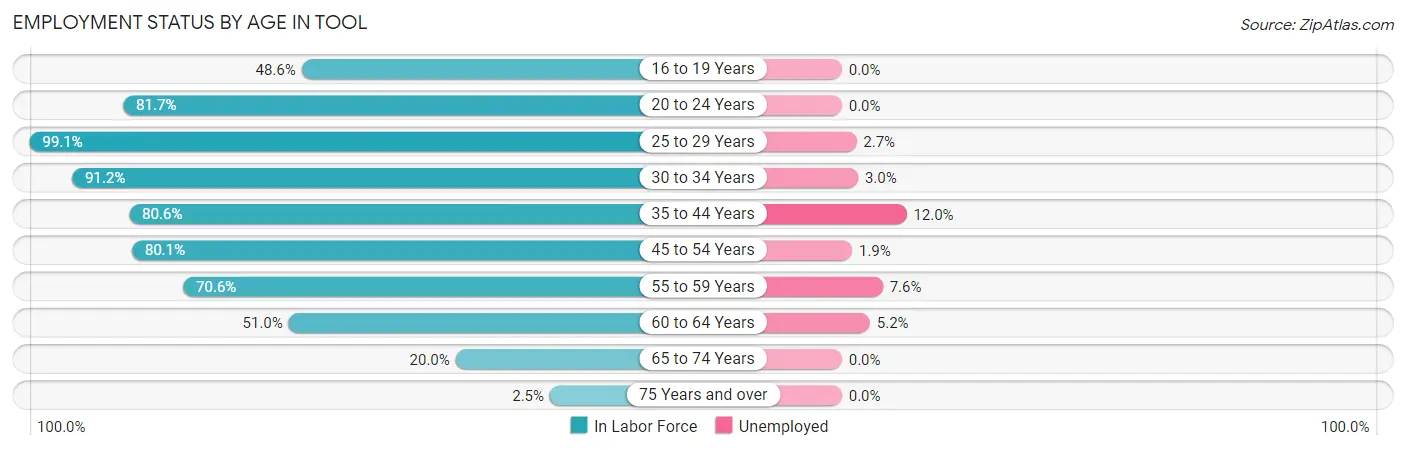
| Age Bracket | In Labor Force | Unemployed |
| 16 to 19 Years | 18 (48.6%) | 0 (0.0%) |
| 20 to 24 Years | 107 (81.7%) | 0 (0.0%) |
| 25 to 29 Years | 112 (99.1%) | 3 (2.7%) |
| 30 to 34 Years | 198 (91.2%) | 6 (3.0%) |
| 35 to 44 Years | 100 (80.6%) | 12 (12.0%) |
| 45 to 54 Years | 265 (80.1%) | 5 (1.9%) |
| 55 to 59 Years | 132 (70.6%) | 10 (7.6%) |
| 60 to 64 Years | 134 (51.0%) | 7 (5.2%) |
| 65 to 74 Years | 87 (20.0%) | 0 (0.0%) |
| 75 Years and over | 4 (2.5%) | 0 (0.0%) |
| Total | 1,157 (57.9%) | 43 (3.7%) |
Employment Status by Educational Attainment in Tool
According to labor force statistics for Tool, 76.2% of individuals (941) out of the total population between 25 and 64 years of age (1,235) are in the labor force, with 4.6% or 43 of them being unemployed. The group with the highest labor force participation rate are those with the educational attainment of bachelor's degree or higher, with 89.6% or 275 individuals in the labor force. Within the labor force, individuals with less than high school education have the highest percentage of unemployment, with 13.7% or 22 of them being unemployed.
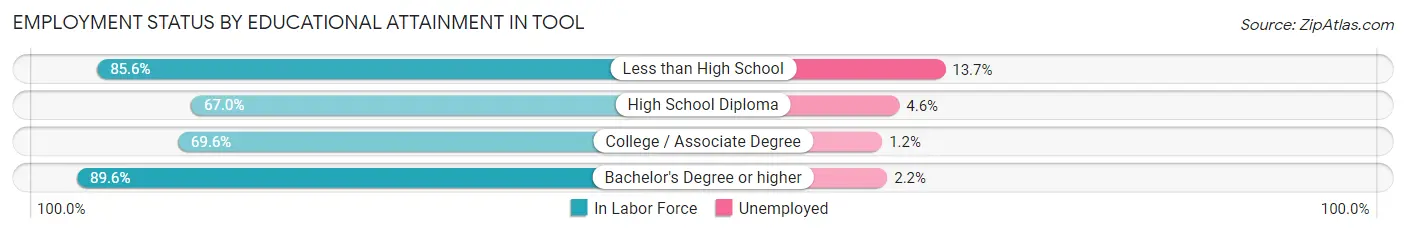
| Educational Attainment | In Labor Force | Unemployed |
| Less than High School | 161 (85.6%) | 26 (13.7%) |
| High School Diploma | 262 (67.0%) | 18 (4.6%) |
| College / Associate Degree | 243 (69.6%) | 4 (1.2%) |
| Bachelor's Degree or higher | 275 (89.6%) | 7 (2.2%) |
| Total | 941 (76.2%) | 57 (4.6%) |
Employment Occupations by Sex in Tool
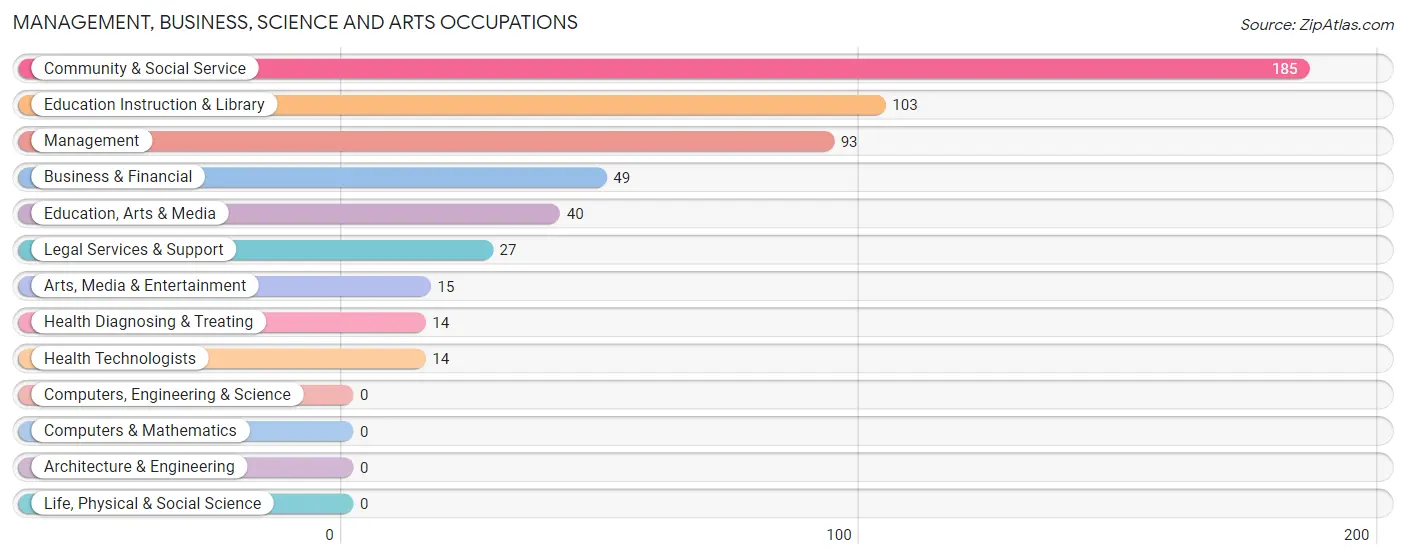
Management, Business, Science and Arts Occupations
The most common Management, Business, Science and Arts occupations in Tool are Community & Social Service (185 | 16.6%), Education Instruction & Library (103 | 9.2%), Management (93 | 8.4%), Business & Financial (49 | 4.4%), and Education, Arts & Media (40 | 3.6%).
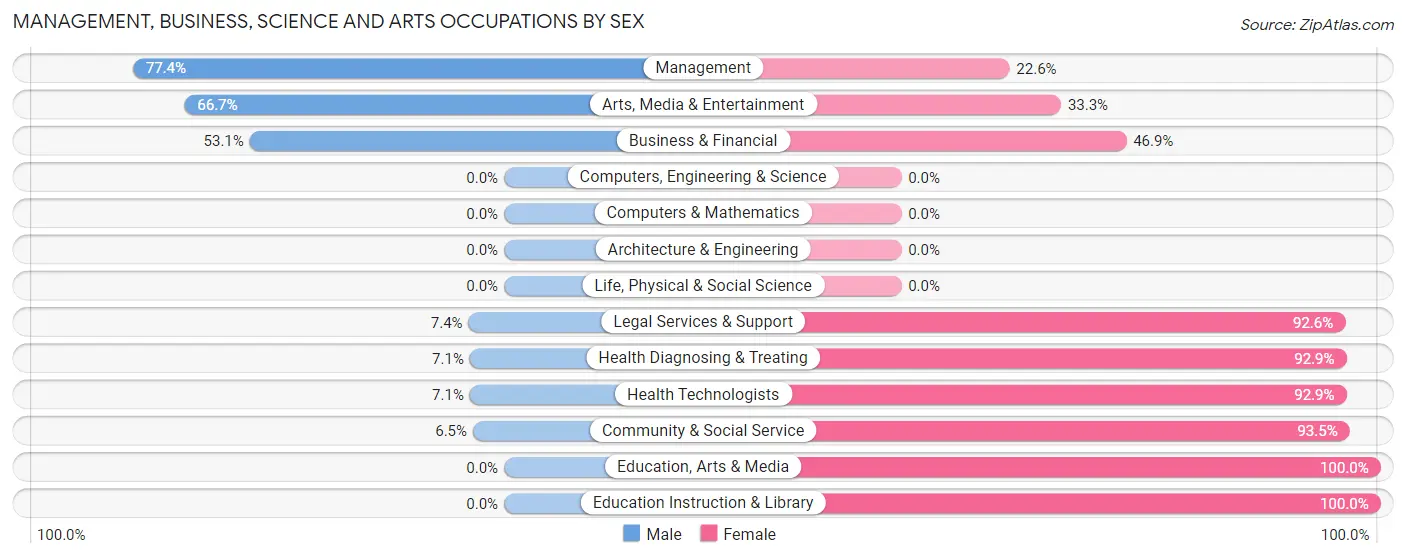
Management, Business, Science and Arts Occupations by Sex
Within the Management, Business, Science and Arts occupations in Tool, the most male-oriented occupations are Management (77.4%), Arts, Media & Entertainment (66.7%), and Business & Financial (53.1%), while the most female-oriented occupations are Education, Arts & Media (100.0%), Education Instruction & Library (100.0%), and Community & Social Service (93.5%).
| Occupation | Male | Female |
| Management | 72 (77.4%) | 21 (22.6%) |
| Business & Financial | 26 (53.1%) | 23 (46.9%) |
| Computers, Engineering & Science | 0 (0.0%) | 0 (0.0%) |
| Computers & Mathematics | 0 (0.0%) | 0 (0.0%) |
| Architecture & Engineering | 0 (0.0%) | 0 (0.0%) |
| Life, Physical & Social Science | 0 (0.0%) | 0 (0.0%) |
| Community & Social Service | 12 (6.5%) | 173 (93.5%) |
| Education, Arts & Media | 0 (0.0%) | 40 (100.0%) |
| Legal Services & Support | 2 (7.4%) | 25 (92.6%) |
| Education Instruction & Library | 0 (0.0%) | 103 (100.0%) |
| Arts, Media & Entertainment | 10 (66.7%) | 5 (33.3%) |
| Health Diagnosing & Treating | 1 (7.1%) | 13 (92.9%) |
| Health Technologists | 1 (7.1%) | 13 (92.9%) |
| Total (Category) | 111 (32.6%) | 230 (67.4%) |
| Total (Overall) | 614 (55.1%) | 500 (44.9%) |
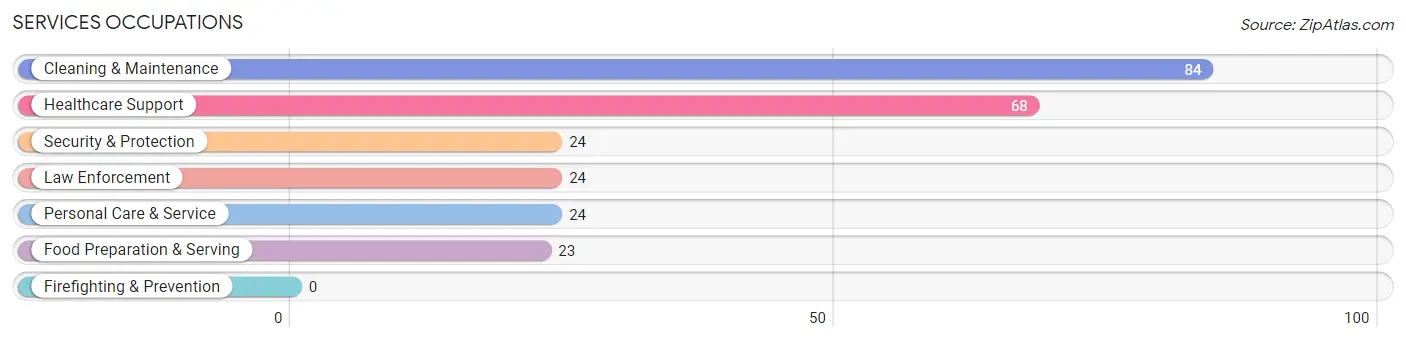
Services Occupations
The most common Services occupations in Tool are Cleaning & Maintenance (84 | 7.5%), Healthcare Support (68 | 6.1%), Security & Protection (24 | 2.1%), Law Enforcement (24 | 2.1%), and Personal Care & Service (24 | 2.1%).
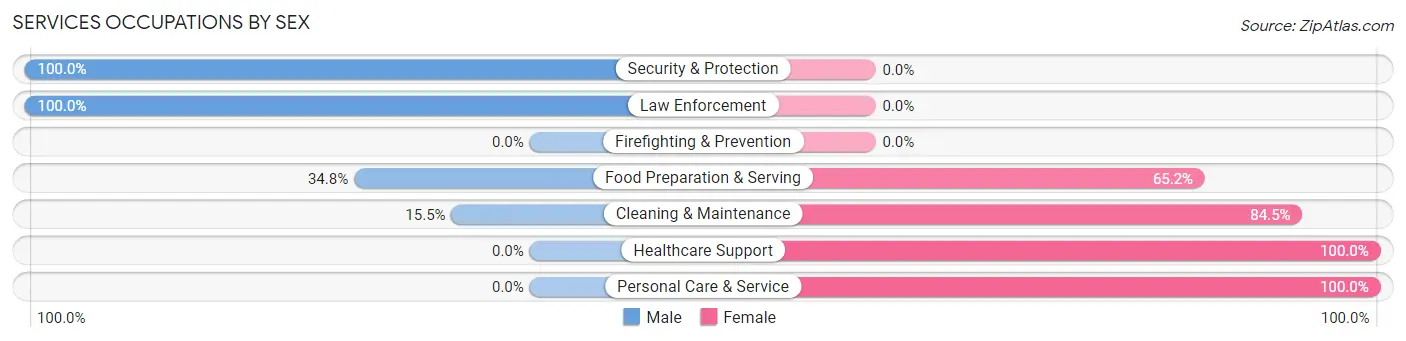
Services Occupations by Sex
Within the Services occupations in Tool, the most male-oriented occupations are Security & Protection (100.0%), Law Enforcement (100.0%), and Food Preparation & Serving (34.8%), while the most female-oriented occupations are Healthcare Support (100.0%), Personal Care & Service (100.0%), and Cleaning & Maintenance (84.5%).
| Occupation | Male | Female |
| Healthcare Support | 0 (0.0%) | 68 (100.0%) |
| Security & Protection | 24 (100.0%) | 0 (0.0%) |
| Firefighting & Prevention | 0 (0.0%) | 0 (0.0%) |
| Law Enforcement | 24 (100.0%) | 0 (0.0%) |
| Food Preparation & Serving | 8 (34.8%) | 15 (65.2%) |
| Cleaning & Maintenance | 13 (15.5%) | 71 (84.5%) |
| Personal Care & Service | 0 (0.0%) | 24 (100.0%) |
| Total (Category) | 45 (20.2%) | 178 (79.8%) |
| Total (Overall) | 614 (55.1%) | 500 (44.9%) |
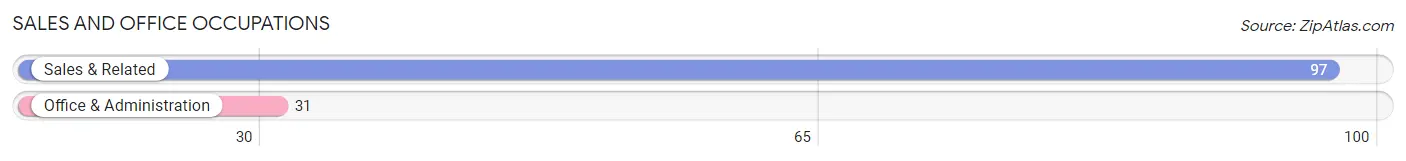
Sales and Office Occupations
The most common Sales and Office occupations in Tool are Sales & Related (97 | 8.7%), and Office & Administration (31 | 2.8%).
Sales and Office Occupations by Sex
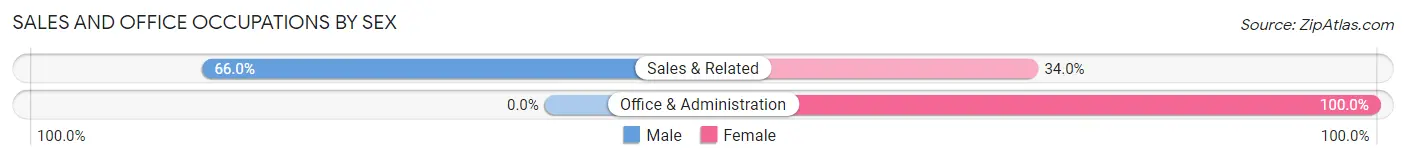
| Occupation | Male | Female |
| Sales & Related | 64 (66.0%) | 33 (34.0%) |
| Office & Administration | 0 (0.0%) | 31 (100.0%) |
| Total (Category) | 64 (50.0%) | 64 (50.0%) |
| Total (Overall) | 614 (55.1%) | 500 (44.9%) |
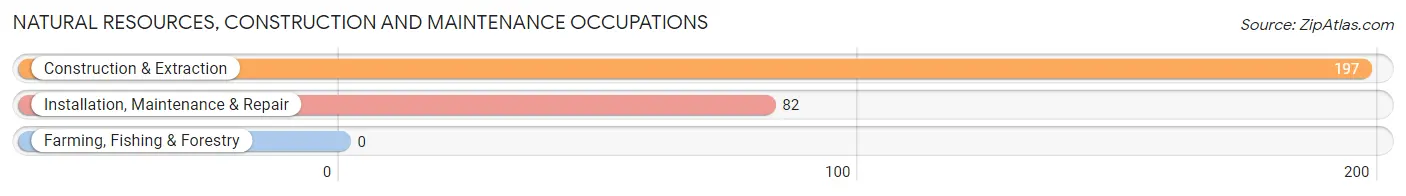
Natural Resources, Construction and Maintenance Occupations
The most common Natural Resources, Construction and Maintenance occupations in Tool are Construction & Extraction (197 | 17.7%), and Installation, Maintenance & Repair (82 | 7.4%).
Natural Resources, Construction and Maintenance Occupations by Sex
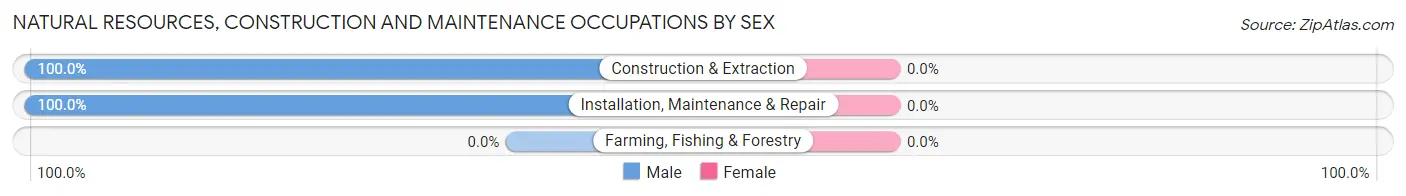
| Occupation | Male | Female |
| Farming, Fishing & Forestry | 0 (0.0%) | 0 (0.0%) |
| Construction & Extraction | 197 (100.0%) | 0 (0.0%) |
| Installation, Maintenance & Repair | 82 (100.0%) | 0 (0.0%) |
| Total (Category) | 279 (100.0%) | 0 (0.0%) |
| Total (Overall) | 614 (55.1%) | 500 (44.9%) |
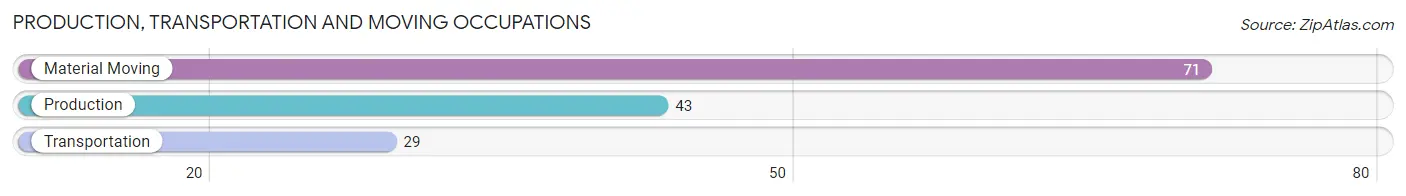
Production, Transportation and Moving Occupations
The most common Production, Transportation and Moving occupations in Tool are Material Moving (71 | 6.4%), Production (43 | 3.9%), and Transportation (29 | 2.6%).
Production, Transportation and Moving Occupations by Sex
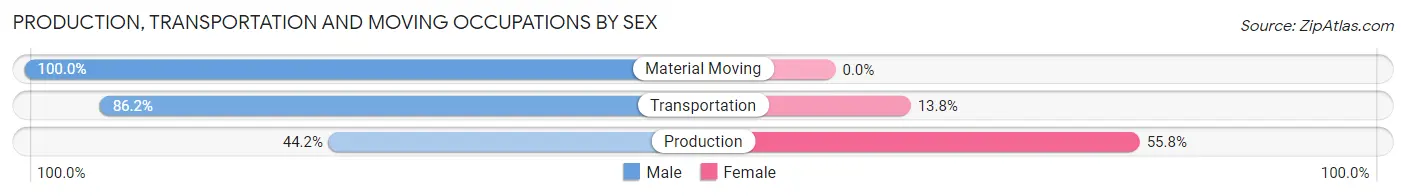
| Occupation | Male | Female |
| Production | 19 (44.2%) | 24 (55.8%) |
| Transportation | 25 (86.2%) | 4 (13.8%) |
| Material Moving | 71 (100.0%) | 0 (0.0%) |
| Total (Category) | 115 (80.4%) | 28 (19.6%) |
| Total (Overall) | 614 (55.1%) | 500 (44.9%) |
Employment Industries by Sex in Tool
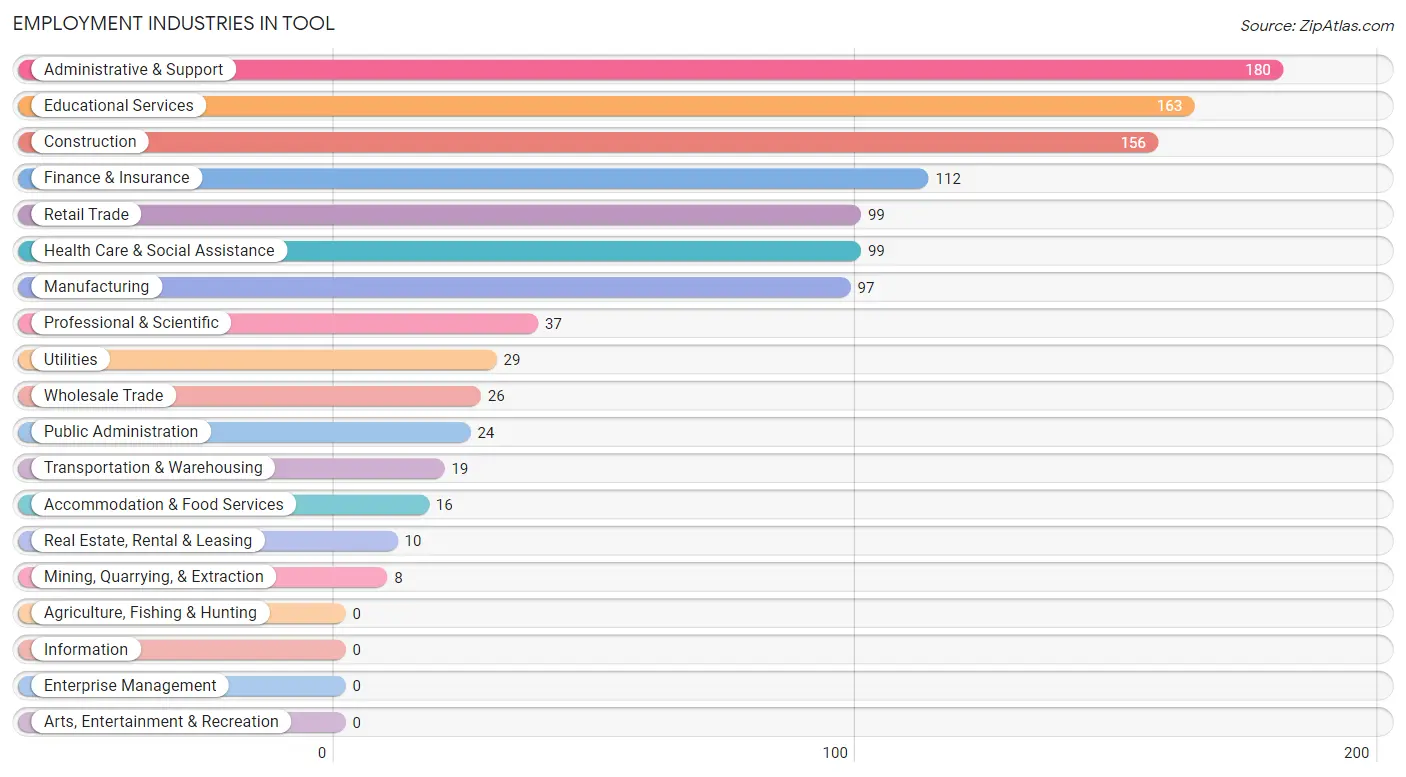
Employment Industries in Tool
The major employment industries in Tool include Administrative & Support (180 | 16.2%), Educational Services (163 | 14.6%), Construction (156 | 14.0%), Finance & Insurance (112 | 10.1%), and Retail Trade (99 | 8.9%).
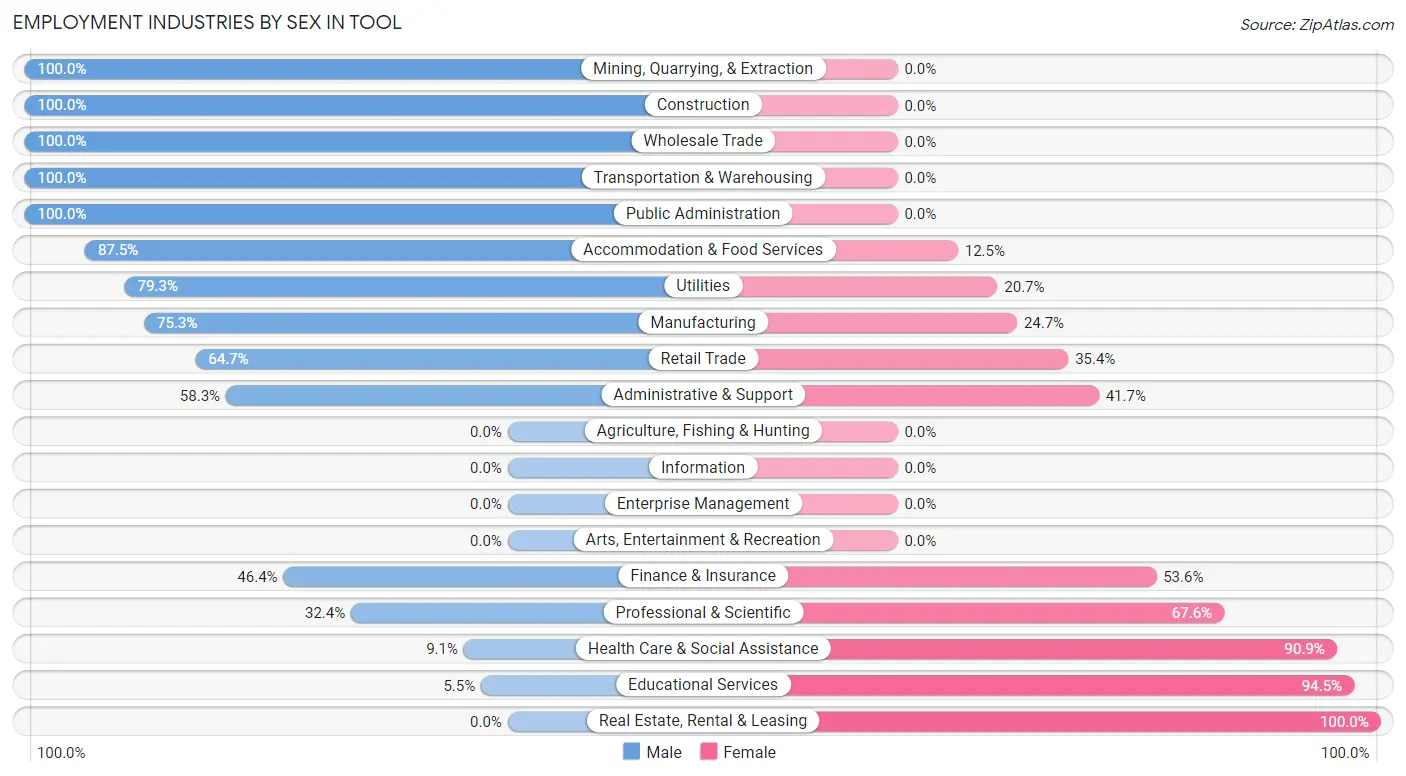
Employment Industries by Sex in Tool
The Tool industries that see more men than women are Mining, Quarrying, & Extraction (100.0%), Construction (100.0%), and Wholesale Trade (100.0%), whereas the industries that tend to have a higher number of women are Real Estate, Rental & Leasing (100.0%), Educational Services (94.5%), and Health Care & Social Assistance (90.9%).
| Industry | Male | Female |
| Agriculture, Fishing & Hunting | 0 (0.0%) | 0 (0.0%) |
| Mining, Quarrying, & Extraction | 8 (100.0%) | 0 (0.0%) |
| Construction | 156 (100.0%) | 0 (0.0%) |
| Manufacturing | 73 (75.3%) | 24 (24.7%) |
| Wholesale Trade | 26 (100.0%) | 0 (0.0%) |
| Retail Trade | 64 (64.6%) | 35 (35.3%) |
| Transportation & Warehousing | 19 (100.0%) | 0 (0.0%) |
| Utilities | 23 (79.3%) | 6 (20.7%) |
| Information | 0 (0.0%) | 0 (0.0%) |
| Finance & Insurance | 52 (46.4%) | 60 (53.6%) |
| Real Estate, Rental & Leasing | 0 (0.0%) | 10 (100.0%) |
| Professional & Scientific | 12 (32.4%) | 25 (67.6%) |
| Enterprise Management | 0 (0.0%) | 0 (0.0%) |
| Administrative & Support | 105 (58.3%) | 75 (41.7%) |
| Educational Services | 9 (5.5%) | 154 (94.5%) |
| Health Care & Social Assistance | 9 (9.1%) | 90 (90.9%) |
| Arts, Entertainment & Recreation | 0 (0.0%) | 0 (0.0%) |
| Accommodation & Food Services | 14 (87.5%) | 2 (12.5%) |
| Public Administration | 24 (100.0%) | 0 (0.0%) |
| Total | 614 (55.1%) | 500 (44.9%) |
Education in Tool
School Enrollment in Tool
The most common levels of schooling among the 295 students in Tool are elementary school (106 | 35.9%), middle school (88 | 29.8%), and nursery / preschool (27 | 9.1%).
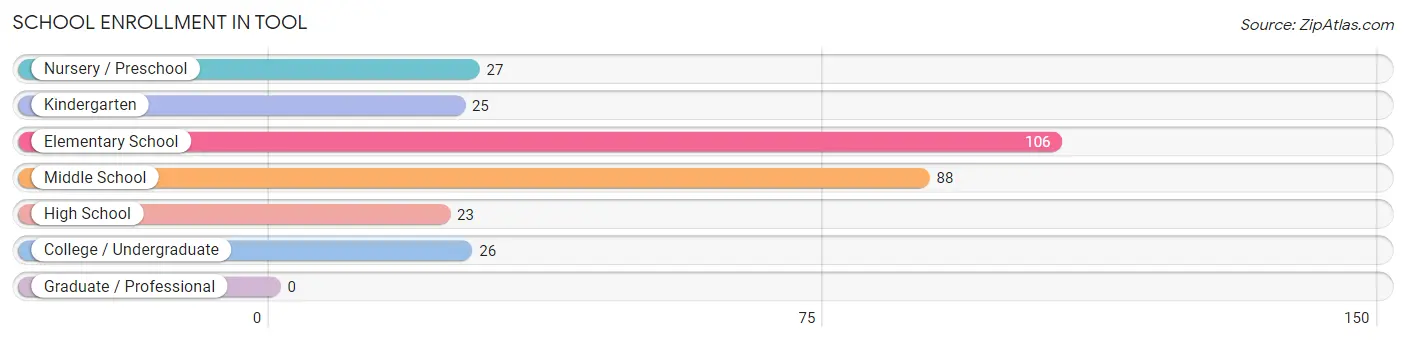
| School Level | # Students | % Students |
| Nursery / Preschool | 27 | 9.1% |
| Kindergarten | 25 | 8.5% |
| Elementary School | 106 | 35.9% |
| Middle School | 88 | 29.8% |
| High School | 23 | 7.8% |
| College / Undergraduate | 26 | 8.8% |
| Graduate / Professional | 0 | 0.0% |
| Total | 295 | 100.0% |
School Enrollment by Age by Funding Source in Tool
Out of a total of 295 students who are enrolled in schools in Tool, 27 (9.2%) attend a private institution, while the remaining 268 (90.8%) are enrolled in public schools. The age group of 3 to 4 year olds has the highest likelihood of being enrolled in private schools, with 27 (100.0% in the age bracket) enrolled. Conversely, the age group of 5 to 9 year old has the lowest likelihood of being enrolled in a private school, with 40 (100.0% in the age bracket) attending a public institution.
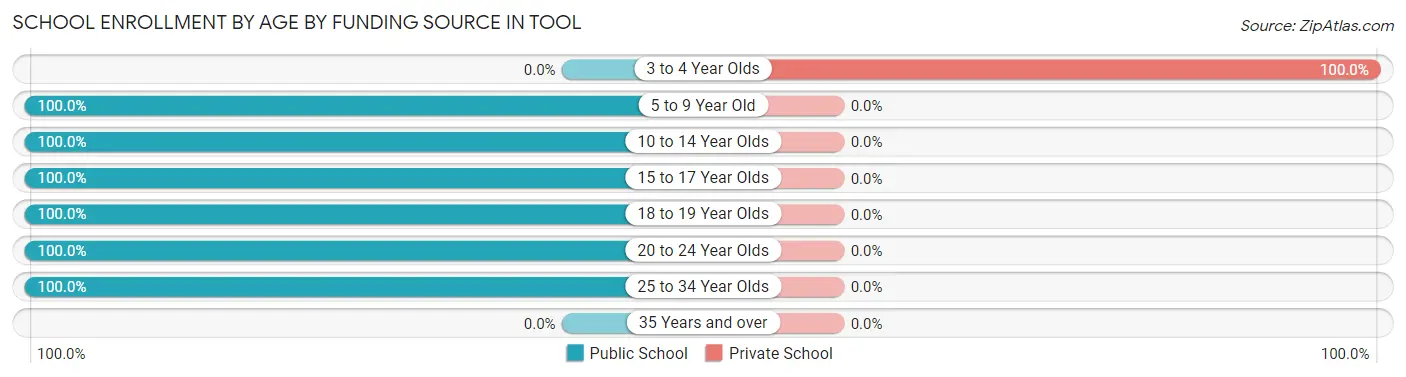
| Age Bracket | Public School | Private School |
| 3 to 4 Year Olds | 0 (0.0%) | 27 (100.0%) |
| 5 to 9 Year Old | 40 (100.0%) | 0 (0.0%) |
| 10 to 14 Year Olds | 179 (100.0%) | 0 (0.0%) |
| 15 to 17 Year Olds | 4 (100.0%) | 0 (0.0%) |
| 18 to 19 Year Olds | 19 (100.0%) | 0 (0.0%) |
| 20 to 24 Year Olds | 18 (100.0%) | 0 (0.0%) |
| 25 to 34 Year Olds | 8 (100.0%) | 0 (0.0%) |
| 35 Years and over | 0 (0.0%) | 0 (0.0%) |
| Total | 268 (90.8%) | 27 (9.2%) |
Educational Attainment by Field of Study in Tool
Education (127 | 24.6%), social sciences (120 | 23.2%), business (95 | 18.4%), arts & humanities (34 | 6.6%), and communications (28 | 5.4%) are the most common fields of study among 517 individuals in Tool who have obtained a bachelor's degree or higher.
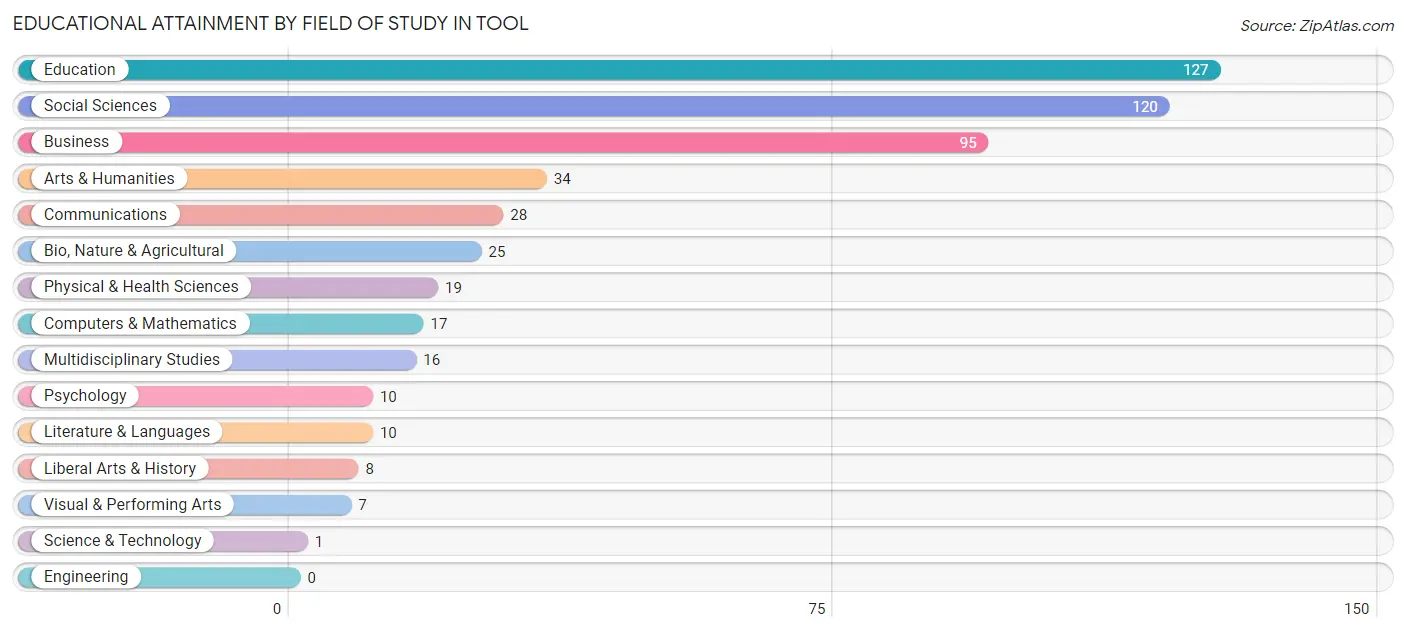
| Field of Study | # Graduates | % Graduates |
| Computers & Mathematics | 17 | 3.3% |
| Bio, Nature & Agricultural | 25 | 4.8% |
| Physical & Health Sciences | 19 | 3.7% |
| Psychology | 10 | 1.9% |
| Social Sciences | 120 | 23.2% |
| Engineering | 0 | 0.0% |
| Multidisciplinary Studies | 16 | 3.1% |
| Science & Technology | 1 | 0.2% |
| Business | 95 | 18.4% |
| Education | 127 | 24.6% |
| Literature & Languages | 10 | 1.9% |
| Liberal Arts & History | 8 | 1.5% |
| Visual & Performing Arts | 7 | 1.3% |
| Communications | 28 | 5.4% |
| Arts & Humanities | 34 | 6.6% |
| Total | 517 | 100.0% |
Transportation & Commute in Tool
Vehicle Availability by Sex in Tool
The most prevalent vehicle ownership categories in Tool are males with 2 vehicles (205, accounting for 33.4%) and females with 2 vehicles (174, making up 42.4%).
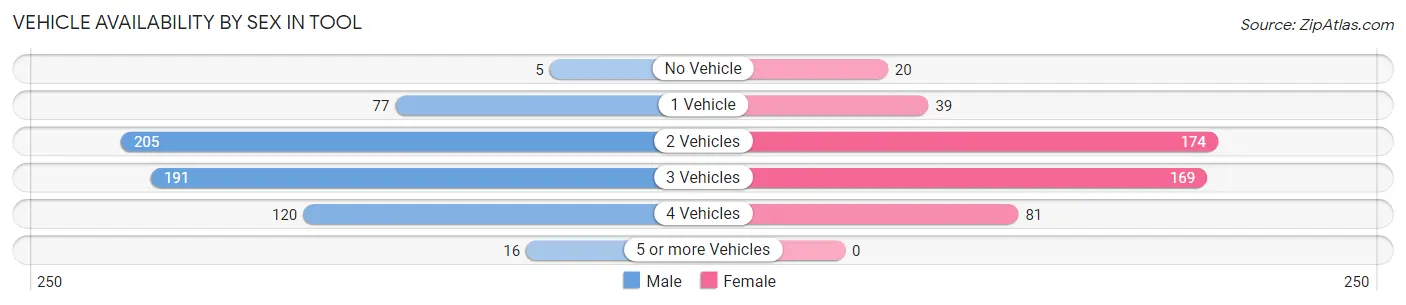
| Vehicles Available | Male | Female |
| No Vehicle | 5 (0.8%) | 20 (4.1%) |
| 1 Vehicle | 77 (12.5%) | 39 (8.1%) |
| 2 Vehicles | 205 (33.4%) | 174 (36.0%) |
| 3 Vehicles | 191 (31.1%) | 169 (35.0%) |
| 4 Vehicles | 120 (19.5%) | 81 (16.8%) |
| 5 or more Vehicles | 16 (2.6%) | 0 (0.0%) |
| Total | 614 (100.0%) | 483 (100.0%) |
Commute Time in Tool
The most frequently occuring commute durations in Tool are 60 to 89 minutes (200 commuters, 21.2%), 5 to 9 minutes (165 commuters, 17.5%), and 90 or more minutes (120 commuters, 12.7%).
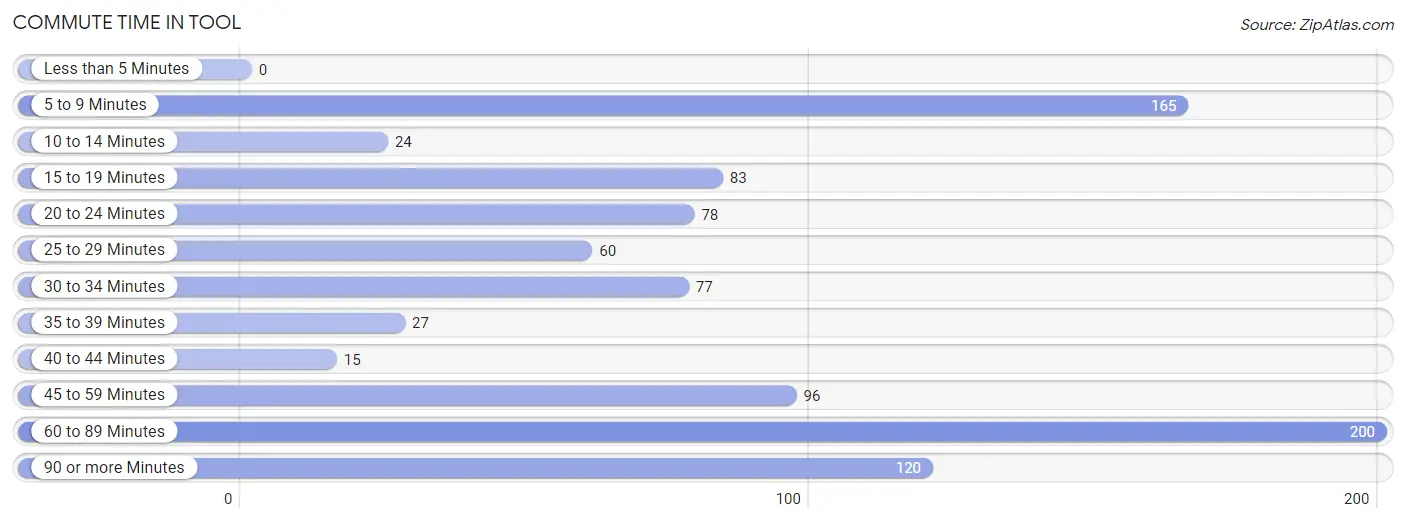
| Commute Time | # Commuters | % Commuters |
| Less than 5 Minutes | 0 | 0.0% |
| 5 to 9 Minutes | 165 | 17.5% |
| 10 to 14 Minutes | 24 | 2.5% |
| 15 to 19 Minutes | 83 | 8.8% |
| 20 to 24 Minutes | 78 | 8.3% |
| 25 to 29 Minutes | 60 | 6.4% |
| 30 to 34 Minutes | 77 | 8.2% |
| 35 to 39 Minutes | 27 | 2.9% |
| 40 to 44 Minutes | 15 | 1.6% |
| 45 to 59 Minutes | 96 | 10.2% |
| 60 to 89 Minutes | 200 | 21.2% |
| 90 or more Minutes | 120 | 12.7% |
Commute Time by Sex in Tool
The most common commute times in Tool are 60 to 89 minutes (124 commuters, 22.8%) for males and 60 to 89 minutes (76 commuters, 19.0%) for females.
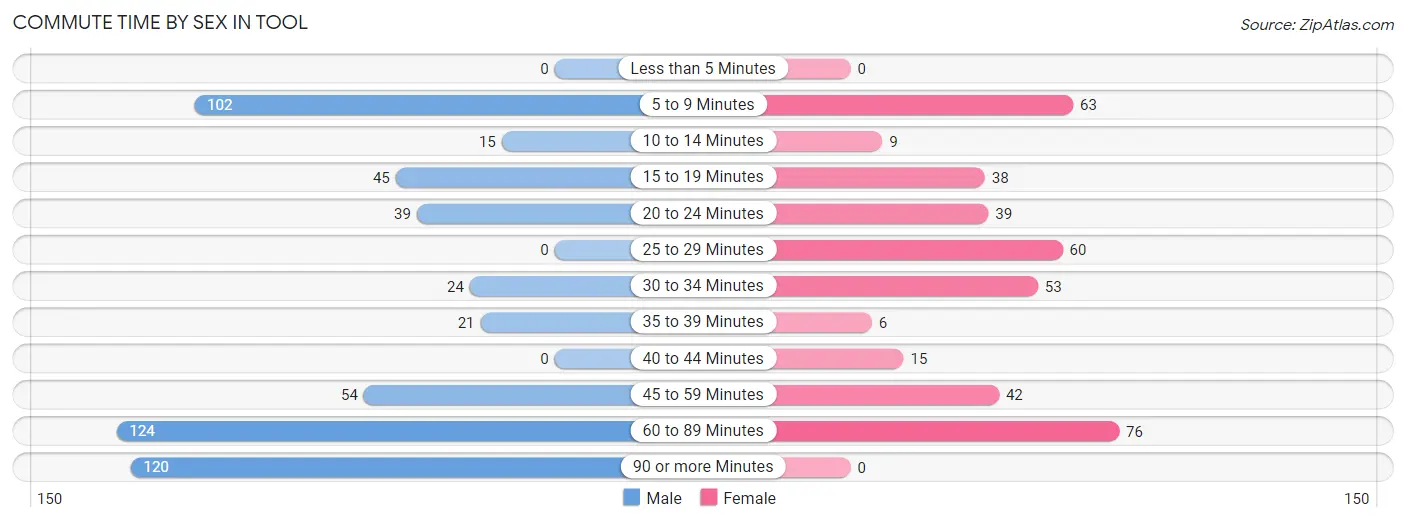
| Commute Time | Male | Female |
| Less than 5 Minutes | 0 (0.0%) | 0 (0.0%) |
| 5 to 9 Minutes | 102 (18.8%) | 63 (15.7%) |
| 10 to 14 Minutes | 15 (2.8%) | 9 (2.2%) |
| 15 to 19 Minutes | 45 (8.3%) | 38 (9.5%) |
| 20 to 24 Minutes | 39 (7.2%) | 39 (9.7%) |
| 25 to 29 Minutes | 0 (0.0%) | 60 (15.0%) |
| 30 to 34 Minutes | 24 (4.4%) | 53 (13.2%) |
| 35 to 39 Minutes | 21 (3.9%) | 6 (1.5%) |
| 40 to 44 Minutes | 0 (0.0%) | 15 (3.7%) |
| 45 to 59 Minutes | 54 (9.9%) | 42 (10.5%) |
| 60 to 89 Minutes | 124 (22.8%) | 76 (19.0%) |
| 90 or more Minutes | 120 (22.1%) | 0 (0.0%) |
Time of Departure to Work by Sex in Tool
The most frequent times of departure to work in Tool are 12:00 AM to 4:59 AM (127, 23.4%) for males and 6:00 AM to 6:29 AM (79, 19.7%) for females.
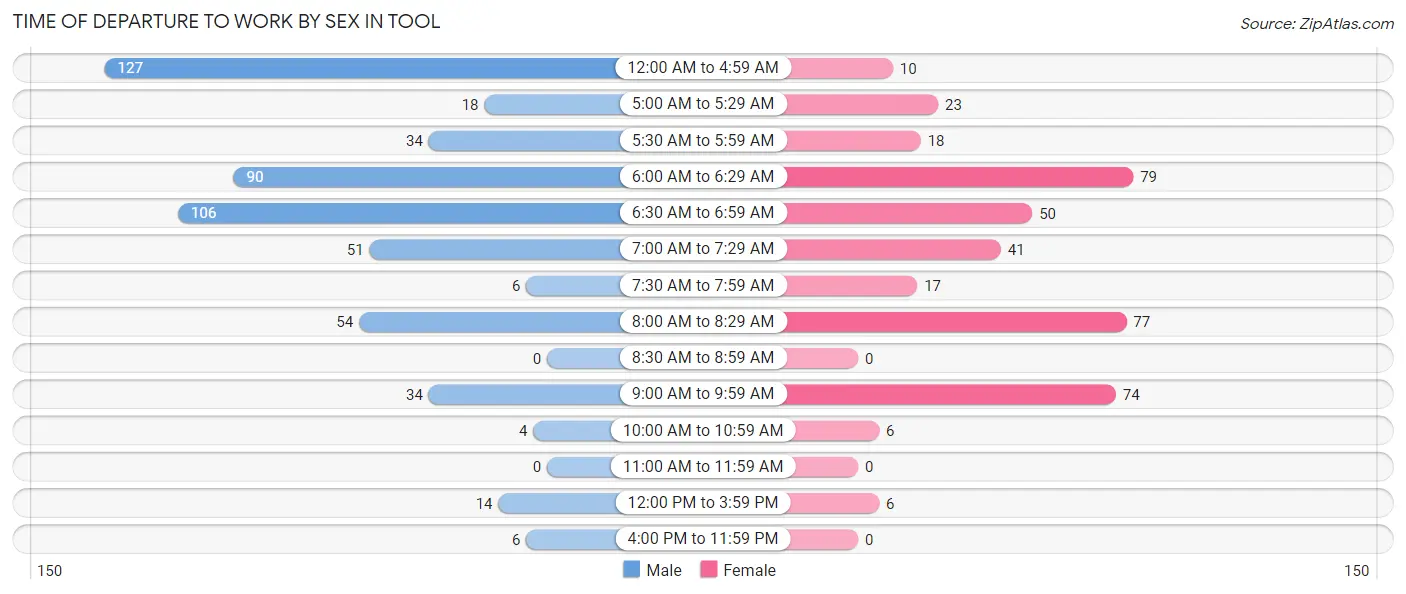
| Time of Departure | Male | Female |
| 12:00 AM to 4:59 AM | 127 (23.4%) | 10 (2.5%) |
| 5:00 AM to 5:29 AM | 18 (3.3%) | 23 (5.7%) |
| 5:30 AM to 5:59 AM | 34 (6.2%) | 18 (4.5%) |
| 6:00 AM to 6:29 AM | 90 (16.5%) | 79 (19.7%) |
| 6:30 AM to 6:59 AM | 106 (19.5%) | 50 (12.5%) |
| 7:00 AM to 7:29 AM | 51 (9.4%) | 41 (10.2%) |
| 7:30 AM to 7:59 AM | 6 (1.1%) | 17 (4.2%) |
| 8:00 AM to 8:29 AM | 54 (9.9%) | 77 (19.2%) |
| 8:30 AM to 8:59 AM | 0 (0.0%) | 0 (0.0%) |
| 9:00 AM to 9:59 AM | 34 (6.2%) | 74 (18.4%) |
| 10:00 AM to 10:59 AM | 4 (0.7%) | 6 (1.5%) |
| 11:00 AM to 11:59 AM | 0 (0.0%) | 0 (0.0%) |
| 12:00 PM to 3:59 PM | 14 (2.6%) | 6 (1.5%) |
| 4:00 PM to 11:59 PM | 6 (1.1%) | 0 (0.0%) |
| Total | 544 (100.0%) | 401 (100.0%) |
Housing Occupancy in Tool
Occupancy by Ownership in Tool
Of the total 1,028 dwellings in Tool, owner-occupied units account for 855 (83.2%), while renter-occupied units make up 173 (16.8%).
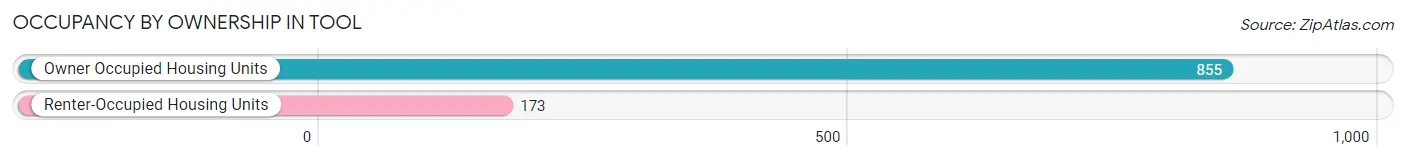
| Occupancy | # Housing Units | % Housing Units |
| Owner Occupied Housing Units | 855 | 83.2% |
| Renter-Occupied Housing Units | 173 | 16.8% |
| Total Occupied Housing Units | 1,028 | 100.0% |
Occupancy by Household Size in Tool
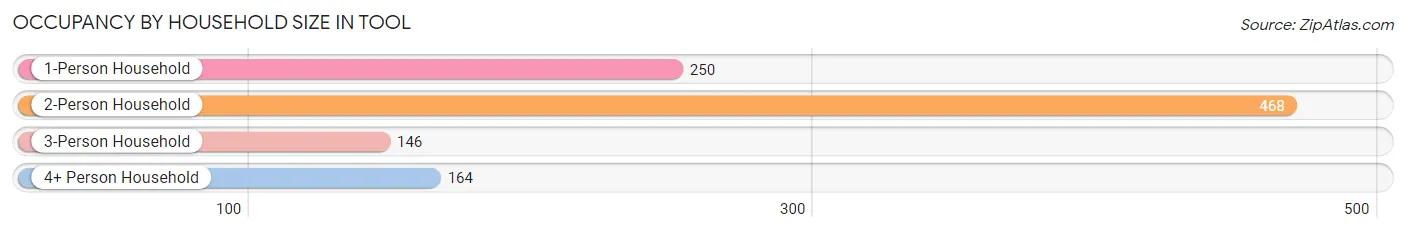
| Household Size | # Housing Units | % Housing Units |
| 1-Person Household | 250 | 24.3% |
| 2-Person Household | 468 | 45.5% |
| 3-Person Household | 146 | 14.2% |
| 4+ Person Household | 164 | 16.0% |
| Total Housing Units | 1,028 | 100.0% |
Occupancy by Ownership by Household Size in Tool
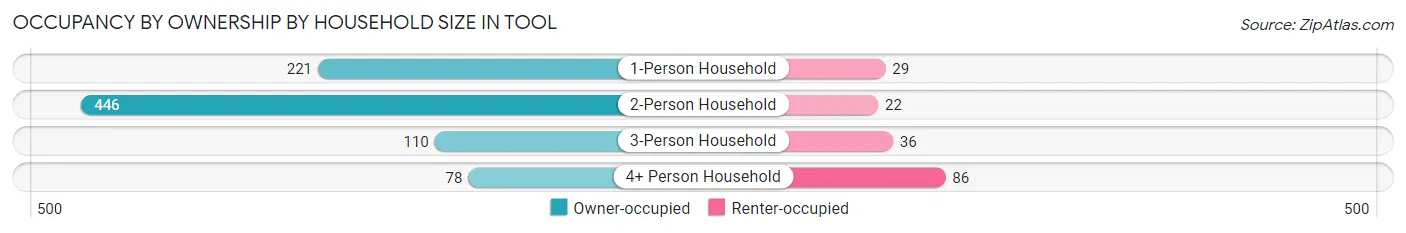
| Household Size | Owner-occupied | Renter-occupied |
| 1-Person Household | 221 (88.4%) | 29 (11.6%) |
| 2-Person Household | 446 (95.3%) | 22 (4.7%) |
| 3-Person Household | 110 (75.3%) | 36 (24.7%) |
| 4+ Person Household | 78 (47.6%) | 86 (52.4%) |
| Total Housing Units | 855 (83.2%) | 173 (16.8%) |
Occupancy by Educational Attainment in Tool
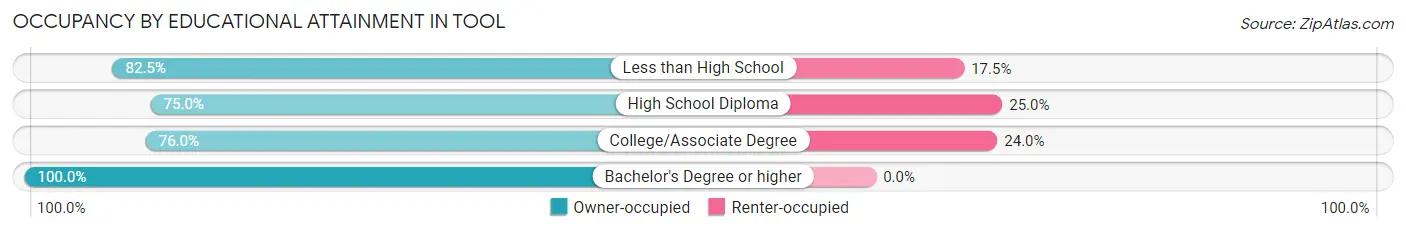
| Household Size | Owner-occupied | Renter-occupied |
| Less than High School | 52 (82.5%) | 11 (17.5%) |
| High School Diploma | 225 (75.0%) | 75 (25.0%) |
| College/Associate Degree | 275 (76.0%) | 87 (24.0%) |
| Bachelor's Degree or higher | 303 (100.0%) | 0 (0.0%) |
Occupancy by Age of Householder in Tool
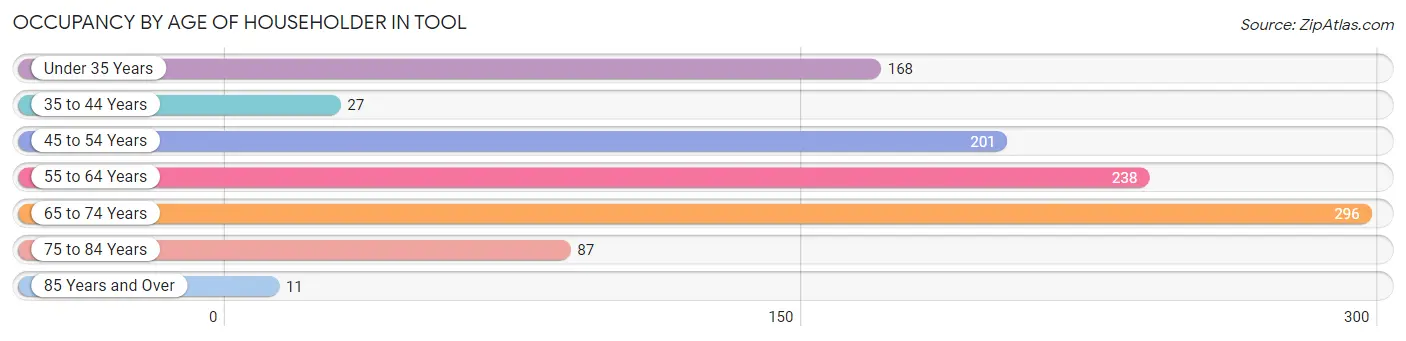
| Age Bracket | # Households | % Households |
| Under 35 Years | 168 | 16.3% |
| 35 to 44 Years | 27 | 2.6% |
| 45 to 54 Years | 201 | 19.6% |
| 55 to 64 Years | 238 | 23.2% |
| 65 to 74 Years | 296 | 28.8% |
| 75 to 84 Years | 87 | 8.5% |
| 85 Years and Over | 11 | 1.1% |
| Total | 1,028 | 100.0% |
Housing Finances in Tool
Median Income by Occupancy in Tool
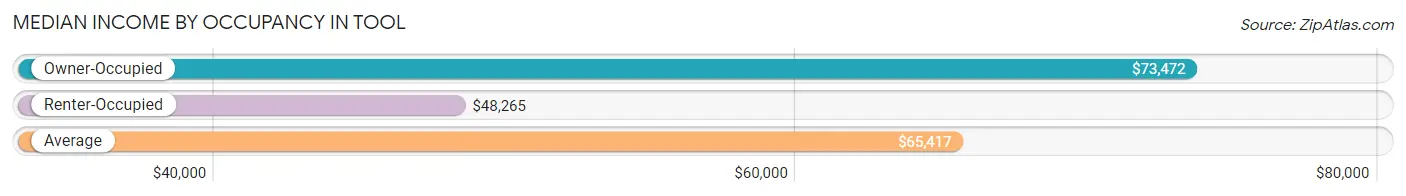
| Occupancy Type | # Households | Median Income |
| Owner-Occupied | 855 (83.2%) | $73,472 |
| Renter-Occupied | 173 (16.8%) | $48,265 |
| Average | 1,028 (100.0%) | $65,417 |
Occupancy by Householder Income Bracket in Tool
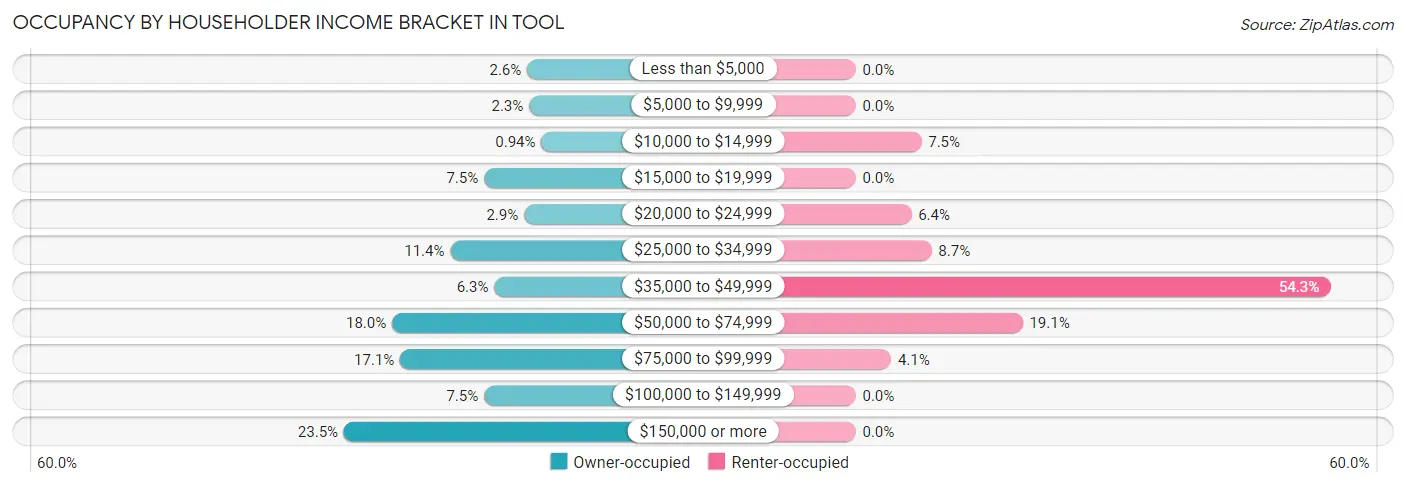
| Income Bracket | Owner-occupied | Renter-occupied |
| Less than $5,000 | 22 (2.6%) | 0 (0.0%) |
| $5,000 to $9,999 | 20 (2.3%) | 0 (0.0%) |
| $10,000 to $14,999 | 8 (0.9%) | 13 (7.5%) |
| $15,000 to $19,999 | 64 (7.5%) | 0 (0.0%) |
| $20,000 to $24,999 | 25 (2.9%) | 11 (6.4%) |
| $25,000 to $34,999 | 97 (11.4%) | 15 (8.7%) |
| $35,000 to $49,999 | 54 (6.3%) | 94 (54.3%) |
| $50,000 to $74,999 | 154 (18.0%) | 33 (19.1%) |
| $75,000 to $99,999 | 146 (17.1%) | 7 (4.1%) |
| $100,000 to $149,999 | 64 (7.5%) | 0 (0.0%) |
| $150,000 or more | 201 (23.5%) | 0 (0.0%) |
| Total | 855 (100.0%) | 173 (100.0%) |
Monthly Housing Cost Tiers in Tool
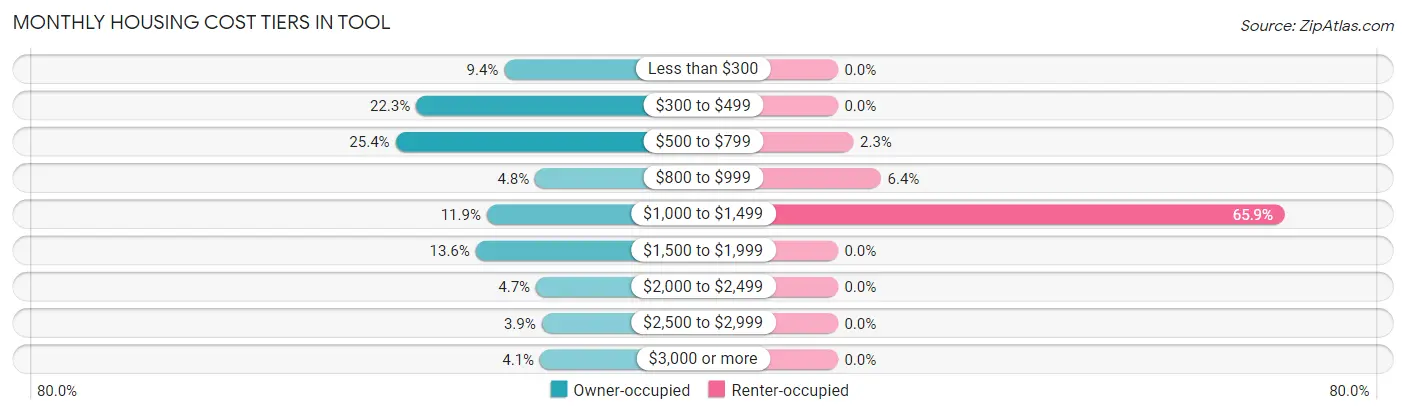
| Monthly Cost | Owner-occupied | Renter-occupied |
| Less than $300 | 80 (9.4%) | 0 (0.0%) |
| $300 to $499 | 191 (22.3%) | 0 (0.0%) |
| $500 to $799 | 217 (25.4%) | 4 (2.3%) |
| $800 to $999 | 41 (4.8%) | 11 (6.4%) |
| $1,000 to $1,499 | 102 (11.9%) | 114 (65.9%) |
| $1,500 to $1,999 | 116 (13.6%) | 0 (0.0%) |
| $2,000 to $2,499 | 40 (4.7%) | 0 (0.0%) |
| $2,500 to $2,999 | 33 (3.9%) | 0 (0.0%) |
| $3,000 or more | 35 (4.1%) | 0 (0.0%) |
| Total | 855 (100.0%) | 173 (100.0%) |
Physical Housing Characteristics in Tool
Housing Structures in Tool
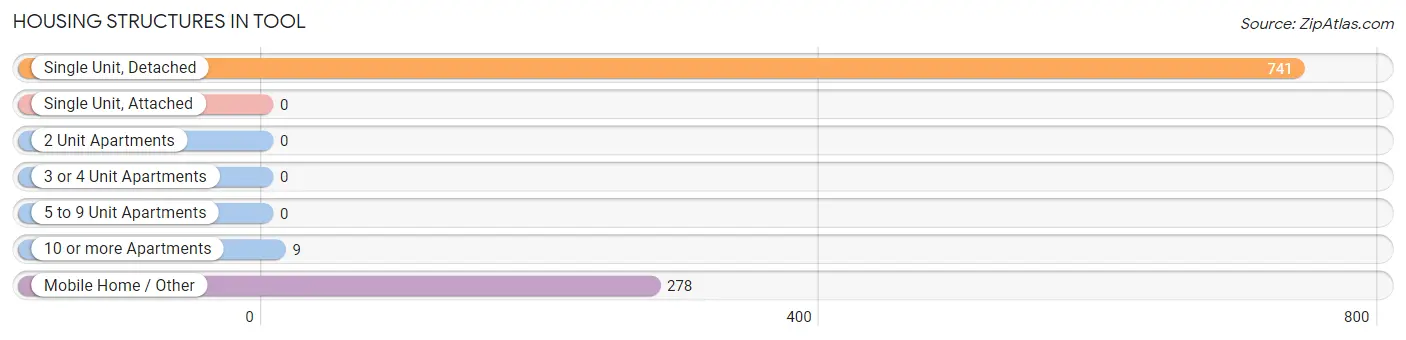
| Structure Type | # Housing Units | % Housing Units |
| Single Unit, Detached | 741 | 72.1% |
| Single Unit, Attached | 0 | 0.0% |
| 2 Unit Apartments | 0 | 0.0% |
| 3 or 4 Unit Apartments | 0 | 0.0% |
| 5 to 9 Unit Apartments | 0 | 0.0% |
| 10 or more Apartments | 9 | 0.9% |
| Mobile Home / Other | 278 | 27.0% |
| Total | 1,028 | 100.0% |
Housing Structures by Occupancy in Tool
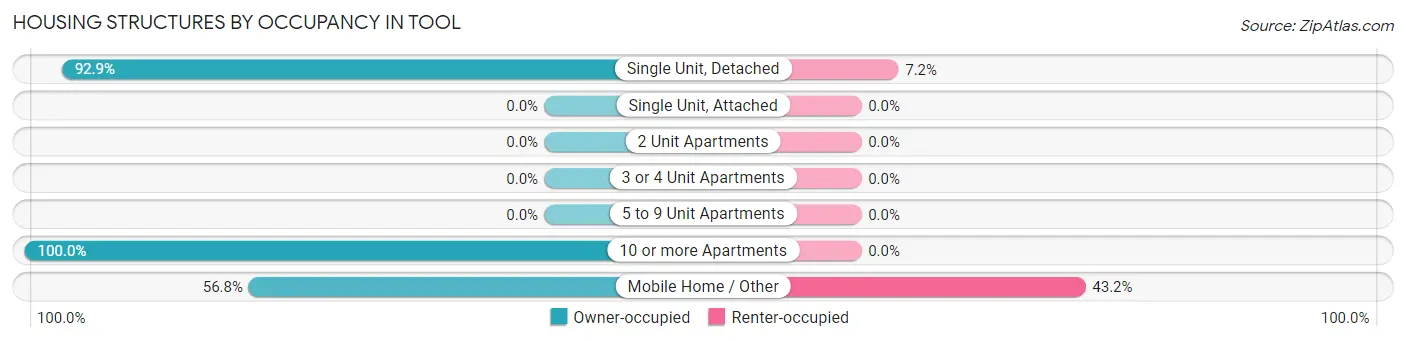
| Structure Type | Owner-occupied | Renter-occupied |
| Single Unit, Detached | 688 (92.8%) | 53 (7.1%) |
| Single Unit, Attached | 0 (0.0%) | 0 (0.0%) |
| 2 Unit Apartments | 0 (0.0%) | 0 (0.0%) |
| 3 or 4 Unit Apartments | 0 (0.0%) | 0 (0.0%) |
| 5 to 9 Unit Apartments | 0 (0.0%) | 0 (0.0%) |
| 10 or more Apartments | 9 (100.0%) | 0 (0.0%) |
| Mobile Home / Other | 158 (56.8%) | 120 (43.2%) |
| Total | 855 (83.2%) | 173 (16.8%) |
Housing Structures by Number of Rooms in Tool
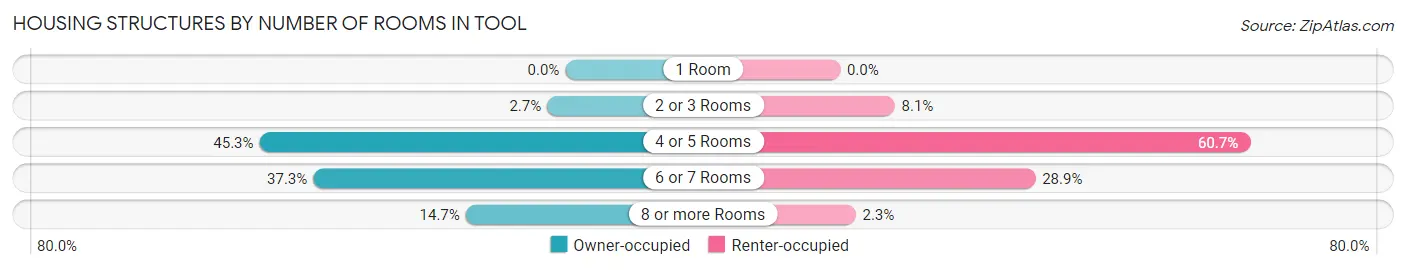
| Number of Rooms | Owner-occupied | Renter-occupied |
| 1 Room | 0 (0.0%) | 0 (0.0%) |
| 2 or 3 Rooms | 23 (2.7%) | 14 (8.1%) |
| 4 or 5 Rooms | 387 (45.3%) | 105 (60.7%) |
| 6 or 7 Rooms | 319 (37.3%) | 50 (28.9%) |
| 8 or more Rooms | 126 (14.7%) | 4 (2.3%) |
| Total | 855 (100.0%) | 173 (100.0%) |
Housing Structure by Heating Type in Tool
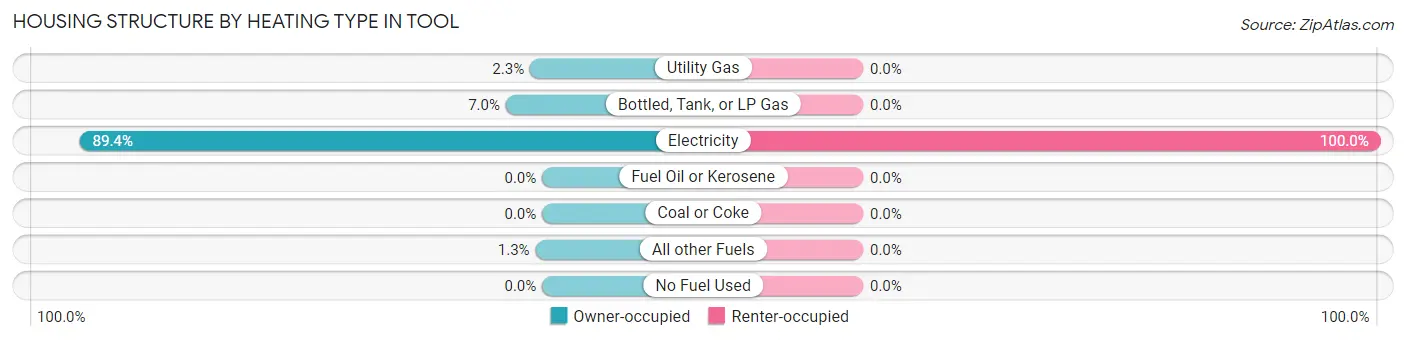
| Heating Type | Owner-occupied | Renter-occupied |
| Utility Gas | 20 (2.3%) | 0 (0.0%) |
| Bottled, Tank, or LP Gas | 60 (7.0%) | 0 (0.0%) |
| Electricity | 764 (89.4%) | 173 (100.0%) |
| Fuel Oil or Kerosene | 0 (0.0%) | 0 (0.0%) |
| Coal or Coke | 0 (0.0%) | 0 (0.0%) |
| All other Fuels | 11 (1.3%) | 0 (0.0%) |
| No Fuel Used | 0 (0.0%) | 0 (0.0%) |
| Total | 855 (100.0%) | 173 (100.0%) |
Household Vehicle Usage in Tool
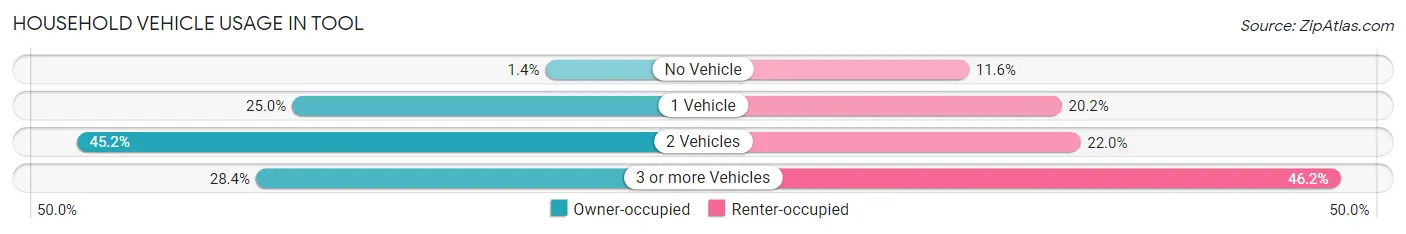
| Vehicles per Household | Owner-occupied | Renter-occupied |
| No Vehicle | 12 (1.4%) | 20 (11.6%) |
| 1 Vehicle | 214 (25.0%) | 35 (20.2%) |
| 2 Vehicles | 386 (45.2%) | 38 (22.0%) |
| 3 or more Vehicles | 243 (28.4%) | 80 (46.2%) |
| Total | 855 (100.0%) | 173 (100.0%) |
Real Estate & Mortgages in Tool
Real Estate and Mortgage Overview in Tool
| Characteristic | Without Mortgage | With Mortgage |
| Housing Units | 493 | 362 |
| Median Property Value | $111,400 | $248,400 |
| Median Household Income | $67,250 | $110 |
| Monthly Housing Costs | $459 | $35 |
| Real Estate Taxes | $1,706 | $0 |
Property Value by Mortgage Status in Tool
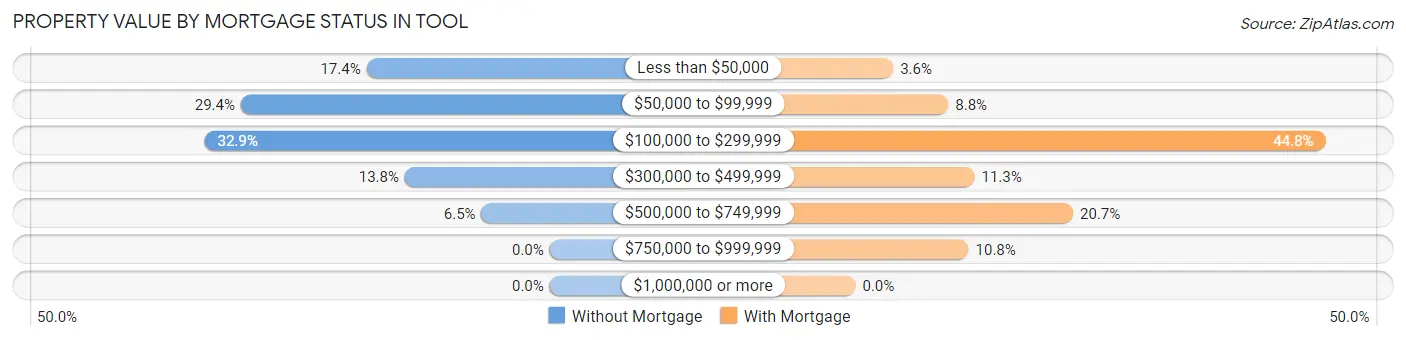
| Property Value | Without Mortgage | With Mortgage |
| Less than $50,000 | 86 (17.4%) | 13 (3.6%) |
| $50,000 to $99,999 | 145 (29.4%) | 32 (8.8%) |
| $100,000 to $299,999 | 162 (32.9%) | 162 (44.8%) |
| $300,000 to $499,999 | 68 (13.8%) | 41 (11.3%) |
| $500,000 to $749,999 | 32 (6.5%) | 75 (20.7%) |
| $750,000 to $999,999 | 0 (0.0%) | 39 (10.8%) |
| $1,000,000 or more | 0 (0.0%) | 0 (0.0%) |
| Total | 493 (100.0%) | 362 (100.0%) |
Household Income by Mortgage Status in Tool
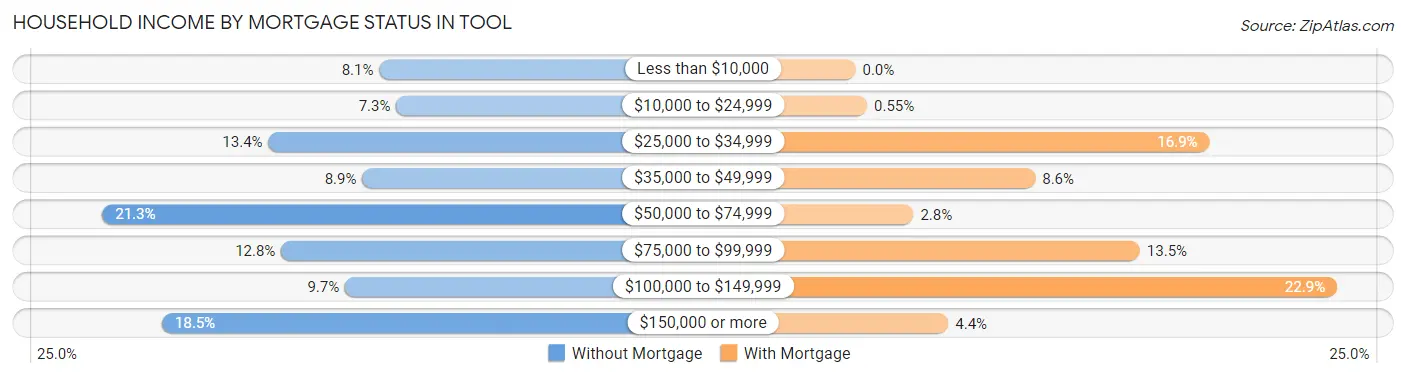
| Household Income | Without Mortgage | With Mortgage |
| Less than $10,000 | 40 (8.1%) | 0 (0.0%) |
| $10,000 to $24,999 | 36 (7.3%) | 2 (0.5%) |
| $25,000 to $34,999 | 66 (13.4%) | 61 (16.9%) |
| $35,000 to $49,999 | 44 (8.9%) | 31 (8.6%) |
| $50,000 to $74,999 | 105 (21.3%) | 10 (2.8%) |
| $75,000 to $99,999 | 63 (12.8%) | 49 (13.5%) |
| $100,000 to $149,999 | 48 (9.7%) | 83 (22.9%) |
| $150,000 or more | 91 (18.5%) | 16 (4.4%) |
| Total | 493 (100.0%) | 362 (100.0%) |
Property Value to Household Income Ratio in Tool
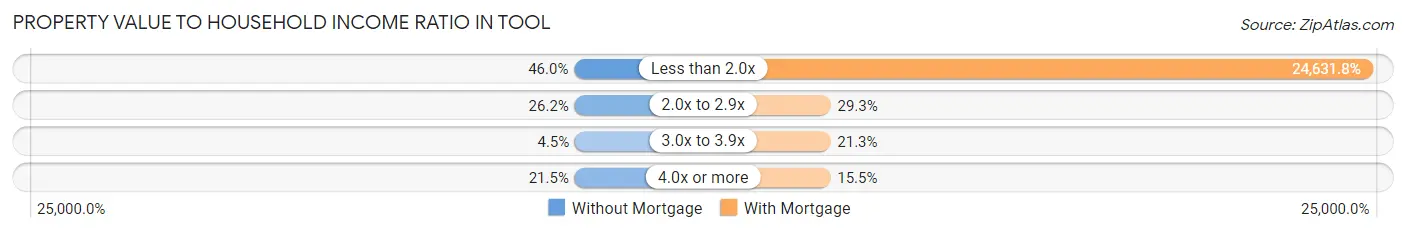
| Value-to-Income Ratio | Without Mortgage | With Mortgage |
| Less than 2.0x | 227 (46.0%) | 89,167 (24,631.8%) |
| 2.0x to 2.9x | 129 (26.2%) | 106 (29.3%) |
| 3.0x to 3.9x | 22 (4.5%) | 77 (21.3%) |
| 4.0x or more | 106 (21.5%) | 56 (15.5%) |
| Total | 493 (100.0%) | 362 (100.0%) |
Real Estate Taxes by Mortgage Status in Tool
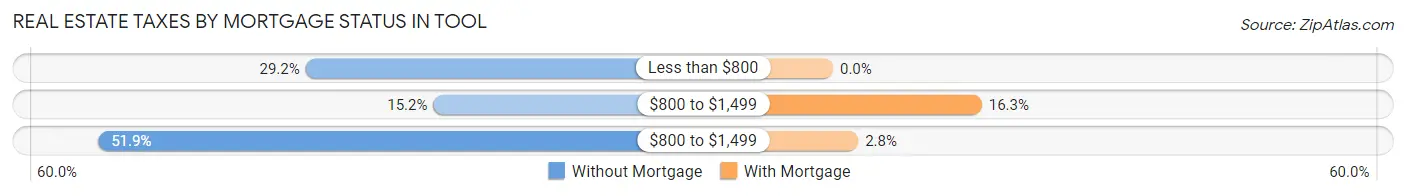
| Property Taxes | Without Mortgage | With Mortgage |
| Less than $800 | 144 (29.2%) | 0 (0.0%) |
| $800 to $1,499 | 75 (15.2%) | 59 (16.3%) |
| $800 to $1,499 | 256 (51.9%) | 10 (2.8%) |
| Total | 493 (100.0%) | 362 (100.0%) |
Health & Disability in Tool
Health Insurance Coverage by Age in Tool
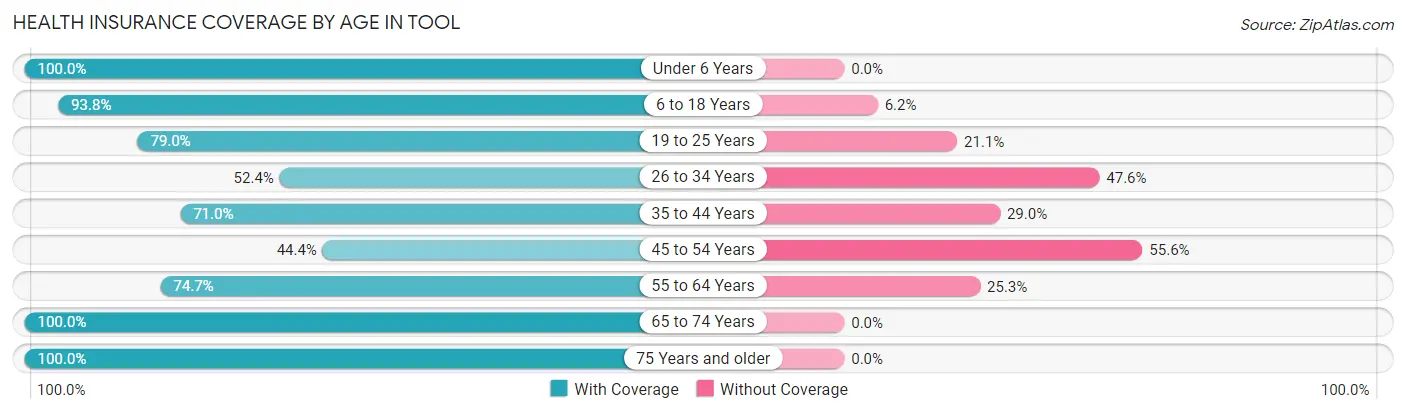
| Age Bracket | With Coverage | Without Coverage |
| Under 6 Years | 90 (100.0%) | 0 (0.0%) |
| 6 to 18 Years | 286 (93.8%) | 19 (6.2%) |
| 19 to 25 Years | 105 (78.9%) | 28 (21.0%) |
| 26 to 34 Years | 172 (52.4%) | 156 (47.6%) |
| 35 to 44 Years | 88 (71.0%) | 36 (29.0%) |
| 45 to 54 Years | 147 (44.4%) | 184 (55.6%) |
| 55 to 64 Years | 336 (74.7%) | 114 (25.3%) |
| 65 to 74 Years | 434 (100.0%) | 0 (0.0%) |
| 75 Years and older | 161 (100.0%) | 0 (0.0%) |
| Total | 1,819 (77.2%) | 537 (22.8%) |
Health Insurance Coverage by Citizenship Status in Tool
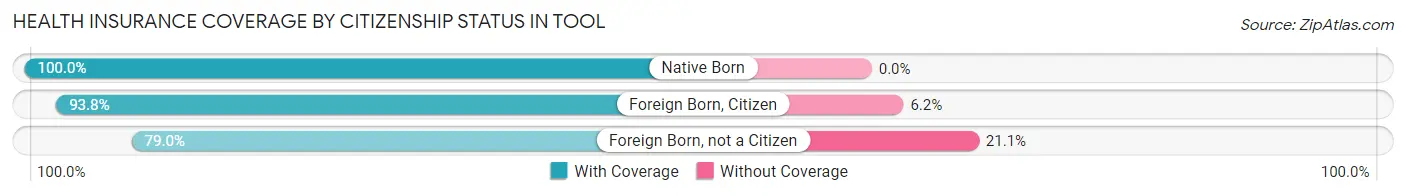
| Citizenship Status | With Coverage | Without Coverage |
| Native Born | 90 (100.0%) | 0 (0.0%) |
| Foreign Born, Citizen | 286 (93.8%) | 19 (6.2%) |
| Foreign Born, not a Citizen | 105 (78.9%) | 28 (21.0%) |
Health Insurance Coverage by Household Income in Tool
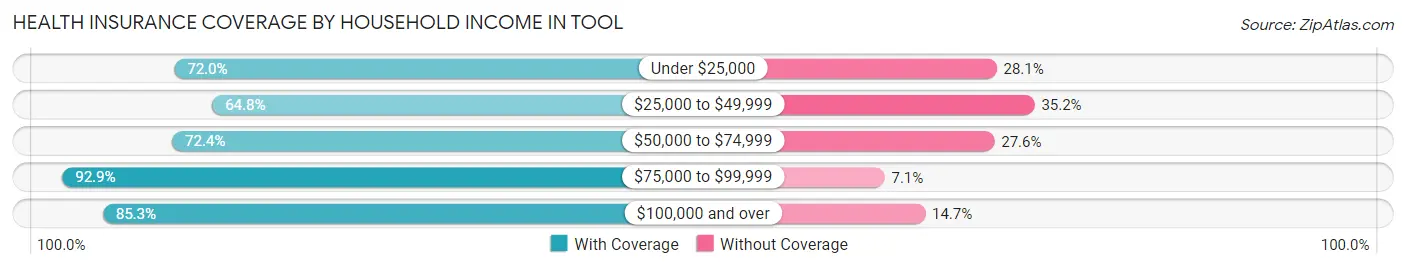
| Household Income | With Coverage | Without Coverage |
| Under $25,000 | 177 (72.0%) | 69 (28.1%) |
| $25,000 to $49,999 | 426 (64.8%) | 231 (35.2%) |
| $50,000 to $74,999 | 301 (72.4%) | 115 (27.6%) |
| $75,000 to $99,999 | 368 (92.9%) | 28 (7.1%) |
| $100,000 and over | 547 (85.3%) | 94 (14.7%) |
Public vs Private Health Insurance Coverage by Age in Tool
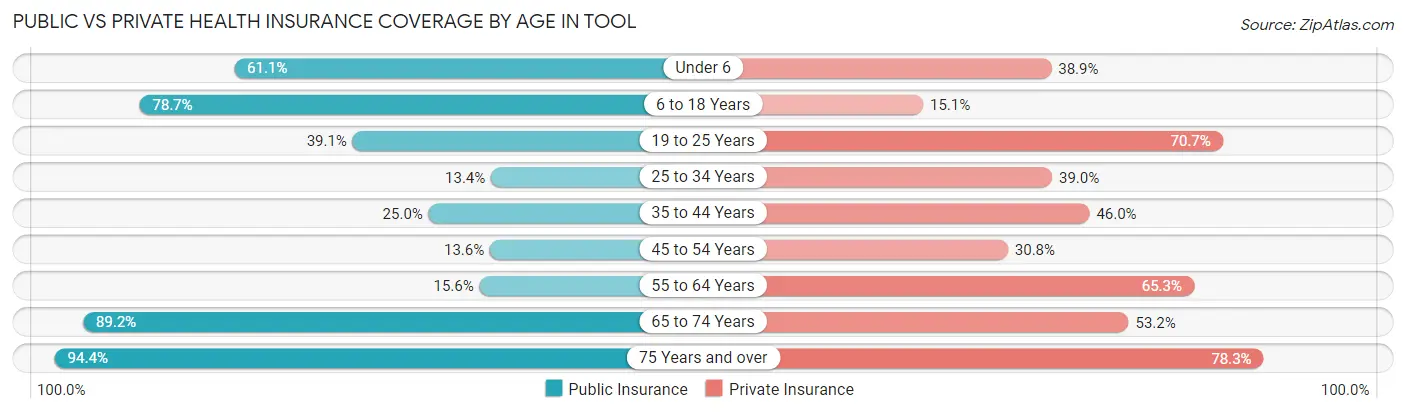
| Age Bracket | Public Insurance | Private Insurance |
| Under 6 | 55 (61.1%) | 35 (38.9%) |
| 6 to 18 Years | 240 (78.7%) | 46 (15.1%) |
| 19 to 25 Years | 52 (39.1%) | 94 (70.7%) |
| 25 to 34 Years | 44 (13.4%) | 128 (39.0%) |
| 35 to 44 Years | 31 (25.0%) | 57 (46.0%) |
| 45 to 54 Years | 45 (13.6%) | 102 (30.8%) |
| 55 to 64 Years | 70 (15.6%) | 294 (65.3%) |
| 65 to 74 Years | 387 (89.2%) | 231 (53.2%) |
| 75 Years and over | 152 (94.4%) | 126 (78.3%) |
| Total | 1,076 (45.7%) | 1,113 (47.2%) |
Disability Status by Sex by Age in Tool
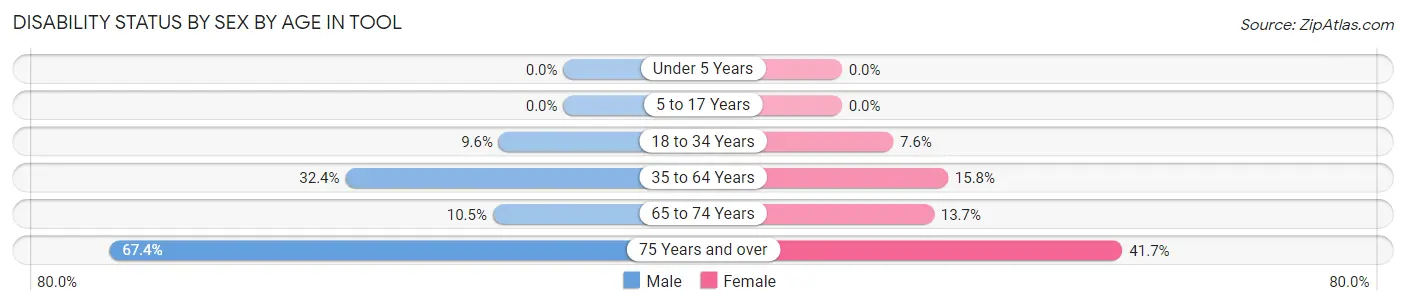
| Age Bracket | Male | Female |
| Under 5 Years | 0 (0.0%) | 0 (0.0%) |
| 5 to 17 Years | 0 (0.0%) | 0 (0.0%) |
| 18 to 34 Years | 26 (9.6%) | 17 (7.6%) |
| 35 to 64 Years | 145 (32.4%) | 72 (15.8%) |
| 65 to 74 Years | 24 (10.5%) | 28 (13.7%) |
| 75 Years and over | 60 (67.4%) | 30 (41.7%) |
Disability Class by Sex by Age in Tool
Disability Class: Hearing Difficulty
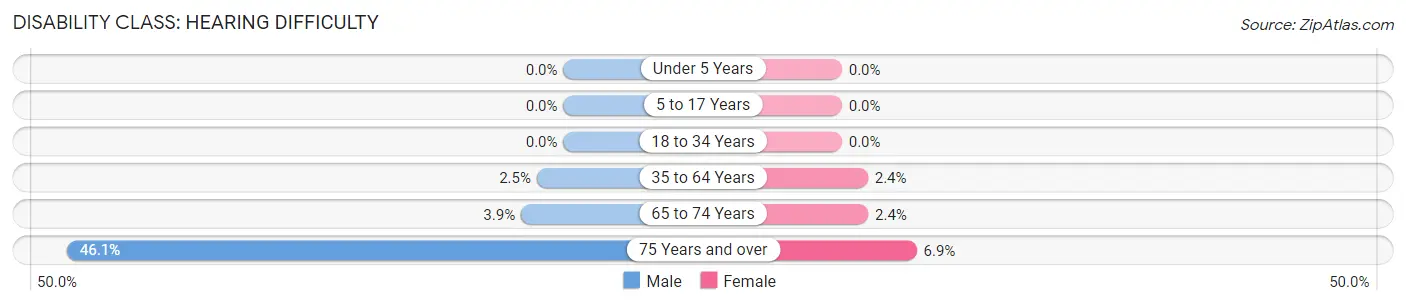
| Age Bracket | Male | Female |
| Under 5 Years | 0 (0.0%) | 0 (0.0%) |
| 5 to 17 Years | 0 (0.0%) | 0 (0.0%) |
| 18 to 34 Years | 0 (0.0%) | 0 (0.0%) |
| 35 to 64 Years | 11 (2.5%) | 11 (2.4%) |
| 65 to 74 Years | 9 (3.9%) | 5 (2.4%) |
| 75 Years and over | 41 (46.1%) | 5 (6.9%) |
Disability Class: Vision Difficulty
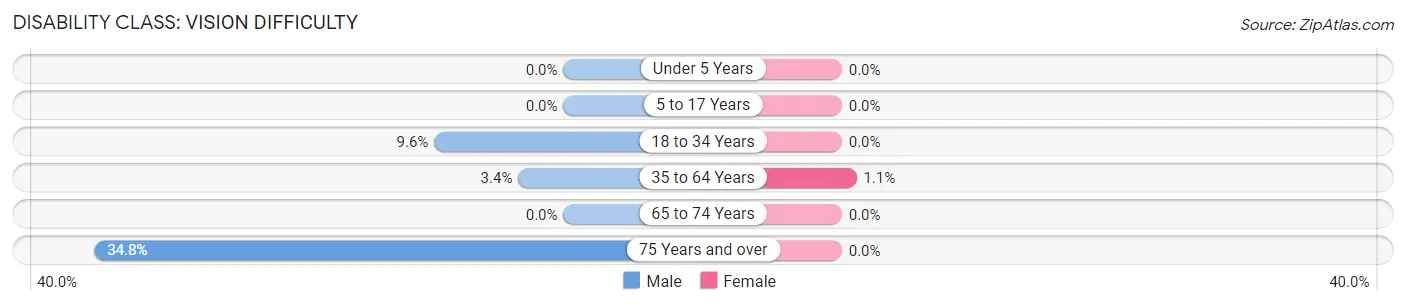
| Age Bracket | Male | Female |
| Under 5 Years | 0 (0.0%) | 0 (0.0%) |
| 5 to 17 Years | 0 (0.0%) | 0 (0.0%) |
| 18 to 34 Years | 26 (9.6%) | 0 (0.0%) |
| 35 to 64 Years | 15 (3.4%) | 5 (1.1%) |
| 65 to 74 Years | 0 (0.0%) | 0 (0.0%) |
| 75 Years and over | 31 (34.8%) | 0 (0.0%) |
Disability Class: Cognitive Difficulty
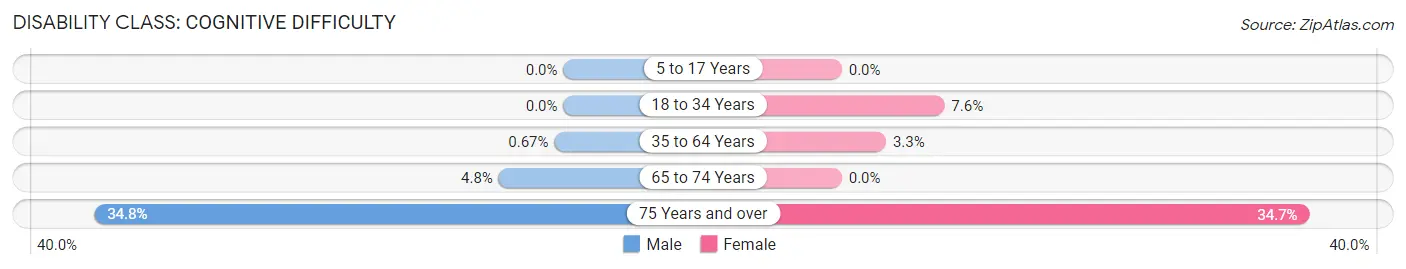
| Age Bracket | Male | Female |
| 5 to 17 Years | 0 (0.0%) | 0 (0.0%) |
| 18 to 34 Years | 0 (0.0%) | 17 (7.6%) |
| 35 to 64 Years | 3 (0.7%) | 15 (3.3%) |
| 65 to 74 Years | 11 (4.8%) | 0 (0.0%) |
| 75 Years and over | 31 (34.8%) | 25 (34.7%) |
Disability Class: Ambulatory Difficulty
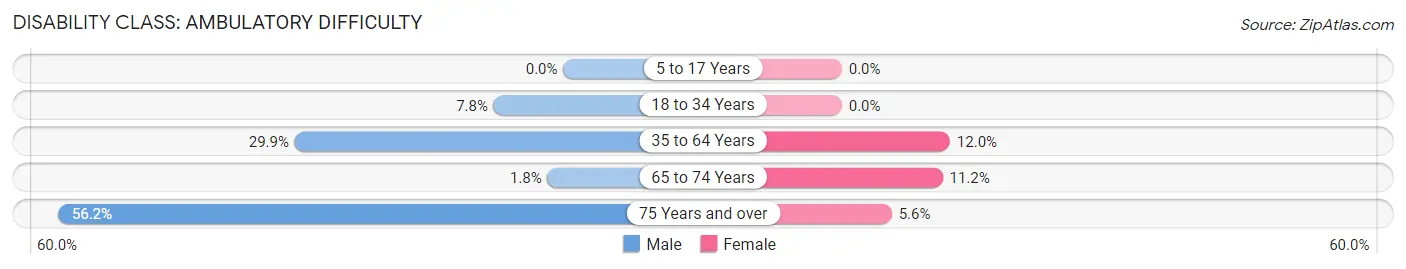
| Age Bracket | Male | Female |
| 5 to 17 Years | 0 (0.0%) | 0 (0.0%) |
| 18 to 34 Years | 21 (7.7%) | 0 (0.0%) |
| 35 to 64 Years | 134 (29.9%) | 55 (12.0%) |
| 65 to 74 Years | 4 (1.8%) | 23 (11.2%) |
| 75 Years and over | 50 (56.2%) | 4 (5.6%) |
Disability Class: Self-Care Difficulty
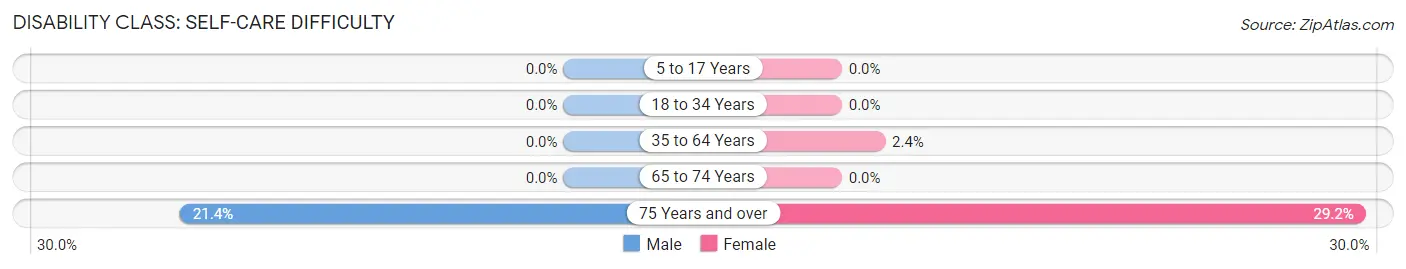
| Age Bracket | Male | Female |
| 5 to 17 Years | 0 (0.0%) | 0 (0.0%) |
| 18 to 34 Years | 0 (0.0%) | 0 (0.0%) |
| 35 to 64 Years | 0 (0.0%) | 11 (2.4%) |
| 65 to 74 Years | 0 (0.0%) | 0 (0.0%) |
| 75 Years and over | 19 (21.3%) | 21 (29.2%) |
Technology Access in Tool
Computing Device Access in Tool
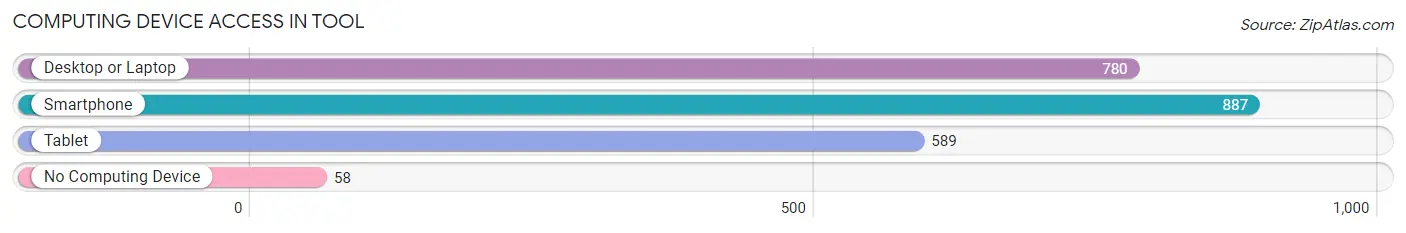
| Device Type | # Households | % Households |
| Desktop or Laptop | 780 | 75.9% |
| Smartphone | 887 | 86.3% |
| Tablet | 589 | 57.3% |
| No Computing Device | 58 | 5.6% |
| Total | 1,028 | 100.0% |
Internet Access in Tool
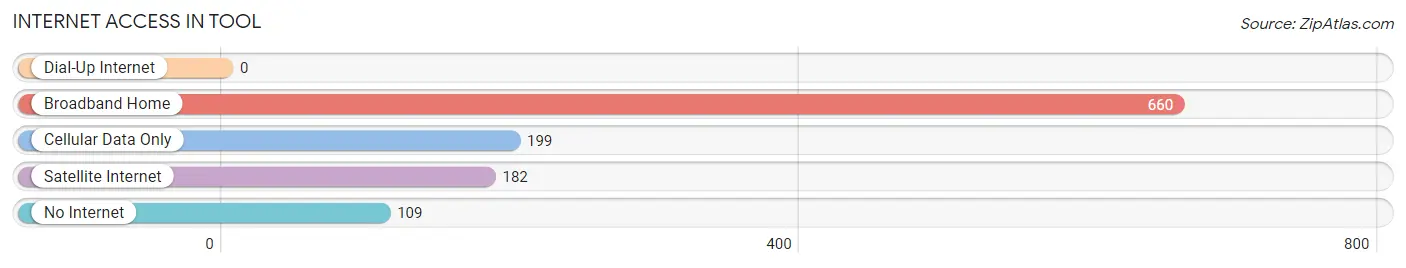
| Internet Type | # Households | % Households |
| Dial-Up Internet | 0 | 0.0% |
| Broadband Home | 660 | 64.2% |
| Cellular Data Only | 199 | 19.4% |
| Satellite Internet | 182 | 17.7% |
| No Internet | 109 | 10.6% |
| Total | 1,028 | 100.0% |
Tool Summary
Texas is a state located in the south-central region of the United States. It is the second largest state in the country, both in terms of population and land area. Texas has a rich history, diverse geography, and a vibrant economy. It is also home to a diverse population, with a variety of ethnic and racial backgrounds.
History
The history of Texas dates back to the 16th century, when Spanish explorers first arrived in the region. The area was claimed by Spain in 1519, and was part of the Spanish Empire until 1821, when Mexico gained independence from Spain. Texas was part of Mexico until 1836, when it declared its independence and became the Republic of Texas. The Republic of Texas was annexed by the United States in 1845, and became the 28th state in the Union.
Texas has a long and storied history, and has played a major role in the development of the United States. It was the site of several major battles during the Civil War, and was the birthplace of several influential figures in American history, including President Lyndon B. Johnson and General Sam Houston.
Geography
Texas is located in the south-central region of the United States, and is bordered by Oklahoma to the north, Arkansas to the northeast, Louisiana to the east, and Mexico to the south. It is the second largest state in the country, with an area of 268,820 square miles.
Texas is divided into four distinct geographic regions: the Gulf Coastal Plains, the Great Plains, the Edwards Plateau, and the Basin and Range Province. The Gulf Coastal Plains are located along the Gulf of Mexico, and are characterized by flat terrain and sandy beaches. The Great Plains are located in the northern part of the state, and are characterized by rolling hills and grasslands. The Edwards Plateau is located in the central part of the state, and is characterized by rugged hills and canyons. The Basin and Range Province is located in the western part of the state, and is characterized by mountains and desert landscapes.
Economy
The economy of Texas is one of the largest and most diverse in the United States. It is the second largest state economy in the country, with a gross domestic product (GDP) of $1.7 trillion in 2019. The state is a major producer of oil and natural gas, and is home to several major oil and gas companies. It is also a major producer of agricultural products, including cotton, cattle, and wheat.
Texas is also home to several major industries, including technology, aerospace, and healthcare. The state is home to several major companies, including Dell, AT&T, and ExxonMobil. It is also home to several major universities, including the University of Texas at Austin and Texas A&M University.
Demographics
As of 2019, the population of Texas was estimated to be 29.1 million. The state is home to a diverse population, with a variety of ethnic and racial backgrounds. The largest ethnic group in the state is Hispanic or Latino, which makes up 39.5% of the population. The second largest ethnic group is White, which makes up 36.2% of the population. Other ethnic groups include African American (12.8%), Asian (5.2%), and Native American (1.2%).
Texas is also home to a variety of religious groups. The largest religious group in the state is Christian, which makes up 75.2% of the population. Other religious groups include Jewish (2.2%), Muslim (1.3%), and Buddhist (0.5%).
Conclusion
Texas is a state located in the south-central region of the United States. It has a rich history, diverse geography, and a vibrant economy. It is also home to a diverse population, with a variety of ethnic and racial backgrounds. The state is a major producer of oil and natural gas, and is home to several major industries, including technology, aerospace, and healthcare. Texas is an important part of the United States, and its history, geography, economy, and demographics make it a unique and fascinating place.
Common Questions
What is the Total Population of Tool?
Total Population of Tool is 2,356.
What is the Total Male Population of Tool?
Total Male Population of Tool is 1,238.
What is the Total Female Population of Tool?
Total Female Population of Tool is 1,118.
What is the Ratio of Males per 100 Females in Tool?
There are 110.73 Males per 100 Females in Tool.
What is the Ratio of Females per 100 Males in Tool?
There are 90.31 Females per 100 Males in Tool.
What is the Median Population Age in Tool?
Median Population Age in Tool is 53.0 Years.
What is the Average Family Size in Tool
Average Family Size in Tool is 2.6 People.
What is the Average Household Size in Tool
Average Household Size in Tool is 2.3 People.
What is Per Capita Income in Tool?
Per Capita income in Tool is $40,553.
What is the Median Family Income in Tool?
Median Family Income in Tool is $73,056.
What is the Median Household income in Tool?
Median Household Income in Tool is $65,417.
What is Income or Wage Gap in Tool?
Income or Wage Gap in Tool is 52.0%.
Women in Tool earn 48.0 cents for every dollar earned by a man.
What is Family Income Deficit in Tool?
Family Income Deficit in Tool is $7,219.
Families that are below poverty line in Tool earn $7,219 less on average than the poverty threshold level.
What is Inequality or Gini Index in Tool?
Inequality or Gini Index in Tool is 0.49.
How Large is the Labor Force in Tool?
There are 1,157 People in the Labor Forcein in Tool.
What is the Percentage of People in the Labor Force in Tool?
57.9% of People are in the Labor Force in Tool.
What is the Unemployment Rate in Tool?
Unemployment Rate in Tool is 3.7%.