Lakeside City, TX
Lakeside City Map
Lakeside City Overview
1,091
TOTAL POPULATION
508
MALE POPULATION
583
FEMALE POPULATION
87.14
MALES / 100 FEMALES
114.76
FEMALES / 100 MALES
36.9
MEDIAN AGE
3.5
AVG FAMILY SIZE
3.0
AVG HOUSEHOLD SIZE
$37,257
PER CAPITA INCOME
$113,214
AVG FAMILY INCOME
$99,265
AVG HOUSEHOLD INCOME
38.3%
WAGE / INCOME GAP [ % ]
61.7¢/ $1
WAGE / INCOME GAP [ $ ]
0.34
INEQUALITY / GINI INDEX
491
LABOR FORCE [ PEOPLE ]
63.2%
PERCENT IN LABOR FORCE
2.9%
UNEMPLOYMENT RATE
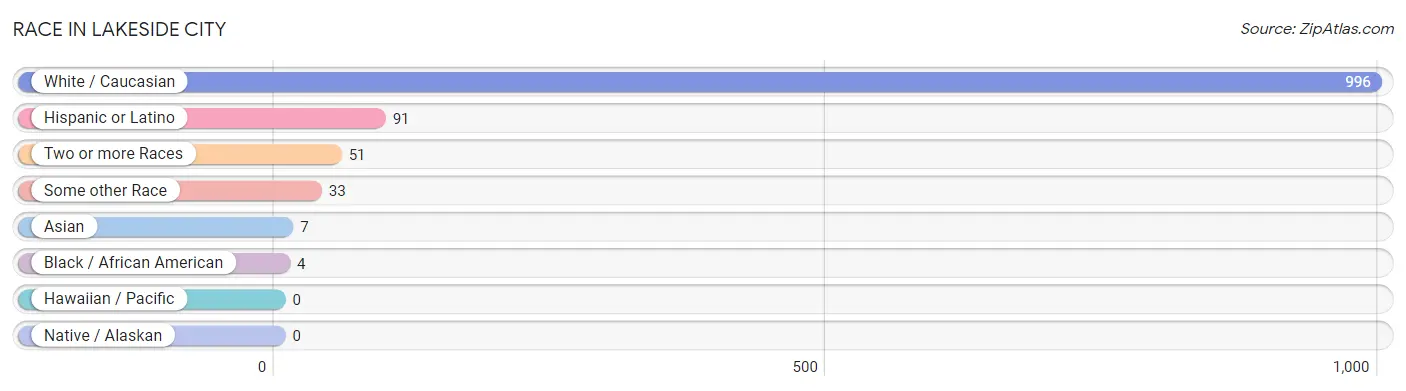
Race in Lakeside City
The most populous races in Lakeside City are White / Caucasian (996 | 91.3%), Hispanic or Latino (91 | 8.3%), and Two or more Races (51 | 4.7%).
| Race | # Population | % Population |
| Asian | 7 | 0.6% |
| Black / African American | 4 | 0.4% |
| Hawaiian / Pacific | 0 | 0.0% |
| Hispanic or Latino | 91 | 8.3% |
| Native / Alaskan | 0 | 0.0% |
| White / Caucasian | 996 | 91.3% |
| Two or more Races | 51 | 4.7% |
| Some other Race | 33 | 3.0% |
| Total | 1,091 | 100.0% |
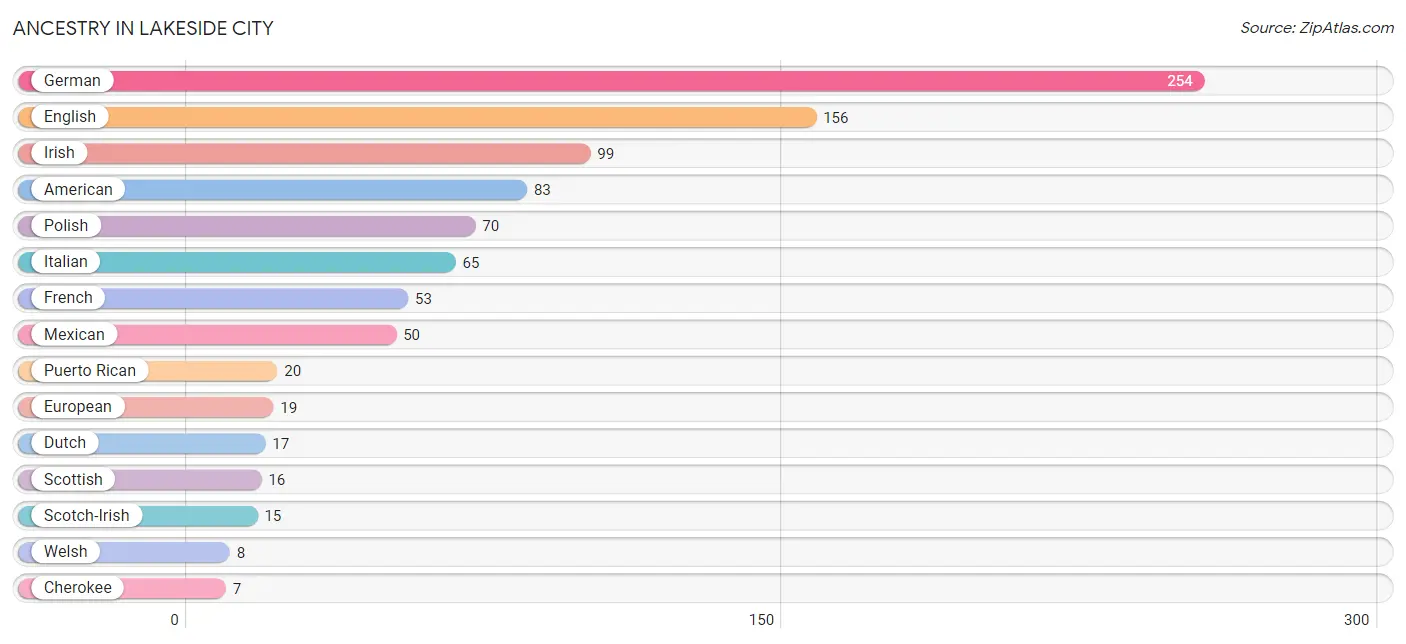
Ancestry in Lakeside City
The most populous ancestries reported in Lakeside City are German (254 | 23.3%), English (156 | 14.3%), Irish (99 | 9.1%), American (83 | 7.6%), and Polish (70 | 6.4%), together accounting for 60.7% of all Lakeside City residents.
| Ancestry | # Population | % Population |
| African | 5 | 0.5% |
| American | 83 | 7.6% |
| Austrian | 5 | 0.5% |
| Blackfeet | 5 | 0.5% |
| Central American | 3 | 0.3% |
| Cherokee | 7 | 0.6% |
| Czechoslovakian | 2 | 0.2% |
| Dutch | 17 | 1.6% |
| English | 156 | 14.3% |
| European | 19 | 1.7% |
| Finnish | 3 | 0.3% |
| French | 53 | 4.9% |
| French Canadian | 3 | 0.3% |
| German | 254 | 23.3% |
| Indian (Asian) | 7 | 0.6% |
| Irish | 99 | 9.1% |
| Italian | 65 | 6.0% |
| Mexican | 50 | 4.6% |
| Nicaraguan | 3 | 0.3% |
| Norwegian | 3 | 0.3% |
| Polish | 70 | 6.4% |
| Portuguese | 3 | 0.3% |
| Puerto Rican | 20 | 1.8% |
| Scotch-Irish | 15 | 1.4% |
| Scottish | 16 | 1.5% |
| Subsaharan African | 5 | 0.5% |
| Swedish | 4 | 0.4% |
| Swiss | 2 | 0.2% |
| Ukrainian | 2 | 0.2% |
| Welsh | 8 | 0.7% | View All 30 Rows |
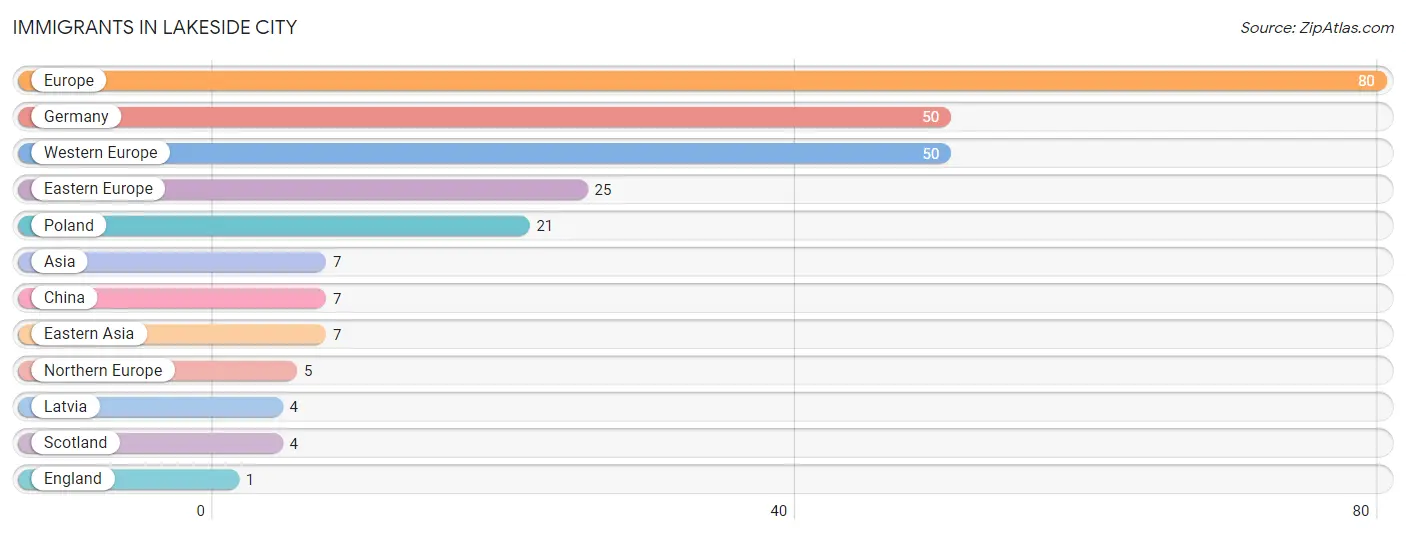
Immigrants in Lakeside City
The most numerous immigrant groups reported in Lakeside City came from Europe (80 | 7.3%), Germany (50 | 4.6%), Western Europe (50 | 4.6%), Eastern Europe (25 | 2.3%), and Poland (21 | 1.9%), together accounting for 20.7% of all Lakeside City residents.
| Immigration Origin | # Population | % Population |
| Asia | 7 | 0.6% |
| China | 7 | 0.6% |
| Eastern Asia | 7 | 0.6% |
| Eastern Europe | 25 | 2.3% |
| England | 1 | 0.1% |
| Europe | 80 | 7.3% |
| Germany | 50 | 4.6% |
| Latvia | 4 | 0.4% |
| Northern Europe | 5 | 0.5% |
| Poland | 21 | 1.9% |
| Scotland | 4 | 0.4% |
| Western Europe | 50 | 4.6% | View All 12 Rows |
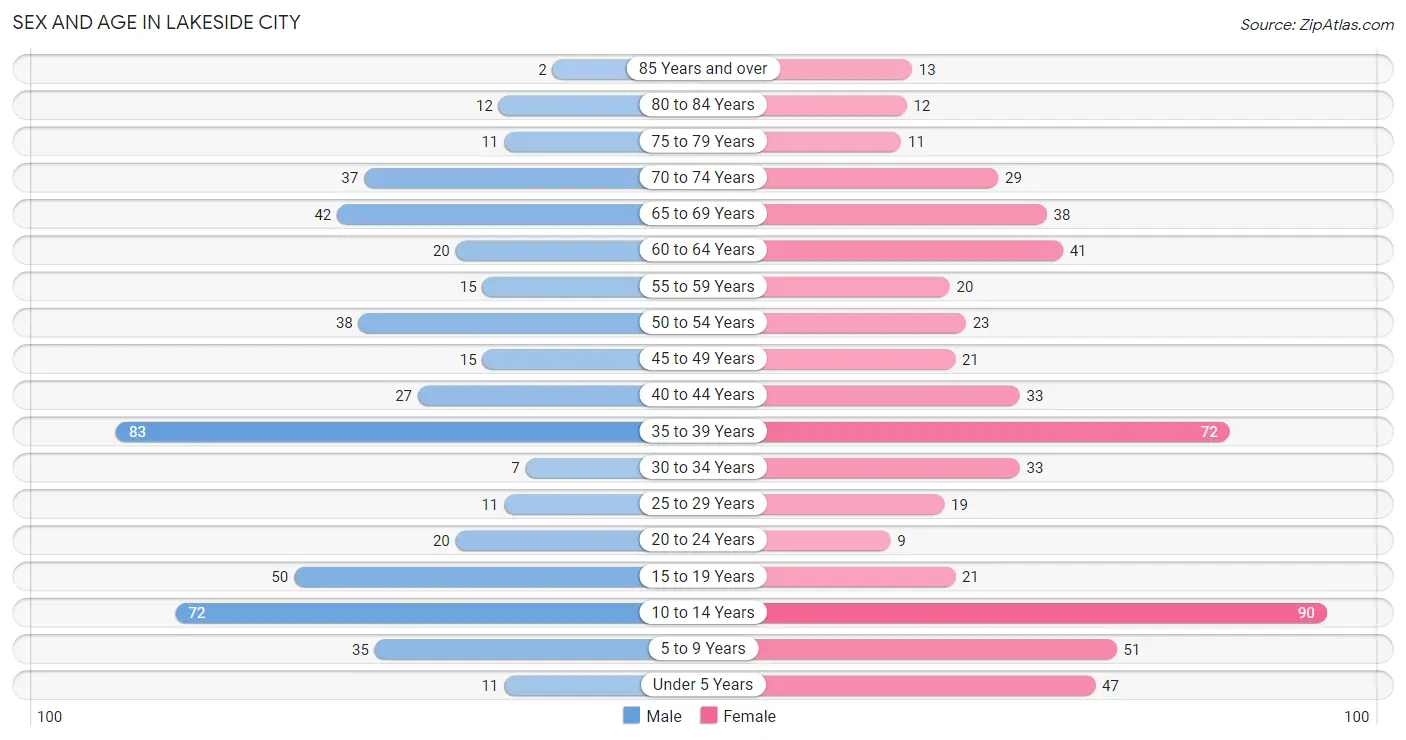
Sex and Age in Lakeside City
Sex and Age in Lakeside City
The most populous age groups in Lakeside City are 35 to 39 Years (83 | 16.3%) for men and 10 to 14 Years (90 | 15.4%) for women.
| Age Bracket | Male | Female |
| Under 5 Years | 11 (2.2%) | 47 (8.1%) |
| 5 to 9 Years | 35 (6.9%) | 51 (8.7%) |
| 10 to 14 Years | 72 (14.2%) | 90 (15.4%) |
| 15 to 19 Years | 50 (9.8%) | 21 (3.6%) |
| 20 to 24 Years | 20 (3.9%) | 9 (1.5%) |
| 25 to 29 Years | 11 (2.2%) | 19 (3.3%) |
| 30 to 34 Years | 7 (1.4%) | 33 (5.7%) |
| 35 to 39 Years | 83 (16.3%) | 72 (12.3%) |
| 40 to 44 Years | 27 (5.3%) | 33 (5.7%) |
| 45 to 49 Years | 15 (2.9%) | 21 (3.6%) |
| 50 to 54 Years | 38 (7.5%) | 23 (4.0%) |
| 55 to 59 Years | 15 (2.9%) | 20 (3.4%) |
| 60 to 64 Years | 20 (3.9%) | 41 (7.0%) |
| 65 to 69 Years | 42 (8.3%) | 38 (6.5%) |
| 70 to 74 Years | 37 (7.3%) | 29 (5.0%) |
| 75 to 79 Years | 11 (2.2%) | 11 (1.9%) |
| 80 to 84 Years | 12 (2.4%) | 12 (2.1%) |
| 85 Years and over | 2 (0.4%) | 13 (2.2%) |
| Total | 508 (100.0%) | 583 (100.0%) |
Families and Households in Lakeside City
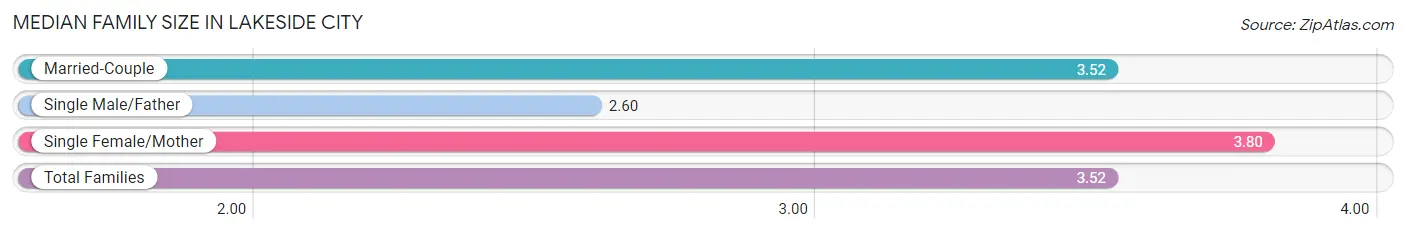
Median Family Size in Lakeside City
The median family size in Lakeside City is 3.52 persons per family, with single female/mother families (20 | 7.1%) accounting for the largest median family size of 3.8 persons per family. On the other hand, single male/father families (5 | 1.8%) represent the smallest median family size with 2.60 persons per family.
| Family Type | # Families | Family Size |
| Married-Couple | 255 (91.1%) | 3.52 |
| Single Male/Father | 5 (1.8%) | 2.60 |
| Single Female/Mother | 20 (7.1%) | 3.80 |
| Total Families | 280 (100.0%) | 3.52 |
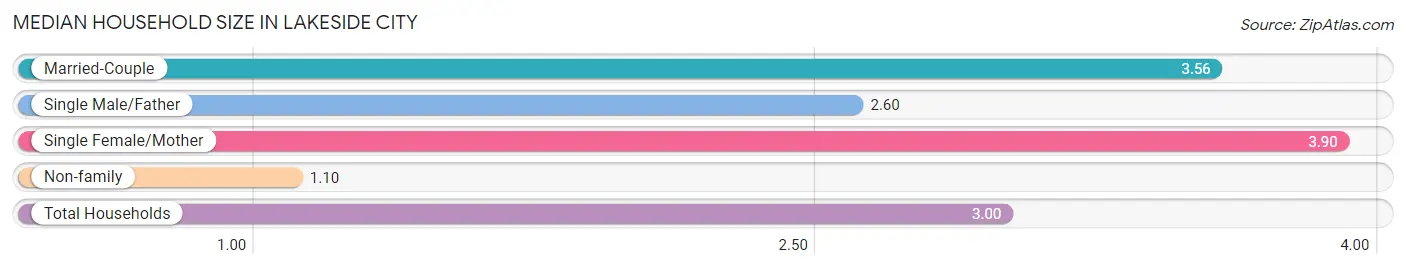
Median Household Size in Lakeside City
The median household size in Lakeside City is 3.00 persons per household, with single female/mother households (20 | 5.5%) accounting for the largest median household size of 3.9 persons per household. non-family households (84 | 23.1%) represent the smallest median household size with 1.10 persons per household.
| Household Type | # Households | Household Size |
| Married-Couple | 255 (70.1%) | 3.56 |
| Single Male/Father | 5 (1.4%) | 2.60 |
| Single Female/Mother | 20 (5.5%) | 3.90 |
| Non-family | 84 (23.1%) | 1.10 |
| Total Households | 364 (100.0%) | 3.00 |
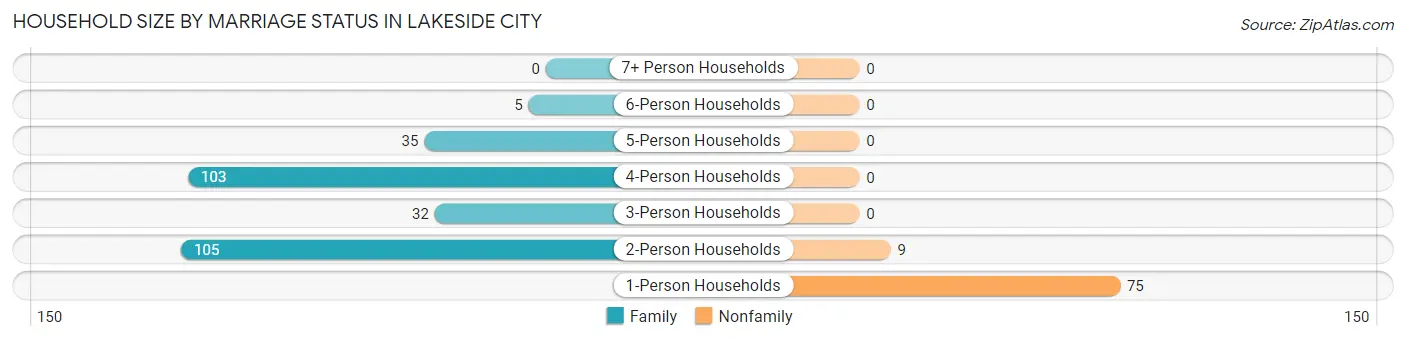
Household Size by Marriage Status in Lakeside City
Out of a total of 364 households in Lakeside City, 280 (76.9%) are family households, while 84 (23.1%) are nonfamily households. The most numerous type of family households are 2-person households, comprising 105, and the most common type of nonfamily households are 1-person households, comprising 75.
| Household Size | Family Households | Nonfamily Households |
| 1-Person Households | - | 75 (20.6%) |
| 2-Person Households | 105 (28.8%) | 9 (2.5%) |
| 3-Person Households | 32 (8.8%) | 0 (0.0%) |
| 4-Person Households | 103 (28.3%) | 0 (0.0%) |
| 5-Person Households | 35 (9.6%) | 0 (0.0%) |
| 6-Person Households | 5 (1.4%) | 0 (0.0%) |
| 7+ Person Households | 0 (0.0%) | 0 (0.0%) |
| Total | 280 (76.9%) | 84 (23.1%) |
Female Fertility in Lakeside City
Fertility by Age in Lakeside City
Average fertility rate in Lakeside City is 32.0 births per 1,000 women. Women in the age bracket of 20 to 34 years have the highest fertility rate with 115.0 births per 1,000 women. Women in the age bracket of 20 to 34 years acount for 100.0% of all women with births.
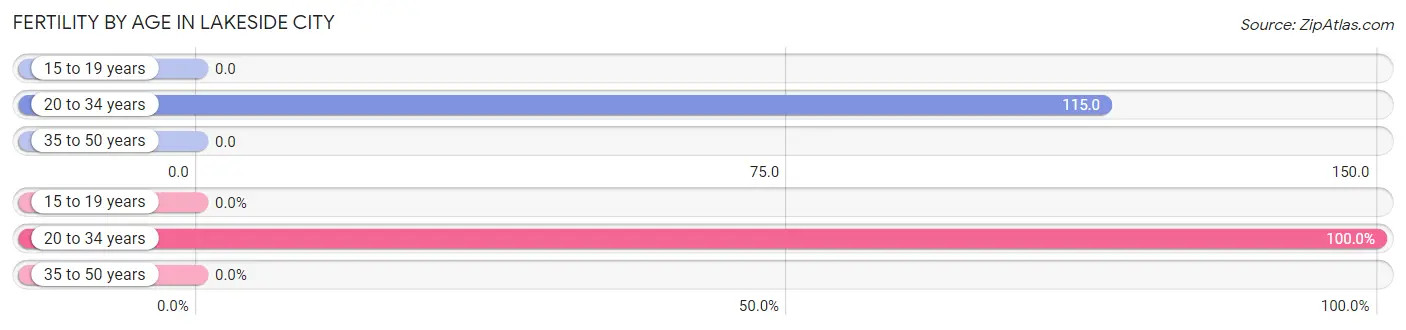
| Age Bracket | Women with Births | Births / 1,000 Women |
| 15 to 19 years | 0 (0.0%) | 0.0 |
| 20 to 34 years | 7 (100.0%) | 115.0 |
| 35 to 50 years | 0 (0.0%) | 0.0 |
| Total | 7 (100.0%) | 32.0 |
Fertility by Age by Marriage Status in Lakeside City
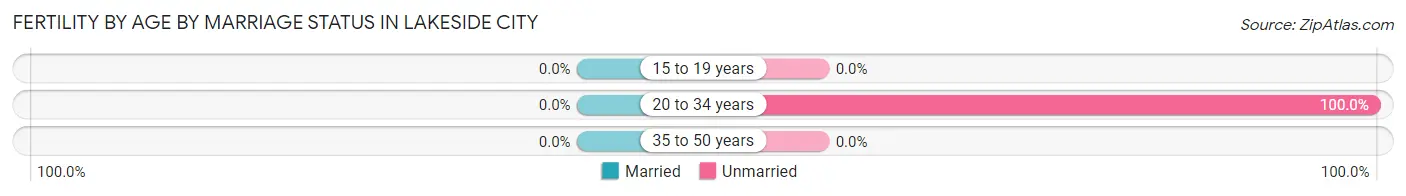
| Age Bracket | Married | Unmarried |
| 15 to 19 years | 0 (0.0%) | 0 (0.0%) |
| 20 to 34 years | 0 (0.0%) | 7 (100.0%) |
| 35 to 50 years | 0 (0.0%) | 0 (0.0%) |
| Total | 0 (0.0%) | 7 (100.0%) |
Fertility by Education in Lakeside City
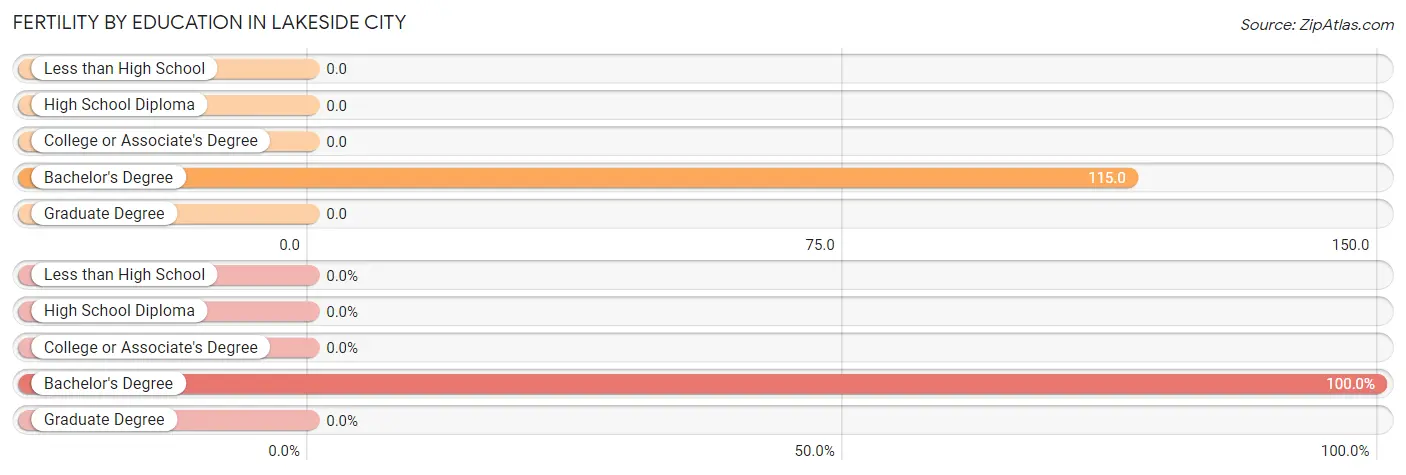
| Educational Attainment | Women with Births | Births / 1,000 Women |
| Less than High School | 0 (0.0%) | 0.0 |
| High School Diploma | 0 (0.0%) | 0.0 |
| College or Associate's Degree | 0 (0.0%) | 0.0 |
| Bachelor's Degree | 7 (100.0%) | 115.0 |
| Graduate Degree | 0 (0.0%) | 0.0 |
| Total | 7 (100.0%) | 32.0 |
Fertility by Education by Marriage Status in Lakeside City
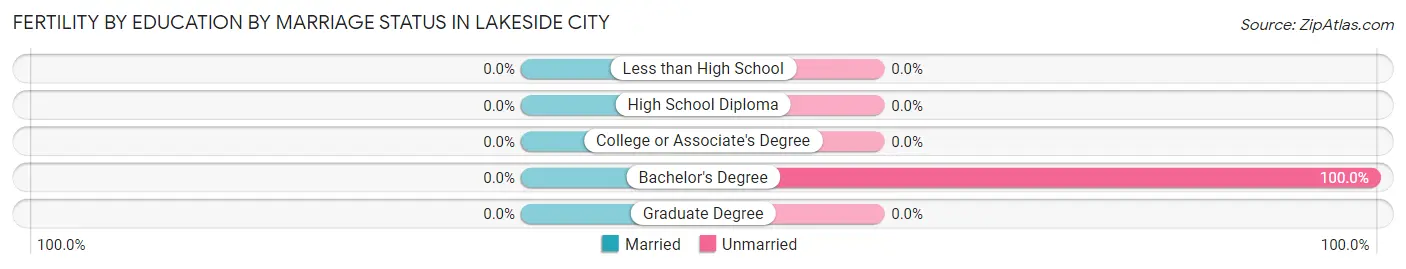
| Educational Attainment | Married | Unmarried |
| Less than High School | 0 (0.0%) | 0 (0.0%) |
| High School Diploma | 0 (0.0%) | 0 (0.0%) |
| College or Associate's Degree | 0 (0.0%) | 0 (0.0%) |
| Bachelor's Degree | 0 (0.0%) | 7 (100.0%) |
| Graduate Degree | 0 (0.0%) | 0 (0.0%) |
| Total | 0 (0.0%) | 7 (100.0%) |
Income in Lakeside City
Income Overview in Lakeside City
Per Capita Income in Lakeside City is $37,257, while median incomes of families and households are $113,214 and $99,265 respectively.
| Characteristic | Number | Measure |
| Per Capita Income | 1,091 | $37,257 |
| Median Family Income | 280 | $113,214 |
| Mean Family Income | 280 | $121,955 |
| Median Household Income | 364 | $99,265 |
| Mean Household Income | 364 | $107,054 |
| Income Deficit | 280 | $0 |
| Wage / Income Gap (%) | 1,091 | 38.28% |
| Wage / Income Gap ($) | 1,091 | 61.72¢ per $1 |
| Gini / Inequality Index | 1,091 | 0.34 |
Earnings by Sex in Lakeside City
Average Earnings in Lakeside City are $50,515, $67,639 for men and $41,750 for women, a difference of 38.3%.
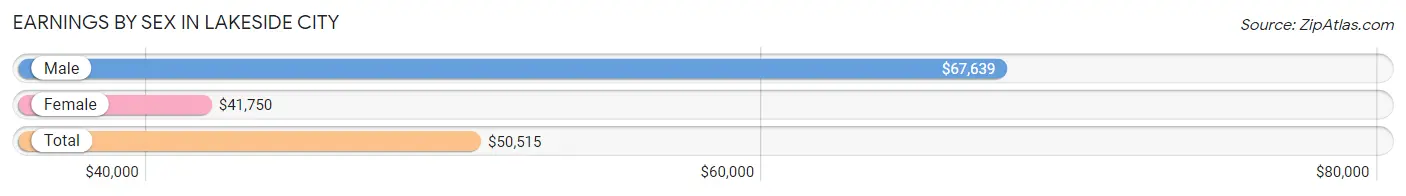
| Sex | Number | Average Earnings |
| Male | 267 (51.2%) | $67,639 |
| Female | 254 (48.7%) | $41,750 |
| Total | 521 (100.0%) | $50,515 |
Earnings by Sex by Income Bracket in Lakeside City
The most common earnings brackets in Lakeside City are $75,000 to $99,999 for men (74 | 27.7%) and $40,000 to $44,999 for women (37 | 14.6%).
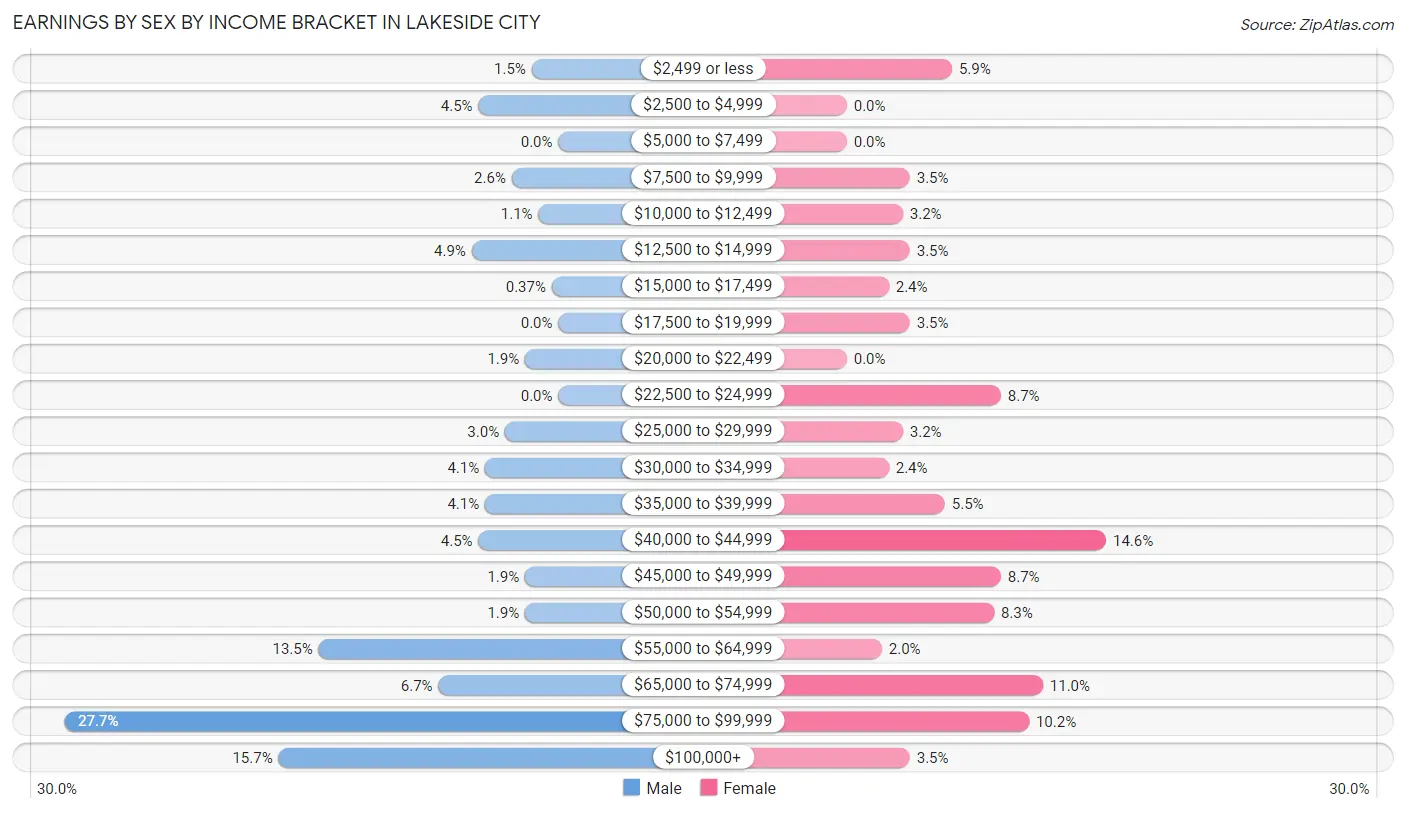
| Income | Male | Female |
| $2,499 or less | 4 (1.5%) | 15 (5.9%) |
| $2,500 to $4,999 | 12 (4.5%) | 0 (0.0%) |
| $5,000 to $7,499 | 0 (0.0%) | 0 (0.0%) |
| $7,500 to $9,999 | 7 (2.6%) | 9 (3.5%) |
| $10,000 to $12,499 | 3 (1.1%) | 8 (3.2%) |
| $12,500 to $14,999 | 13 (4.9%) | 9 (3.5%) |
| $15,000 to $17,499 | 1 (0.4%) | 6 (2.4%) |
| $17,500 to $19,999 | 0 (0.0%) | 9 (3.5%) |
| $20,000 to $22,499 | 5 (1.9%) | 0 (0.0%) |
| $22,500 to $24,999 | 0 (0.0%) | 22 (8.7%) |
| $25,000 to $29,999 | 8 (3.0%) | 8 (3.2%) |
| $30,000 to $34,999 | 11 (4.1%) | 6 (2.4%) |
| $35,000 to $39,999 | 11 (4.1%) | 14 (5.5%) |
| $40,000 to $44,999 | 12 (4.5%) | 37 (14.6%) |
| $45,000 to $49,999 | 5 (1.9%) | 22 (8.7%) |
| $50,000 to $54,999 | 5 (1.9%) | 21 (8.3%) |
| $55,000 to $64,999 | 36 (13.5%) | 5 (2.0%) |
| $65,000 to $74,999 | 18 (6.7%) | 28 (11.0%) |
| $75,000 to $99,999 | 74 (27.7%) | 26 (10.2%) |
| $100,000+ | 42 (15.7%) | 9 (3.5%) |
| Total | 267 (100.0%) | 254 (100.0%) |
Earnings by Sex by Educational Attainment in Lakeside City
Average earnings in Lakeside City are $73,594 for men and $42,679 for women, a difference of 42.0%. Men with an educational attainment of high school diploma enjoy the highest average annual earnings of $86,319, while those with college or associate's degree education earn the least with $58,958. Women with an educational attainment of graduate degree earn the most with the average annual earnings of $69,583, while those with college or associate's degree education have the smallest earnings of $39,091.
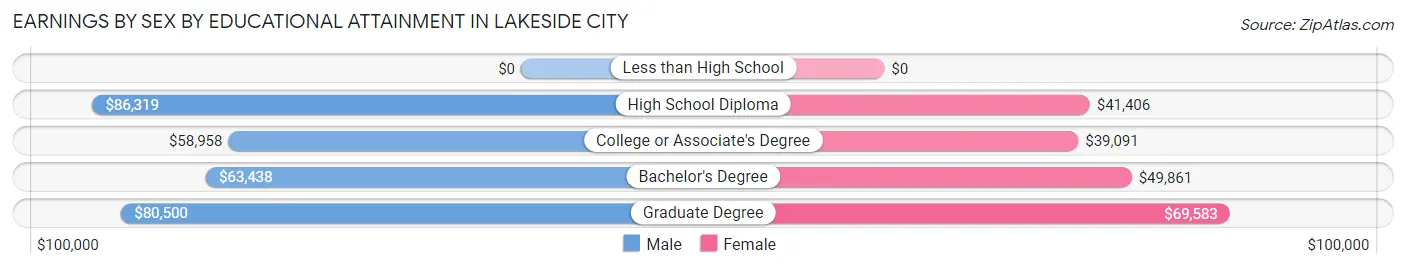
| Educational Attainment | Male Income | Female Income |
| Less than High School | - | - |
| High School Diploma | $86,319 | $41,406 |
| College or Associate's Degree | $58,958 | $39,091 |
| Bachelor's Degree | $63,438 | $49,861 |
| Graduate Degree | $80,500 | $69,583 |
| Total | $73,594 | $42,679 |
Family Income in Lakeside City
Family Income Brackets in Lakeside City
According to the Lakeside City family income data, there are 104 families falling into the $100,000 to $149,999 income range, which is the most common income bracket and makes up 37.1% of all families.
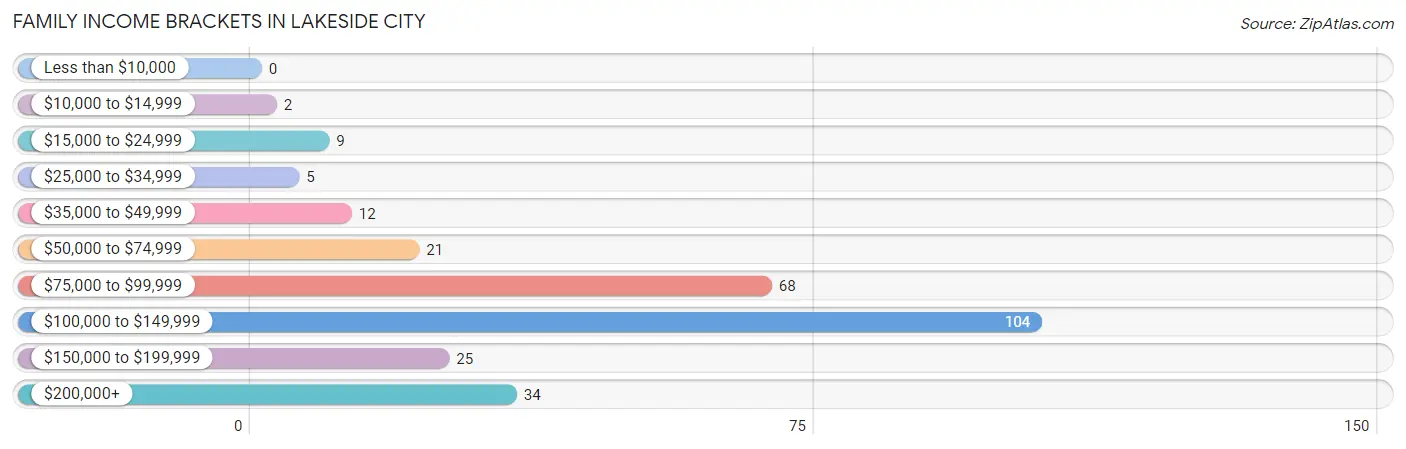
| Income Bracket | # Families | % Families |
| Less than $10,000 | 0 | 0.0% |
| $10,000 to $14,999 | 2 | 0.7% |
| $15,000 to $24,999 | 9 | 3.2% |
| $25,000 to $34,999 | 5 | 1.8% |
| $35,000 to $49,999 | 12 | 4.3% |
| $50,000 to $74,999 | 21 | 7.5% |
| $75,000 to $99,999 | 68 | 24.3% |
| $100,000 to $149,999 | 104 | 37.1% |
| $150,000 to $199,999 | 25 | 8.9% |
| $200,000+ | 34 | 12.1% |
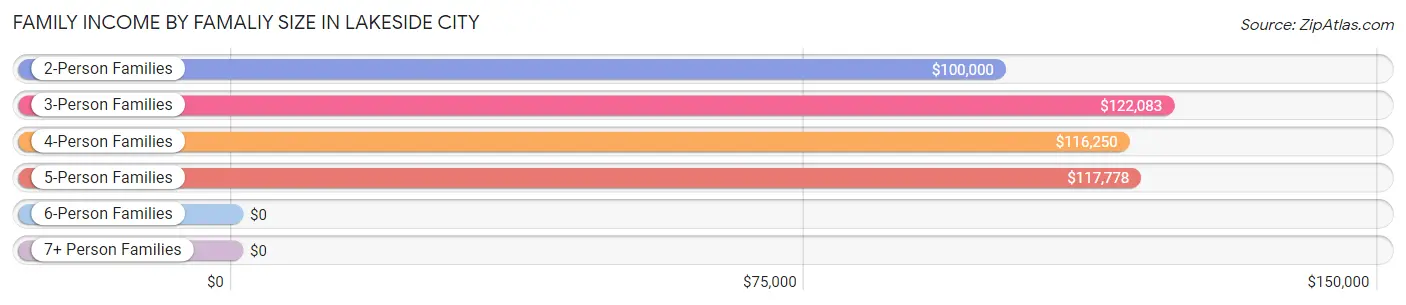
Family Income by Famaliy Size in Lakeside City
3-person families (27 | 9.6%) account for the highest median family income in Lakeside City with $122,083 per family, while 2-person families (110 | 39.3%) have the highest median income of $50,000 per family member.
| Income Bracket | # Families | Median Income |
| 2-Person Families | 110 (39.3%) | $100,000 |
| 3-Person Families | 27 (9.6%) | $122,083 |
| 4-Person Families | 109 (38.9%) | $116,250 |
| 5-Person Families | 32 (11.4%) | $117,778 |
| 6-Person Families | 2 (0.7%) | $0 |
| 7+ Person Families | 0 (0.0%) | $0 |
| Total | 280 (100.0%) | $113,214 |
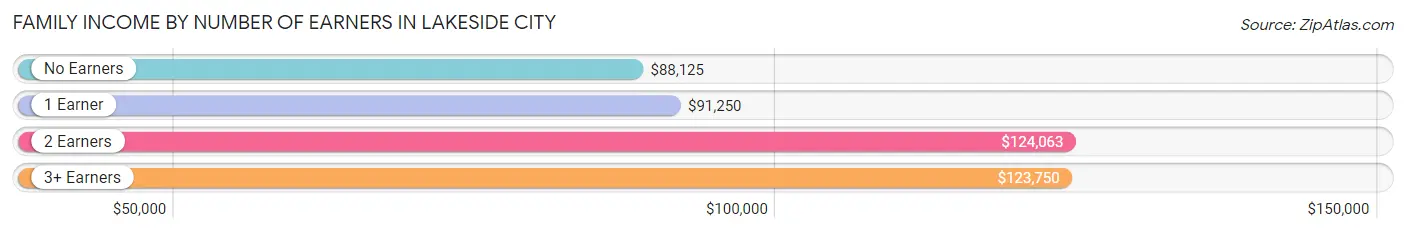
Family Income by Number of Earners in Lakeside City
The median family income in Lakeside City is $113,214, with families comprising 2 earners (147) having the highest median family income of $124,063, while families with no earners (25) have the lowest median family income of $88,125, accounting for 52.5% and 8.9% of families, respectively.
| Number of Earners | # Families | Median Income |
| No Earners | 25 (8.9%) | $88,125 |
| 1 Earner | 86 (30.7%) | $91,250 |
| 2 Earners | 147 (52.5%) | $124,063 |
| 3+ Earners | 22 (7.9%) | $123,750 |
| Total | 280 (100.0%) | $113,214 |
Household Income in Lakeside City
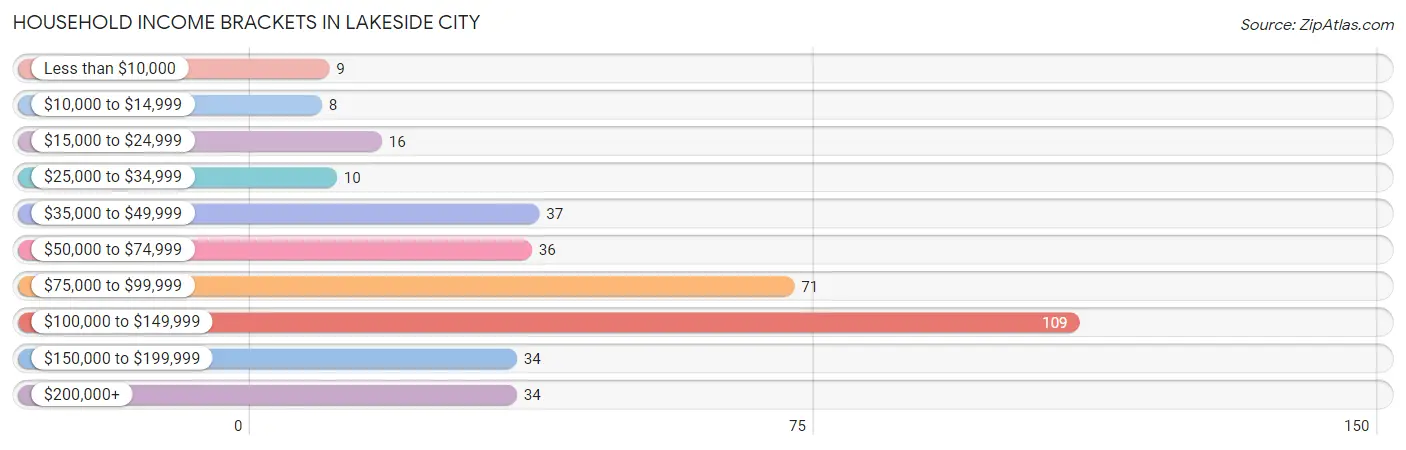
Household Income Brackets in Lakeside City
With 109 households falling in the category, the $100,000 to $149,999 income range is the most frequent in Lakeside City, accounting for 29.9% of all households. In contrast, only 8 households (2.2%) fall into the $10,000 to $14,999 income bracket, making it the least populous group.
| Income Bracket | # Households | % Households |
| Less than $10,000 | 9 | 2.5% |
| $10,000 to $14,999 | 8 | 2.2% |
| $15,000 to $24,999 | 16 | 4.4% |
| $25,000 to $34,999 | 10 | 2.7% |
| $35,000 to $49,999 | 37 | 10.2% |
| $50,000 to $74,999 | 36 | 9.9% |
| $75,000 to $99,999 | 71 | 19.5% |
| $100,000 to $149,999 | 109 | 29.9% |
| $150,000 to $199,999 | 34 | 9.3% |
| $200,000+ | 34 | 9.3% |
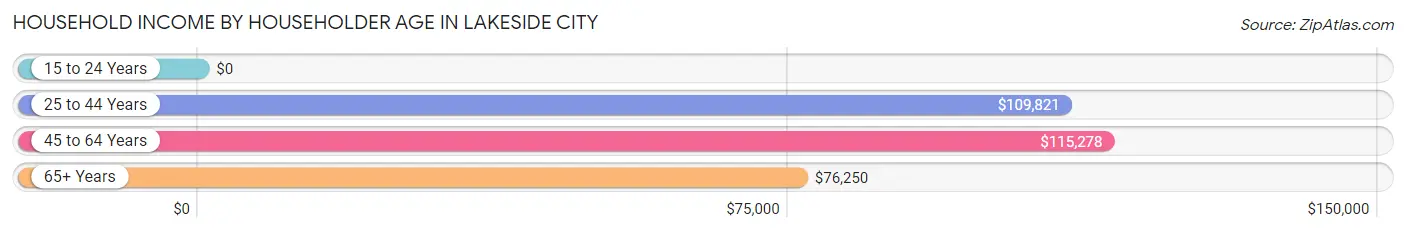
Household Income by Householder Age in Lakeside City
The median household income in Lakeside City is $99,265, with the highest median household income of $115,278 found in the 45 to 64 years age bracket for the primary householder. A total of 102 households (28.0%) fall into this category.
| Income Bracket | # Households | Median Income |
| 15 to 24 Years | 0 (0.0%) | $0 |
| 25 to 44 Years | 129 (35.4%) | $109,821 |
| 45 to 64 Years | 102 (28.0%) | $115,278 |
| 65+ Years | 133 (36.5%) | $76,250 |
| Total | 364 (100.0%) | $99,265 |
Poverty in Lakeside City
Income Below Poverty by Sex and Age in Lakeside City
With 2.6% poverty level for males and 4.6% for females among the residents of Lakeside City, 16 and 17 year old males and 75 year old and over females are the most vulnerable to poverty, with 4 males (14.3%) and 9 females (25.0%) in their respective age groups living below the poverty level.
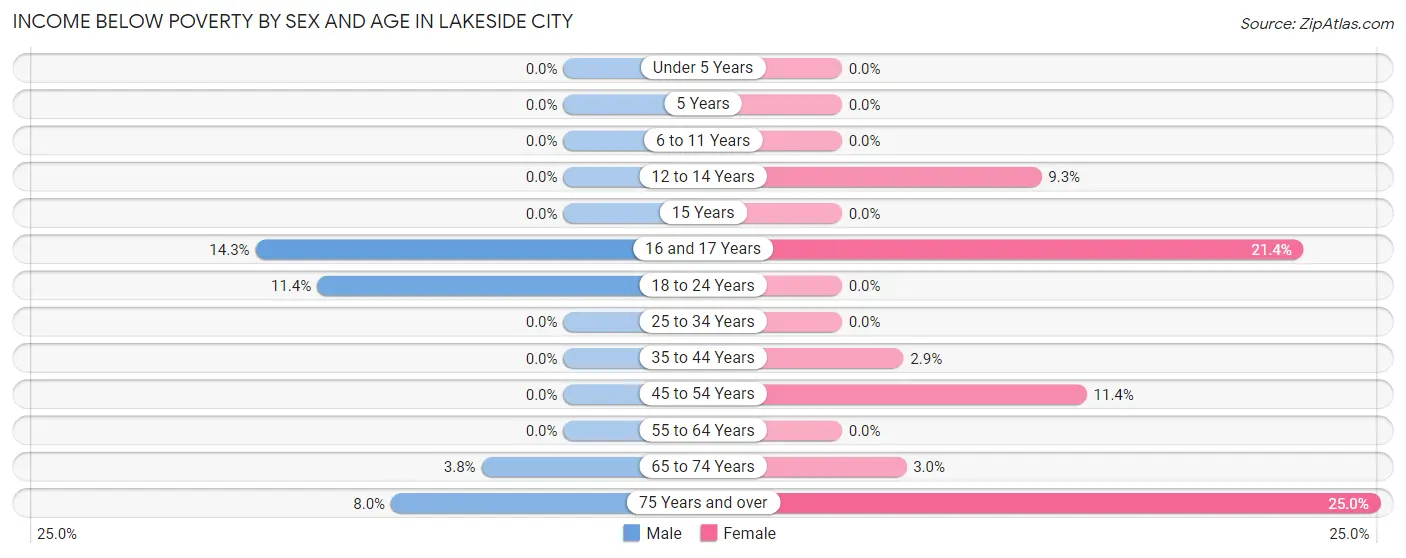
| Age Bracket | Male | Female |
| Under 5 Years | 0 (0.0%) | 0 (0.0%) |
| 5 Years | 0 (0.0%) | 0 (0.0%) |
| 6 to 11 Years | 0 (0.0%) | 0 (0.0%) |
| 12 to 14 Years | 0 (0.0%) | 5 (9.3%) |
| 15 Years | 0 (0.0%) | 0 (0.0%) |
| 16 and 17 Years | 4 (14.3%) | 3 (21.4%) |
| 18 to 24 Years | 4 (11.4%) | 0 (0.0%) |
| 25 to 34 Years | 0 (0.0%) | 0 (0.0%) |
| 35 to 44 Years | 0 (0.0%) | 3 (2.9%) |
| 45 to 54 Years | 0 (0.0%) | 5 (11.4%) |
| 55 to 64 Years | 0 (0.0%) | 0 (0.0%) |
| 65 to 74 Years | 3 (3.8%) | 2 (3.0%) |
| 75 Years and over | 2 (8.0%) | 9 (25.0%) |
| Total | 13 (2.6%) | 27 (4.6%) |
Income Above Poverty by Sex and Age in Lakeside City
According to the poverty statistics in Lakeside City, males aged under 5 years and females aged under 5 years are the age groups that are most secure financially, with 100.0% of males and 100.0% of females in these age groups living above the poverty line.
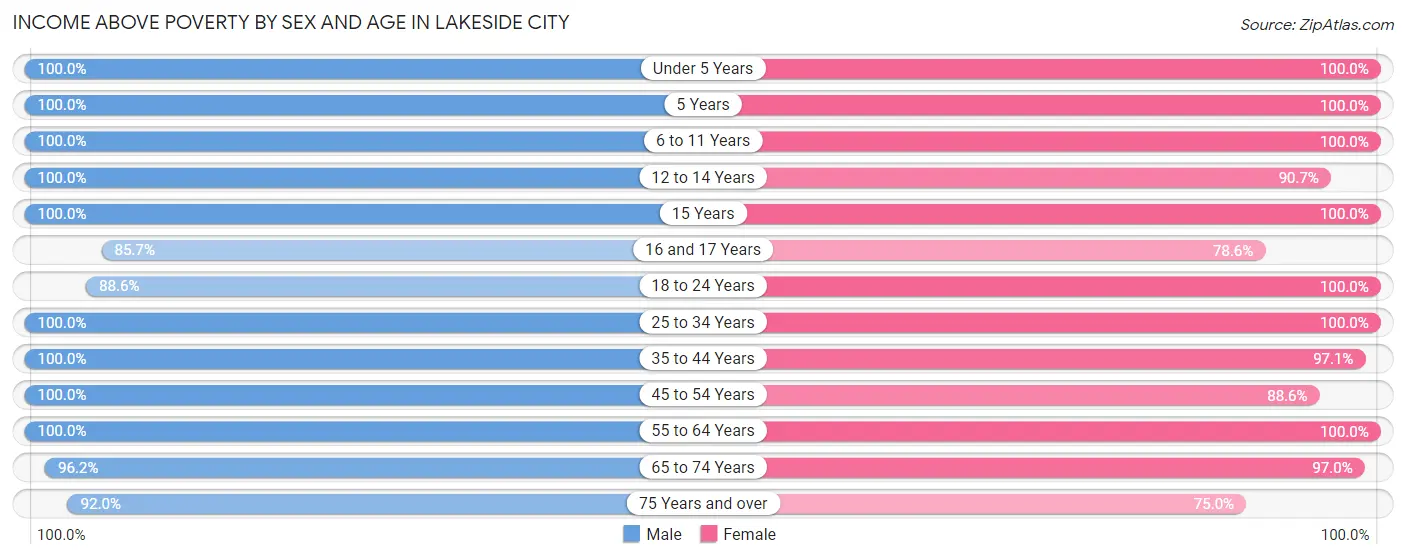
| Age Bracket | Male | Female |
| Under 5 Years | 6 (100.0%) | 47 (100.0%) |
| 5 Years | 15 (100.0%) | 27 (100.0%) |
| 6 to 11 Years | 50 (100.0%) | 60 (100.0%) |
| 12 to 14 Years | 42 (100.0%) | 49 (90.7%) |
| 15 Years | 7 (100.0%) | 1 (100.0%) |
| 16 and 17 Years | 24 (85.7%) | 11 (78.6%) |
| 18 to 24 Years | 31 (88.6%) | 15 (100.0%) |
| 25 to 34 Years | 18 (100.0%) | 52 (100.0%) |
| 35 to 44 Years | 110 (100.0%) | 102 (97.1%) |
| 45 to 54 Years | 53 (100.0%) | 39 (88.6%) |
| 55 to 64 Years | 35 (100.0%) | 61 (100.0%) |
| 65 to 74 Years | 76 (96.2%) | 65 (97.0%) |
| 75 Years and over | 23 (92.0%) | 27 (75.0%) |
| Total | 490 (97.4%) | 556 (95.4%) |
Income Below Poverty Among Married-Couple Families in Lakeside City
The poverty statistics for married-couple families in Lakeside City show that 0.8% or 2 of the total 255 families live below the poverty line. Families with no children have the highest poverty rate of 1.7%, comprising of 2 families. On the other hand, families with 1 or 2 children have the lowest poverty rate of 0.0%, which includes 0 families.
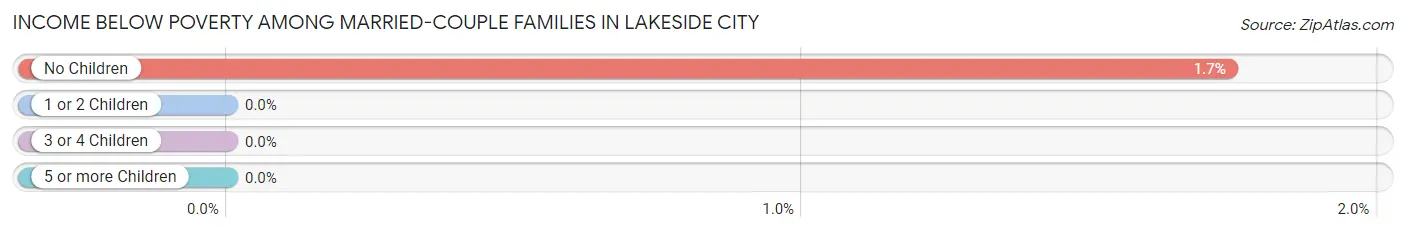
| Children | Above Poverty | Below Poverty |
| No Children | 113 (98.3%) | 2 (1.7%) |
| 1 or 2 Children | 125 (100.0%) | 0 (0.0%) |
| 3 or 4 Children | 15 (100.0%) | 0 (0.0%) |
| 5 or more Children | 0 (0.0%) | 0 (0.0%) |
| Total | 253 (99.2%) | 2 (0.8%) |
Income Below Poverty Among Single-Parent Households in Lakeside City
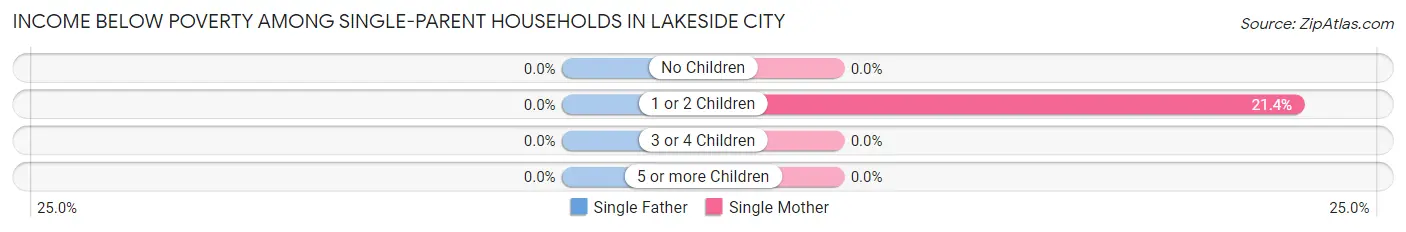
| Children | Single Father | Single Mother |
| No Children | 0 (0.0%) | 0 (0.0%) |
| 1 or 2 Children | 0 (0.0%) | 3 (21.4%) |
| 3 or 4 Children | 0 (0.0%) | 0 (0.0%) |
| 5 or more Children | 0 (0.0%) | 0 (0.0%) |
| Total | 0 (0.0%) | 3 (15.0%) |
Income Below Poverty Among Married-Couple vs Single-Parent Households in Lakeside City
The poverty data for Lakeside City shows that 2 of the married-couple family households (0.8%) and 3 of the single-parent households (12.0%) are living below the poverty level. Within the married-couple family households, those with no children have the highest poverty rate, with 2 households (1.7%) falling below the poverty line. Among the single-parent households, those with 1 or 2 children have the highest poverty rate, with 3 household (15.8%) living below poverty.
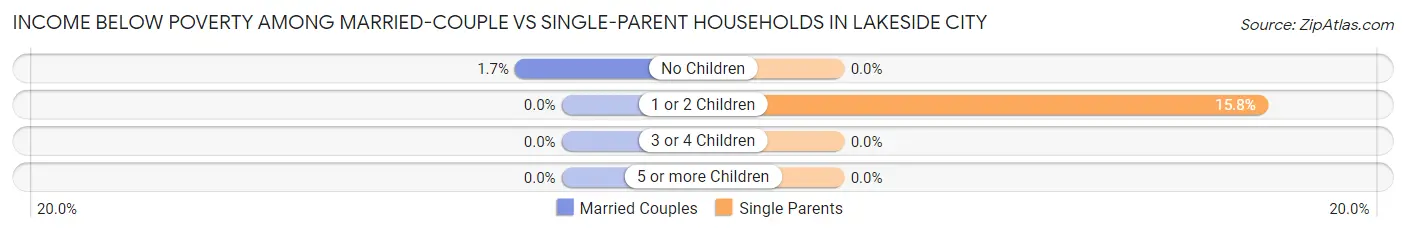
| Children | Married-Couple Families | Single-Parent Households |
| No Children | 2 (1.7%) | 0 (0.0%) |
| 1 or 2 Children | 0 (0.0%) | 3 (15.8%) |
| 3 or 4 Children | 0 (0.0%) | 0 (0.0%) |
| 5 or more Children | 0 (0.0%) | 0 (0.0%) |
| Total | 2 (0.8%) | 3 (12.0%) |
Employment Characteristics in Lakeside City
Employment by Class of Employer in Lakeside City
Among the 467 employed individuals in Lakeside City, private company employees (271 | 58.0%), self-employed (not incorporated) (42 | 9.0%), and federal government employees (41 | 8.8%) make up the most common classes of employment.
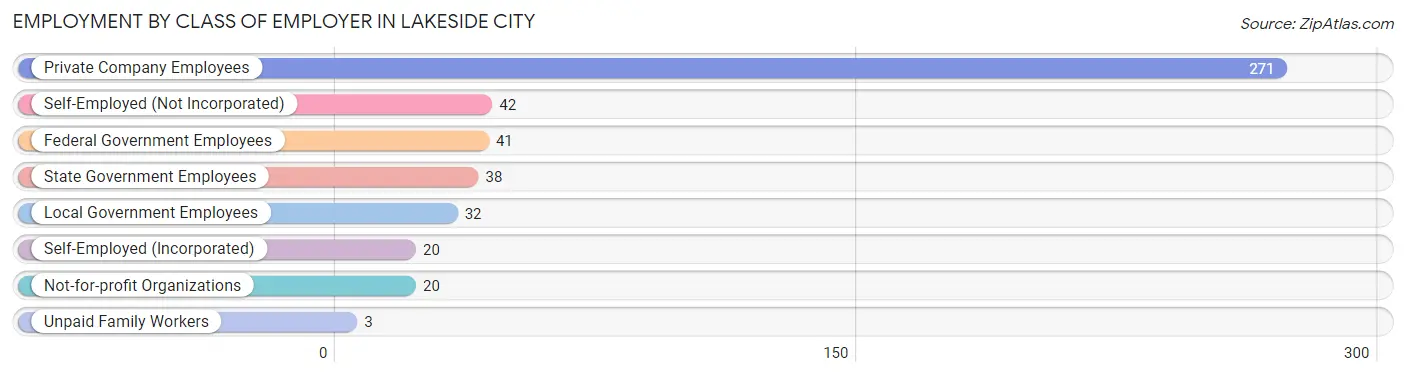
| Employer Class | # Employees | % Employees |
| Private Company Employees | 271 | 58.0% |
| Self-Employed (Incorporated) | 20 | 4.3% |
| Self-Employed (Not Incorporated) | 42 | 9.0% |
| Not-for-profit Organizations | 20 | 4.3% |
| Local Government Employees | 32 | 6.9% |
| State Government Employees | 38 | 8.1% |
| Federal Government Employees | 41 | 8.8% |
| Unpaid Family Workers | 3 | 0.6% |
| Total | 467 | 100.0% |
Employment Status by Age in Lakeside City
According to the labor force statistics for Lakeside City, out of the total population over 16 years of age (777), 63.2% or 491 individuals are in the labor force, with 2.9% or 14 of them unemployed. The age group with the highest labor force participation rate is 55 to 59 years, with 94.3% or 33 individuals in the labor force. Within the labor force, the 16 to 19 years age range has the highest percentage of unemployed individuals, with 20.0% or 2 of them being unemployed.
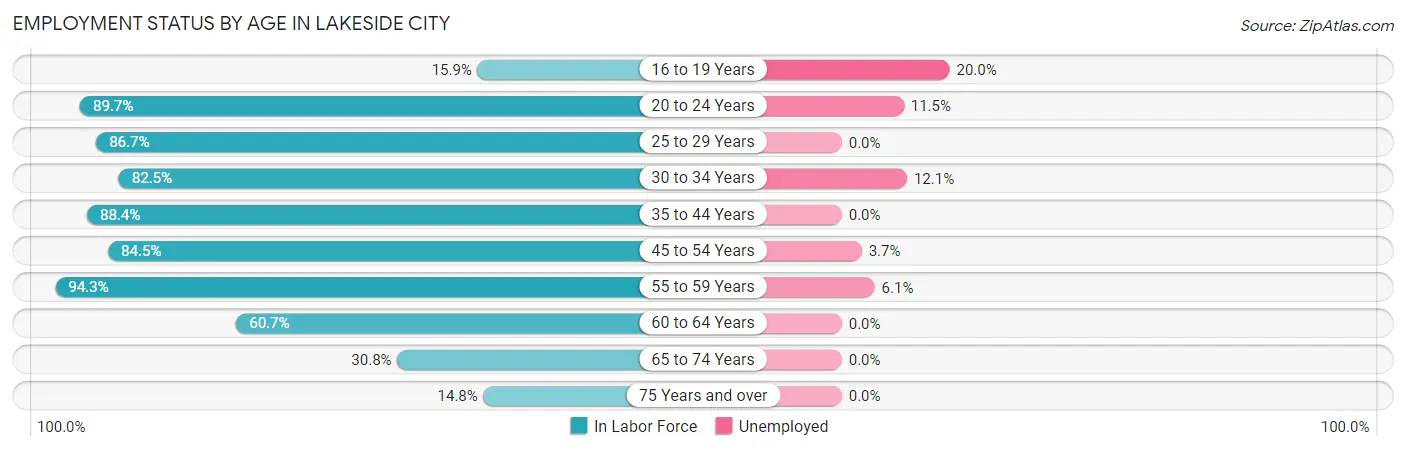
| Age Bracket | In Labor Force | Unemployed |
| 16 to 19 Years | 10 (15.9%) | 2 (20.0%) |
| 20 to 24 Years | 26 (89.7%) | 3 (11.5%) |
| 25 to 29 Years | 26 (86.7%) | 0 (0.0%) |
| 30 to 34 Years | 33 (82.5%) | 4 (12.1%) |
| 35 to 44 Years | 190 (88.4%) | 0 (0.0%) |
| 45 to 54 Years | 82 (84.5%) | 3 (3.7%) |
| 55 to 59 Years | 33 (94.3%) | 2 (6.1%) |
| 60 to 64 Years | 37 (60.7%) | 0 (0.0%) |
| 65 to 74 Years | 45 (30.8%) | 0 (0.0%) |
| 75 Years and over | 9 (14.8%) | 0 (0.0%) |
| Total | 491 (63.2%) | 14 (2.9%) |
Employment Status by Educational Attainment in Lakeside City
According to labor force statistics for Lakeside City, 83.9% of individuals (401) out of the total population between 25 and 64 years of age (478) are in the labor force, with 2.3% or 9 of them being unemployed. The group with the highest labor force participation rate are those with the educational attainment of less than high school, with 100.0% or 2 individuals in the labor force. Within the labor force, individuals with high school diploma education have the highest percentage of unemployment, with 7.0% or 5 of them being unemployed.
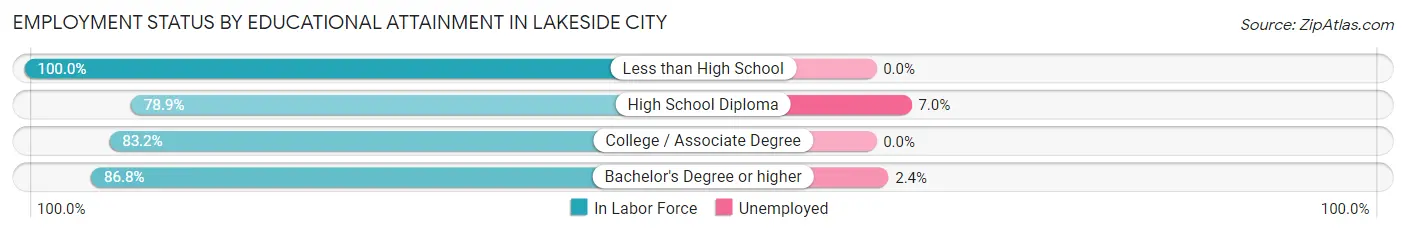
| Educational Attainment | In Labor Force | Unemployed |
| Less than High School | 2 (100.0%) | 0 (0.0%) |
| High School Diploma | 71 (78.9%) | 6 (7.0%) |
| College / Associate Degree | 163 (83.2%) | 0 (0.0%) |
| Bachelor's Degree or higher | 165 (86.8%) | 5 (2.4%) |
| Total | 401 (83.9%) | 11 (2.3%) |
Employment Occupations by Sex in Lakeside City
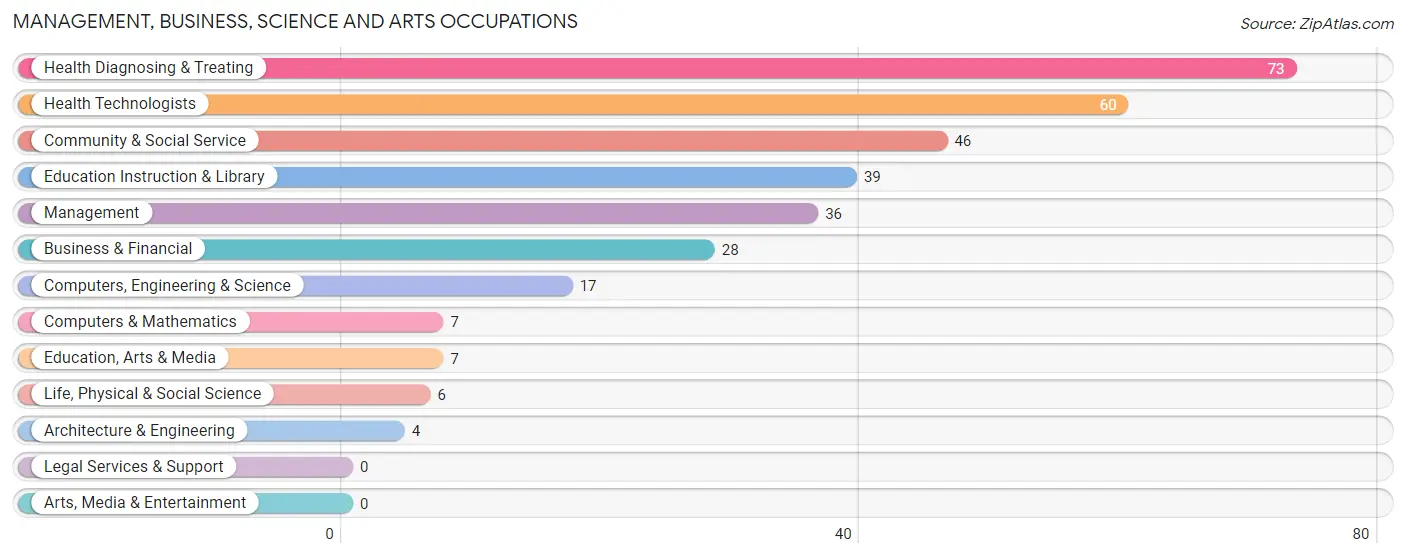
Management, Business, Science and Arts Occupations
The most common Management, Business, Science and Arts occupations in Lakeside City are Health Diagnosing & Treating (73 | 15.5%), Health Technologists (60 | 12.7%), Community & Social Service (46 | 9.8%), Education Instruction & Library (39 | 8.3%), and Management (36 | 7.6%).
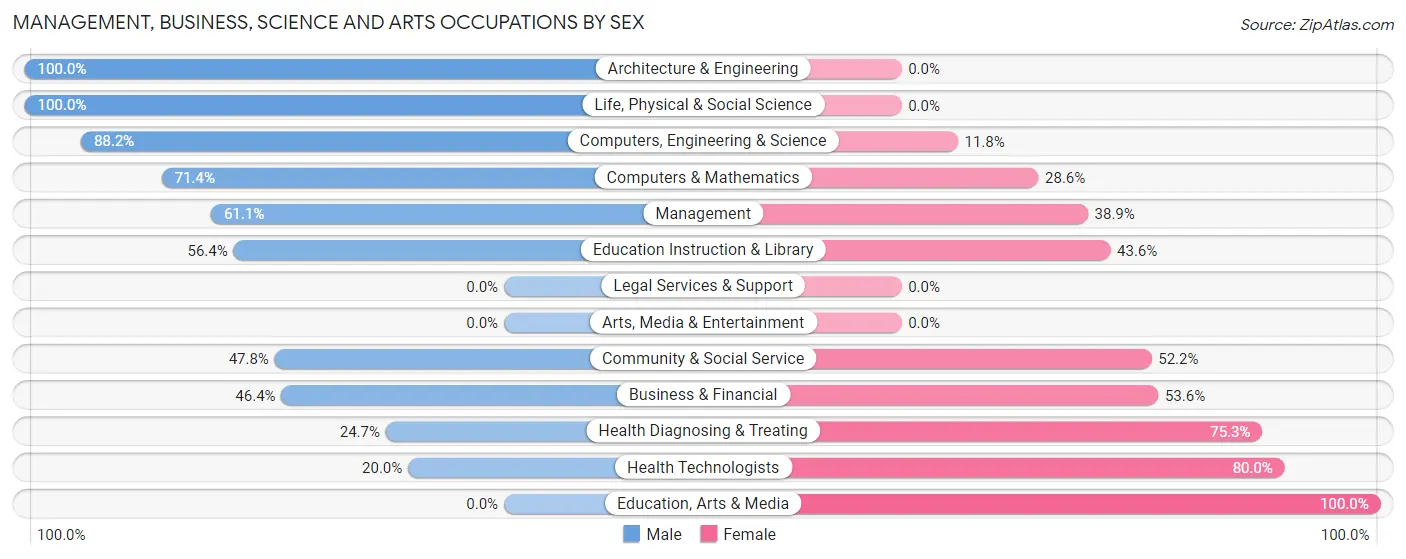
Management, Business, Science and Arts Occupations by Sex
Within the Management, Business, Science and Arts occupations in Lakeside City, the most male-oriented occupations are Architecture & Engineering (100.0%), Life, Physical & Social Science (100.0%), and Computers, Engineering & Science (88.2%), while the most female-oriented occupations are Education, Arts & Media (100.0%), Health Technologists (80.0%), and Health Diagnosing & Treating (75.3%).
| Occupation | Male | Female |
| Management | 22 (61.1%) | 14 (38.9%) |
| Business & Financial | 13 (46.4%) | 15 (53.6%) |
| Computers, Engineering & Science | 15 (88.2%) | 2 (11.8%) |
| Computers & Mathematics | 5 (71.4%) | 2 (28.6%) |
| Architecture & Engineering | 4 (100.0%) | 0 (0.0%) |
| Life, Physical & Social Science | 6 (100.0%) | 0 (0.0%) |
| Community & Social Service | 22 (47.8%) | 24 (52.2%) |
| Education, Arts & Media | 0 (0.0%) | 7 (100.0%) |
| Legal Services & Support | 0 (0.0%) | 0 (0.0%) |
| Education Instruction & Library | 22 (56.4%) | 17 (43.6%) |
| Arts, Media & Entertainment | 0 (0.0%) | 0 (0.0%) |
| Health Diagnosing & Treating | 18 (24.7%) | 55 (75.3%) |
| Health Technologists | 12 (20.0%) | 48 (80.0%) |
| Total (Category) | 90 (45.0%) | 110 (55.0%) |
| Total (Overall) | 240 (51.0%) | 231 (49.0%) |
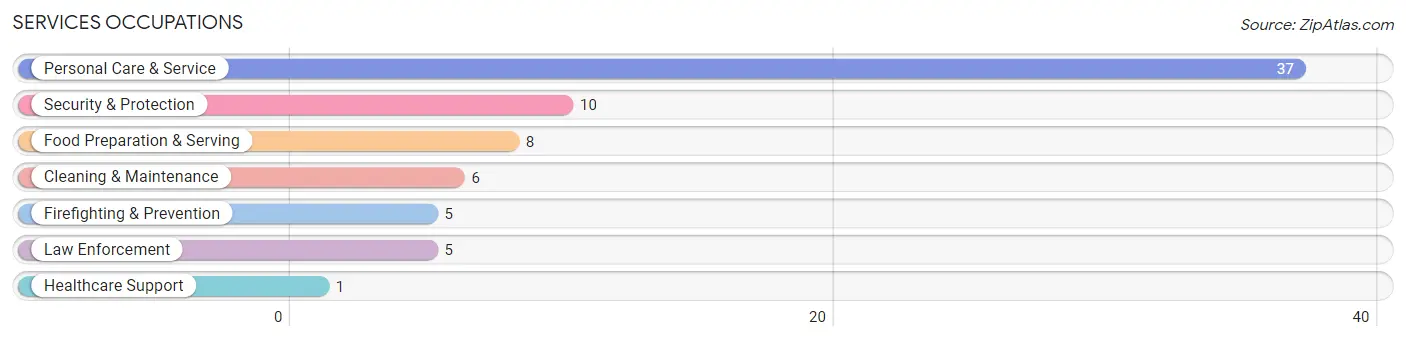
Services Occupations
The most common Services occupations in Lakeside City are Personal Care & Service (37 | 7.9%), Security & Protection (10 | 2.1%), Food Preparation & Serving (8 | 1.7%), Cleaning & Maintenance (6 | 1.3%), and Firefighting & Prevention (5 | 1.1%).
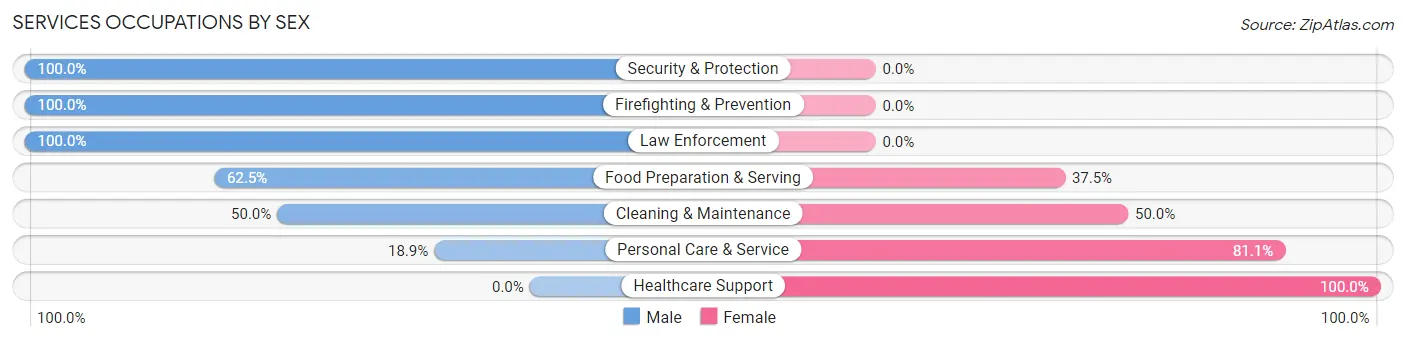
Services Occupations by Sex
Within the Services occupations in Lakeside City, the most male-oriented occupations are Security & Protection (100.0%), Firefighting & Prevention (100.0%), and Law Enforcement (100.0%), while the most female-oriented occupations are Healthcare Support (100.0%), Personal Care & Service (81.1%), and Cleaning & Maintenance (50.0%).
| Occupation | Male | Female |
| Healthcare Support | 0 (0.0%) | 1 (100.0%) |
| Security & Protection | 10 (100.0%) | 0 (0.0%) |
| Firefighting & Prevention | 5 (100.0%) | 0 (0.0%) |
| Law Enforcement | 5 (100.0%) | 0 (0.0%) |
| Food Preparation & Serving | 5 (62.5%) | 3 (37.5%) |
| Cleaning & Maintenance | 3 (50.0%) | 3 (50.0%) |
| Personal Care & Service | 7 (18.9%) | 30 (81.1%) |
| Total (Category) | 25 (40.3%) | 37 (59.7%) |
| Total (Overall) | 240 (51.0%) | 231 (49.0%) |
Sales and Office Occupations
The most common Sales and Office occupations in Lakeside City are Office & Administration (92 | 19.5%), and Sales & Related (41 | 8.7%).
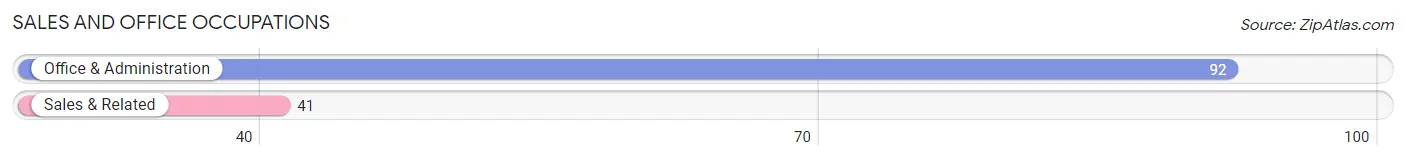
Sales and Office Occupations by Sex

| Occupation | Male | Female |
| Sales & Related | 28 (68.3%) | 13 (31.7%) |
| Office & Administration | 31 (33.7%) | 61 (66.3%) |
| Total (Category) | 59 (44.4%) | 74 (55.6%) |
| Total (Overall) | 240 (51.0%) | 231 (49.0%) |
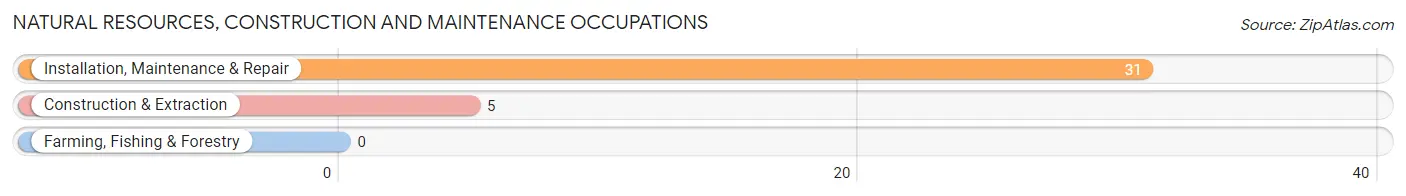
Natural Resources, Construction and Maintenance Occupations
The most common Natural Resources, Construction and Maintenance occupations in Lakeside City are Installation, Maintenance & Repair (31 | 6.6%), and Construction & Extraction (5 | 1.1%).
Natural Resources, Construction and Maintenance Occupations by Sex
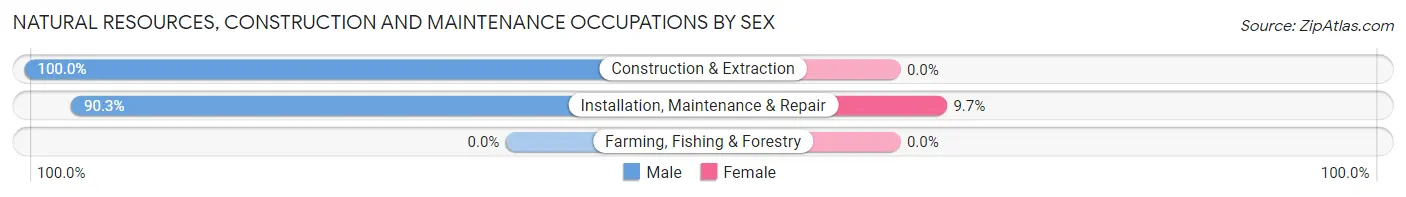
| Occupation | Male | Female |
| Farming, Fishing & Forestry | 0 (0.0%) | 0 (0.0%) |
| Construction & Extraction | 5 (100.0%) | 0 (0.0%) |
| Installation, Maintenance & Repair | 28 (90.3%) | 3 (9.7%) |
| Total (Category) | 33 (91.7%) | 3 (8.3%) |
| Total (Overall) | 240 (51.0%) | 231 (49.0%) |
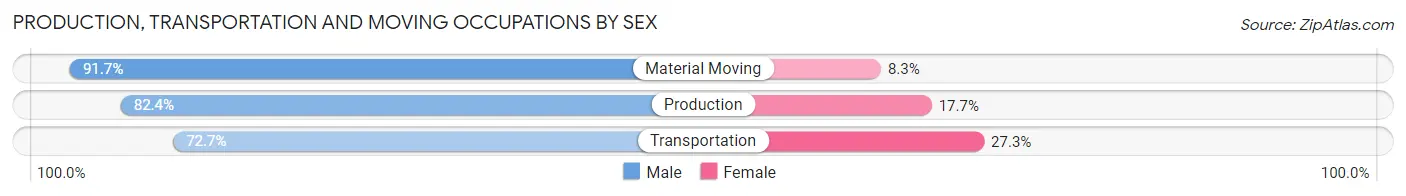
Production, Transportation and Moving Occupations
The most common Production, Transportation and Moving occupations in Lakeside City are Production (17 | 3.6%), Material Moving (12 | 2.5%), and Transportation (11 | 2.3%).
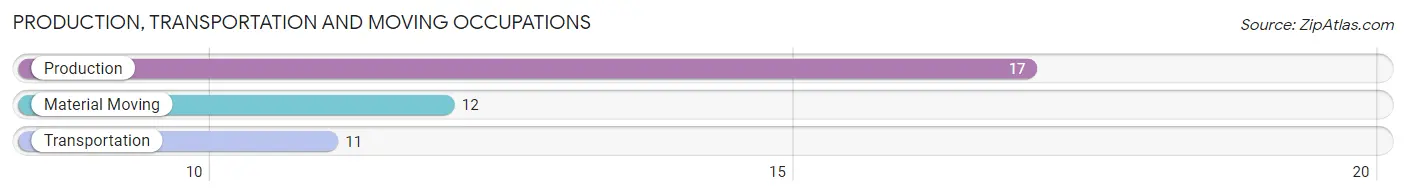
Production, Transportation and Moving Occupations by Sex
| Occupation | Male | Female |
| Production | 14 (82.4%) | 3 (17.6%) |
| Transportation | 8 (72.7%) | 3 (27.3%) |
| Material Moving | 11 (91.7%) | 1 (8.3%) |
| Total (Category) | 33 (82.5%) | 7 (17.5%) |
| Total (Overall) | 240 (51.0%) | 231 (49.0%) |
Employment Industries by Sex in Lakeside City
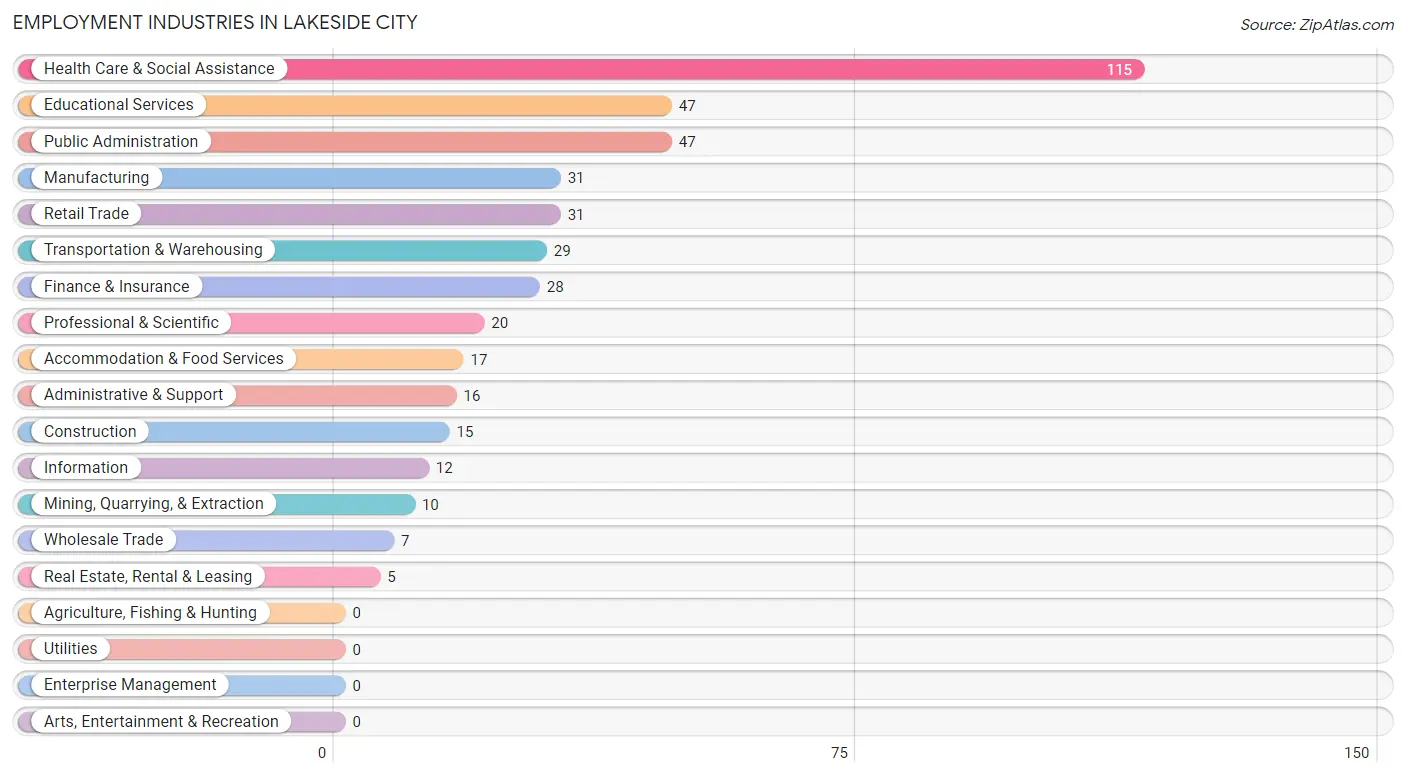
Employment Industries in Lakeside City
The major employment industries in Lakeside City include Health Care & Social Assistance (115 | 24.4%), Educational Services (47 | 10.0%), Public Administration (47 | 10.0%), Manufacturing (31 | 6.6%), and Retail Trade (31 | 6.6%).
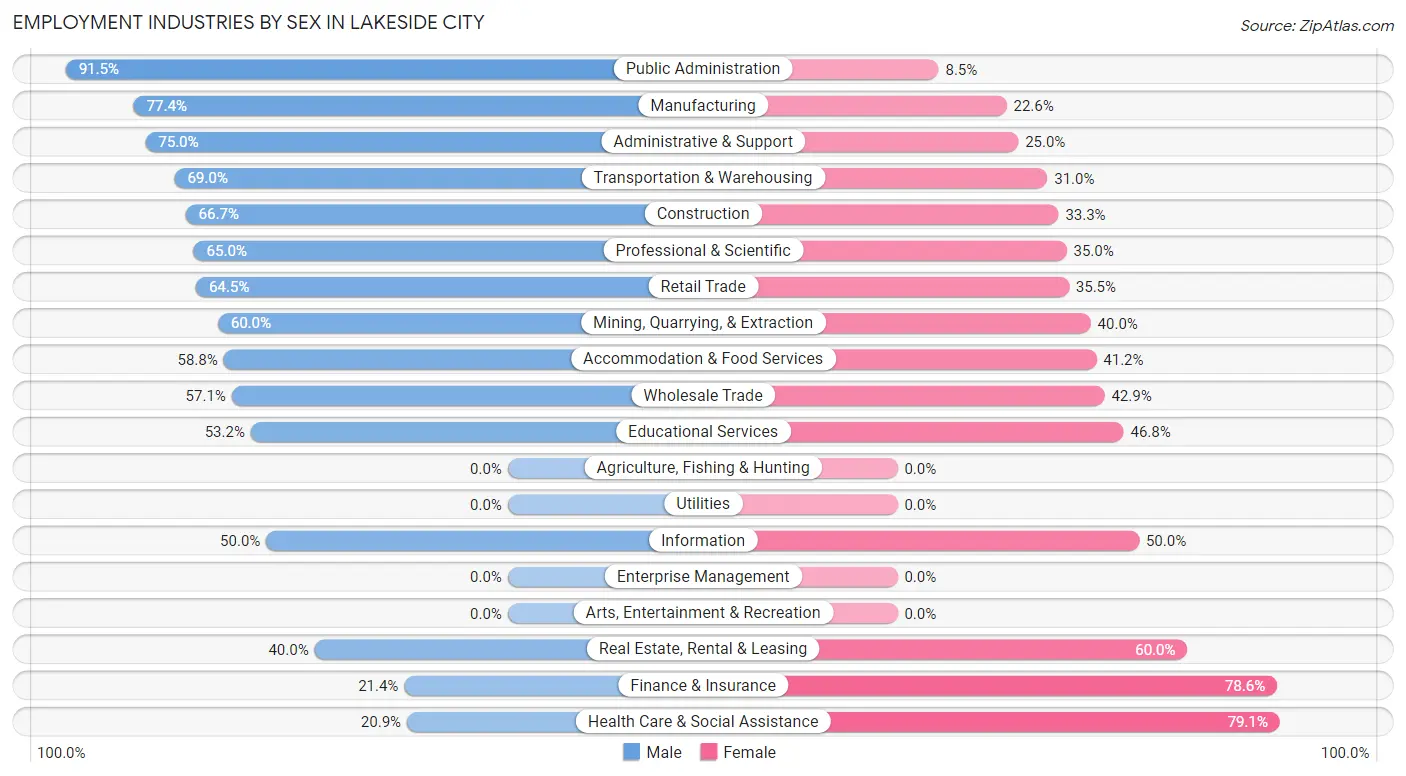
Employment Industries by Sex in Lakeside City
The Lakeside City industries that see more men than women are Public Administration (91.5%), Manufacturing (77.4%), and Administrative & Support (75.0%), whereas the industries that tend to have a higher number of women are Health Care & Social Assistance (79.1%), Finance & Insurance (78.6%), and Real Estate, Rental & Leasing (60.0%).
| Industry | Male | Female |
| Agriculture, Fishing & Hunting | 0 (0.0%) | 0 (0.0%) |
| Mining, Quarrying, & Extraction | 6 (60.0%) | 4 (40.0%) |
| Construction | 10 (66.7%) | 5 (33.3%) |
| Manufacturing | 24 (77.4%) | 7 (22.6%) |
| Wholesale Trade | 4 (57.1%) | 3 (42.9%) |
| Retail Trade | 20 (64.5%) | 11 (35.5%) |
| Transportation & Warehousing | 20 (69.0%) | 9 (31.0%) |
| Utilities | 0 (0.0%) | 0 (0.0%) |
| Information | 6 (50.0%) | 6 (50.0%) |
| Finance & Insurance | 6 (21.4%) | 22 (78.6%) |
| Real Estate, Rental & Leasing | 2 (40.0%) | 3 (60.0%) |
| Professional & Scientific | 13 (65.0%) | 7 (35.0%) |
| Enterprise Management | 0 (0.0%) | 0 (0.0%) |
| Administrative & Support | 12 (75.0%) | 4 (25.0%) |
| Educational Services | 25 (53.2%) | 22 (46.8%) |
| Health Care & Social Assistance | 24 (20.9%) | 91 (79.1%) |
| Arts, Entertainment & Recreation | 0 (0.0%) | 0 (0.0%) |
| Accommodation & Food Services | 10 (58.8%) | 7 (41.2%) |
| Public Administration | 43 (91.5%) | 4 (8.5%) |
| Total | 240 (51.0%) | 231 (49.0%) |
Education in Lakeside City
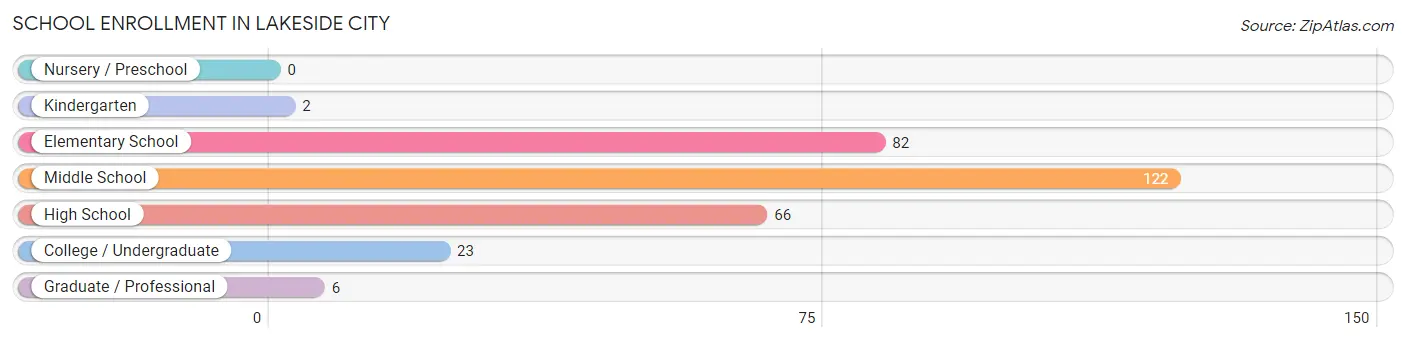
School Enrollment in Lakeside City
The most common levels of schooling among the 301 students in Lakeside City are middle school (122 | 40.5%), elementary school (82 | 27.2%), and high school (66 | 21.9%).
| School Level | # Students | % Students |
| Nursery / Preschool | 0 | 0.0% |
| Kindergarten | 2 | 0.7% |
| Elementary School | 82 | 27.2% |
| Middle School | 122 | 40.5% |
| High School | 66 | 21.9% |
| College / Undergraduate | 23 | 7.6% |
| Graduate / Professional | 6 | 2.0% |
| Total | 301 | 100.0% |
School Enrollment by Age by Funding Source in Lakeside City
Out of a total of 301 students who are enrolled in schools in Lakeside City, 24 (8.0%) attend a private institution, while the remaining 277 (92.0%) are enrolled in public schools. The age group of 35 years and over has the highest likelihood of being enrolled in private schools, with 7 (100.0% in the age bracket) enrolled. Conversely, the age group of 5 to 9 year old has the lowest likelihood of being enrolled in a private school, with 44 (100.0% in the age bracket) attending a public institution.
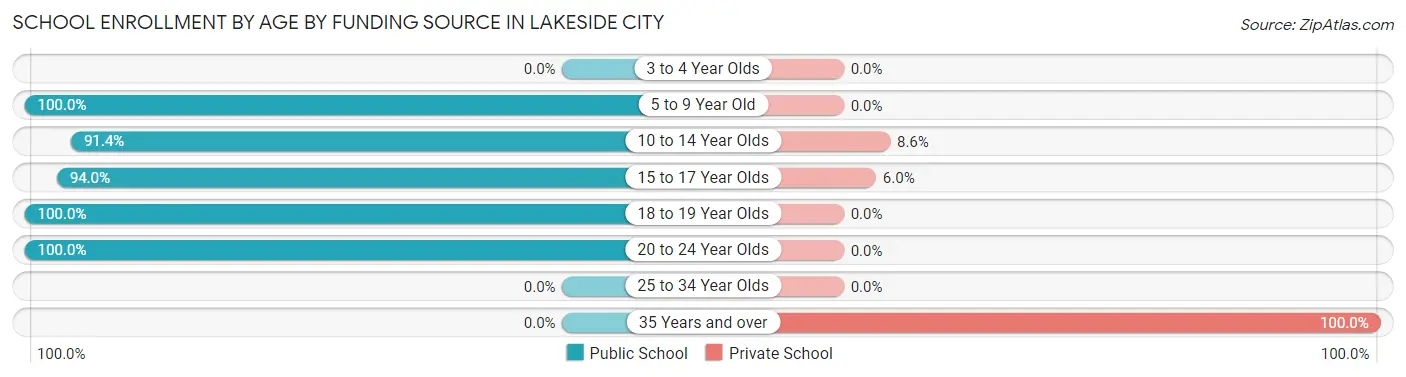
| Age Bracket | Public School | Private School |
| 3 to 4 Year Olds | 0 (0.0%) | 0 (0.0%) |
| 5 to 9 Year Old | 44 (100.0%) | 0 (0.0%) |
| 10 to 14 Year Olds | 148 (91.4%) | 14 (8.6%) |
| 15 to 17 Year Olds | 47 (94.0%) | 3 (6.0%) |
| 18 to 19 Year Olds | 19 (100.0%) | 0 (0.0%) |
| 20 to 24 Year Olds | 19 (100.0%) | 0 (0.0%) |
| 25 to 34 Year Olds | 0 (0.0%) | 0 (0.0%) |
| 35 Years and over | 0 (0.0%) | 7 (100.0%) |
| Total | 277 (92.0%) | 24 (8.0%) |
Educational Attainment by Field of Study in Lakeside City
Arts & humanities (53 | 20.2%), science & technology (52 | 19.9%), education (38 | 14.5%), business (34 | 13.0%), and engineering (16 | 6.1%) are the most common fields of study among 262 individuals in Lakeside City who have obtained a bachelor's degree or higher.
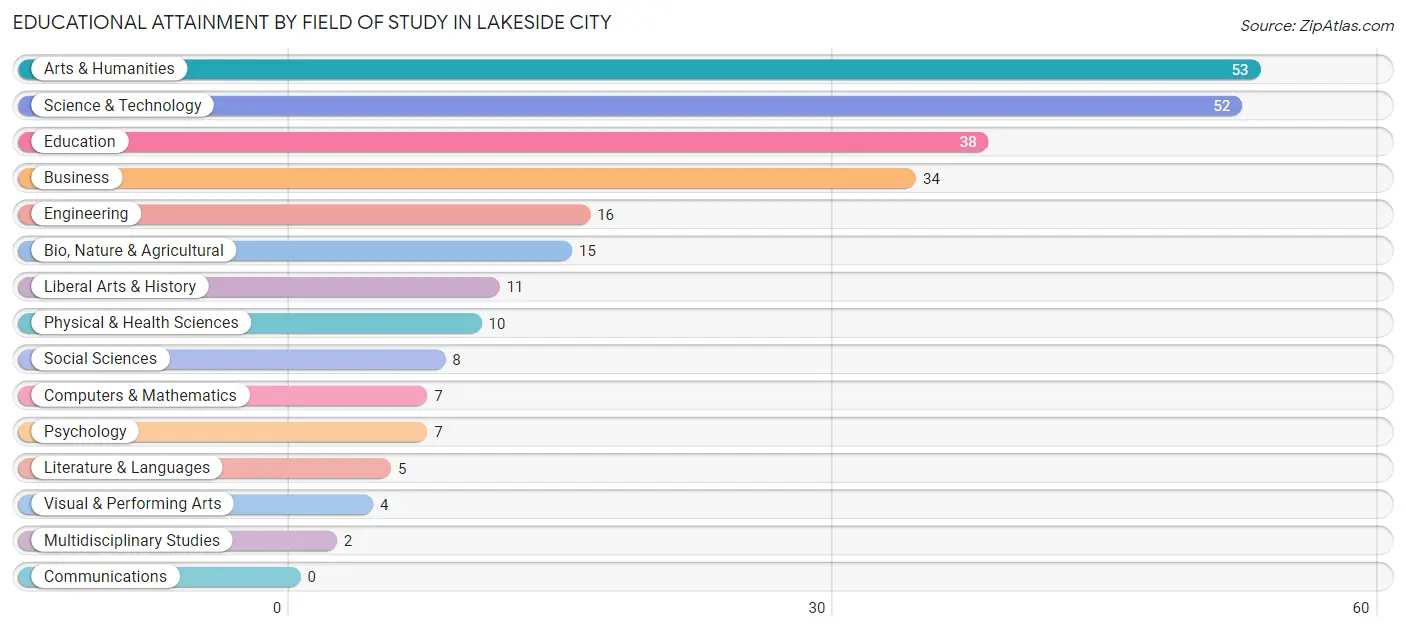
| Field of Study | # Graduates | % Graduates |
| Computers & Mathematics | 7 | 2.7% |
| Bio, Nature & Agricultural | 15 | 5.7% |
| Physical & Health Sciences | 10 | 3.8% |
| Psychology | 7 | 2.7% |
| Social Sciences | 8 | 3.0% |
| Engineering | 16 | 6.1% |
| Multidisciplinary Studies | 2 | 0.8% |
| Science & Technology | 52 | 19.9% |
| Business | 34 | 13.0% |
| Education | 38 | 14.5% |
| Literature & Languages | 5 | 1.9% |
| Liberal Arts & History | 11 | 4.2% |
| Visual & Performing Arts | 4 | 1.5% |
| Communications | 0 | 0.0% |
| Arts & Humanities | 53 | 20.2% |
| Total | 262 | 100.0% |
Transportation & Commute in Lakeside City
Vehicle Availability by Sex in Lakeside City
The most prevalent vehicle ownership categories in Lakeside City are males with 3 vehicles (107, accounting for 43.5%) and females with 3 vehicles (77, making up 48.4%).
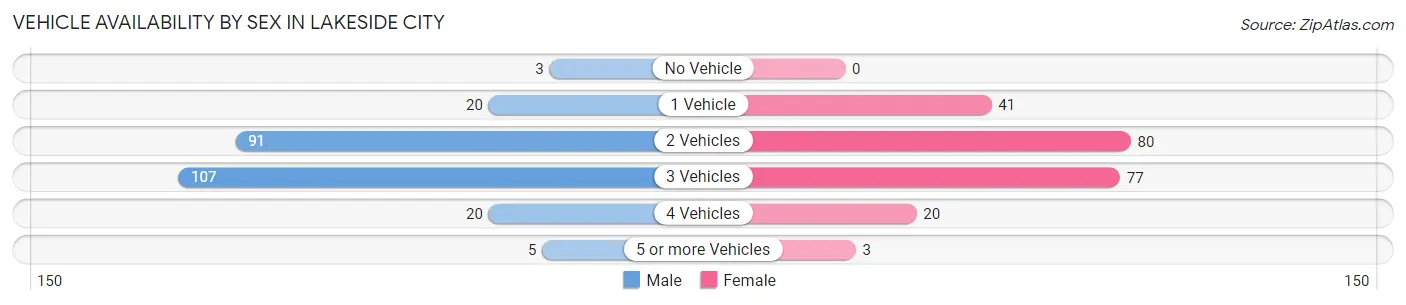
| Vehicles Available | Male | Female |
| No Vehicle | 3 (1.2%) | 0 (0.0%) |
| 1 Vehicle | 20 (8.1%) | 41 (18.5%) |
| 2 Vehicles | 91 (37.0%) | 80 (36.2%) |
| 3 Vehicles | 107 (43.5%) | 77 (34.8%) |
| 4 Vehicles | 20 (8.1%) | 20 (9.0%) |
| 5 or more Vehicles | 5 (2.0%) | 3 (1.4%) |
| Total | 246 (100.0%) | 221 (100.0%) |
Commute Time in Lakeside City
The most frequently occuring commute durations in Lakeside City are 15 to 19 minutes (146 commuters, 34.0%), 10 to 14 minutes (109 commuters, 25.4%), and 20 to 24 minutes (51 commuters, 11.9%).
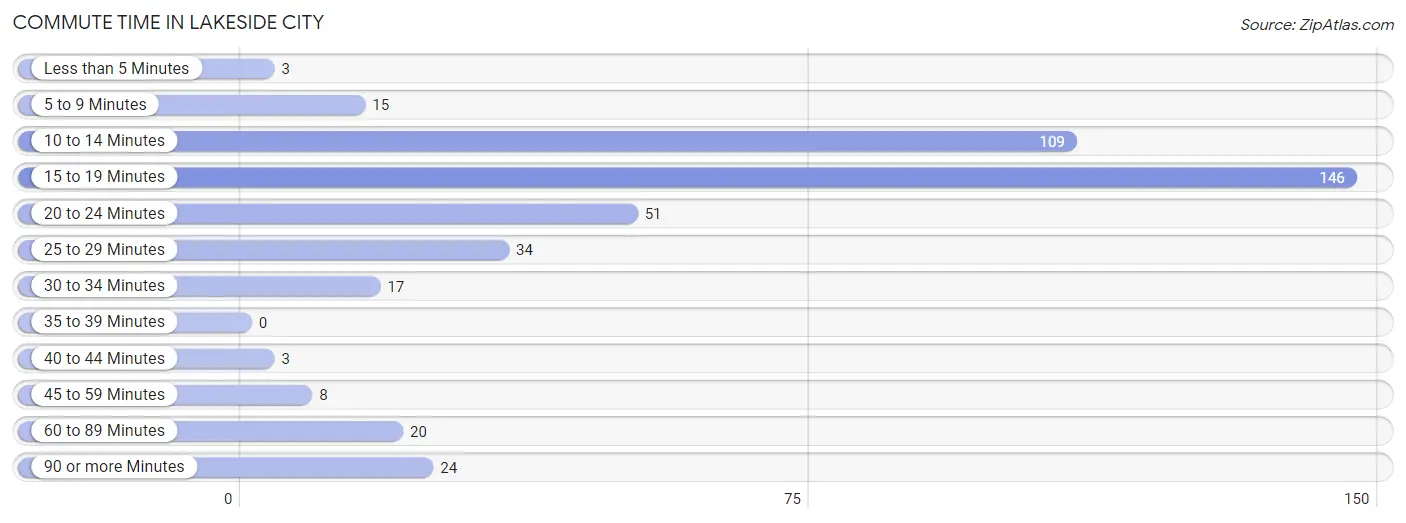
| Commute Time | # Commuters | % Commuters |
| Less than 5 Minutes | 3 | 0.7% |
| 5 to 9 Minutes | 15 | 3.5% |
| 10 to 14 Minutes | 109 | 25.4% |
| 15 to 19 Minutes | 146 | 34.0% |
| 20 to 24 Minutes | 51 | 11.9% |
| 25 to 29 Minutes | 34 | 7.9% |
| 30 to 34 Minutes | 17 | 4.0% |
| 35 to 39 Minutes | 0 | 0.0% |
| 40 to 44 Minutes | 3 | 0.7% |
| 45 to 59 Minutes | 8 | 1.9% |
| 60 to 89 Minutes | 20 | 4.6% |
| 90 or more Minutes | 24 | 5.6% |
Commute Time by Sex in Lakeside City
The most common commute times in Lakeside City are 15 to 19 minutes (70 commuters, 29.4%) for males and 15 to 19 minutes (76 commuters, 39.6%) for females.
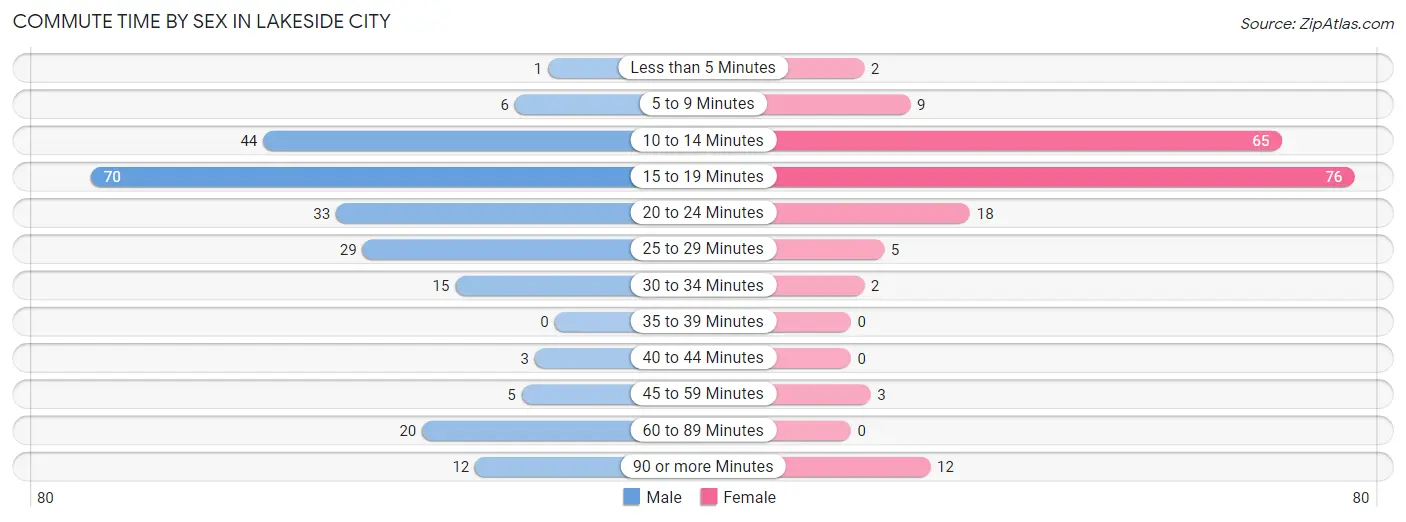
| Commute Time | Male | Female |
| Less than 5 Minutes | 1 (0.4%) | 2 (1.0%) |
| 5 to 9 Minutes | 6 (2.5%) | 9 (4.7%) |
| 10 to 14 Minutes | 44 (18.5%) | 65 (33.9%) |
| 15 to 19 Minutes | 70 (29.4%) | 76 (39.6%) |
| 20 to 24 Minutes | 33 (13.9%) | 18 (9.4%) |
| 25 to 29 Minutes | 29 (12.2%) | 5 (2.6%) |
| 30 to 34 Minutes | 15 (6.3%) | 2 (1.0%) |
| 35 to 39 Minutes | 0 (0.0%) | 0 (0.0%) |
| 40 to 44 Minutes | 3 (1.3%) | 0 (0.0%) |
| 45 to 59 Minutes | 5 (2.1%) | 3 (1.6%) |
| 60 to 89 Minutes | 20 (8.4%) | 0 (0.0%) |
| 90 or more Minutes | 12 (5.0%) | 12 (6.2%) |
Time of Departure to Work by Sex in Lakeside City
The most frequent times of departure to work in Lakeside City are 6:00 AM to 6:29 AM (35, 14.7%) for males and 7:30 AM to 7:59 AM (46, 24.0%) for females.
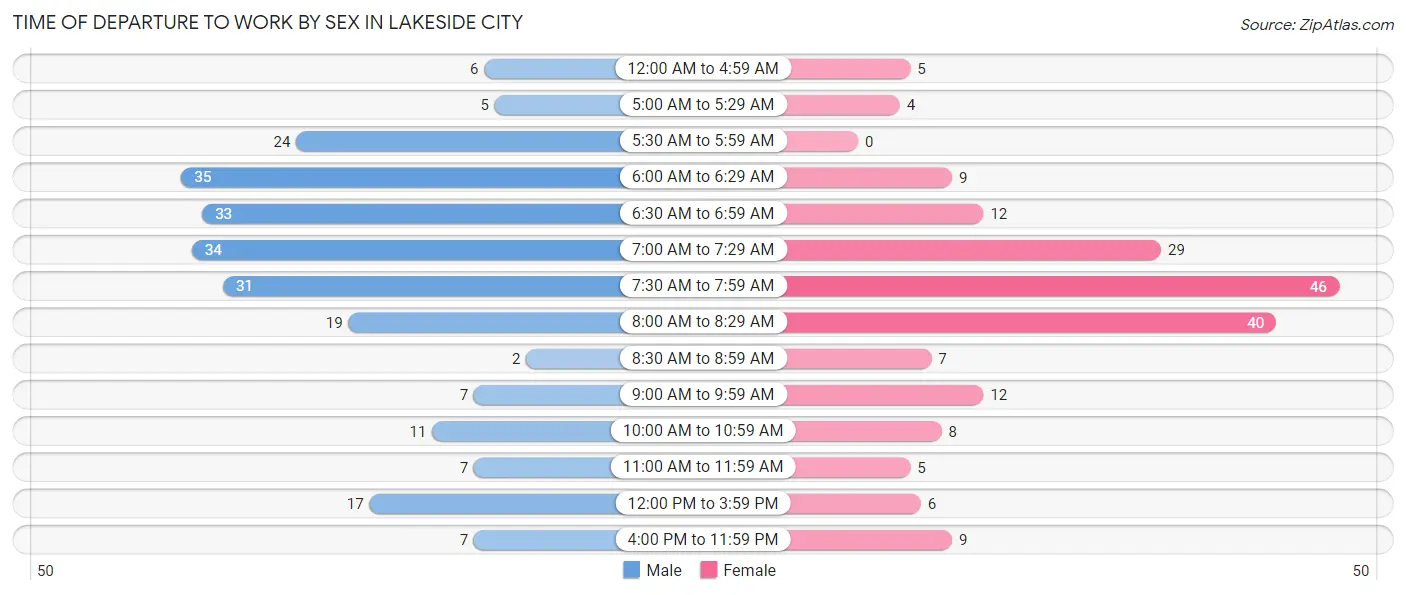
| Time of Departure | Male | Female |
| 12:00 AM to 4:59 AM | 6 (2.5%) | 5 (2.6%) |
| 5:00 AM to 5:29 AM | 5 (2.1%) | 4 (2.1%) |
| 5:30 AM to 5:59 AM | 24 (10.1%) | 0 (0.0%) |
| 6:00 AM to 6:29 AM | 35 (14.7%) | 9 (4.7%) |
| 6:30 AM to 6:59 AM | 33 (13.9%) | 12 (6.2%) |
| 7:00 AM to 7:29 AM | 34 (14.3%) | 29 (15.1%) |
| 7:30 AM to 7:59 AM | 31 (13.0%) | 46 (24.0%) |
| 8:00 AM to 8:29 AM | 19 (8.0%) | 40 (20.8%) |
| 8:30 AM to 8:59 AM | 2 (0.8%) | 7 (3.6%) |
| 9:00 AM to 9:59 AM | 7 (2.9%) | 12 (6.2%) |
| 10:00 AM to 10:59 AM | 11 (4.6%) | 8 (4.2%) |
| 11:00 AM to 11:59 AM | 7 (2.9%) | 5 (2.6%) |
| 12:00 PM to 3:59 PM | 17 (7.1%) | 6 (3.1%) |
| 4:00 PM to 11:59 PM | 7 (2.9%) | 9 (4.7%) |
| Total | 238 (100.0%) | 192 (100.0%) |
Housing Occupancy in Lakeside City
Occupancy by Ownership in Lakeside City
Of the total 364 dwellings in Lakeside City, owner-occupied units account for 326 (89.6%), while renter-occupied units make up 38 (10.4%).
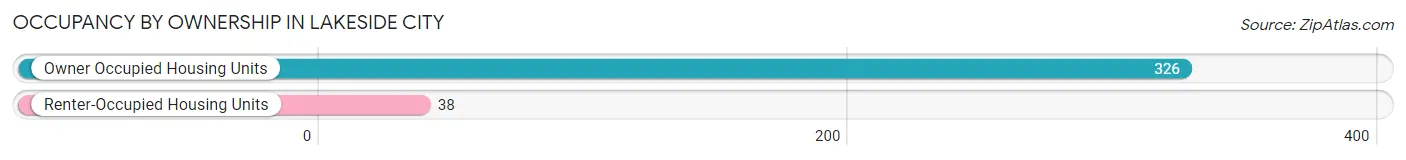
| Occupancy | # Housing Units | % Housing Units |
| Owner Occupied Housing Units | 326 | 89.6% |
| Renter-Occupied Housing Units | 38 | 10.4% |
| Total Occupied Housing Units | 364 | 100.0% |
Occupancy by Household Size in Lakeside City
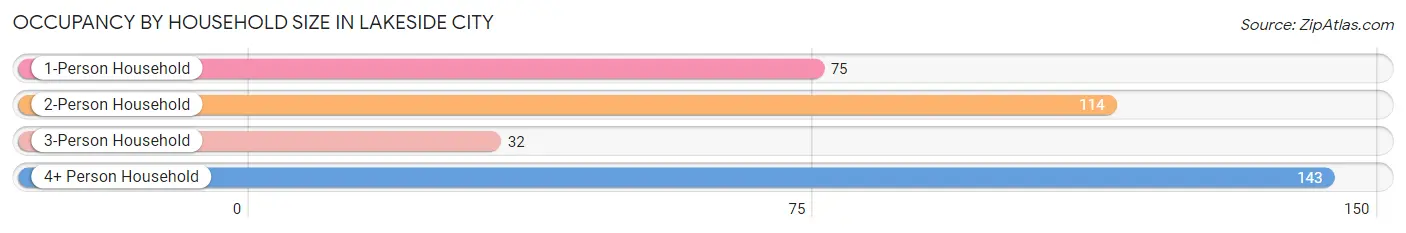
| Household Size | # Housing Units | % Housing Units |
| 1-Person Household | 75 | 20.6% |
| 2-Person Household | 114 | 31.3% |
| 3-Person Household | 32 | 8.8% |
| 4+ Person Household | 143 | 39.3% |
| Total Housing Units | 364 | 100.0% |
Occupancy by Ownership by Household Size in Lakeside City
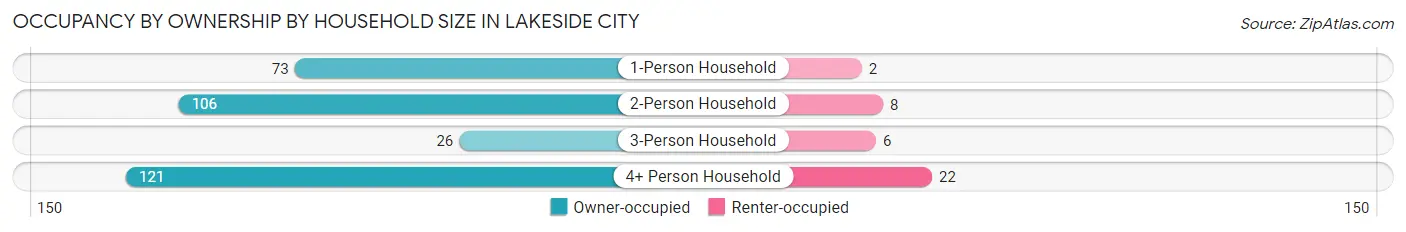
| Household Size | Owner-occupied | Renter-occupied |
| 1-Person Household | 73 (97.3%) | 2 (2.7%) |
| 2-Person Household | 106 (93.0%) | 8 (7.0%) |
| 3-Person Household | 26 (81.2%) | 6 (18.8%) |
| 4+ Person Household | 121 (84.6%) | 22 (15.4%) |
| Total Housing Units | 326 (89.6%) | 38 (10.4%) |
Occupancy by Educational Attainment in Lakeside City
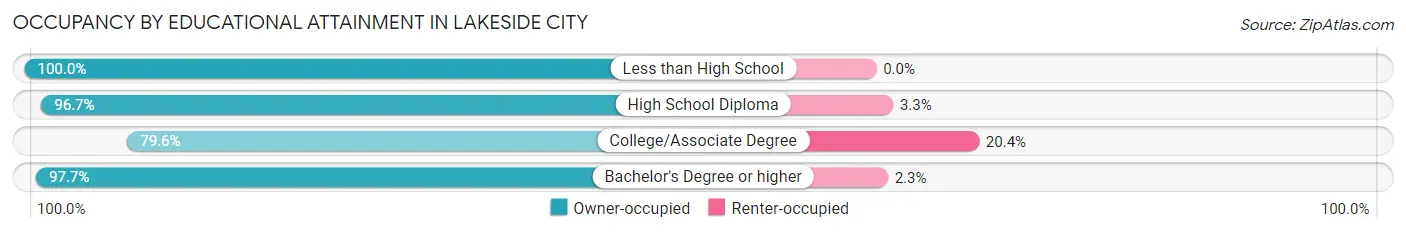
| Household Size | Owner-occupied | Renter-occupied |
| Less than High School | 11 (100.0%) | 0 (0.0%) |
| High School Diploma | 58 (96.7%) | 2 (3.3%) |
| College/Associate Degree | 129 (79.6%) | 33 (20.4%) |
| Bachelor's Degree or higher | 128 (97.7%) | 3 (2.3%) |
Occupancy by Age of Householder in Lakeside City
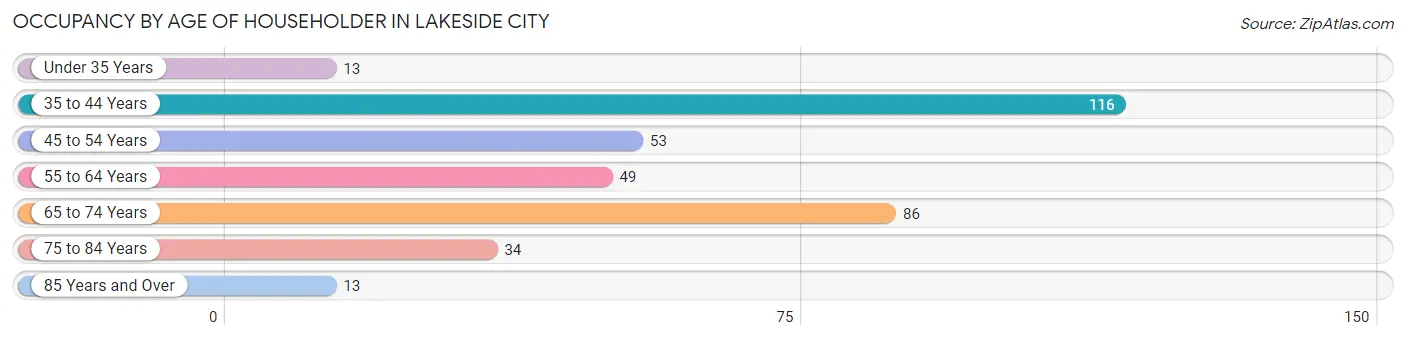
| Age Bracket | # Households | % Households |
| Under 35 Years | 13 | 3.6% |
| 35 to 44 Years | 116 | 31.9% |
| 45 to 54 Years | 53 | 14.6% |
| 55 to 64 Years | 49 | 13.5% |
| 65 to 74 Years | 86 | 23.6% |
| 75 to 84 Years | 34 | 9.3% |
| 85 Years and Over | 13 | 3.6% |
| Total | 364 | 100.0% |
Housing Finances in Lakeside City
Median Income by Occupancy in Lakeside City

| Occupancy Type | # Households | Median Income |
| Owner-Occupied | 326 (89.6%) | $107,250 |
| Renter-Occupied | 38 (10.4%) | $87,500 |
| Average | 364 (100.0%) | $99,265 |
Occupancy by Householder Income Bracket in Lakeside City
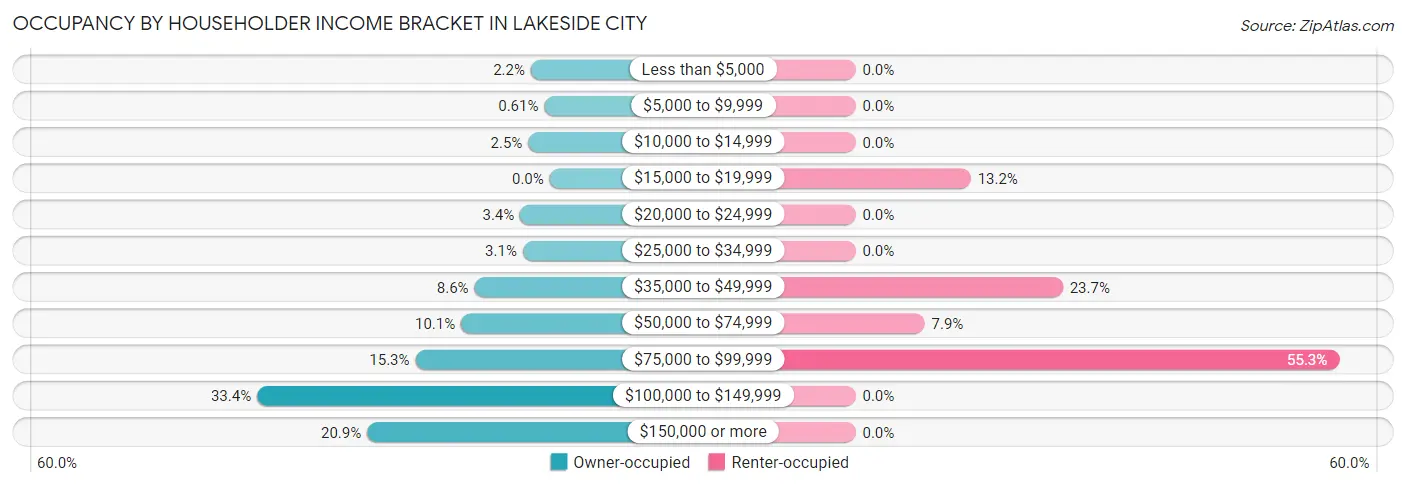
| Income Bracket | Owner-occupied | Renter-occupied |
| Less than $5,000 | 7 (2.1%) | 0 (0.0%) |
| $5,000 to $9,999 | 2 (0.6%) | 0 (0.0%) |
| $10,000 to $14,999 | 8 (2.5%) | 0 (0.0%) |
| $15,000 to $19,999 | 0 (0.0%) | 5 (13.2%) |
| $20,000 to $24,999 | 11 (3.4%) | 0 (0.0%) |
| $25,000 to $34,999 | 10 (3.1%) | 0 (0.0%) |
| $35,000 to $49,999 | 28 (8.6%) | 9 (23.7%) |
| $50,000 to $74,999 | 33 (10.1%) | 3 (7.9%) |
| $75,000 to $99,999 | 50 (15.3%) | 21 (55.3%) |
| $100,000 to $149,999 | 109 (33.4%) | 0 (0.0%) |
| $150,000 or more | 68 (20.9%) | 0 (0.0%) |
| Total | 326 (100.0%) | 38 (100.0%) |
Monthly Housing Cost Tiers in Lakeside City
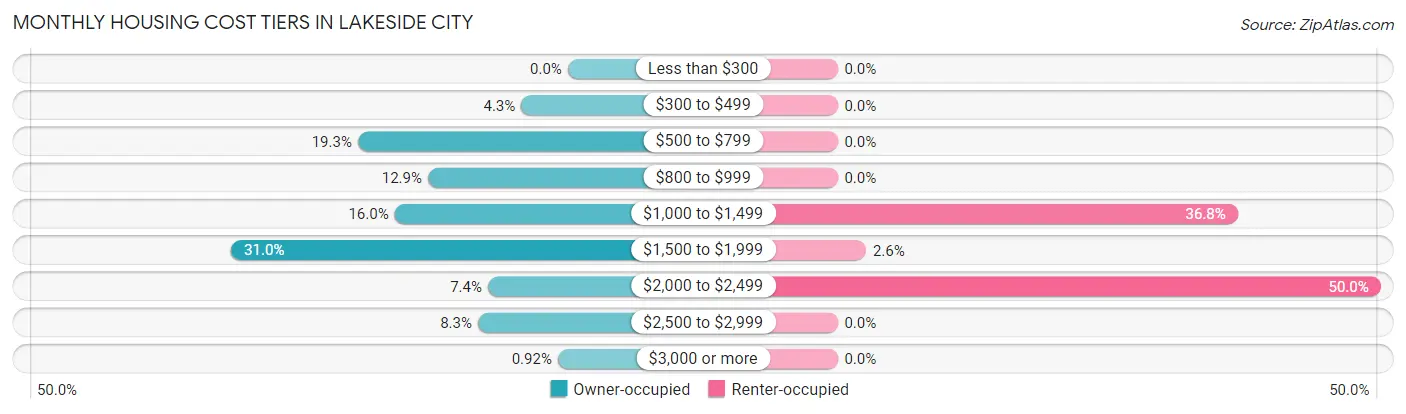
| Monthly Cost | Owner-occupied | Renter-occupied |
| Less than $300 | 0 (0.0%) | 0 (0.0%) |
| $300 to $499 | 14 (4.3%) | 0 (0.0%) |
| $500 to $799 | 63 (19.3%) | 0 (0.0%) |
| $800 to $999 | 42 (12.9%) | 0 (0.0%) |
| $1,000 to $1,499 | 52 (16.0%) | 14 (36.8%) |
| $1,500 to $1,999 | 101 (31.0%) | 1 (2.6%) |
| $2,000 to $2,499 | 24 (7.4%) | 19 (50.0%) |
| $2,500 to $2,999 | 27 (8.3%) | 0 (0.0%) |
| $3,000 or more | 3 (0.9%) | 0 (0.0%) |
| Total | 326 (100.0%) | 38 (100.0%) |
Physical Housing Characteristics in Lakeside City
Housing Structures in Lakeside City
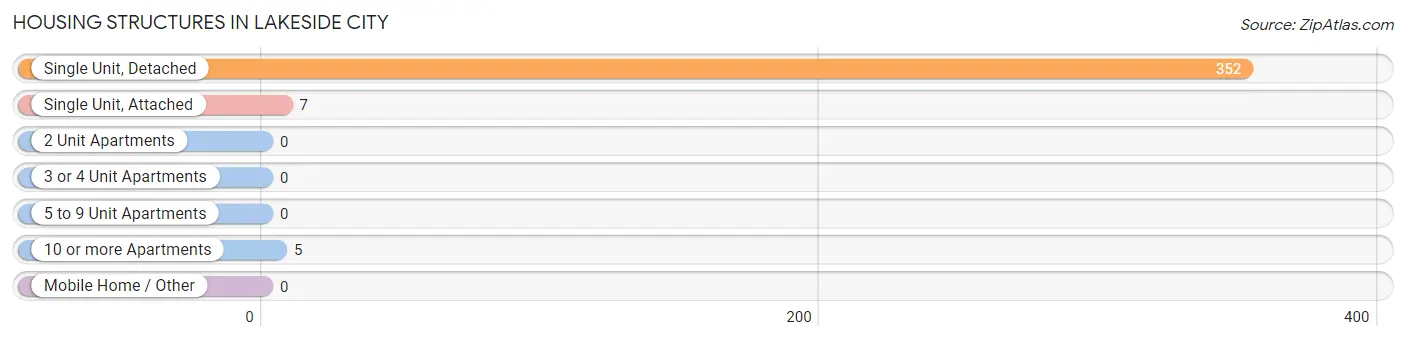
| Structure Type | # Housing Units | % Housing Units |
| Single Unit, Detached | 352 | 96.7% |
| Single Unit, Attached | 7 | 1.9% |
| 2 Unit Apartments | 0 | 0.0% |
| 3 or 4 Unit Apartments | 0 | 0.0% |
| 5 to 9 Unit Apartments | 0 | 0.0% |
| 10 or more Apartments | 5 | 1.4% |
| Mobile Home / Other | 0 | 0.0% |
| Total | 364 | 100.0% |
Housing Structures by Occupancy in Lakeside City
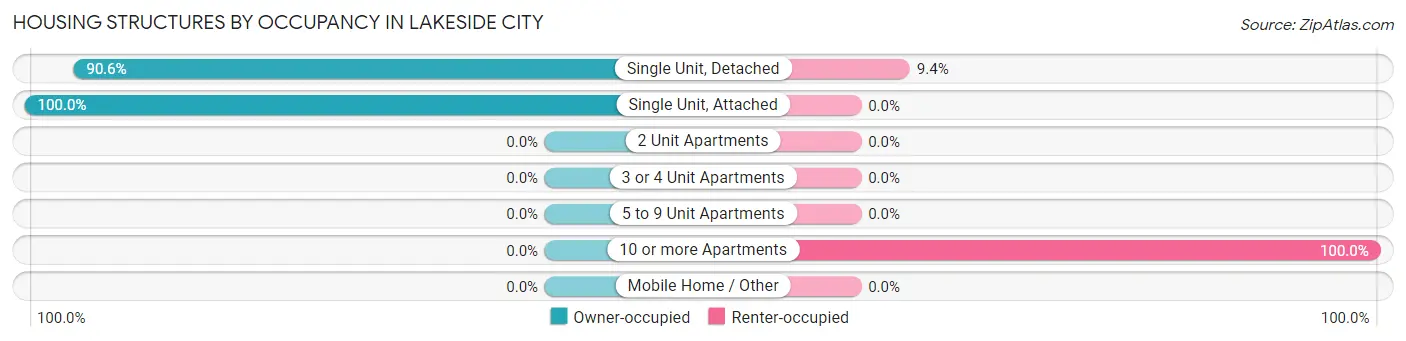
| Structure Type | Owner-occupied | Renter-occupied |
| Single Unit, Detached | 319 (90.6%) | 33 (9.4%) |
| Single Unit, Attached | 7 (100.0%) | 0 (0.0%) |
| 2 Unit Apartments | 0 (0.0%) | 0 (0.0%) |
| 3 or 4 Unit Apartments | 0 (0.0%) | 0 (0.0%) |
| 5 to 9 Unit Apartments | 0 (0.0%) | 0 (0.0%) |
| 10 or more Apartments | 0 (0.0%) | 5 (100.0%) |
| Mobile Home / Other | 0 (0.0%) | 0 (0.0%) |
| Total | 326 (89.6%) | 38 (10.4%) |
Housing Structures by Number of Rooms in Lakeside City
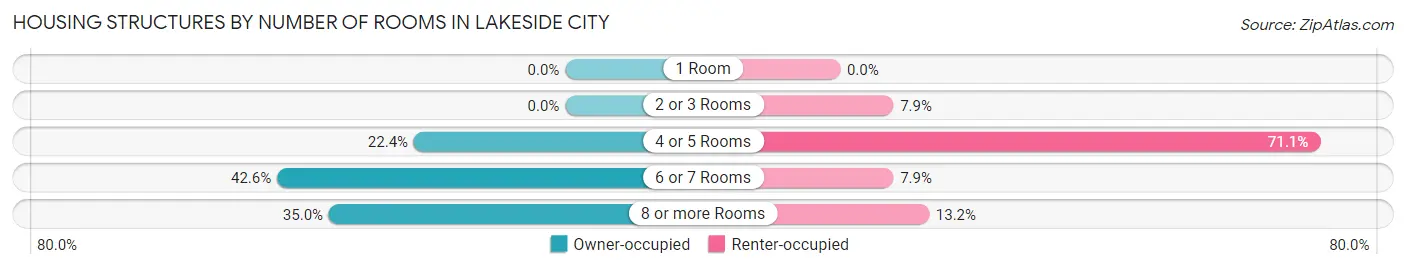
| Number of Rooms | Owner-occupied | Renter-occupied |
| 1 Room | 0 (0.0%) | 0 (0.0%) |
| 2 or 3 Rooms | 0 (0.0%) | 3 (7.9%) |
| 4 or 5 Rooms | 73 (22.4%) | 27 (71.1%) |
| 6 or 7 Rooms | 139 (42.6%) | 3 (7.9%) |
| 8 or more Rooms | 114 (35.0%) | 5 (13.2%) |
| Total | 326 (100.0%) | 38 (100.0%) |
Housing Structure by Heating Type in Lakeside City
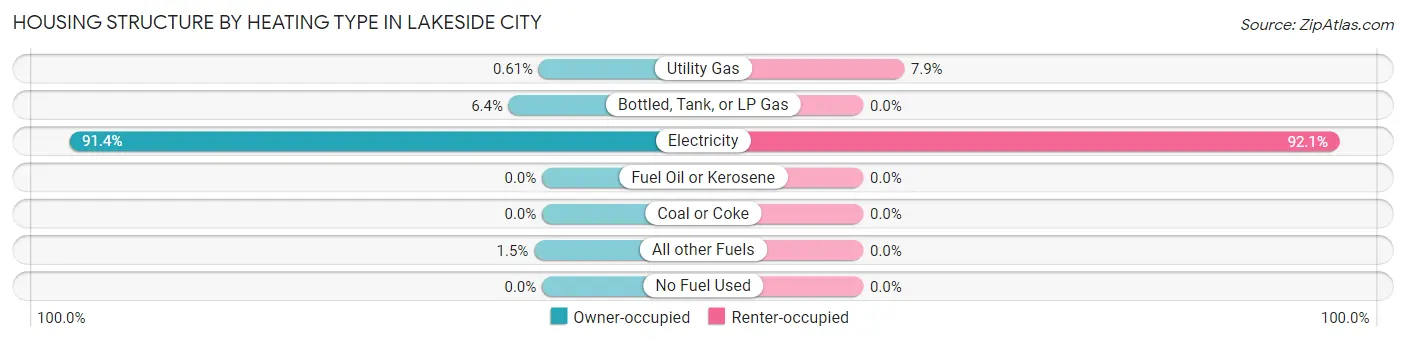
| Heating Type | Owner-occupied | Renter-occupied |
| Utility Gas | 2 (0.6%) | 3 (7.9%) |
| Bottled, Tank, or LP Gas | 21 (6.4%) | 0 (0.0%) |
| Electricity | 298 (91.4%) | 35 (92.1%) |
| Fuel Oil or Kerosene | 0 (0.0%) | 0 (0.0%) |
| Coal or Coke | 0 (0.0%) | 0 (0.0%) |
| All other Fuels | 5 (1.5%) | 0 (0.0%) |
| No Fuel Used | 0 (0.0%) | 0 (0.0%) |
| Total | 326 (100.0%) | 38 (100.0%) |
Household Vehicle Usage in Lakeside City
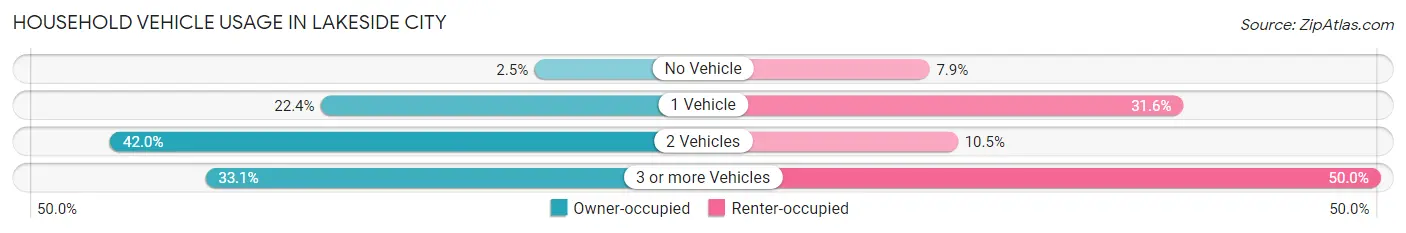
| Vehicles per Household | Owner-occupied | Renter-occupied |
| No Vehicle | 8 (2.5%) | 3 (7.9%) |
| 1 Vehicle | 73 (22.4%) | 12 (31.6%) |
| 2 Vehicles | 137 (42.0%) | 4 (10.5%) |
| 3 or more Vehicles | 108 (33.1%) | 19 (50.0%) |
| Total | 326 (100.0%) | 38 (100.0%) |
Real Estate & Mortgages in Lakeside City
Real Estate and Mortgage Overview in Lakeside City
| Characteristic | Without Mortgage | With Mortgage |
| Housing Units | 138 | 188 |
| Median Property Value | $193,800 | $239,500 |
| Median Household Income | $98,750 | $37 |
| Monthly Housing Costs | $775 | $3 |
| Real Estate Taxes | $3,406 | $5 |
Property Value by Mortgage Status in Lakeside City
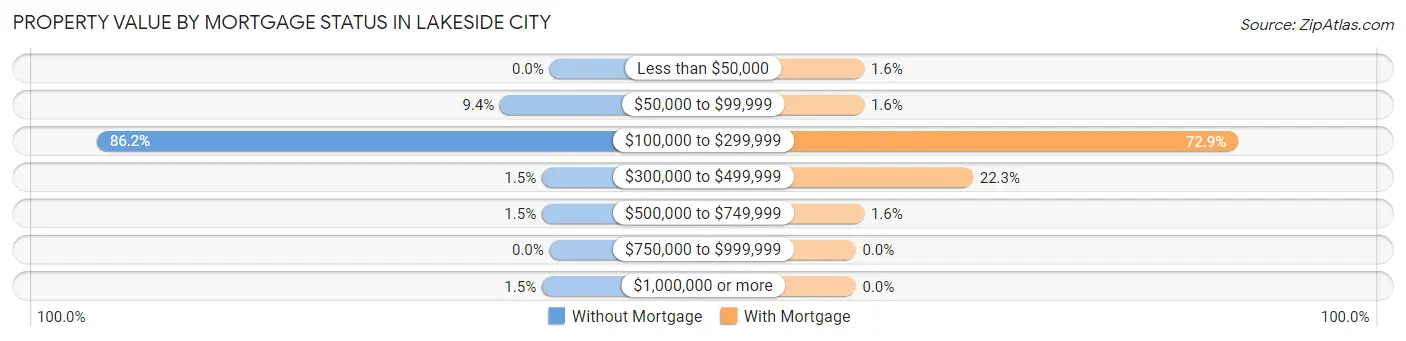
| Property Value | Without Mortgage | With Mortgage |
| Less than $50,000 | 0 (0.0%) | 3 (1.6%) |
| $50,000 to $99,999 | 13 (9.4%) | 3 (1.6%) |
| $100,000 to $299,999 | 119 (86.2%) | 137 (72.9%) |
| $300,000 to $499,999 | 2 (1.5%) | 42 (22.3%) |
| $500,000 to $749,999 | 2 (1.5%) | 3 (1.6%) |
| $750,000 to $999,999 | 0 (0.0%) | 0 (0.0%) |
| $1,000,000 or more | 2 (1.5%) | 0 (0.0%) |
| Total | 138 (100.0%) | 188 (100.0%) |
Household Income by Mortgage Status in Lakeside City
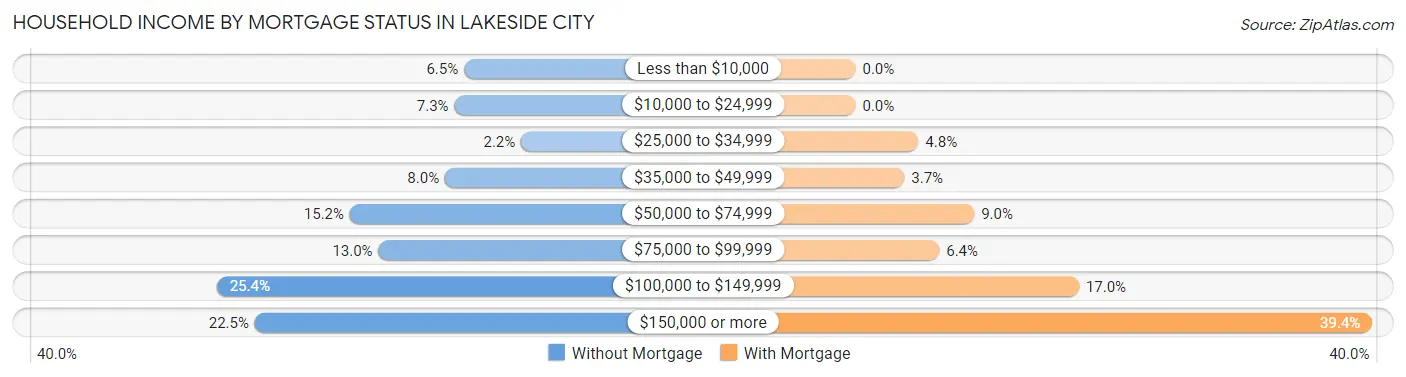
| Household Income | Without Mortgage | With Mortgage |
| Less than $10,000 | 9 (6.5%) | 0 (0.0%) |
| $10,000 to $24,999 | 10 (7.2%) | 0 (0.0%) |
| $25,000 to $34,999 | 3 (2.2%) | 9 (4.8%) |
| $35,000 to $49,999 | 11 (8.0%) | 7 (3.7%) |
| $50,000 to $74,999 | 21 (15.2%) | 17 (9.0%) |
| $75,000 to $99,999 | 18 (13.0%) | 12 (6.4%) |
| $100,000 to $149,999 | 35 (25.4%) | 32 (17.0%) |
| $150,000 or more | 31 (22.5%) | 74 (39.4%) |
| Total | 138 (100.0%) | 188 (100.0%) |
Property Value to Household Income Ratio in Lakeside City
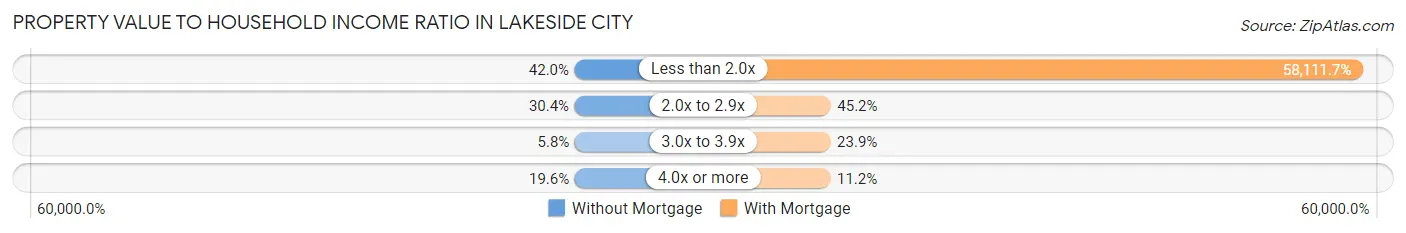
| Value-to-Income Ratio | Without Mortgage | With Mortgage |
| Less than 2.0x | 58 (42.0%) | 109,250 (58,111.7%) |
| 2.0x to 2.9x | 42 (30.4%) | 85 (45.2%) |
| 3.0x to 3.9x | 8 (5.8%) | 45 (23.9%) |
| 4.0x or more | 27 (19.6%) | 21 (11.2%) |
| Total | 138 (100.0%) | 188 (100.0%) |
Real Estate Taxes by Mortgage Status in Lakeside City

| Property Taxes | Without Mortgage | With Mortgage |
| Less than $800 | 2 (1.5%) | 0 (0.0%) |
| $800 to $1,499 | 14 (10.1%) | 3 (1.6%) |
| $800 to $1,499 | 122 (88.4%) | 0 (0.0%) |
| Total | 138 (100.0%) | 188 (100.0%) |
Health & Disability in Lakeside City
Health Insurance Coverage by Age in Lakeside City
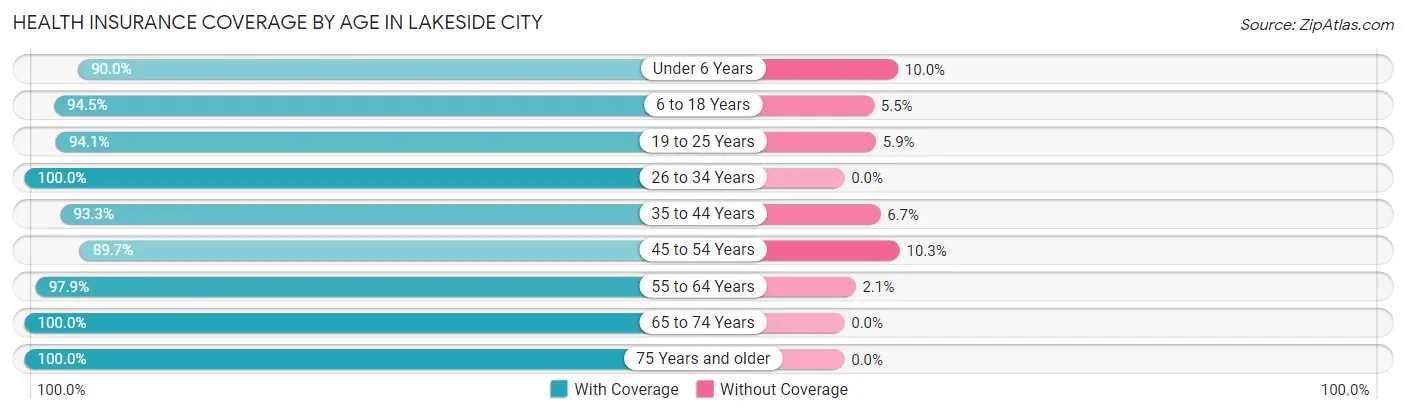
| Age Bracket | With Coverage | Without Coverage |
| Under 6 Years | 90 (90.0%) | 10 (10.0%) |
| 6 to 18 Years | 257 (94.5%) | 15 (5.5%) |
| 19 to 25 Years | 32 (94.1%) | 2 (5.9%) |
| 26 to 34 Years | 70 (100.0%) | 0 (0.0%) |
| 35 to 44 Years | 195 (93.3%) | 14 (6.7%) |
| 45 to 54 Years | 87 (89.7%) | 10 (10.3%) |
| 55 to 64 Years | 94 (97.9%) | 2 (2.1%) |
| 65 to 74 Years | 146 (100.0%) | 0 (0.0%) |
| 75 Years and older | 61 (100.0%) | 0 (0.0%) |
| Total | 1,032 (95.1%) | 53 (4.9%) |
Health Insurance Coverage by Citizenship Status in Lakeside City
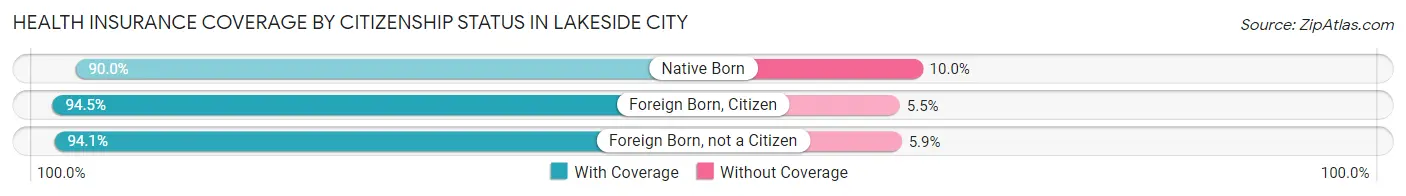
| Citizenship Status | With Coverage | Without Coverage |
| Native Born | 90 (90.0%) | 10 (10.0%) |
| Foreign Born, Citizen | 257 (94.5%) | 15 (5.5%) |
| Foreign Born, not a Citizen | 32 (94.1%) | 2 (5.9%) |
Health Insurance Coverage by Household Income in Lakeside City
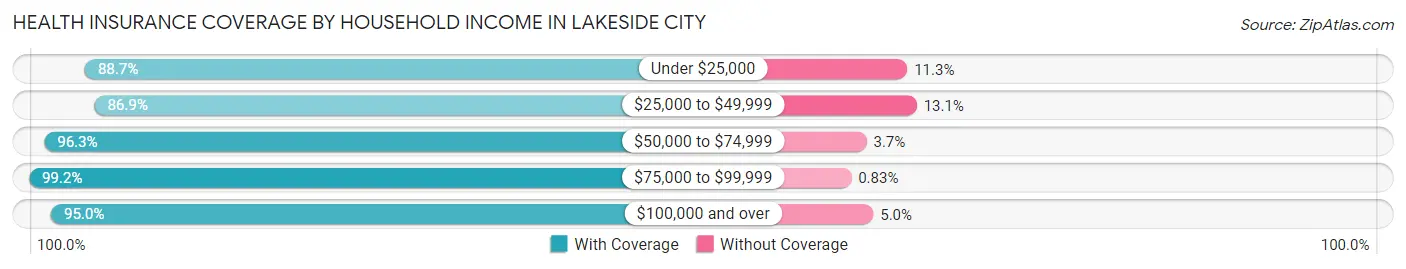
| Household Income | With Coverage | Without Coverage |
| Under $25,000 | 47 (88.7%) | 6 (11.3%) |
| $25,000 to $49,999 | 73 (86.9%) | 11 (13.1%) |
| $50,000 to $74,999 | 78 (96.3%) | 3 (3.7%) |
| $75,000 to $99,999 | 240 (99.2%) | 2 (0.8%) |
| $100,000 and over | 594 (95.0%) | 31 (5.0%) |
Public vs Private Health Insurance Coverage by Age in Lakeside City
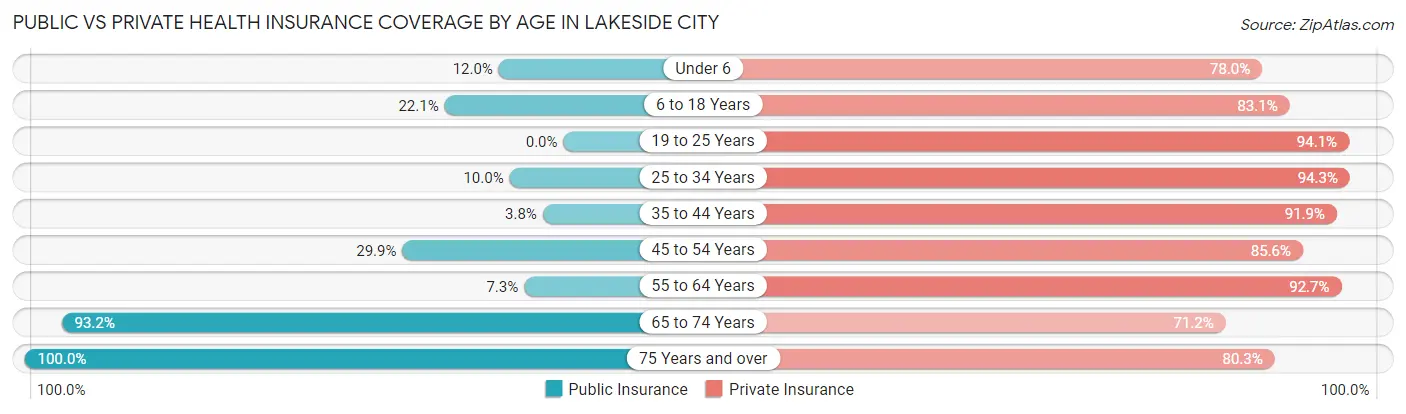
| Age Bracket | Public Insurance | Private Insurance |
| Under 6 | 12 (12.0%) | 78 (78.0%) |
| 6 to 18 Years | 60 (22.1%) | 226 (83.1%) |
| 19 to 25 Years | 0 (0.0%) | 32 (94.1%) |
| 25 to 34 Years | 7 (10.0%) | 66 (94.3%) |
| 35 to 44 Years | 8 (3.8%) | 192 (91.9%) |
| 45 to 54 Years | 29 (29.9%) | 83 (85.6%) |
| 55 to 64 Years | 7 (7.3%) | 89 (92.7%) |
| 65 to 74 Years | 136 (93.1%) | 104 (71.2%) |
| 75 Years and over | 61 (100.0%) | 49 (80.3%) |
| Total | 320 (29.5%) | 919 (84.7%) |
Disability Status by Sex by Age in Lakeside City
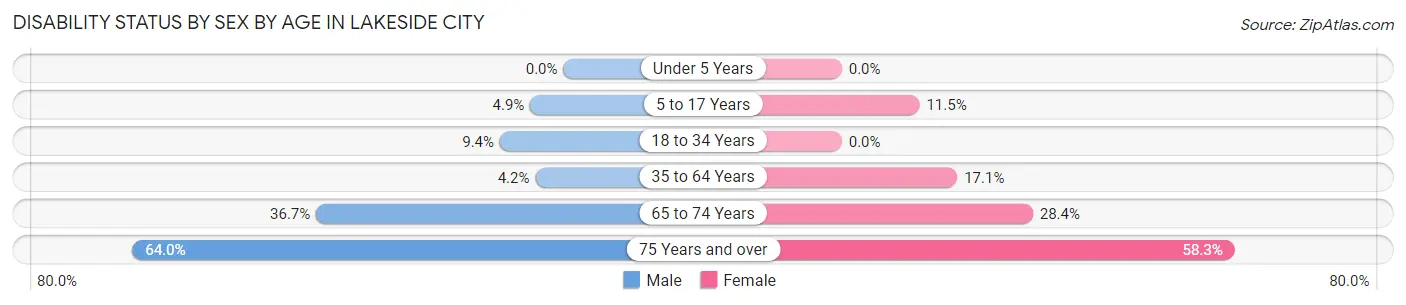
| Age Bracket | Male | Female |
| Under 5 Years | 0 (0.0%) | 0 (0.0%) |
| 5 to 17 Years | 7 (4.9%) | 18 (11.5%) |
| 18 to 34 Years | 5 (9.4%) | 0 (0.0%) |
| 35 to 64 Years | 8 (4.2%) | 36 (17.1%) |
| 65 to 74 Years | 29 (36.7%) | 19 (28.4%) |
| 75 Years and over | 16 (64.0%) | 21 (58.3%) |
Disability Class by Sex by Age in Lakeside City
Disability Class: Hearing Difficulty
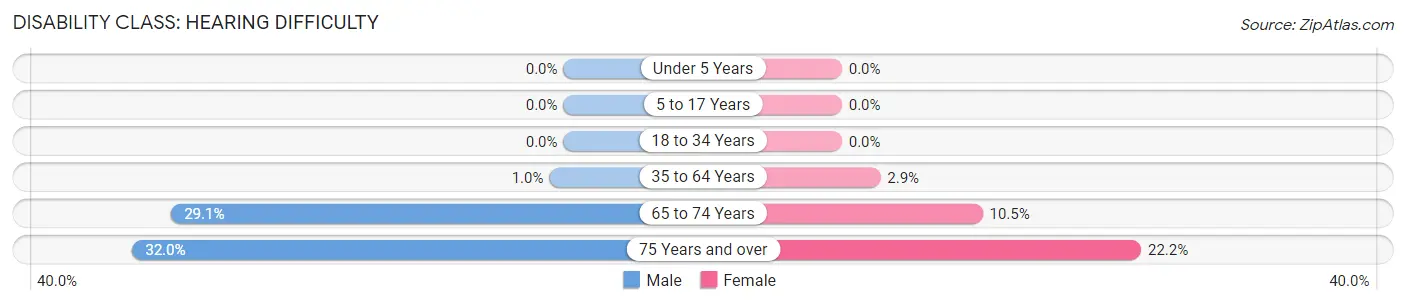
| Age Bracket | Male | Female |
| Under 5 Years | 0 (0.0%) | 0 (0.0%) |
| 5 to 17 Years | 0 (0.0%) | 0 (0.0%) |
| 18 to 34 Years | 0 (0.0%) | 0 (0.0%) |
| 35 to 64 Years | 2 (1.0%) | 6 (2.9%) |
| 65 to 74 Years | 23 (29.1%) | 7 (10.4%) |
| 75 Years and over | 8 (32.0%) | 8 (22.2%) |
Disability Class: Vision Difficulty
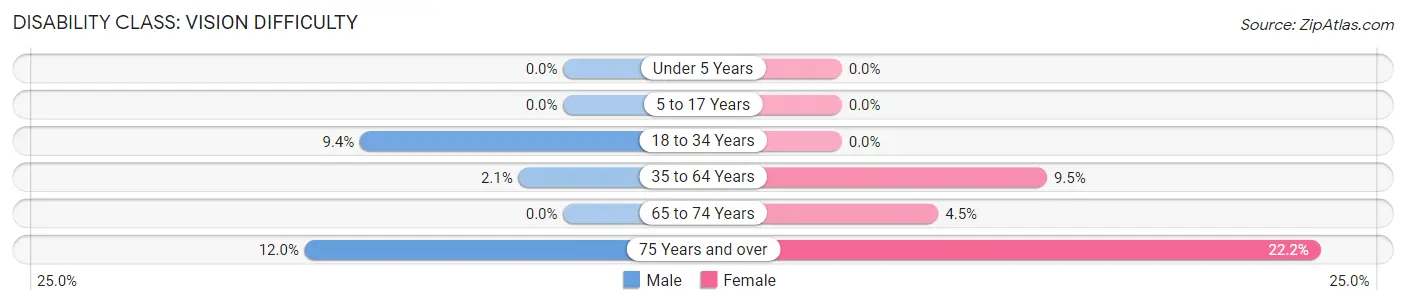
| Age Bracket | Male | Female |
| Under 5 Years | 0 (0.0%) | 0 (0.0%) |
| 5 to 17 Years | 0 (0.0%) | 0 (0.0%) |
| 18 to 34 Years | 5 (9.4%) | 0 (0.0%) |
| 35 to 64 Years | 4 (2.1%) | 20 (9.5%) |
| 65 to 74 Years | 0 (0.0%) | 3 (4.5%) |
| 75 Years and over | 3 (12.0%) | 8 (22.2%) |
Disability Class: Cognitive Difficulty
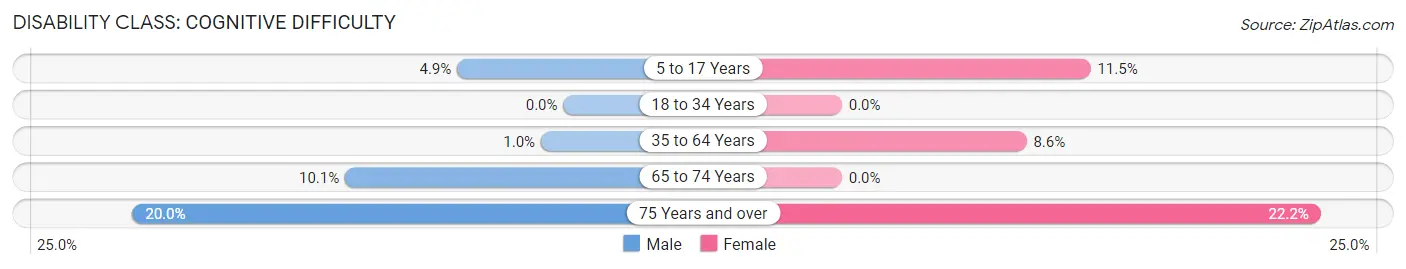
| Age Bracket | Male | Female |
| 5 to 17 Years | 7 (4.9%) | 18 (11.5%) |
| 18 to 34 Years | 0 (0.0%) | 0 (0.0%) |
| 35 to 64 Years | 2 (1.0%) | 18 (8.6%) |
| 65 to 74 Years | 8 (10.1%) | 0 (0.0%) |
| 75 Years and over | 5 (20.0%) | 8 (22.2%) |
Disability Class: Ambulatory Difficulty
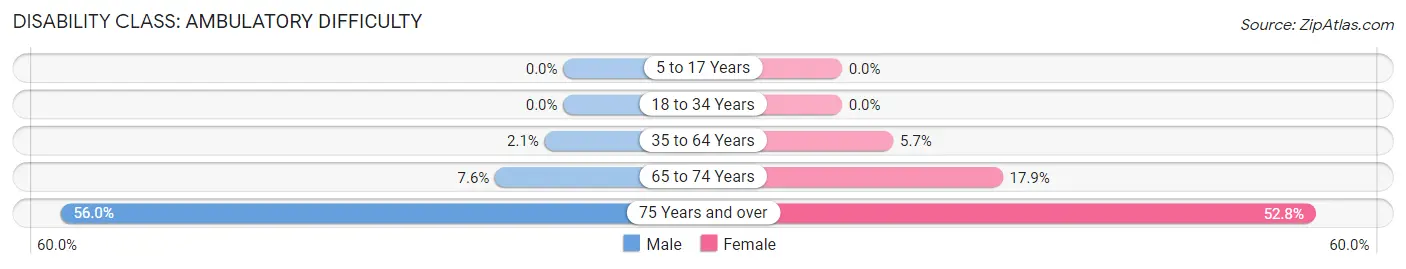
| Age Bracket | Male | Female |
| 5 to 17 Years | 0 (0.0%) | 0 (0.0%) |
| 18 to 34 Years | 0 (0.0%) | 0 (0.0%) |
| 35 to 64 Years | 4 (2.1%) | 12 (5.7%) |
| 65 to 74 Years | 6 (7.6%) | 12 (17.9%) |
| 75 Years and over | 14 (56.0%) | 19 (52.8%) |
Disability Class: Self-Care Difficulty
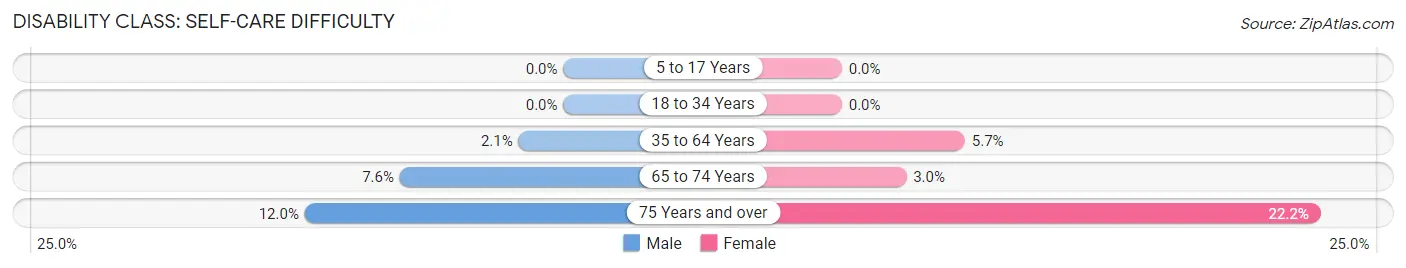
| Age Bracket | Male | Female |
| 5 to 17 Years | 0 (0.0%) | 0 (0.0%) |
| 18 to 34 Years | 0 (0.0%) | 0 (0.0%) |
| 35 to 64 Years | 4 (2.1%) | 12 (5.7%) |
| 65 to 74 Years | 6 (7.6%) | 2 (3.0%) |
| 75 Years and over | 3 (12.0%) | 8 (22.2%) |
Technology Access in Lakeside City
Computing Device Access in Lakeside City
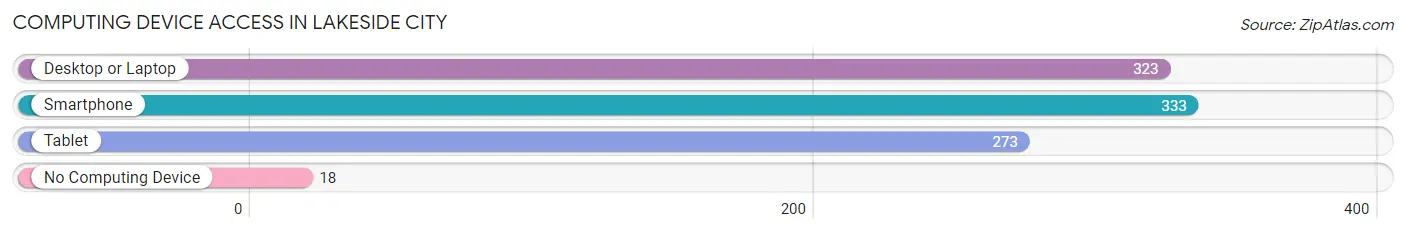
| Device Type | # Households | % Households |
| Desktop or Laptop | 323 | 88.7% |
| Smartphone | 333 | 91.5% |
| Tablet | 273 | 75.0% |
| No Computing Device | 18 | 5.0% |
| Total | 364 | 100.0% |
Internet Access in Lakeside City
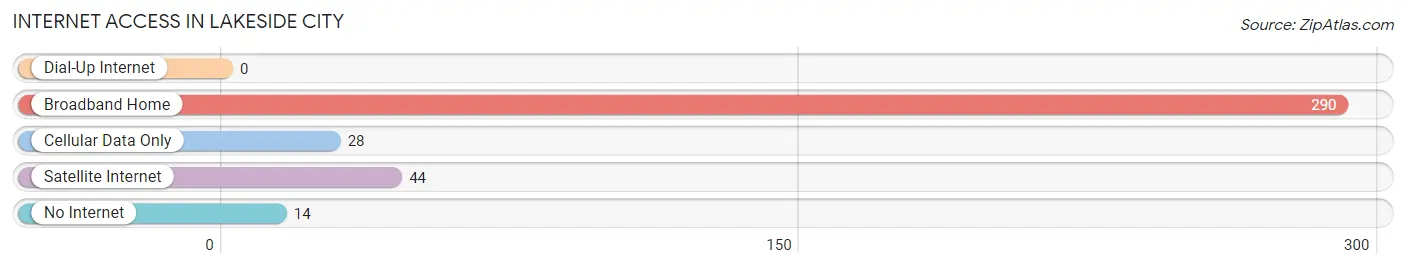
| Internet Type | # Households | % Households |
| Dial-Up Internet | 0 | 0.0% |
| Broadband Home | 290 | 79.7% |
| Cellular Data Only | 28 | 7.7% |
| Satellite Internet | 44 | 12.1% |
| No Internet | 14 | 3.8% |
| Total | 364 | 100.0% |
Lakeside City Summary
Lakeside City, Texas is a small city located in the Dallas-Fort Worth metropolitan area. It is situated in the northeast corner of Tarrant County, Texas, and is part of the Dallas-Fort Worth-Arlington metropolitan statistical area. The city is home to a population of approximately 8,000 people, and is known for its small-town charm and friendly atmosphere.
Geography
Lakeside City is located in the northeast corner of Tarrant County, Texas, and is part of the Dallas-Fort Worth-Arlington metropolitan statistical area. The city is situated on the western edge of the Trinity River, and is bordered by the cities of Fort Worth, Arlington, and Grand Prairie. The city is located approximately 20 miles from downtown Dallas and 25 miles from downtown Fort Worth.
The city is divided into two distinct sections: the Lakeside City proper, and the Lakeside City Estates. The Lakeside City proper is located on the western edge of the Trinity River, and is home to the majority of the city’s population. The Lakeside City Estates is located on the eastern side of the river, and is home to a smaller population.
The city is home to several parks and recreational areas, including Lakeside Park, which is located on the western edge of the city. The park features a playground, picnic areas, and a lake. Other parks in the city include the Lakeside City Nature Preserve, which is located on the eastern side of the city, and the Lakeside City Sports Complex, which is located on the western side of the city.
Economy
Lakeside City’s economy is largely based on the service industry, with many of the city’s residents employed in the retail, hospitality, and healthcare sectors. The city is also home to several small businesses, including restaurants, retail stores, and professional services.
The city is home to several large employers, including the Lakeside City Medical Center, which is the largest employer in the city. Other major employers in the city include the Lakeside City Public Schools, the Lakeside City Fire Department, and the Lakeside City Police Department.
Demographics
As of the 2010 census, the population of Lakeside City was 8,000. The racial makeup of the city was 79.3% White, 11.2% African American, 0.7% Native American, 0.7% Asian, 0.1% Pacific Islander, 5.2% from other races, and 2.7% from two or more races. Hispanic or Latino of any race were 11.2% of the population.
The median income for a household in the city was $45,000, and the median income for a family was $50,000. The per capita income for the city was $20,000. About 11.2% of families and 13.2% of the population were below the poverty line, including 17.2% of those under age 18 and 8.2% of those age 65 or over.
Conclusion
Lakeside City, Texas is a small city located in the Dallas-Fort Worth metropolitan area. It is home to a population of approximately 8,000 people, and is known for its small-town charm and friendly atmosphere. The city’s economy is largely based on the service industry, with many of the city’s residents employed in the retail, hospitality, and healthcare sectors. The city is also home to several parks and recreational areas, including Lakeside Park, which is located on the western edge of the city. The racial makeup of the city is 79.3% White, 11.2% African American, 0.7% Native American, 0.7% Asian, 0.1% Pacific Islander, 5.2% from other races, and 2.7% from two or more races. The median income for a household in the city was $45,000, and the median income for a family was $50,000. Lakeside City is a vibrant and diverse community that offers its residents a unique and welcoming atmosphere.
Common Questions
What is the Total Population of Lakeside City?
Total Population of Lakeside City is 1,091.
What is the Total Male Population of Lakeside City?
Total Male Population of Lakeside City is 508.
What is the Total Female Population of Lakeside City?
Total Female Population of Lakeside City is 583.
What is the Ratio of Males per 100 Females in Lakeside City?
There are 87.14 Males per 100 Females in Lakeside City.
What is the Ratio of Females per 100 Males in Lakeside City?
There are 114.76 Females per 100 Males in Lakeside City.
What is the Median Population Age in Lakeside City?
Median Population Age in Lakeside City is 36.9 Years.
What is the Average Family Size in Lakeside City
Average Family Size in Lakeside City is 3.5 People.
What is the Average Household Size in Lakeside City
Average Household Size in Lakeside City is 3.0 People.
What is Per Capita Income in Lakeside City?
Per Capita income in Lakeside City is $37,257.
What is the Median Family Income in Lakeside City?
Median Family Income in Lakeside City is $113,214.
What is the Median Household income in Lakeside City?
Median Household Income in Lakeside City is $99,265.
What is Income or Wage Gap in Lakeside City?
Income or Wage Gap in Lakeside City is 38.3%.
Women in Lakeside City earn 61.7 cents for every dollar earned by a man.
What is Inequality or Gini Index in Lakeside City?
Inequality or Gini Index in Lakeside City is 0.34.
How Large is the Labor Force in Lakeside City?
There are 491 People in the Labor Forcein in Lakeside City.
What is the Percentage of People in the Labor Force in Lakeside City?
63.2% of People are in the Labor Force in Lakeside City.
What is the Unemployment Rate in Lakeside City?
Unemployment Rate in Lakeside City is 2.9%.