Georgetown, TX
Georgetown Map
Georgetown Overview
71,788
TOTAL POPULATION
33,816
MALE POPULATION
37,972
FEMALE POPULATION
89.06
MALES / 100 FEMALES
112.29
FEMALES / 100 MALES
44.7
MEDIAN AGE
2.9
AVG FAMILY SIZE
2.3
AVG HOUSEHOLD SIZE
$46,727
PER CAPITA INCOME
$105,890
AVG FAMILY INCOME
$87,465
AVG HOUSEHOLD INCOME
33.1%
WAGE / INCOME GAP [ % ]
66.9¢/ $1
WAGE / INCOME GAP [ $ ]
0.42
INEQUALITY / GINI INDEX
32,279
LABOR FORCE [ PEOPLE ]
54.5%
PERCENT IN LABOR FORCE
5.7%
UNEMPLOYMENT RATE
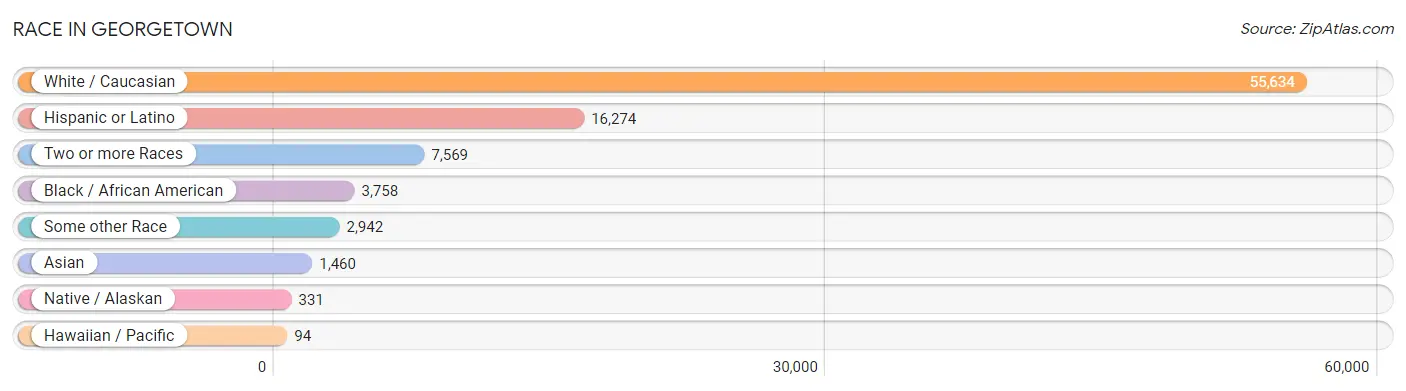
Race in Georgetown
The most populous races in Georgetown are White / Caucasian (55,634 | 77.5%), Hispanic or Latino (16,274 | 22.7%), and Two or more Races (7,569 | 10.5%).
| Race | # Population | % Population |
| Asian | 1,460 | 2.0% |
| Black / African American | 3,758 | 5.2% |
| Hawaiian / Pacific | 94 | 0.1% |
| Hispanic or Latino | 16,274 | 22.7% |
| Native / Alaskan | 331 | 0.5% |
| White / Caucasian | 55,634 | 77.5% |
| Two or more Races | 7,569 | 10.5% |
| Some other Race | 2,942 | 4.1% |
| Total | 71,788 | 100.0% |
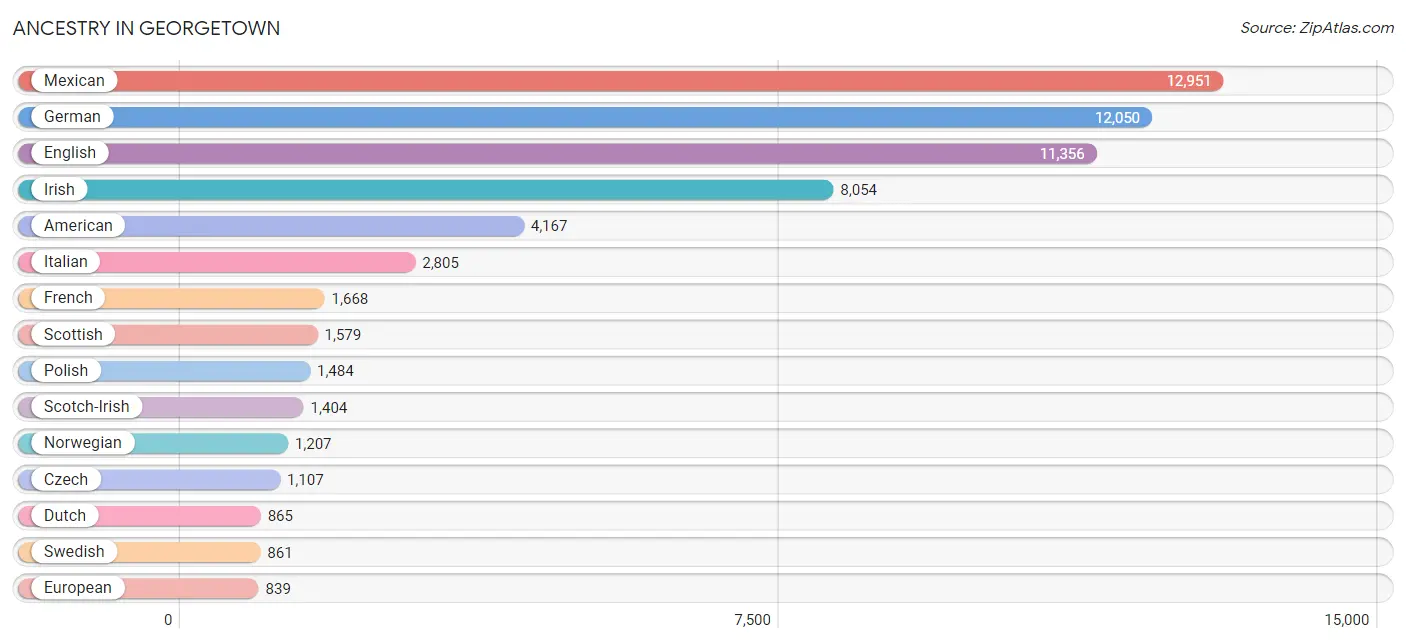
Ancestry in Georgetown
The most populous ancestries reported in Georgetown are Mexican (12,951 | 18.0%), German (12,050 | 16.8%), English (11,356 | 15.8%), Irish (8,054 | 11.2%), and American (4,167 | 5.8%), together accounting for 67.7% of all Georgetown residents.
| Ancestry | # Population | % Population |
| African | 254 | 0.4% |
| American | 4,167 | 5.8% |
| Apache | 48 | 0.1% |
| Arab | 214 | 0.3% |
| Australian | 14 | 0.0% |
| Austrian | 240 | 0.3% |
| Basque | 19 | 0.0% |
| Belgian | 23 | 0.0% |
| Belizean | 13 | 0.0% |
| Bhutanese | 129 | 0.2% |
| Bolivian | 59 | 0.1% |
| Brazilian | 24 | 0.0% |
| British | 529 | 0.7% |
| Burmese | 301 | 0.4% |
| Canadian | 128 | 0.2% |
| Central American | 513 | 0.7% |
| Central American Indian | 45 | 0.1% |
| Cherokee | 199 | 0.3% |
| Choctaw | 33 | 0.1% |
| Colombian | 102 | 0.1% |
| Comanche | 9 | 0.0% |
| Costa Rican | 135 | 0.2% |
| Creek | 7 | 0.0% |
| Croatian | 52 | 0.1% |
| Cuban | 191 | 0.3% |
| Czech | 1,107 | 1.5% |
| Czechoslovakian | 54 | 0.1% |
| Danish | 333 | 0.5% |
| Dominican | 145 | 0.2% |
| Dutch | 865 | 1.2% |
| Eastern European | 169 | 0.2% |
| Ecuadorian | 122 | 0.2% |
| English | 11,356 | 15.8% |
| European | 839 | 1.2% |
| Filipino | 20 | 0.0% |
| Finnish | 78 | 0.1% |
| French | 1,668 | 2.3% |
| French Canadian | 382 | 0.5% |
| German | 12,050 | 16.8% |
| Greek | 315 | 0.4% |
| Guamanian / Chamorro | 34 | 0.1% |
| Guatemalan | 36 | 0.1% |
| Honduran | 180 | 0.3% |
| Hungarian | 122 | 0.2% |
| Icelander | 25 | 0.0% |
| Indian (Asian) | 381 | 0.5% |
| Iranian | 7 | 0.0% |
| Irish | 8,054 | 11.2% |
| Italian | 2,805 | 3.9% |
| Japanese | 102 | 0.1% |
| Korean | 736 | 1.0% |
| Lebanese | 71 | 0.1% |
| Liberian | 69 | 0.1% |
| Lithuanian | 43 | 0.1% |
| Luxembourger | 10 | 0.0% |
| Maltese | 18 | 0.0% |
| Mexican | 12,951 | 18.0% |
| Mexican American Indian | 339 | 0.5% |
| Native Hawaiian | 78 | 0.1% |
| Navajo | 5 | 0.0% |
| Nicaraguan | 92 | 0.1% |
| Nigerian | 124 | 0.2% |
| Northern European | 117 | 0.2% |
| Norwegian | 1,207 | 1.7% |
| Osage | 18 | 0.0% |
| Panamanian | 8 | 0.0% |
| Peruvian | 37 | 0.1% |
| Polish | 1,484 | 2.1% |
| Portuguese | 83 | 0.1% |
| Puerto Rican | 605 | 0.8% |
| Romanian | 10 | 0.0% |
| Russian | 255 | 0.4% |
| Salvadoran | 62 | 0.1% |
| Samoan | 188 | 0.3% |
| Scandinavian | 381 | 0.5% |
| Scotch-Irish | 1,404 | 2.0% |
| Scottish | 1,579 | 2.2% |
| Slovak | 34 | 0.1% |
| Slovene | 35 | 0.1% |
| South African | 121 | 0.2% |
| South American | 374 | 0.5% |
| Spaniard | 176 | 0.3% |
| Spanish | 336 | 0.5% |
| Sri Lankan | 250 | 0.4% |
| Subsaharan African | 655 | 0.9% |
| Swedish | 861 | 1.2% |
| Swiss | 433 | 0.6% |
| Syrian | 10 | 0.0% |
| Thai | 360 | 0.5% |
| Trinidadian and Tobagonian | 18 | 0.0% |
| Turkish | 14 | 0.0% |
| Ukrainian | 35 | 0.1% |
| Venezuelan | 54 | 0.1% |
| Welsh | 809 | 1.1% |
| West Indian | 31 | 0.0% |
| Yugoslavian | 17 | 0.0% | View All 96 Rows |
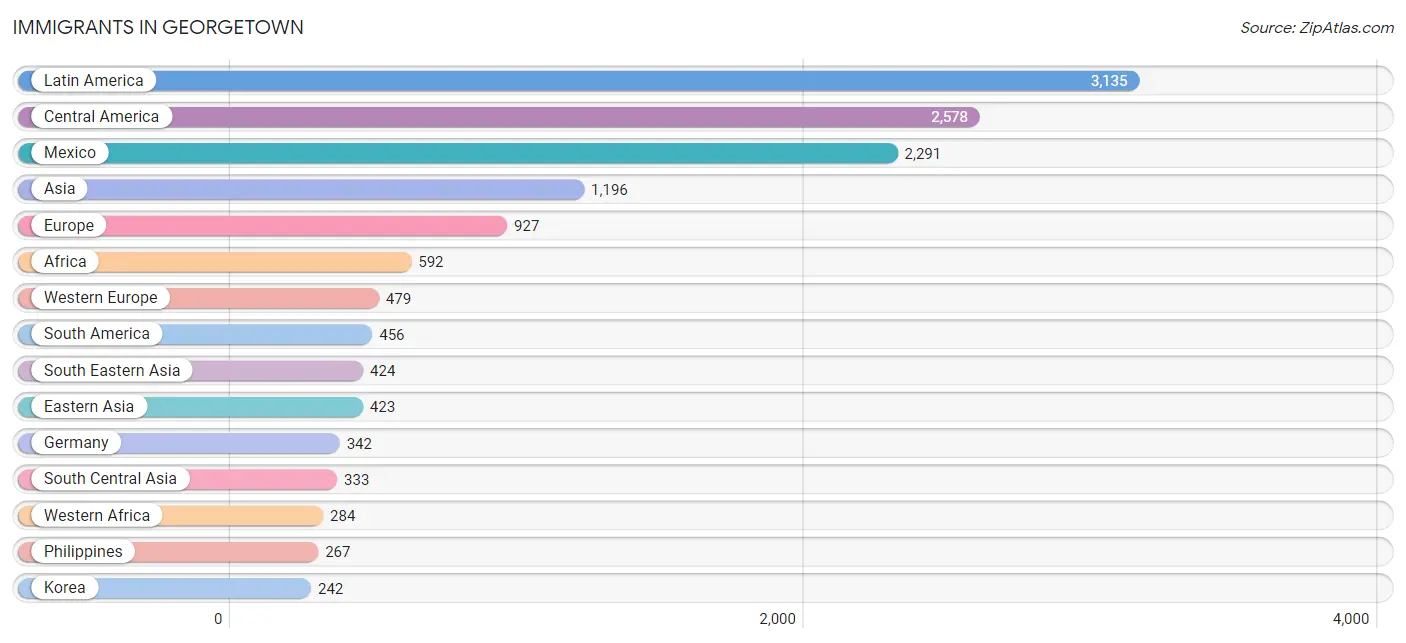
Immigrants in Georgetown
The most numerous immigrant groups reported in Georgetown came from Latin America (3,135 | 4.4%), Central America (2,578 | 3.6%), Mexico (2,291 | 3.2%), Asia (1,196 | 1.7%), and Europe (927 | 1.3%), together accounting for 14.1% of all Georgetown residents.
| Immigration Origin | # Population | % Population |
| Africa | 592 | 0.8% |
| Asia | 1,196 | 1.7% |
| Australia | 29 | 0.0% |
| Austria | 40 | 0.1% |
| Belize | 13 | 0.0% |
| Bolivia | 38 | 0.1% |
| Brazil | 72 | 0.1% |
| Cambodia | 32 | 0.0% |
| Canada | 124 | 0.2% |
| Caribbean | 101 | 0.1% |
| Central America | 2,578 | 3.6% |
| China | 163 | 0.2% |
| Colombia | 172 | 0.2% |
| Costa Rica | 78 | 0.1% |
| Cuba | 15 | 0.0% |
| Czechoslovakia | 9 | 0.0% |
| Dominican Republic | 46 | 0.1% |
| Eastern Africa | 59 | 0.1% |
| Eastern Asia | 423 | 0.6% |
| Eastern Europe | 208 | 0.3% |
| Ecuador | 122 | 0.2% |
| El Salvador | 54 | 0.1% |
| England | 33 | 0.1% |
| Europe | 927 | 1.3% |
| France | 38 | 0.1% |
| Germany | 342 | 0.5% |
| Grenada | 9 | 0.0% |
| Guatemala | 54 | 0.1% |
| Guyana | 18 | 0.0% |
| Honduras | 23 | 0.0% |
| Hungary | 23 | 0.0% |
| India | 194 | 0.3% |
| Ireland | 9 | 0.0% |
| Italy | 15 | 0.0% |
| Japan | 18 | 0.0% |
| Kenya | 59 | 0.1% |
| Korea | 242 | 0.3% |
| Latin America | 3,135 | 4.4% |
| Liberia | 69 | 0.1% |
| Lithuania | 8 | 0.0% |
| Mexico | 2,291 | 3.2% |
| Middle Africa | 38 | 0.1% |
| Nepal | 66 | 0.1% |
| Netherlands | 31 | 0.0% |
| Nicaragua | 57 | 0.1% |
| Nigeria | 170 | 0.2% |
| Northern Africa | 34 | 0.1% |
| Northern Europe | 225 | 0.3% |
| Oceania | 29 | 0.0% |
| Pakistan | 5 | 0.0% |
| Panama | 8 | 0.0% |
| Philippines | 267 | 0.4% |
| Poland | 24 | 0.0% |
| Russia | 85 | 0.1% |
| Scotland | 49 | 0.1% |
| Singapore | 11 | 0.0% |
| South Africa | 177 | 0.3% |
| South America | 456 | 0.6% |
| South Central Asia | 333 | 0.5% |
| South Eastern Asia | 424 | 0.6% |
| Southern Europe | 15 | 0.0% |
| Sri Lanka | 58 | 0.1% |
| Switzerland | 28 | 0.0% |
| Taiwan | 32 | 0.0% |
| Thailand | 15 | 0.0% |
| Trinidad and Tobago | 31 | 0.0% |
| Ukraine | 59 | 0.1% |
| Uzbekistan | 10 | 0.0% |
| Venezuela | 34 | 0.1% |
| Vietnam | 74 | 0.1% |
| Western Africa | 284 | 0.4% |
| Western Europe | 479 | 0.7% |
| Zaire | 38 | 0.1% | View All 73 Rows |
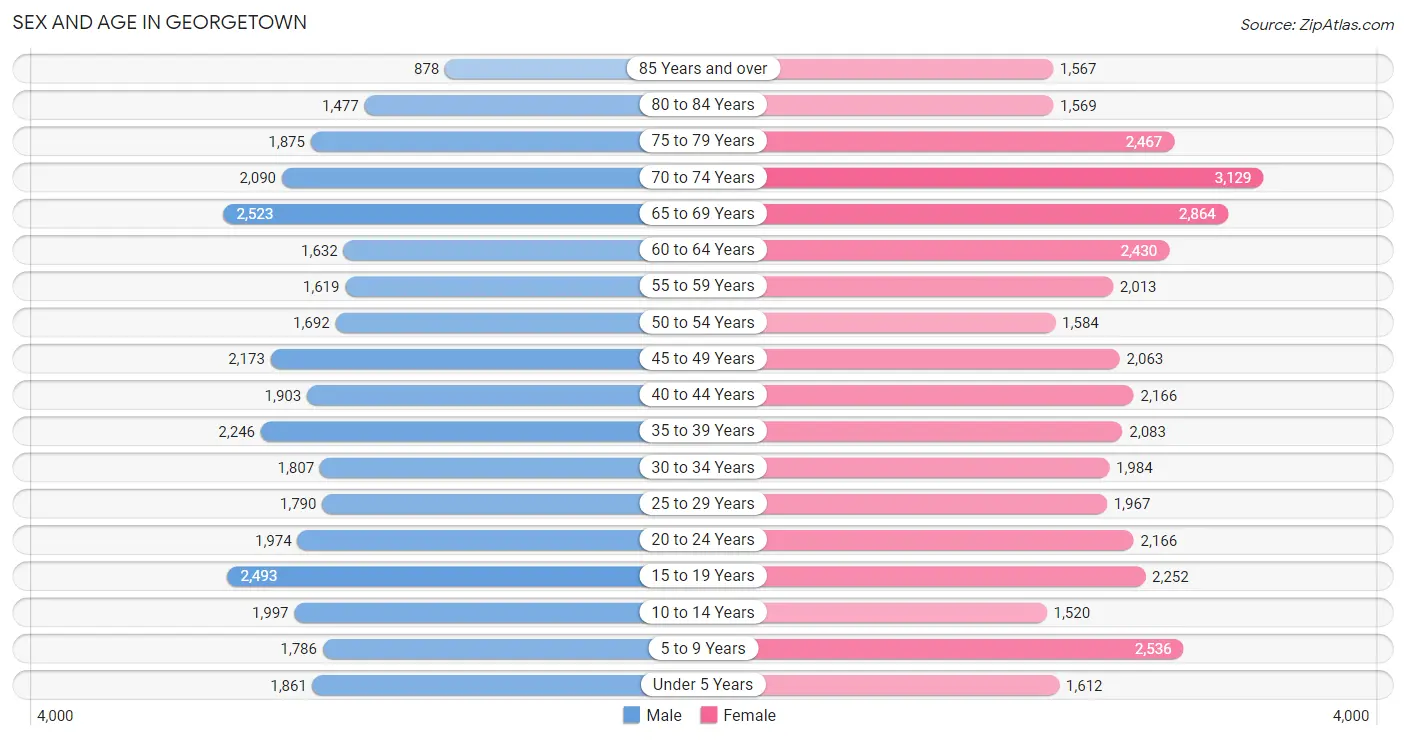
Sex and Age in Georgetown
Sex and Age in Georgetown
The most populous age groups in Georgetown are 65 to 69 Years (2,523 | 7.5%) for men and 70 to 74 Years (3,129 | 8.2%) for women.
| Age Bracket | Male | Female |
| Under 5 Years | 1,861 (5.5%) | 1,612 (4.3%) |
| 5 to 9 Years | 1,786 (5.3%) | 2,536 (6.7%) |
| 10 to 14 Years | 1,997 (5.9%) | 1,520 (4.0%) |
| 15 to 19 Years | 2,493 (7.4%) | 2,252 (5.9%) |
| 20 to 24 Years | 1,974 (5.8%) | 2,166 (5.7%) |
| 25 to 29 Years | 1,790 (5.3%) | 1,967 (5.2%) |
| 30 to 34 Years | 1,807 (5.3%) | 1,984 (5.2%) |
| 35 to 39 Years | 2,246 (6.6%) | 2,083 (5.5%) |
| 40 to 44 Years | 1,903 (5.6%) | 2,166 (5.7%) |
| 45 to 49 Years | 2,173 (6.4%) | 2,063 (5.4%) |
| 50 to 54 Years | 1,692 (5.0%) | 1,584 (4.2%) |
| 55 to 59 Years | 1,619 (4.8%) | 2,013 (5.3%) |
| 60 to 64 Years | 1,632 (4.8%) | 2,430 (6.4%) |
| 65 to 69 Years | 2,523 (7.5%) | 2,864 (7.5%) |
| 70 to 74 Years | 2,090 (6.2%) | 3,129 (8.2%) |
| 75 to 79 Years | 1,875 (5.5%) | 2,467 (6.5%) |
| 80 to 84 Years | 1,477 (4.4%) | 1,569 (4.1%) |
| 85 Years and over | 878 (2.6%) | 1,567 (4.1%) |
| Total | 33,816 (100.0%) | 37,972 (100.0%) |
Families and Households in Georgetown
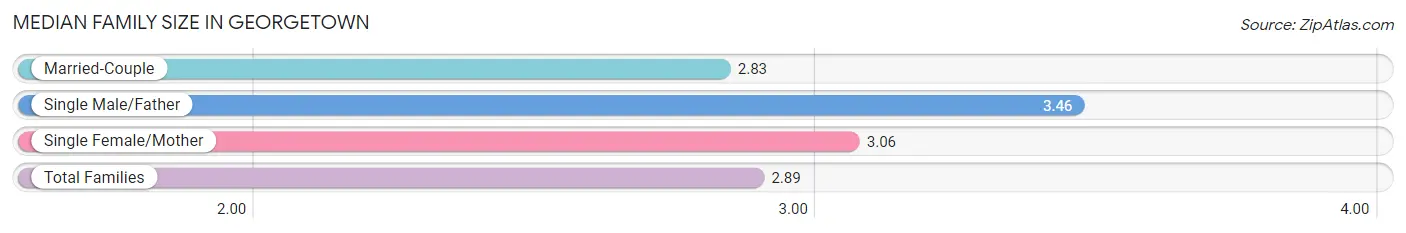
Median Family Size in Georgetown
The median family size in Georgetown is 2.89 persons per family, with single male/father families (866 | 4.5%) accounting for the largest median family size of 3.46 persons per family. On the other hand, married-couple families (16,125 | 83.6%) represent the smallest median family size with 2.83 persons per family.
| Family Type | # Families | Family Size |
| Married-Couple | 16,125 (83.6%) | 2.83 |
| Single Male/Father | 866 (4.5%) | 3.46 |
| Single Female/Mother | 2,291 (11.9%) | 3.06 |
| Total Families | 19,282 (100.0%) | 2.89 |
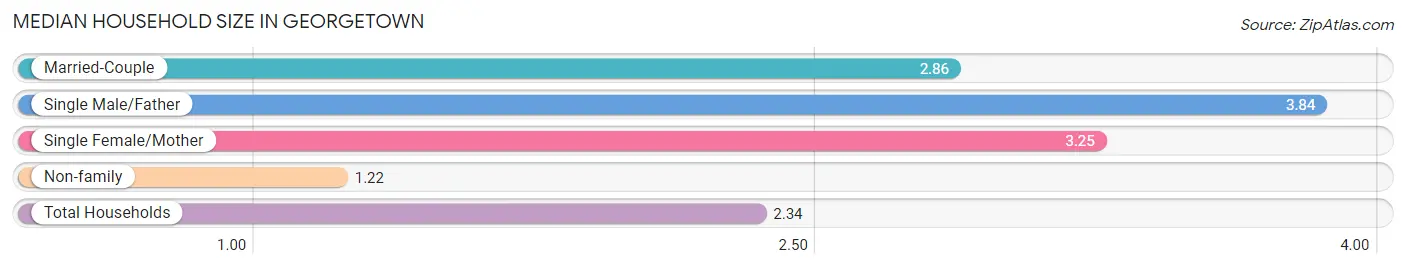
Median Household Size in Georgetown
The median household size in Georgetown is 2.34 persons per household, with single male/father households (866 | 2.9%) accounting for the largest median household size of 3.84 persons per household. non-family households (10,486 | 35.2%) represent the smallest median household size with 1.22 persons per household.
| Household Type | # Households | Household Size |
| Married-Couple | 16,125 (54.2%) | 2.86 |
| Single Male/Father | 866 (2.9%) | 3.84 |
| Single Female/Mother | 2,291 (7.7%) | 3.25 |
| Non-family | 10,486 (35.2%) | 1.22 |
| Total Households | 29,768 (100.0%) | 2.34 |
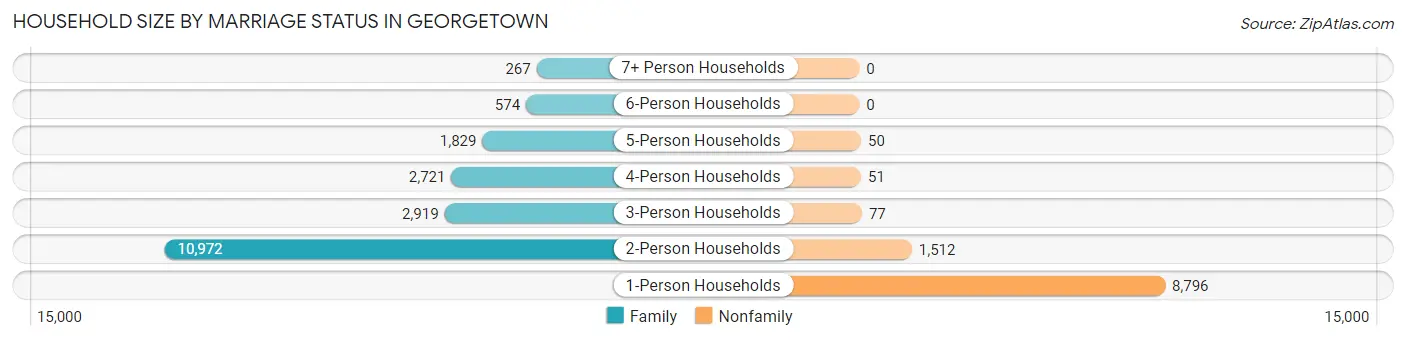
Household Size by Marriage Status in Georgetown
Out of a total of 29,768 households in Georgetown, 19,282 (64.8%) are family households, while 10,486 (35.2%) are nonfamily households. The most numerous type of family households are 2-person households, comprising 10,972, and the most common type of nonfamily households are 1-person households, comprising 8,796.
| Household Size | Family Households | Nonfamily Households |
| 1-Person Households | - | 8,796 (29.5%) |
| 2-Person Households | 10,972 (36.9%) | 1,512 (5.1%) |
| 3-Person Households | 2,919 (9.8%) | 77 (0.3%) |
| 4-Person Households | 2,721 (9.1%) | 51 (0.2%) |
| 5-Person Households | 1,829 (6.1%) | 50 (0.2%) |
| 6-Person Households | 574 (1.9%) | 0 (0.0%) |
| 7+ Person Households | 267 (0.9%) | 0 (0.0%) |
| Total | 19,282 (64.8%) | 10,486 (35.2%) |
Female Fertility in Georgetown
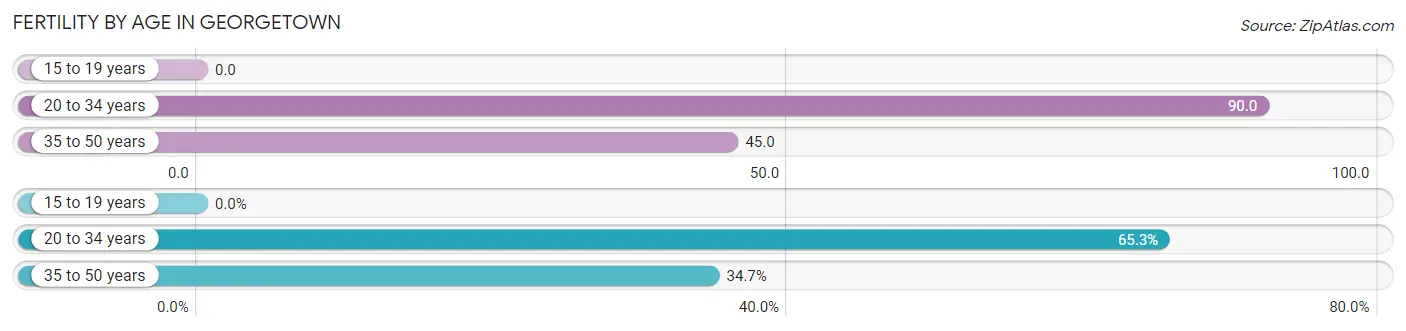
Fertility by Age in Georgetown
Average fertility rate in Georgetown is 57.0 births per 1,000 women. Women in the age bracket of 20 to 34 years have the highest fertility rate with 90.0 births per 1,000 women. Women in the age bracket of 20 to 34 years acount for 65.3% of all women with births.
| Age Bracket | Women with Births | Births / 1,000 Women |
| 15 to 19 years | 0 (0.0%) | 0.0 |
| 20 to 34 years | 551 (65.3%) | 90.0 |
| 35 to 50 years | 293 (34.7%) | 45.0 |
| Total | 844 (100.0%) | 57.0 |
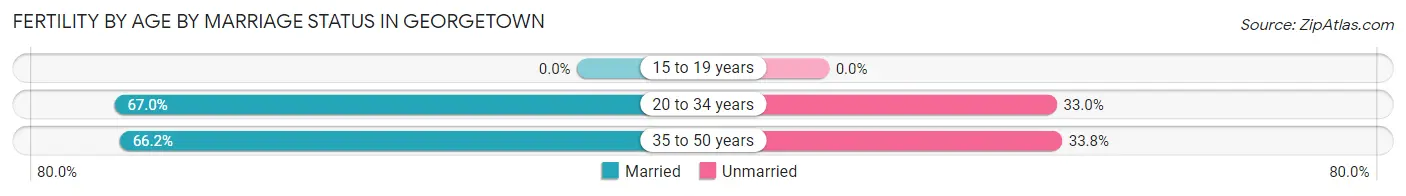
Fertility by Age by Marriage Status in Georgetown
66.7% of women with births (844) in Georgetown are married. The highest percentage of unmarried women with births falls into 35 to 50 years age bracket with 33.8% of them unmarried at the time of birth, while the lowest percentage of unmarried women with births belong to 20 to 34 years age bracket with 33.0% of them unmarried.
| Age Bracket | Married | Unmarried |
| 15 to 19 years | 0 (0.0%) | 0 (0.0%) |
| 20 to 34 years | 369 (67.0%) | 182 (33.0%) |
| 35 to 50 years | 194 (66.2%) | 99 (33.8%) |
| Total | 563 (66.7%) | 281 (33.3%) |
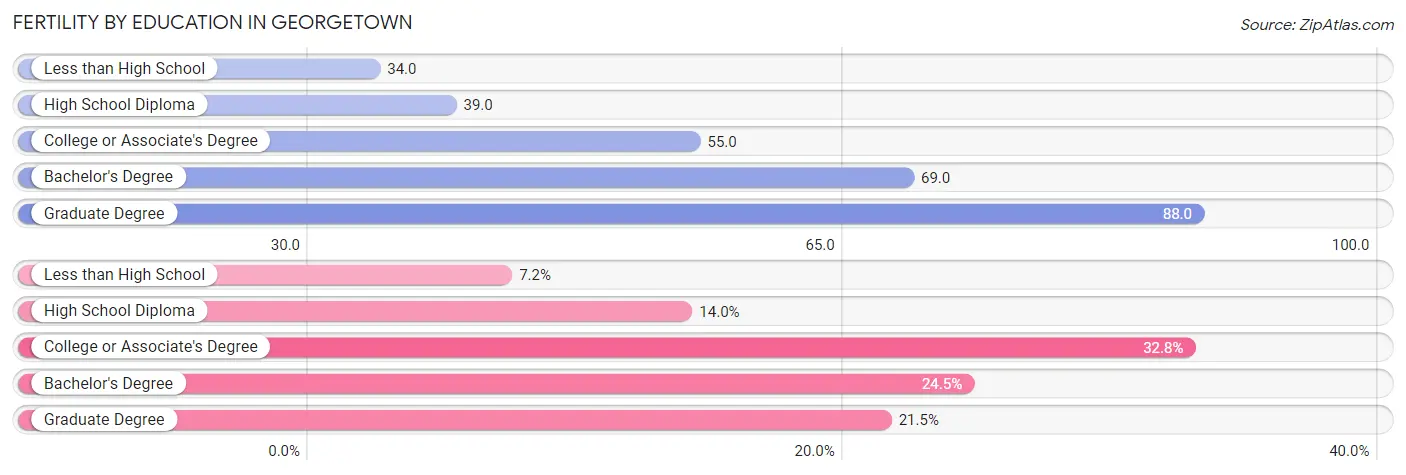
Fertility by Education in Georgetown
Average fertility rate in Georgetown is 57.0 births per 1,000 women. Women with the education attainment of graduate degree have the highest fertility rate of 88.0 births per 1,000 women, while women with the education attainment of less than high school have the lowest fertility at 34.0 births per 1,000 women. Women with the education attainment of college or associate's degree represent 32.8% of all women with births.
| Educational Attainment | Women with Births | Births / 1,000 Women |
| Less than High School | 61 (7.2%) | 34.0 |
| High School Diploma | 118 (14.0%) | 39.0 |
| College or Associate's Degree | 277 (32.8%) | 55.0 |
| Bachelor's Degree | 207 (24.5%) | 69.0 |
| Graduate Degree | 181 (21.4%) | 88.0 |
| Total | 844 (100.0%) | 57.0 |
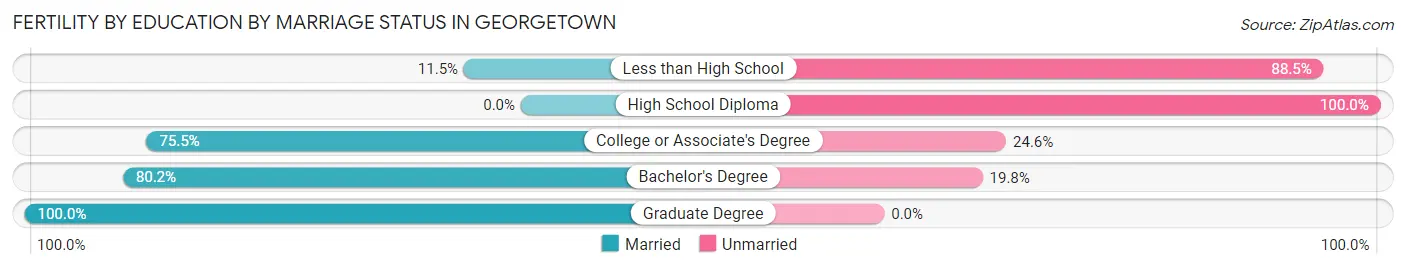
Fertility by Education by Marriage Status in Georgetown
33.3% of women with births in Georgetown are unmarried. Women with the educational attainment of graduate degree are most likely to be married with 100.0% of them married at childbirth, while women with the educational attainment of high school diploma are least likely to be married with 100.0% of them unmarried at childbirth.
| Educational Attainment | Married | Unmarried |
| Less than High School | 7 (11.5%) | 54 (88.5%) |
| High School Diploma | 0 (0.0%) | 118 (100.0%) |
| College or Associate's Degree | 209 (75.4%) | 68 (24.5%) |
| Bachelor's Degree | 166 (80.2%) | 41 (19.8%) |
| Graduate Degree | 181 (100.0%) | 0 (0.0%) |
| Total | 563 (66.7%) | 281 (33.3%) |
Income in Georgetown
Income Overview in Georgetown
Per Capita Income in Georgetown is $46,727, while median incomes of families and households are $105,890 and $87,465 respectively.
| Characteristic | Number | Measure |
| Per Capita Income | 71,788 | $46,727 |
| Median Family Income | 19,282 | $105,890 |
| Mean Family Income | 19,282 | $128,856 |
| Median Household Income | 29,768 | $87,465 |
| Mean Household Income | 29,768 | $111,022 |
| Income Deficit | 19,282 | $0 |
| Wage / Income Gap (%) | 71,788 | 33.09% |
| Wage / Income Gap ($) | 71,788 | 66.91¢ per $1 |
| Gini / Inequality Index | 71,788 | 0.42 |
Earnings by Sex in Georgetown
Average Earnings in Georgetown are $44,500, $53,098 for men and $35,528 for women, a difference of 33.1%.
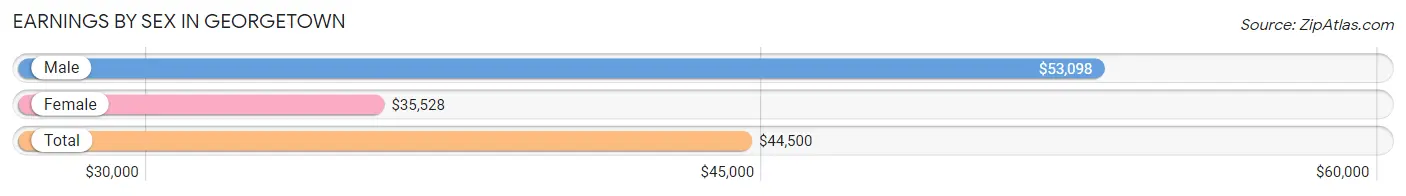
| Sex | Number | Average Earnings |
| Male | 17,401 (50.1%) | $53,098 |
| Female | 17,343 (49.9%) | $35,528 |
| Total | 34,744 (100.0%) | $44,500 |
Earnings by Sex by Income Bracket in Georgetown
The most common earnings brackets in Georgetown are $100,000+ for men (4,026 | 23.1%) and $100,000+ for women (1,880 | 10.8%).
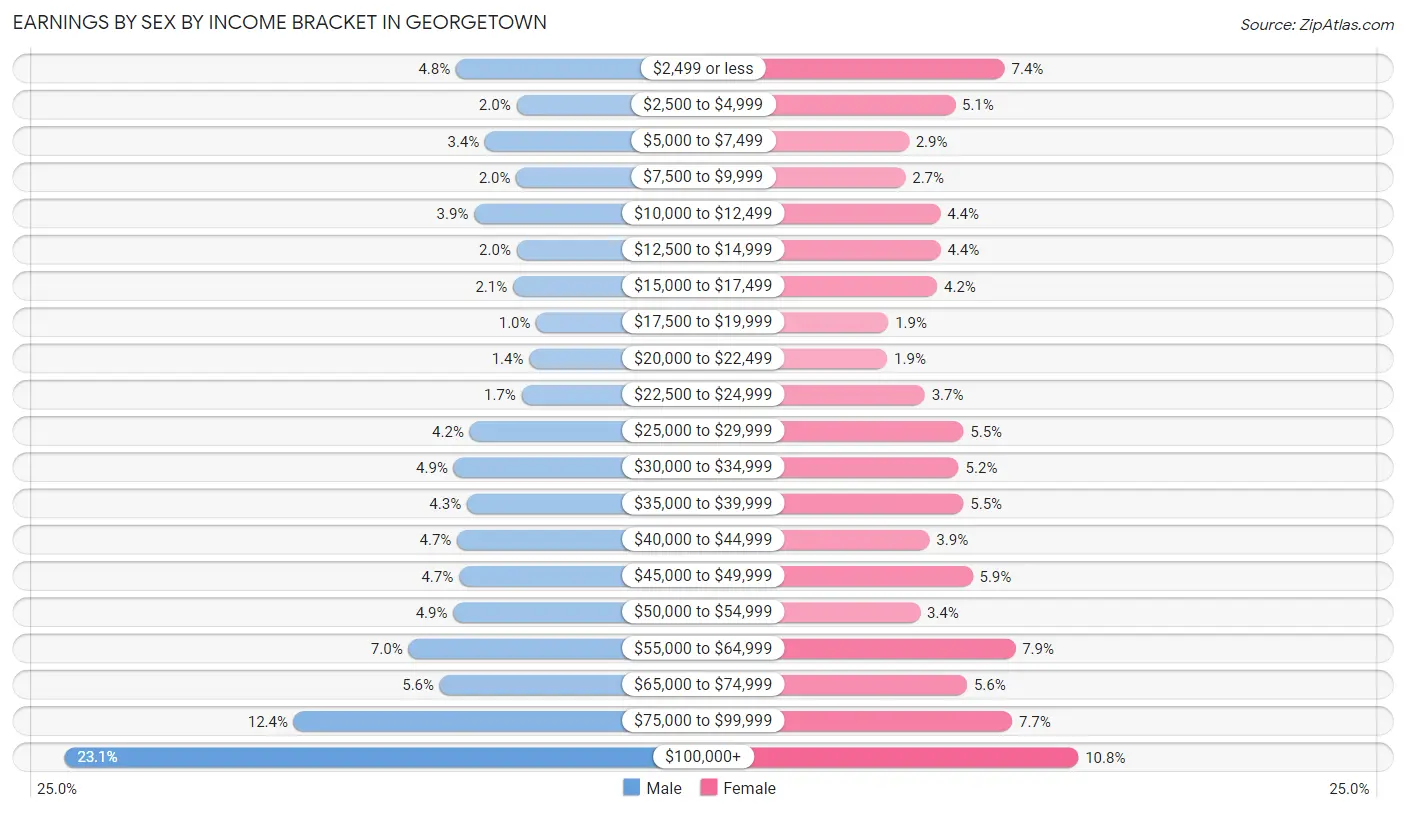
| Income | Male | Female |
| $2,499 or less | 834 (4.8%) | 1,281 (7.4%) |
| $2,500 to $4,999 | 341 (2.0%) | 879 (5.1%) |
| $5,000 to $7,499 | 596 (3.4%) | 503 (2.9%) |
| $7,500 to $9,999 | 343 (2.0%) | 475 (2.7%) |
| $10,000 to $12,499 | 685 (3.9%) | 759 (4.4%) |
| $12,500 to $14,999 | 340 (1.9%) | 761 (4.4%) |
| $15,000 to $17,499 | 369 (2.1%) | 733 (4.2%) |
| $17,500 to $19,999 | 180 (1.0%) | 337 (1.9%) |
| $20,000 to $22,499 | 237 (1.4%) | 327 (1.9%) |
| $22,500 to $24,999 | 299 (1.7%) | 633 (3.6%) |
| $25,000 to $29,999 | 723 (4.2%) | 947 (5.5%) |
| $30,000 to $34,999 | 853 (4.9%) | 909 (5.2%) |
| $35,000 to $39,999 | 744 (4.3%) | 947 (5.5%) |
| $40,000 to $44,999 | 824 (4.7%) | 671 (3.9%) |
| $45,000 to $49,999 | 809 (4.6%) | 1,021 (5.9%) |
| $50,000 to $54,999 | 856 (4.9%) | 594 (3.4%) |
| $55,000 to $64,999 | 1,221 (7.0%) | 1,368 (7.9%) |
| $65,000 to $74,999 | 965 (5.6%) | 976 (5.6%) |
| $75,000 to $99,999 | 2,156 (12.4%) | 1,342 (7.7%) |
| $100,000+ | 4,026 (23.1%) | 1,880 (10.8%) |
| Total | 17,401 (100.0%) | 17,343 (100.0%) |
Earnings by Sex by Educational Attainment in Georgetown
Average earnings in Georgetown are $61,614 for men and $42,275 for women, a difference of 31.4%. Men with an educational attainment of graduate degree enjoy the highest average annual earnings of $87,488, while those with high school diploma education earn the least with $40,490. Women with an educational attainment of graduate degree earn the most with the average annual earnings of $71,097, while those with less than high school education have the smallest earnings of $26,216.
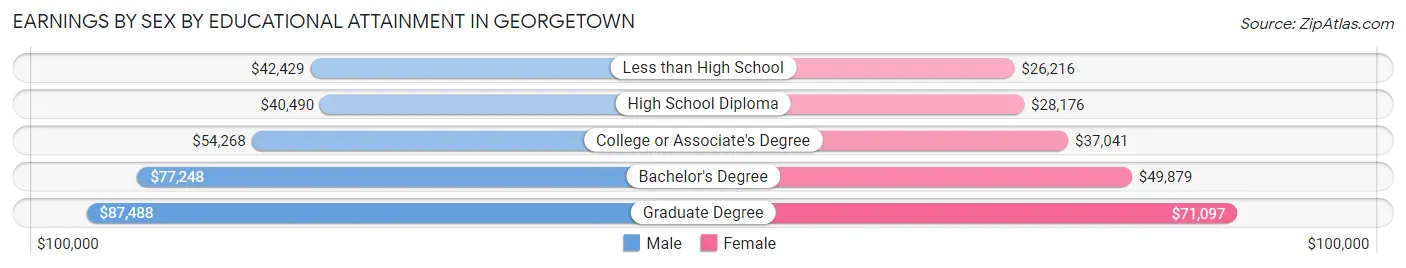
| Educational Attainment | Male Income | Female Income |
| Less than High School | $42,429 | $26,216 |
| High School Diploma | $40,490 | $28,176 |
| College or Associate's Degree | $54,268 | $37,041 |
| Bachelor's Degree | $77,248 | $49,879 |
| Graduate Degree | $87,488 | $71,097 |
| Total | $61,614 | $42,275 |
Family Income in Georgetown
Family Income Brackets in Georgetown
According to the Georgetown family income data, there are 5,052 families falling into the $100,000 to $149,999 income range, which is the most common income bracket and makes up 26.2% of all families. Conversely, the less than $10,000 income bracket is the least frequent group with only 231 families (1.2%) belonging to this category.
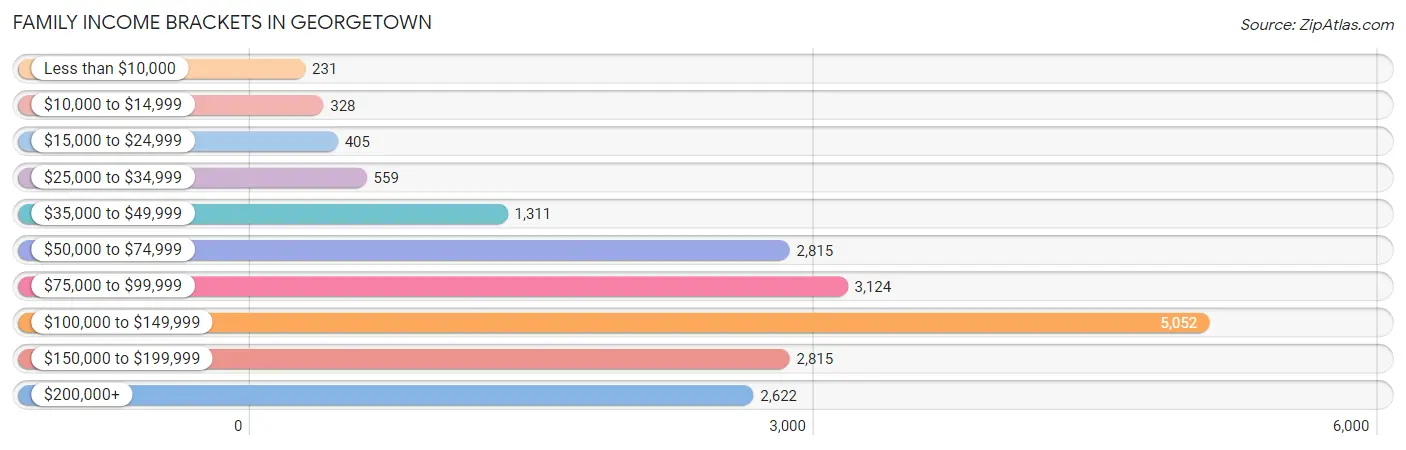
| Income Bracket | # Families | % Families |
| Less than $10,000 | 231 | 1.2% |
| $10,000 to $14,999 | 328 | 1.7% |
| $15,000 to $24,999 | 405 | 2.1% |
| $25,000 to $34,999 | 559 | 2.9% |
| $35,000 to $49,999 | 1,311 | 6.8% |
| $50,000 to $74,999 | 2,815 | 14.6% |
| $75,000 to $99,999 | 3,124 | 16.2% |
| $100,000 to $149,999 | 5,052 | 26.2% |
| $150,000 to $199,999 | 2,815 | 14.6% |
| $200,000+ | 2,622 | 13.6% |
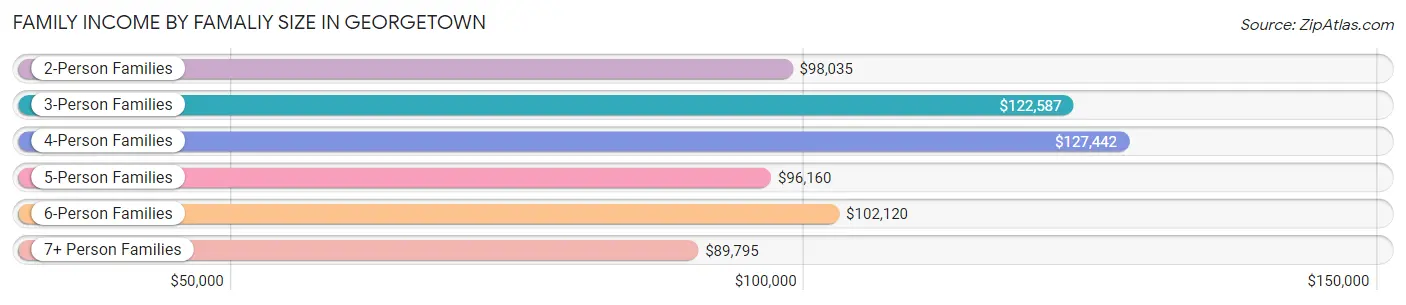
Family Income by Famaliy Size in Georgetown
4-person families (2,970 | 15.4%) account for the highest median family income in Georgetown with $127,442 per family, while 2-person families (11,175 | 58.0%) have the highest median income of $49,018 per family member.
| Income Bracket | # Families | Median Income |
| 2-Person Families | 11,175 (58.0%) | $98,035 |
| 3-Person Families | 2,867 (14.9%) | $122,587 |
| 4-Person Families | 2,970 (15.4%) | $127,442 |
| 5-Person Families | 1,661 (8.6%) | $96,160 |
| 6-Person Families | 477 (2.5%) | $102,120 |
| 7+ Person Families | 132 (0.7%) | $89,795 |
| Total | 19,282 (100.0%) | $105,890 |
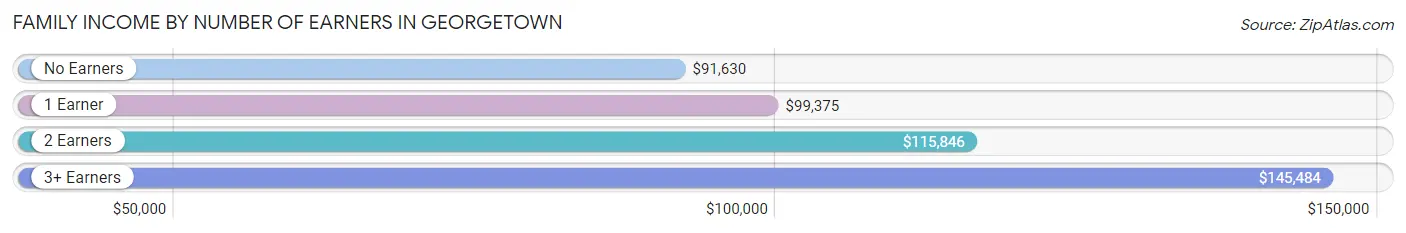
Family Income by Number of Earners in Georgetown
The median family income in Georgetown is $105,890, with families comprising 3+ earners (1,646) having the highest median family income of $145,484, while families with no earners (5,305) have the lowest median family income of $91,630, accounting for 8.5% and 27.5% of families, respectively.
| Number of Earners | # Families | Median Income |
| No Earners | 5,305 (27.5%) | $91,630 |
| 1 Earner | 5,357 (27.8%) | $99,375 |
| 2 Earners | 6,974 (36.2%) | $115,846 |
| 3+ Earners | 1,646 (8.5%) | $145,484 |
| Total | 19,282 (100.0%) | $105,890 |
Household Income in Georgetown
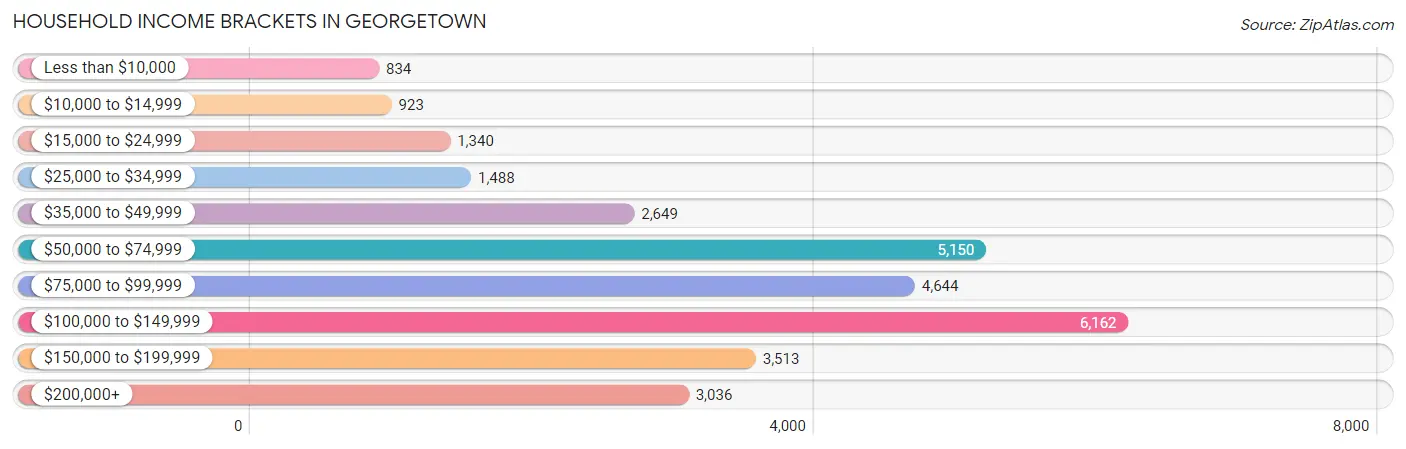
Household Income Brackets in Georgetown
With 6,162 households falling in the category, the $100,000 to $149,999 income range is the most frequent in Georgetown, accounting for 20.7% of all households. In contrast, only 834 households (2.8%) fall into the less than $10,000 income bracket, making it the least populous group.
| Income Bracket | # Households | % Households |
| Less than $10,000 | 834 | 2.8% |
| $10,000 to $14,999 | 923 | 3.1% |
| $15,000 to $24,999 | 1,340 | 4.5% |
| $25,000 to $34,999 | 1,488 | 5.0% |
| $35,000 to $49,999 | 2,649 | 8.9% |
| $50,000 to $74,999 | 5,150 | 17.3% |
| $75,000 to $99,999 | 4,644 | 15.6% |
| $100,000 to $149,999 | 6,162 | 20.7% |
| $150,000 to $199,999 | 3,513 | 11.8% |
| $200,000+ | 3,036 | 10.2% |
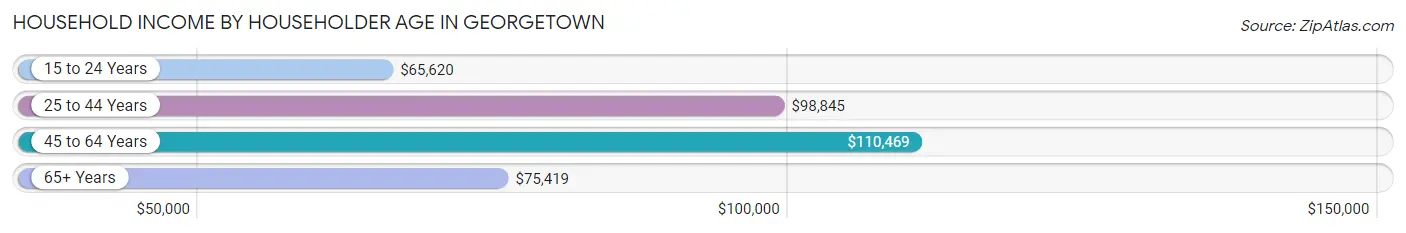
Household Income by Householder Age in Georgetown
The median household income in Georgetown is $87,465, with the highest median household income of $110,469 found in the 45 to 64 years age bracket for the primary householder. A total of 8,134 households (27.3%) fall into this category. Meanwhile, the 15 to 24 years age bracket for the primary householder has the lowest median household income of $65,620, with 1,151 households (3.9%) in this group.
| Income Bracket | # Households | Median Income |
| 15 to 24 Years | 1,151 (3.9%) | $65,620 |
| 25 to 44 Years | 7,486 (25.2%) | $98,845 |
| 45 to 64 Years | 8,134 (27.3%) | $110,469 |
| 65+ Years | 12,997 (43.7%) | $75,419 |
| Total | 29,768 (100.0%) | $87,465 |
Poverty in Georgetown
Income Below Poverty by Sex and Age in Georgetown
With 6.7% poverty level for males and 7.5% for females among the residents of Georgetown, 18 to 24 year old males and 18 to 24 year old females are the most vulnerable to poverty, with 356 males (15.0%) and 729 females (26.0%) in their respective age groups living below the poverty level.
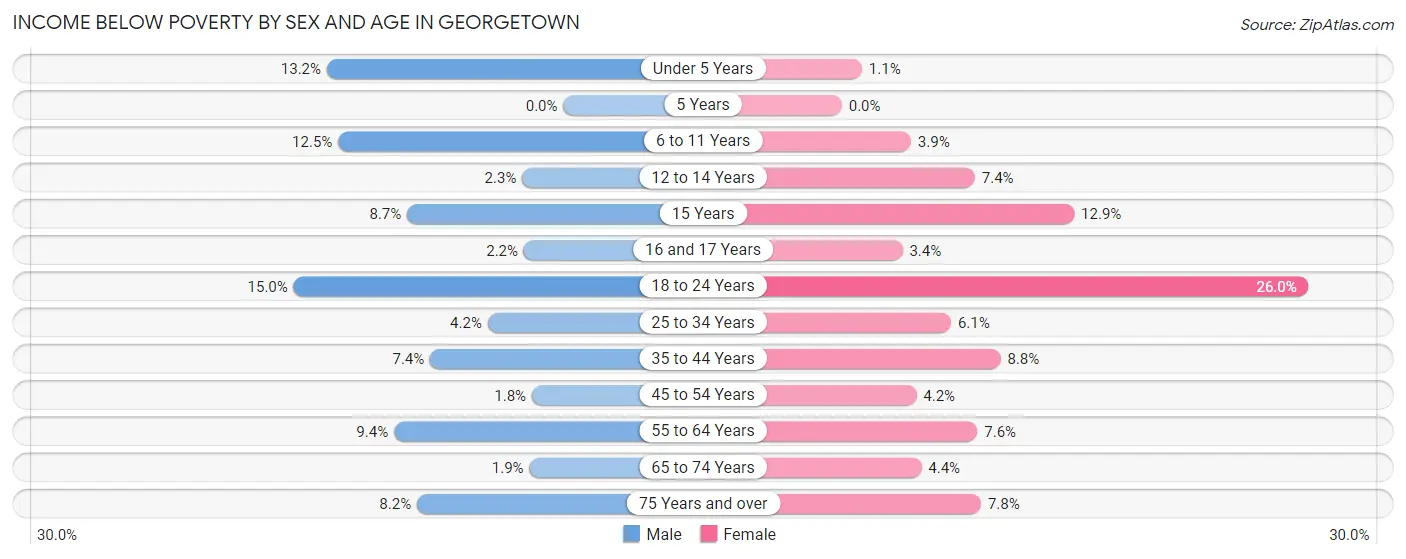
| Age Bracket | Male | Female |
| Under 5 Years | 242 (13.2%) | 18 (1.1%) |
| 5 Years | 0 (0.0%) | 0 (0.0%) |
| 6 to 11 Years | 219 (12.5%) | 96 (3.8%) |
| 12 to 14 Years | 35 (2.3%) | 82 (7.4%) |
| 15 Years | 69 (8.7%) | 59 (12.9%) |
| 16 and 17 Years | 14 (2.2%) | 18 (3.4%) |
| 18 to 24 Years | 356 (15.0%) | 729 (26.0%) |
| 25 to 34 Years | 145 (4.2%) | 238 (6.1%) |
| 35 to 44 Years | 301 (7.4%) | 373 (8.8%) |
| 45 to 54 Years | 67 (1.8%) | 151 (4.2%) |
| 55 to 64 Years | 305 (9.4%) | 335 (7.5%) |
| 65 to 74 Years | 87 (1.9%) | 262 (4.4%) |
| 75 Years and over | 341 (8.2%) | 428 (7.7%) |
| Total | 2,181 (6.7%) | 2,789 (7.5%) |
Income Above Poverty by Sex and Age in Georgetown
According to the poverty statistics in Georgetown, males aged 5 years and females aged 5 years are the age groups that are most secure financially, with 100.0% of males and 100.0% of females in these age groups living above the poverty line.
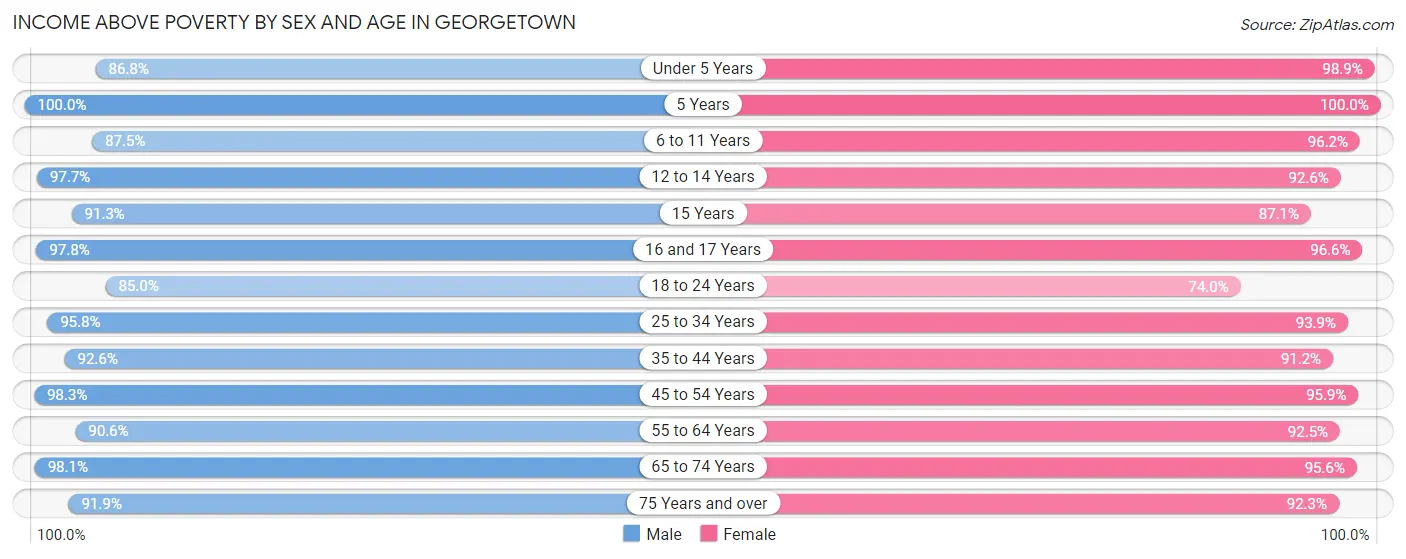
| Age Bracket | Male | Female |
| Under 5 Years | 1,596 (86.8%) | 1,594 (98.9%) |
| 5 Years | 459 (100.0%) | 458 (100.0%) |
| 6 to 11 Years | 1,527 (87.5%) | 2,396 (96.2%) |
| 12 to 14 Years | 1,491 (97.7%) | 1,024 (92.6%) |
| 15 Years | 724 (91.3%) | 397 (87.1%) |
| 16 and 17 Years | 622 (97.8%) | 515 (96.6%) |
| 18 to 24 Years | 2,014 (85.0%) | 2,076 (74.0%) |
| 25 to 34 Years | 3,298 (95.8%) | 3,674 (93.9%) |
| 35 to 44 Years | 3,755 (92.6%) | 3,847 (91.2%) |
| 45 to 54 Years | 3,767 (98.3%) | 3,488 (95.9%) |
| 55 to 64 Years | 2,930 (90.6%) | 4,101 (92.4%) |
| 65 to 74 Years | 4,514 (98.1%) | 5,657 (95.6%) |
| 75 Years and over | 3,845 (91.8%) | 5,092 (92.2%) |
| Total | 30,542 (93.3%) | 34,319 (92.5%) |
Income Below Poverty Among Married-Couple Families in Georgetown
The poverty statistics for married-couple families in Georgetown show that 2.5% or 408 of the total 16,125 families live below the poverty line. Families with 3 or 4 children have the highest poverty rate of 4.7%, comprising of 58 families. On the other hand, families with 5 or more children have the lowest poverty rate of 0.0%, which includes 0 families.
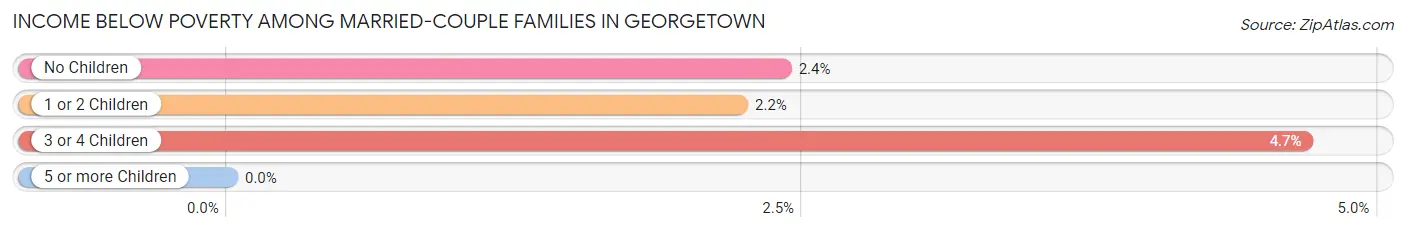
| Children | Above Poverty | Below Poverty |
| No Children | 10,754 (97.6%) | 266 (2.4%) |
| 1 or 2 Children | 3,700 (97.8%) | 84 (2.2%) |
| 3 or 4 Children | 1,180 (95.3%) | 58 (4.7%) |
| 5 or more Children | 83 (100.0%) | 0 (0.0%) |
| Total | 15,717 (97.5%) | 408 (2.5%) |
Income Below Poverty Among Single-Parent Households in Georgetown
According to the poverty data in Georgetown, 8.7% or 75 single-father households and 20.4% or 467 single-mother households are living below the poverty line. Among single-father households, those with no children have the highest poverty rate, with 75 households (21.2%) experiencing poverty. Likewise, among single-mother households, those with 3 or 4 children have the highest poverty rate, with 90 households (23.0%) falling below the poverty line.
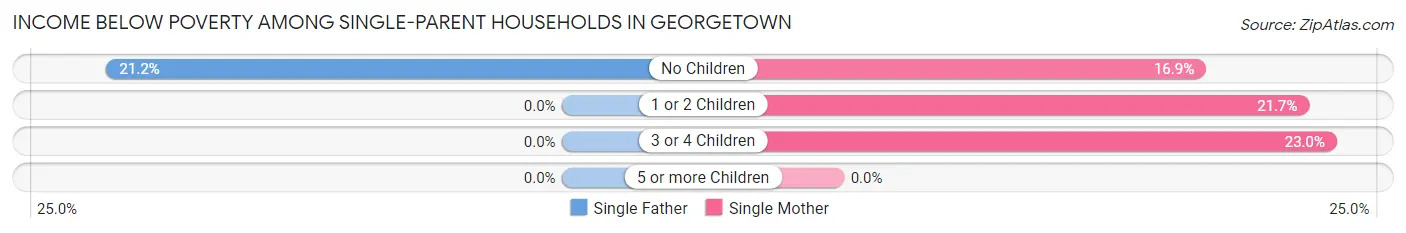
| Children | Single Father | Single Mother |
| No Children | 75 (21.2%) | 122 (16.9%) |
| 1 or 2 Children | 0 (0.0%) | 255 (21.7%) |
| 3 or 4 Children | 0 (0.0%) | 90 (23.0%) |
| 5 or more Children | 0 (0.0%) | 0 (0.0%) |
| Total | 75 (8.7%) | 467 (20.4%) |
Income Below Poverty Among Married-Couple vs Single-Parent Households in Georgetown
The poverty data for Georgetown shows that 408 of the married-couple family households (2.5%) and 542 of the single-parent households (17.2%) are living below the poverty level. Within the married-couple family households, those with 3 or 4 children have the highest poverty rate, with 58 households (4.7%) falling below the poverty line. Among the single-parent households, those with no children have the highest poverty rate, with 197 household (18.3%) living below poverty.
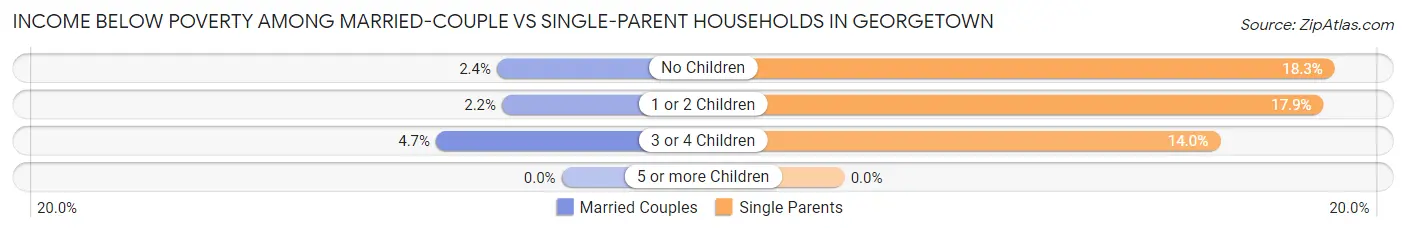
| Children | Married-Couple Families | Single-Parent Households |
| No Children | 266 (2.4%) | 197 (18.3%) |
| 1 or 2 Children | 84 (2.2%) | 255 (17.9%) |
| 3 or 4 Children | 58 (4.7%) | 90 (14.0%) |
| 5 or more Children | 0 (0.0%) | 0 (0.0%) |
| Total | 408 (2.5%) | 542 (17.2%) |
Employment Characteristics in Georgetown
Employment by Class of Employer in Georgetown
Among the 29,963 employed individuals in Georgetown, private company employees (18,563 | 62.0%), not-for-profit organizations (2,708 | 9.0%), and local government employees (2,529 | 8.4%) make up the most common classes of employment.
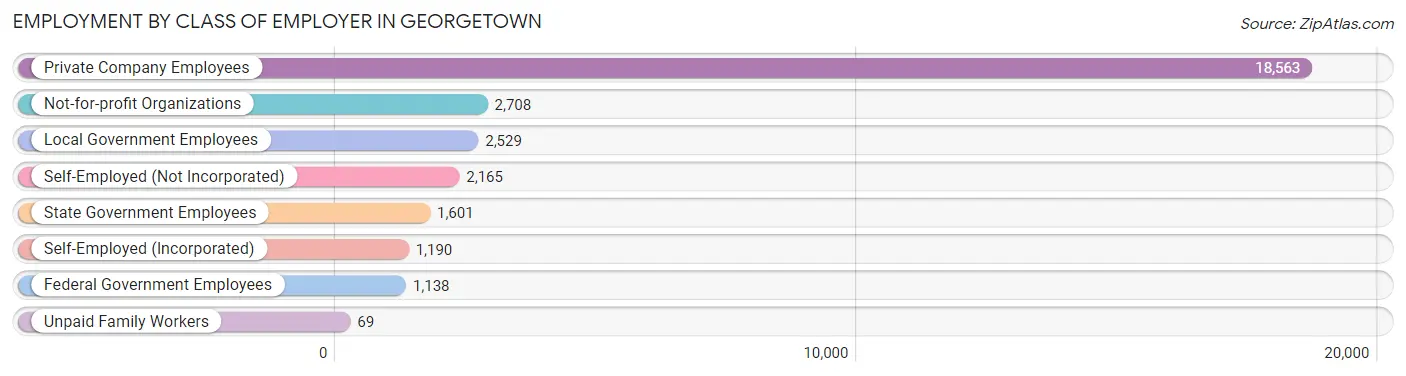
| Employer Class | # Employees | % Employees |
| Private Company Employees | 18,563 | 62.0% |
| Self-Employed (Incorporated) | 1,190 | 4.0% |
| Self-Employed (Not Incorporated) | 2,165 | 7.2% |
| Not-for-profit Organizations | 2,708 | 9.0% |
| Local Government Employees | 2,529 | 8.4% |
| State Government Employees | 1,601 | 5.3% |
| Federal Government Employees | 1,138 | 3.8% |
| Unpaid Family Workers | 69 | 0.2% |
| Total | 29,963 | 100.0% |
Employment Status by Age in Georgetown
According to the labor force statistics for Georgetown, out of the total population over 16 years of age (59,227), 54.5% or 32,279 individuals are in the labor force, with 5.7% or 1,840 of them unemployed. The age group with the highest labor force participation rate is 30 to 34 years, with 87.3% or 3,310 individuals in the labor force. Within the labor force, the 16 to 19 years age range has the highest percentage of unemployed individuals, with 12.5% or 198 of them being unemployed.
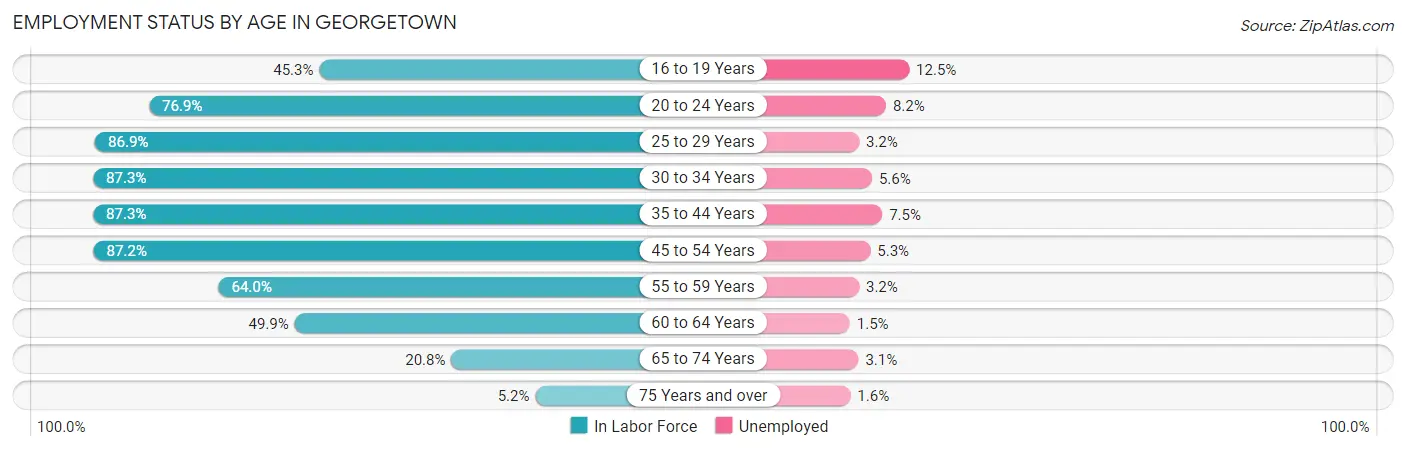
| Age Bracket | In Labor Force | Unemployed |
| 16 to 19 Years | 1,584 (45.3%) | 198 (12.5%) |
| 20 to 24 Years | 3,184 (76.9%) | 261 (8.2%) |
| 25 to 29 Years | 3,265 (86.9%) | 104 (3.2%) |
| 30 to 34 Years | 3,310 (87.3%) | 185 (5.6%) |
| 35 to 44 Years | 7,331 (87.3%) | 550 (7.5%) |
| 45 to 54 Years | 6,550 (87.2%) | 347 (5.3%) |
| 55 to 59 Years | 2,324 (64.0%) | 74 (3.2%) |
| 60 to 64 Years | 2,027 (49.9%) | 30 (1.5%) |
| 65 to 74 Years | 2,206 (20.8%) | 68 (3.1%) |
| 75 Years and over | 511 (5.2%) | 8 (1.6%) |
| Total | 32,279 (54.5%) | 1,840 (5.7%) |
Employment Status by Educational Attainment in Georgetown
According to labor force statistics for Georgetown, 79.6% of individuals (24,797) out of the total population between 25 and 64 years of age (31,152) are in the labor force, with 5.2% or 1,289 of them being unemployed. The group with the highest labor force participation rate are those with the educational attainment of bachelor's degree or higher, with 83.2% or 11,715 individuals in the labor force. Within the labor force, individuals with high school diploma education have the highest percentage of unemployment, with 6.8% or 353 of them being unemployed.
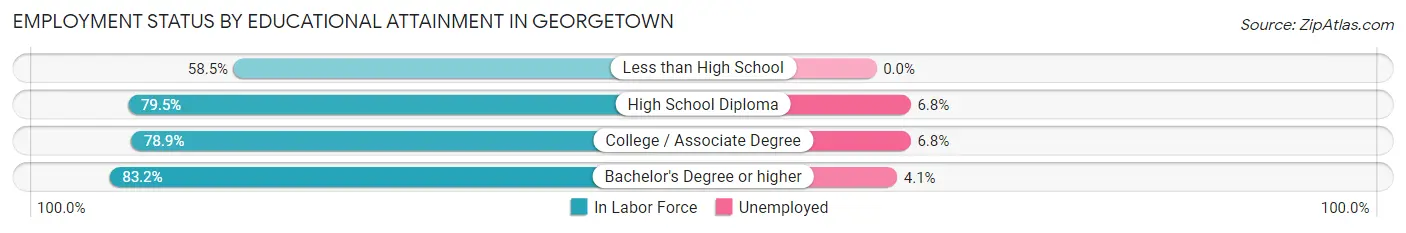
| Educational Attainment | In Labor Force | Unemployed |
| Less than High School | 1,194 (58.5%) | 0 (0.0%) |
| High School Diploma | 5,195 (79.5%) | 444 (6.8%) |
| College / Associate Degree | 6,703 (78.9%) | 578 (6.8%) |
| Bachelor's Degree or higher | 11,715 (83.2%) | 577 (4.1%) |
| Total | 24,797 (79.6%) | 1,620 (5.2%) |
Employment Occupations by Sex in Georgetown
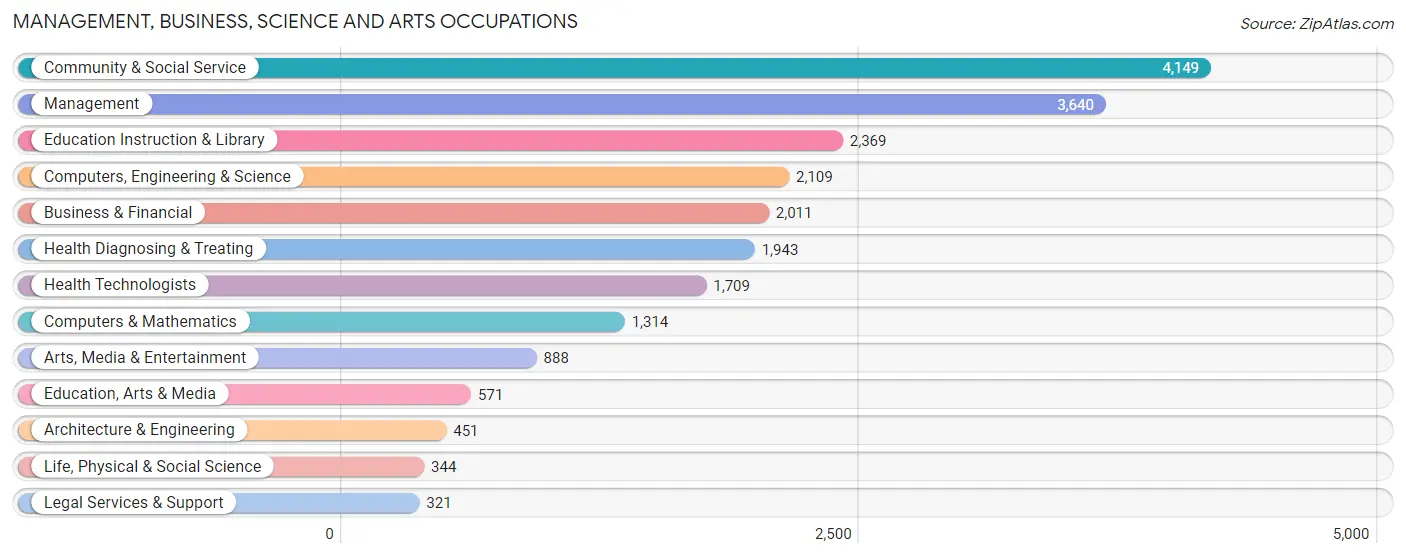
Management, Business, Science and Arts Occupations
The most common Management, Business, Science and Arts occupations in Georgetown are Community & Social Service (4,149 | 13.8%), Management (3,640 | 12.1%), Education Instruction & Library (2,369 | 7.9%), Computers, Engineering & Science (2,109 | 7.0%), and Business & Financial (2,011 | 6.7%).
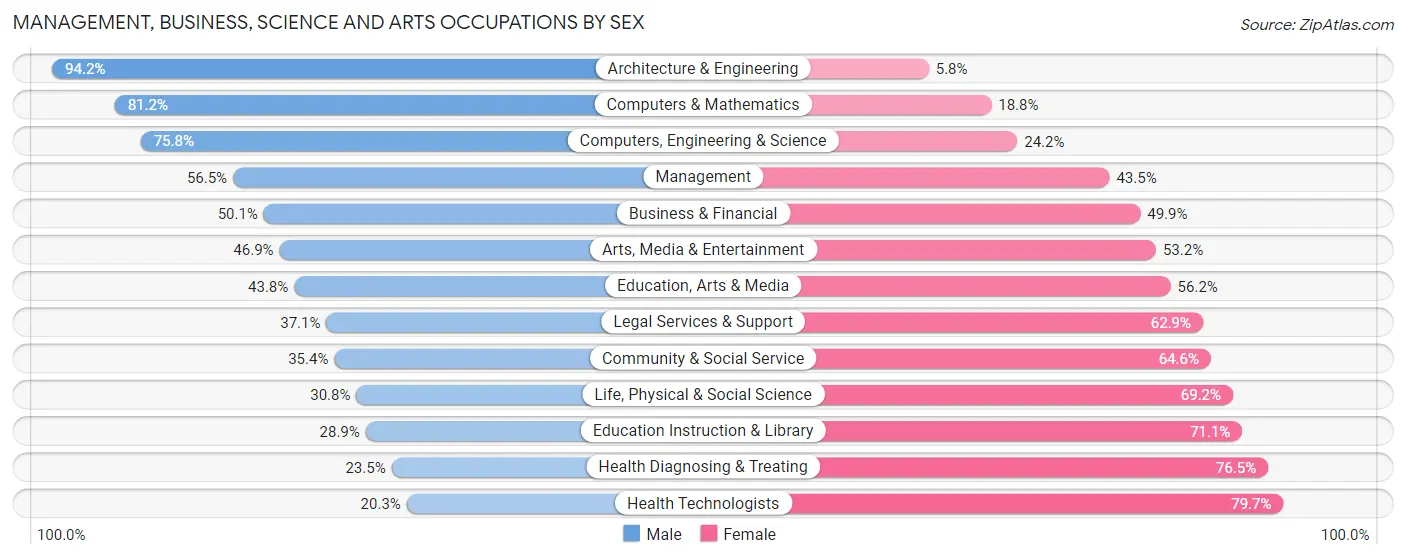
Management, Business, Science and Arts Occupations by Sex
Within the Management, Business, Science and Arts occupations in Georgetown, the most male-oriented occupations are Architecture & Engineering (94.2%), Computers & Mathematics (81.2%), and Computers, Engineering & Science (75.8%), while the most female-oriented occupations are Health Technologists (79.7%), Health Diagnosing & Treating (76.5%), and Education Instruction & Library (71.1%).
| Occupation | Male | Female |
| Management | 2,058 (56.5%) | 1,582 (43.5%) |
| Business & Financial | 1,008 (50.1%) | 1,003 (49.9%) |
| Computers, Engineering & Science | 1,598 (75.8%) | 511 (24.2%) |
| Computers & Mathematics | 1,067 (81.2%) | 247 (18.8%) |
| Architecture & Engineering | 425 (94.2%) | 26 (5.8%) |
| Life, Physical & Social Science | 106 (30.8%) | 238 (69.2%) |
| Community & Social Service | 1,469 (35.4%) | 2,680 (64.6%) |
| Education, Arts & Media | 250 (43.8%) | 321 (56.2%) |
| Legal Services & Support | 119 (37.1%) | 202 (62.9%) |
| Education Instruction & Library | 684 (28.9%) | 1,685 (71.1%) |
| Arts, Media & Entertainment | 416 (46.9%) | 472 (53.1%) |
| Health Diagnosing & Treating | 456 (23.5%) | 1,487 (76.5%) |
| Health Technologists | 347 (20.3%) | 1,362 (79.7%) |
| Total (Category) | 6,589 (47.6%) | 7,263 (52.4%) |
| Total (Overall) | 14,797 (49.4%) | 15,172 (50.6%) |
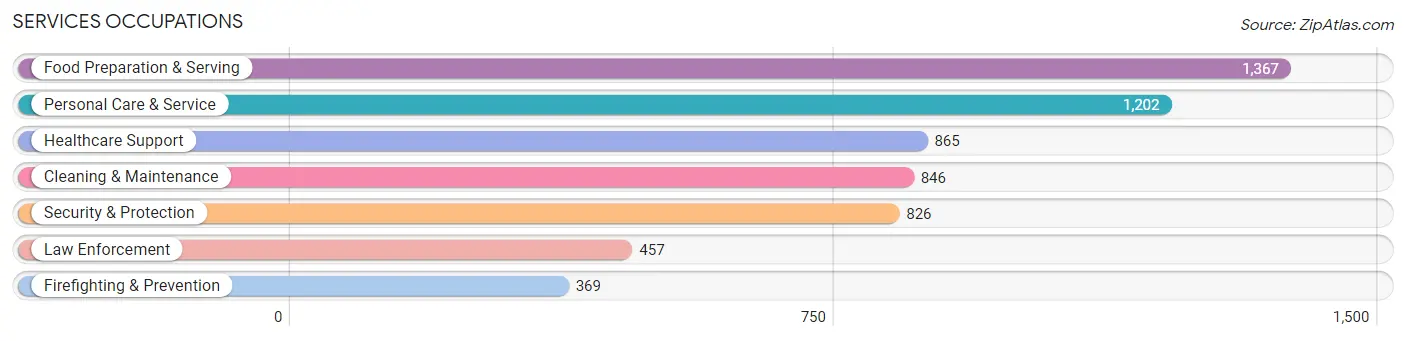
Services Occupations
The most common Services occupations in Georgetown are Food Preparation & Serving (1,367 | 4.6%), Personal Care & Service (1,202 | 4.0%), Healthcare Support (865 | 2.9%), Cleaning & Maintenance (846 | 2.8%), and Security & Protection (826 | 2.8%).
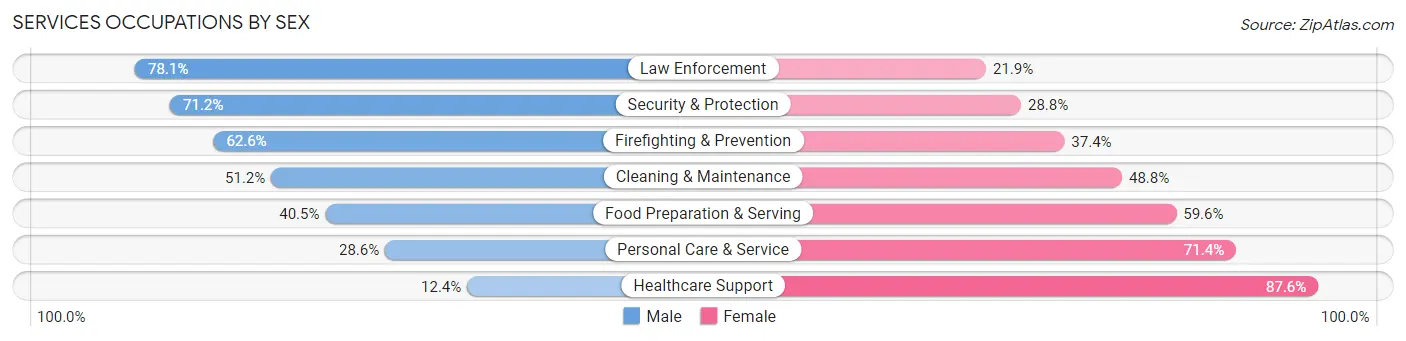
Services Occupations by Sex
Within the Services occupations in Georgetown, the most male-oriented occupations are Law Enforcement (78.1%), Security & Protection (71.2%), and Firefighting & Prevention (62.6%), while the most female-oriented occupations are Healthcare Support (87.6%), Personal Care & Service (71.4%), and Food Preparation & Serving (59.6%).
| Occupation | Male | Female |
| Healthcare Support | 107 (12.4%) | 758 (87.6%) |
| Security & Protection | 588 (71.2%) | 238 (28.8%) |
| Firefighting & Prevention | 231 (62.6%) | 138 (37.4%) |
| Law Enforcement | 357 (78.1%) | 100 (21.9%) |
| Food Preparation & Serving | 553 (40.5%) | 814 (59.6%) |
| Cleaning & Maintenance | 433 (51.2%) | 413 (48.8%) |
| Personal Care & Service | 344 (28.6%) | 858 (71.4%) |
| Total (Category) | 2,025 (39.7%) | 3,081 (60.3%) |
| Total (Overall) | 14,797 (49.4%) | 15,172 (50.6%) |
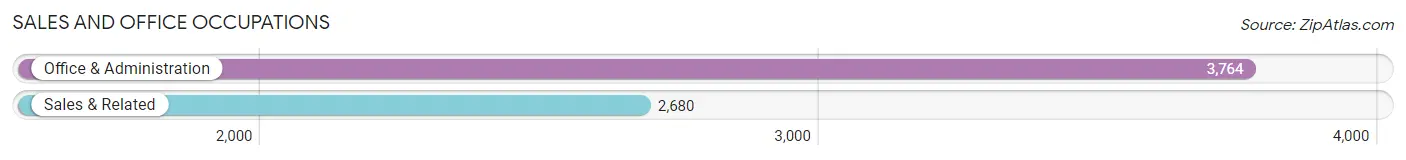
Sales and Office Occupations
The most common Sales and Office occupations in Georgetown are Office & Administration (3,764 | 12.6%), and Sales & Related (2,680 | 8.9%).
Sales and Office Occupations by Sex
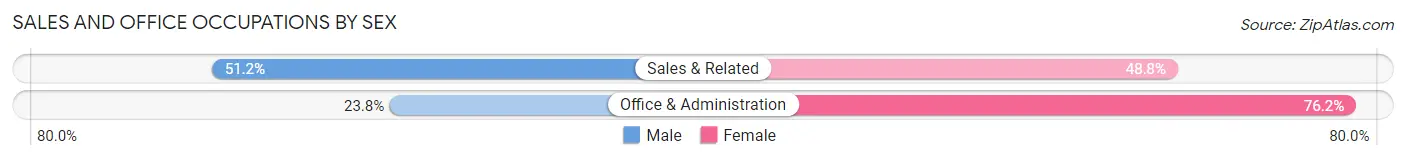
| Occupation | Male | Female |
| Sales & Related | 1,372 (51.2%) | 1,308 (48.8%) |
| Office & Administration | 895 (23.8%) | 2,869 (76.2%) |
| Total (Category) | 2,267 (35.2%) | 4,177 (64.8%) |
| Total (Overall) | 14,797 (49.4%) | 15,172 (50.6%) |
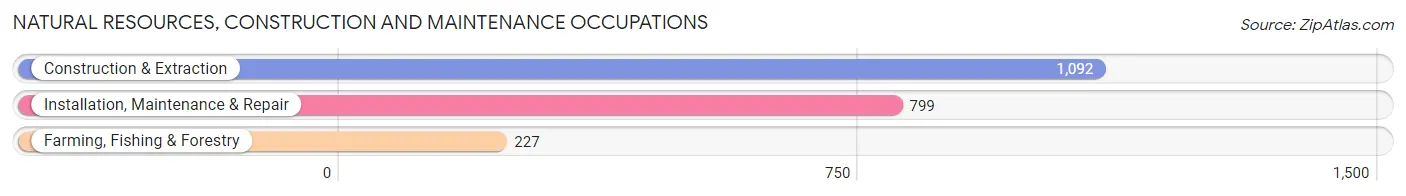
Natural Resources, Construction and Maintenance Occupations
The most common Natural Resources, Construction and Maintenance occupations in Georgetown are Construction & Extraction (1,092 | 3.6%), Installation, Maintenance & Repair (799 | 2.7%), and Farming, Fishing & Forestry (227 | 0.8%).
Natural Resources, Construction and Maintenance Occupations by Sex
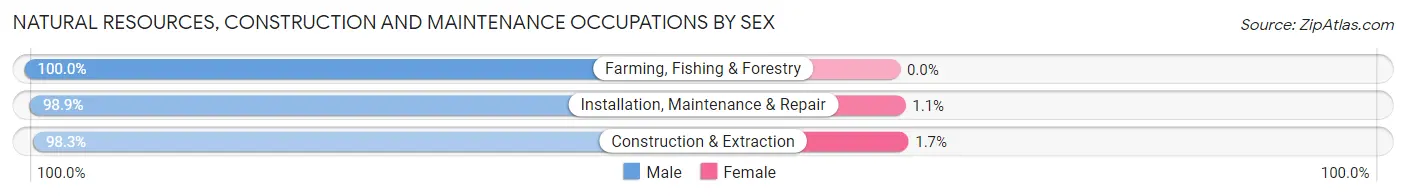
| Occupation | Male | Female |
| Farming, Fishing & Forestry | 227 (100.0%) | 0 (0.0%) |
| Construction & Extraction | 1,073 (98.3%) | 19 (1.7%) |
| Installation, Maintenance & Repair | 790 (98.9%) | 9 (1.1%) |
| Total (Category) | 2,090 (98.7%) | 28 (1.3%) |
| Total (Overall) | 14,797 (49.4%) | 15,172 (50.6%) |
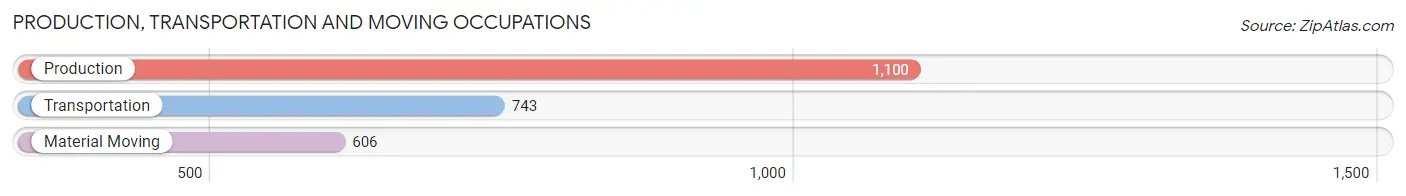
Production, Transportation and Moving Occupations
The most common Production, Transportation and Moving occupations in Georgetown are Production (1,100 | 3.7%), Transportation (743 | 2.5%), and Material Moving (606 | 2.0%).
Production, Transportation and Moving Occupations by Sex
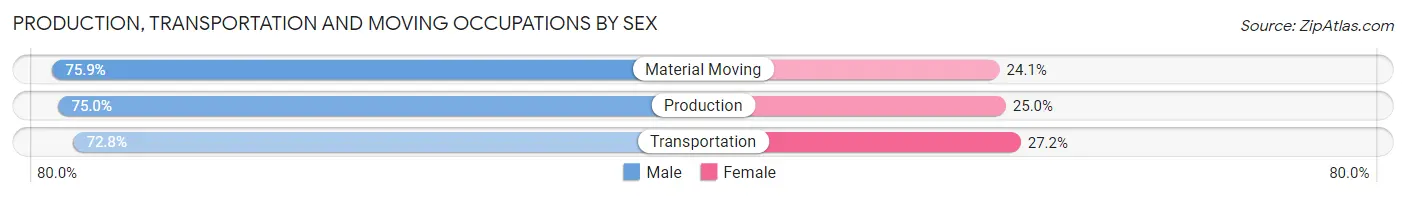
| Occupation | Male | Female |
| Production | 825 (75.0%) | 275 (25.0%) |
| Transportation | 541 (72.8%) | 202 (27.2%) |
| Material Moving | 460 (75.9%) | 146 (24.1%) |
| Total (Category) | 1,826 (74.6%) | 623 (25.4%) |
| Total (Overall) | 14,797 (49.4%) | 15,172 (50.6%) |
Employment Industries by Sex in Georgetown
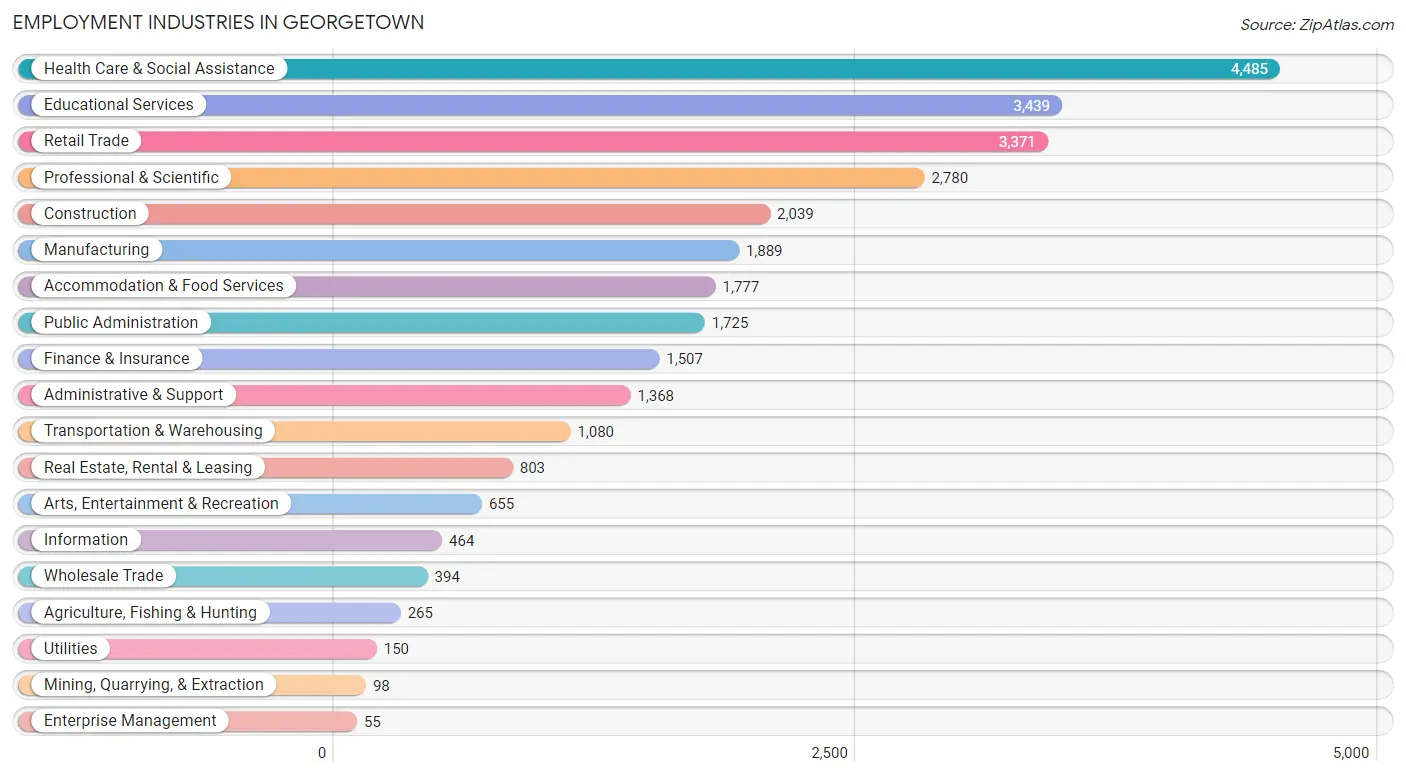
Employment Industries in Georgetown
The major employment industries in Georgetown include Health Care & Social Assistance (4,485 | 15.0%), Educational Services (3,439 | 11.5%), Retail Trade (3,371 | 11.3%), Professional & Scientific (2,780 | 9.3%), and Construction (2,039 | 6.8%).
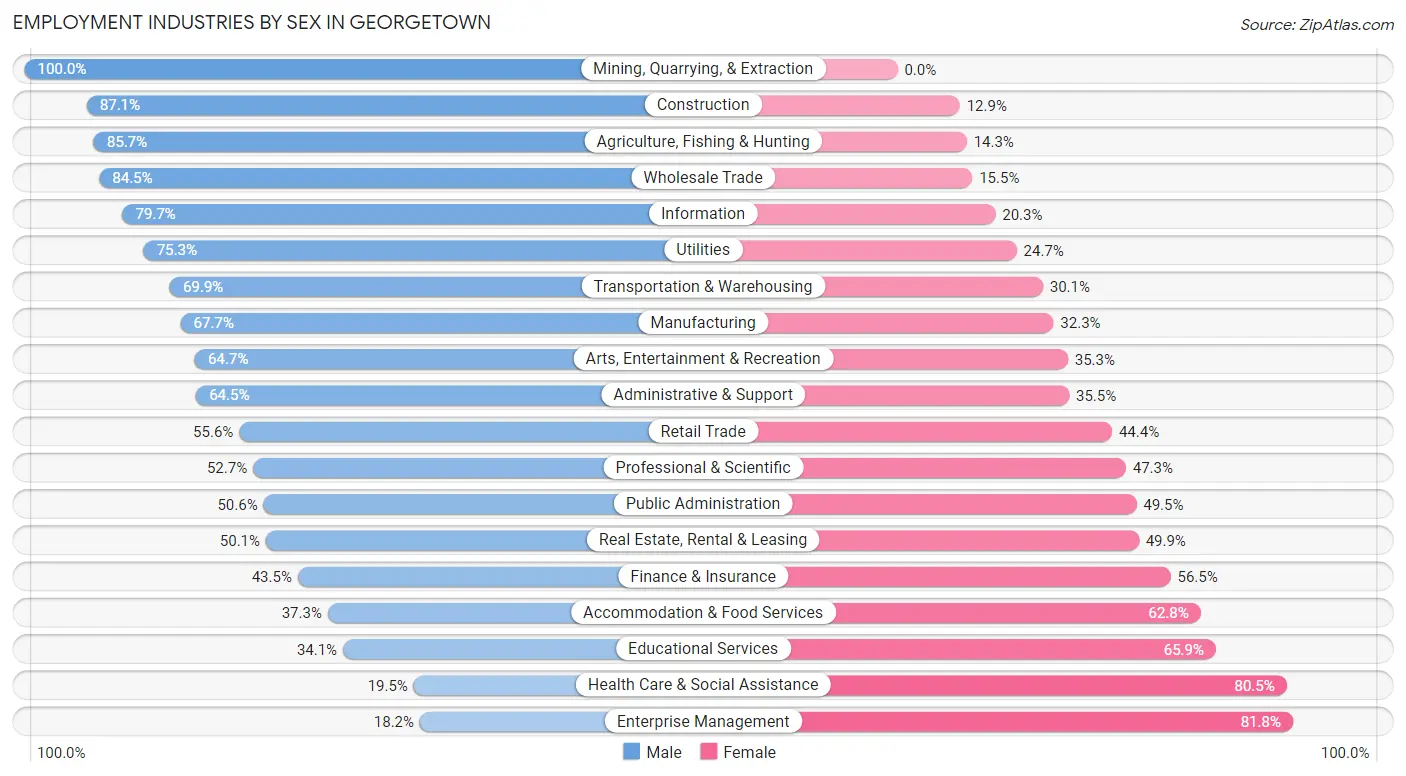
Employment Industries by Sex in Georgetown
The Georgetown industries that see more men than women are Mining, Quarrying, & Extraction (100.0%), Construction (87.1%), and Agriculture, Fishing & Hunting (85.7%), whereas the industries that tend to have a higher number of women are Enterprise Management (81.8%), Health Care & Social Assistance (80.5%), and Educational Services (65.9%).
| Industry | Male | Female |
| Agriculture, Fishing & Hunting | 227 (85.7%) | 38 (14.3%) |
| Mining, Quarrying, & Extraction | 98 (100.0%) | 0 (0.0%) |
| Construction | 1,776 (87.1%) | 263 (12.9%) |
| Manufacturing | 1,279 (67.7%) | 610 (32.3%) |
| Wholesale Trade | 333 (84.5%) | 61 (15.5%) |
| Retail Trade | 1,874 (55.6%) | 1,497 (44.4%) |
| Transportation & Warehousing | 755 (69.9%) | 325 (30.1%) |
| Utilities | 113 (75.3%) | 37 (24.7%) |
| Information | 370 (79.7%) | 94 (20.3%) |
| Finance & Insurance | 655 (43.5%) | 852 (56.5%) |
| Real Estate, Rental & Leasing | 402 (50.1%) | 401 (49.9%) |
| Professional & Scientific | 1,466 (52.7%) | 1,314 (47.3%) |
| Enterprise Management | 10 (18.2%) | 45 (81.8%) |
| Administrative & Support | 882 (64.5%) | 486 (35.5%) |
| Educational Services | 1,173 (34.1%) | 2,266 (65.9%) |
| Health Care & Social Assistance | 873 (19.5%) | 3,612 (80.5%) |
| Arts, Entertainment & Recreation | 424 (64.7%) | 231 (35.3%) |
| Accommodation & Food Services | 662 (37.2%) | 1,115 (62.7%) |
| Public Administration | 872 (50.5%) | 853 (49.4%) |
| Total | 14,797 (49.4%) | 15,172 (50.6%) |
Education in Georgetown
School Enrollment in Georgetown
The most common levels of schooling among the 15,885 students in Georgetown are college / undergraduate (3,869 | 24.4%), elementary school (3,241 | 20.4%), and high school (3,078 | 19.4%).
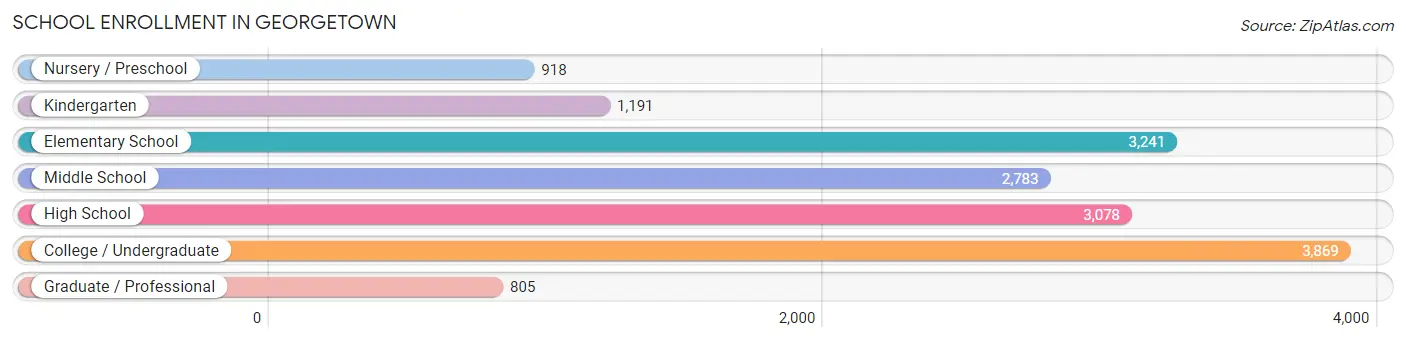
| School Level | # Students | % Students |
| Nursery / Preschool | 918 | 5.8% |
| Kindergarten | 1,191 | 7.5% |
| Elementary School | 3,241 | 20.4% |
| Middle School | 2,783 | 17.5% |
| High School | 3,078 | 19.4% |
| College / Undergraduate | 3,869 | 24.4% |
| Graduate / Professional | 805 | 5.1% |
| Total | 15,885 | 100.0% |
School Enrollment by Age by Funding Source in Georgetown
Out of a total of 15,885 students who are enrolled in schools in Georgetown, 2,430 (15.3%) attend a private institution, while the remaining 13,455 (84.7%) are enrolled in public schools. The age group of 20 to 24 year olds has the highest likelihood of being enrolled in private schools, with 681 (35.9% in the age bracket) enrolled. Conversely, the age group of 15 to 17 year olds has the lowest likelihood of being enrolled in a private school, with 2,149 (95.1% in the age bracket) attending a public institution.
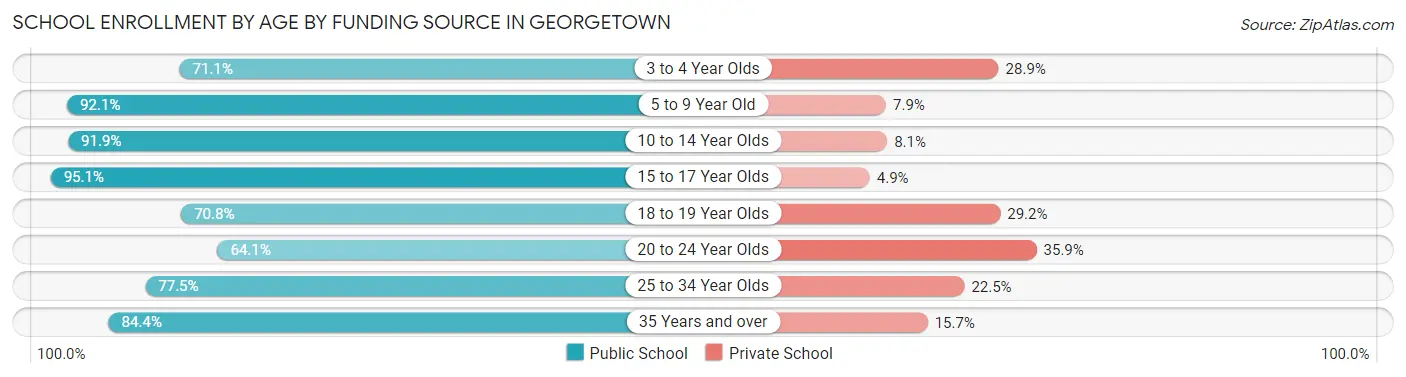
| Age Bracket | Public School | Private School |
| 3 to 4 Year Olds | 547 (71.1%) | 222 (28.9%) |
| 5 to 9 Year Old | 3,825 (92.1%) | 328 (7.9%) |
| 10 to 14 Year Olds | 3,228 (91.9%) | 285 (8.1%) |
| 15 to 17 Year Olds | 2,149 (95.1%) | 110 (4.9%) |
| 18 to 19 Year Olds | 1,250 (70.8%) | 515 (29.2%) |
| 20 to 24 Year Olds | 1,214 (64.1%) | 681 (35.9%) |
| 25 to 34 Year Olds | 503 (77.5%) | 146 (22.5%) |
| 35 Years and over | 744 (84.4%) | 138 (15.7%) |
| Total | 13,455 (84.7%) | 2,430 (15.3%) |
Educational Attainment by Field of Study in Georgetown
Business (5,146 | 19.3%), education (3,449 | 12.9%), science & technology (3,170 | 11.9%), engineering (2,156 | 8.1%), and bio, nature & agricultural (1,698 | 6.4%) are the most common fields of study among 26,678 individuals in Georgetown who have obtained a bachelor's degree or higher.
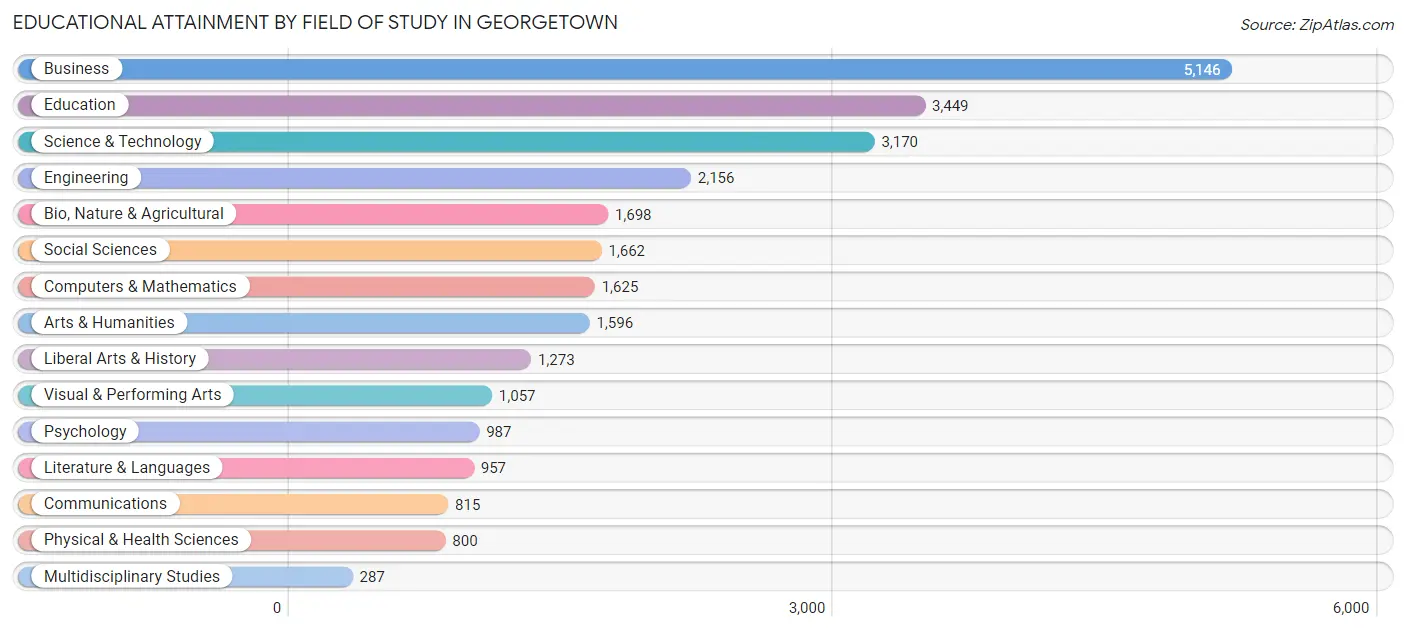
| Field of Study | # Graduates | % Graduates |
| Computers & Mathematics | 1,625 | 6.1% |
| Bio, Nature & Agricultural | 1,698 | 6.4% |
| Physical & Health Sciences | 800 | 3.0% |
| Psychology | 987 | 3.7% |
| Social Sciences | 1,662 | 6.2% |
| Engineering | 2,156 | 8.1% |
| Multidisciplinary Studies | 287 | 1.1% |
| Science & Technology | 3,170 | 11.9% |
| Business | 5,146 | 19.3% |
| Education | 3,449 | 12.9% |
| Literature & Languages | 957 | 3.6% |
| Liberal Arts & History | 1,273 | 4.8% |
| Visual & Performing Arts | 1,057 | 4.0% |
| Communications | 815 | 3.0% |
| Arts & Humanities | 1,596 | 6.0% |
| Total | 26,678 | 100.0% |
Transportation & Commute in Georgetown
Vehicle Availability by Sex in Georgetown
The most prevalent vehicle ownership categories in Georgetown are males with 2 vehicles (7,378, accounting for 50.3%) and females with 2 vehicles (6,977, making up 49.6%).
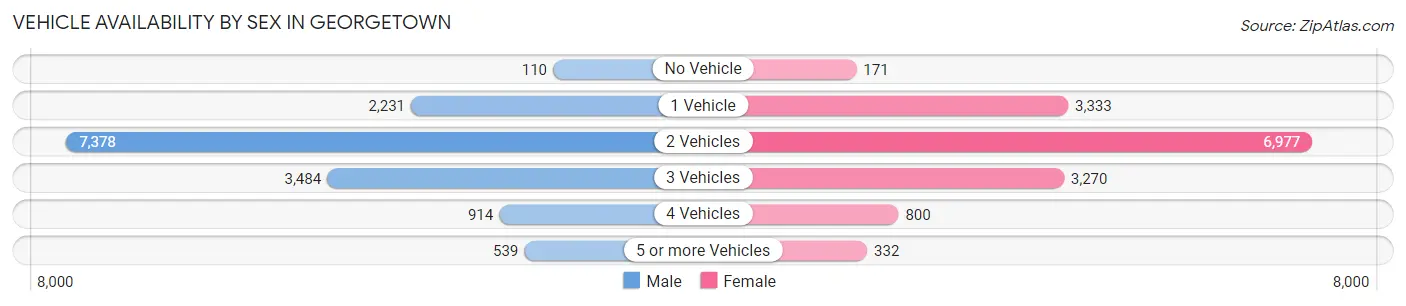
| Vehicles Available | Male | Female |
| No Vehicle | 110 (0.7%) | 171 (1.1%) |
| 1 Vehicle | 2,231 (15.2%) | 3,333 (22.4%) |
| 2 Vehicles | 7,378 (50.3%) | 6,977 (46.9%) |
| 3 Vehicles | 3,484 (23.8%) | 3,270 (22.0%) |
| 4 Vehicles | 914 (6.2%) | 800 (5.4%) |
| 5 or more Vehicles | 539 (3.7%) | 332 (2.2%) |
| Total | 14,656 (100.0%) | 14,883 (100.0%) |
Commute Time in Georgetown
The most frequently occuring commute durations in Georgetown are 15 to 19 minutes (3,991 commuters, 16.4%), 10 to 14 minutes (2,951 commuters, 12.1%), and 30 to 34 minutes (2,851 commuters, 11.7%).
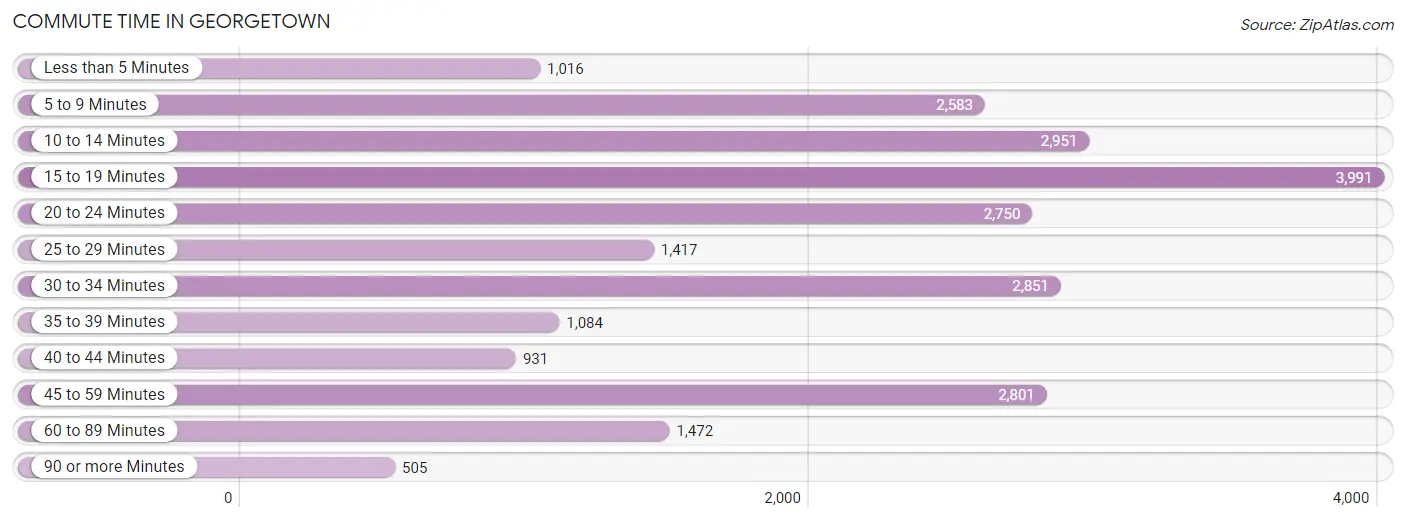
| Commute Time | # Commuters | % Commuters |
| Less than 5 Minutes | 1,016 | 4.2% |
| 5 to 9 Minutes | 2,583 | 10.6% |
| 10 to 14 Minutes | 2,951 | 12.1% |
| 15 to 19 Minutes | 3,991 | 16.4% |
| 20 to 24 Minutes | 2,750 | 11.3% |
| 25 to 29 Minutes | 1,417 | 5.8% |
| 30 to 34 Minutes | 2,851 | 11.7% |
| 35 to 39 Minutes | 1,084 | 4.4% |
| 40 to 44 Minutes | 931 | 3.8% |
| 45 to 59 Minutes | 2,801 | 11.5% |
| 60 to 89 Minutes | 1,472 | 6.0% |
| 90 or more Minutes | 505 | 2.1% |
Commute Time by Sex in Georgetown
The most common commute times in Georgetown are 15 to 19 minutes (1,906 commuters, 15.7%) for males and 15 to 19 minutes (2,085 commuters, 17.1%) for females.
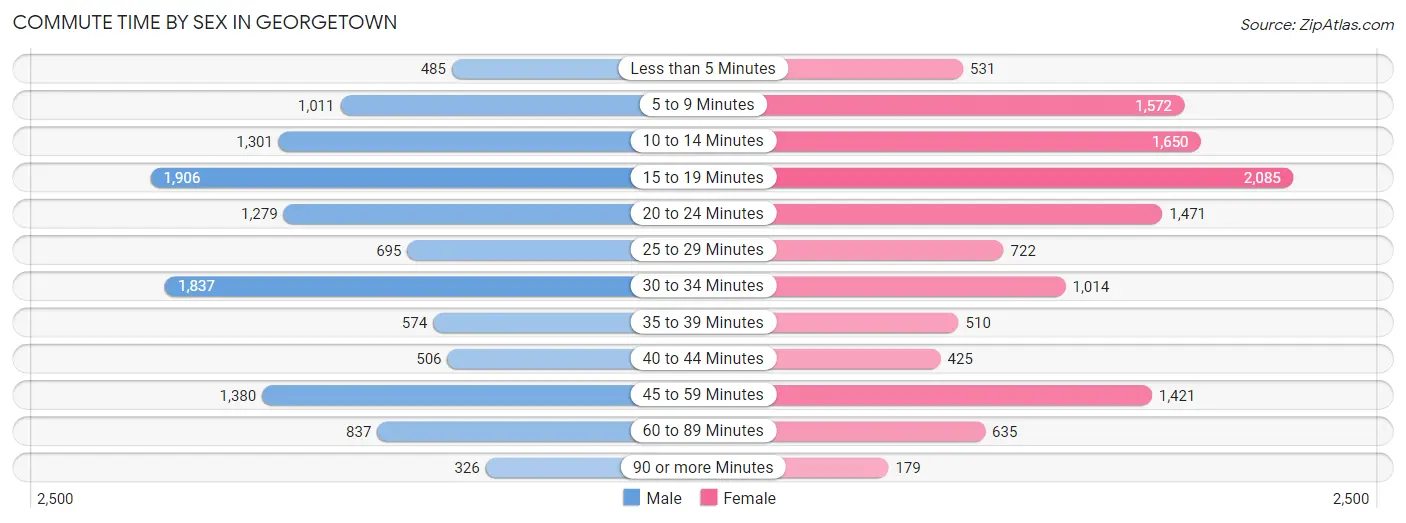
| Commute Time | Male | Female |
| Less than 5 Minutes | 485 (4.0%) | 531 (4.3%) |
| 5 to 9 Minutes | 1,011 (8.3%) | 1,572 (12.9%) |
| 10 to 14 Minutes | 1,301 (10.7%) | 1,650 (13.5%) |
| 15 to 19 Minutes | 1,906 (15.7%) | 2,085 (17.1%) |
| 20 to 24 Minutes | 1,279 (10.5%) | 1,471 (12.0%) |
| 25 to 29 Minutes | 695 (5.7%) | 722 (5.9%) |
| 30 to 34 Minutes | 1,837 (15.1%) | 1,014 (8.3%) |
| 35 to 39 Minutes | 574 (4.7%) | 510 (4.2%) |
| 40 to 44 Minutes | 506 (4.2%) | 425 (3.5%) |
| 45 to 59 Minutes | 1,380 (11.4%) | 1,421 (11.6%) |
| 60 to 89 Minutes | 837 (6.9%) | 635 (5.2%) |
| 90 or more Minutes | 326 (2.7%) | 179 (1.5%) |
Time of Departure to Work by Sex in Georgetown
The most frequent times of departure to work in Georgetown are 6:00 AM to 6:29 AM (1,545, 12.7%) for males and 7:00 AM to 7:29 AM (2,132, 17.4%) for females.
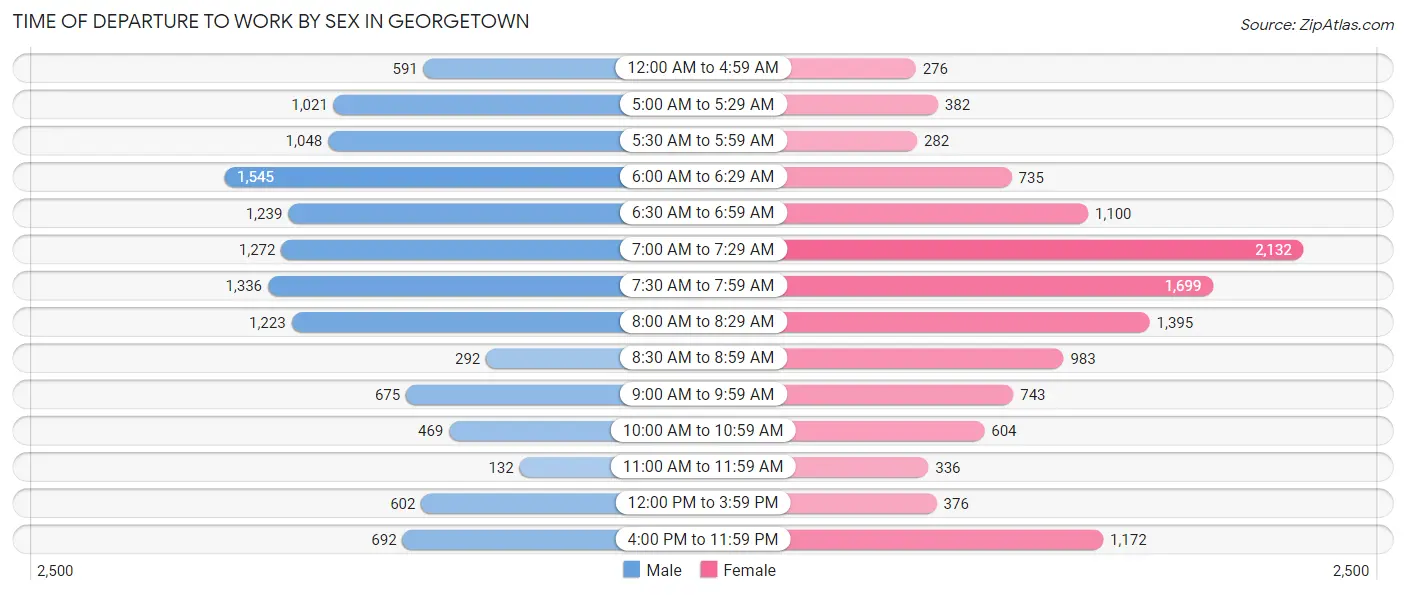
| Time of Departure | Male | Female |
| 12:00 AM to 4:59 AM | 591 (4.9%) | 276 (2.3%) |
| 5:00 AM to 5:29 AM | 1,021 (8.4%) | 382 (3.1%) |
| 5:30 AM to 5:59 AM | 1,048 (8.6%) | 282 (2.3%) |
| 6:00 AM to 6:29 AM | 1,545 (12.7%) | 735 (6.0%) |
| 6:30 AM to 6:59 AM | 1,239 (10.2%) | 1,100 (9.0%) |
| 7:00 AM to 7:29 AM | 1,272 (10.5%) | 2,132 (17.4%) |
| 7:30 AM to 7:59 AM | 1,336 (11.0%) | 1,699 (13.9%) |
| 8:00 AM to 8:29 AM | 1,223 (10.1%) | 1,395 (11.4%) |
| 8:30 AM to 8:59 AM | 292 (2.4%) | 983 (8.1%) |
| 9:00 AM to 9:59 AM | 675 (5.6%) | 743 (6.1%) |
| 10:00 AM to 10:59 AM | 469 (3.9%) | 604 (4.9%) |
| 11:00 AM to 11:59 AM | 132 (1.1%) | 336 (2.8%) |
| 12:00 PM to 3:59 PM | 602 (5.0%) | 376 (3.1%) |
| 4:00 PM to 11:59 PM | 692 (5.7%) | 1,172 (9.6%) |
| Total | 12,137 (100.0%) | 12,215 (100.0%) |
Housing Occupancy in Georgetown
Occupancy by Ownership in Georgetown
Of the total 29,768 dwellings in Georgetown, owner-occupied units account for 21,326 (71.6%), while renter-occupied units make up 8,442 (28.4%).
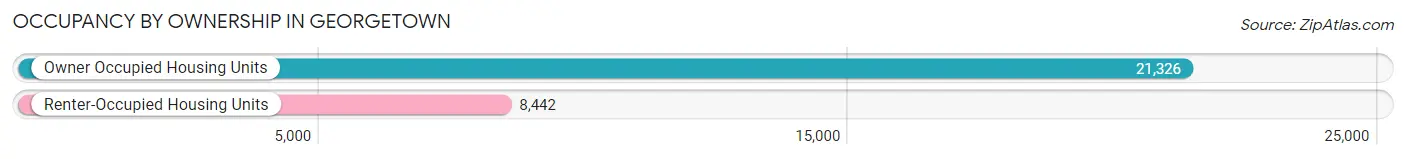
| Occupancy | # Housing Units | % Housing Units |
| Owner Occupied Housing Units | 21,326 | 71.6% |
| Renter-Occupied Housing Units | 8,442 | 28.4% |
| Total Occupied Housing Units | 29,768 | 100.0% |
Occupancy by Household Size in Georgetown
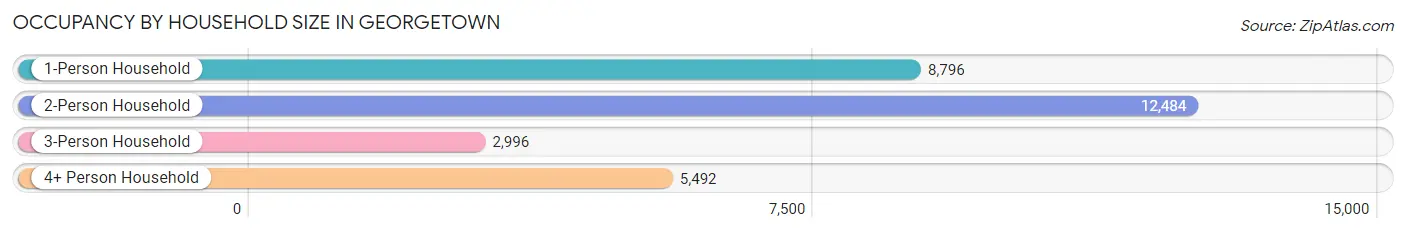
| Household Size | # Housing Units | % Housing Units |
| 1-Person Household | 8,796 | 29.5% |
| 2-Person Household | 12,484 | 41.9% |
| 3-Person Household | 2,996 | 10.1% |
| 4+ Person Household | 5,492 | 18.4% |
| Total Housing Units | 29,768 | 100.0% |
Occupancy by Ownership by Household Size in Georgetown
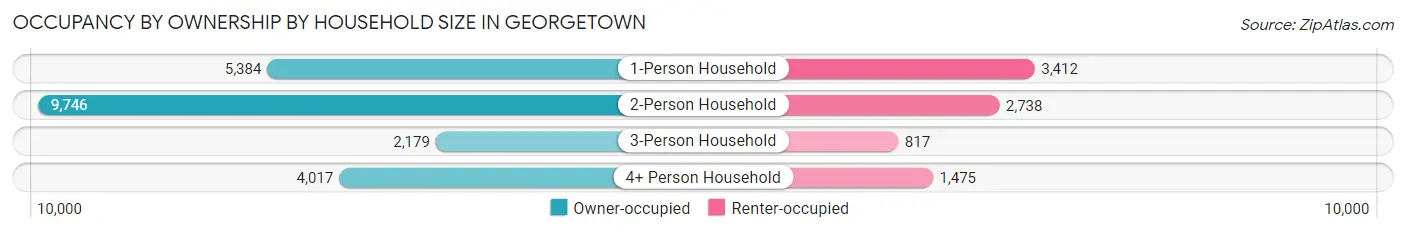
| Household Size | Owner-occupied | Renter-occupied |
| 1-Person Household | 5,384 (61.2%) | 3,412 (38.8%) |
| 2-Person Household | 9,746 (78.1%) | 2,738 (21.9%) |
| 3-Person Household | 2,179 (72.7%) | 817 (27.3%) |
| 4+ Person Household | 4,017 (73.1%) | 1,475 (26.9%) |
| Total Housing Units | 21,326 (71.6%) | 8,442 (28.4%) |
Occupancy by Educational Attainment in Georgetown
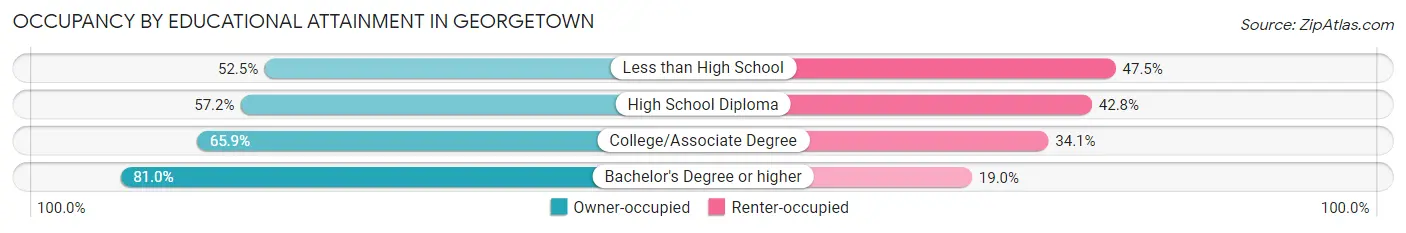
| Household Size | Owner-occupied | Renter-occupied |
| Less than High School | 747 (52.5%) | 675 (47.5%) |
| High School Diploma | 2,480 (57.2%) | 1,853 (42.8%) |
| College/Associate Degree | 5,898 (65.9%) | 3,058 (34.1%) |
| Bachelor's Degree or higher | 12,201 (81.0%) | 2,856 (19.0%) |
Occupancy by Age of Householder in Georgetown
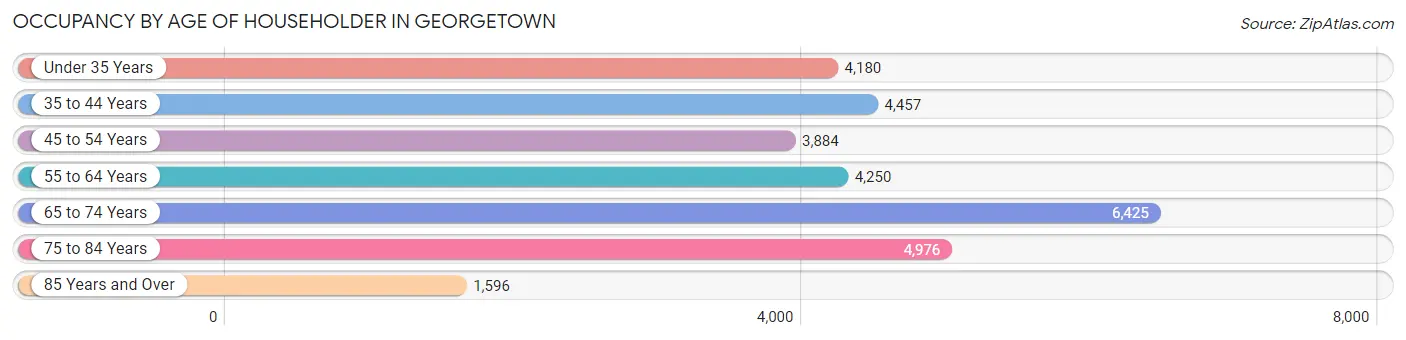
| Age Bracket | # Households | % Households |
| Under 35 Years | 4,180 | 14.0% |
| 35 to 44 Years | 4,457 | 15.0% |
| 45 to 54 Years | 3,884 | 13.1% |
| 55 to 64 Years | 4,250 | 14.3% |
| 65 to 74 Years | 6,425 | 21.6% |
| 75 to 84 Years | 4,976 | 16.7% |
| 85 Years and Over | 1,596 | 5.4% |
| Total | 29,768 | 100.0% |
Housing Finances in Georgetown
Median Income by Occupancy in Georgetown
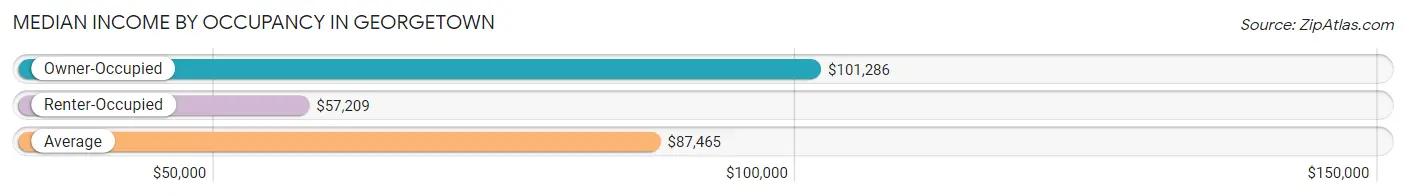
| Occupancy Type | # Households | Median Income |
| Owner-Occupied | 21,326 (71.6%) | $101,286 |
| Renter-Occupied | 8,442 (28.4%) | $57,209 |
| Average | 29,768 (100.0%) | $87,465 |
Occupancy by Householder Income Bracket in Georgetown
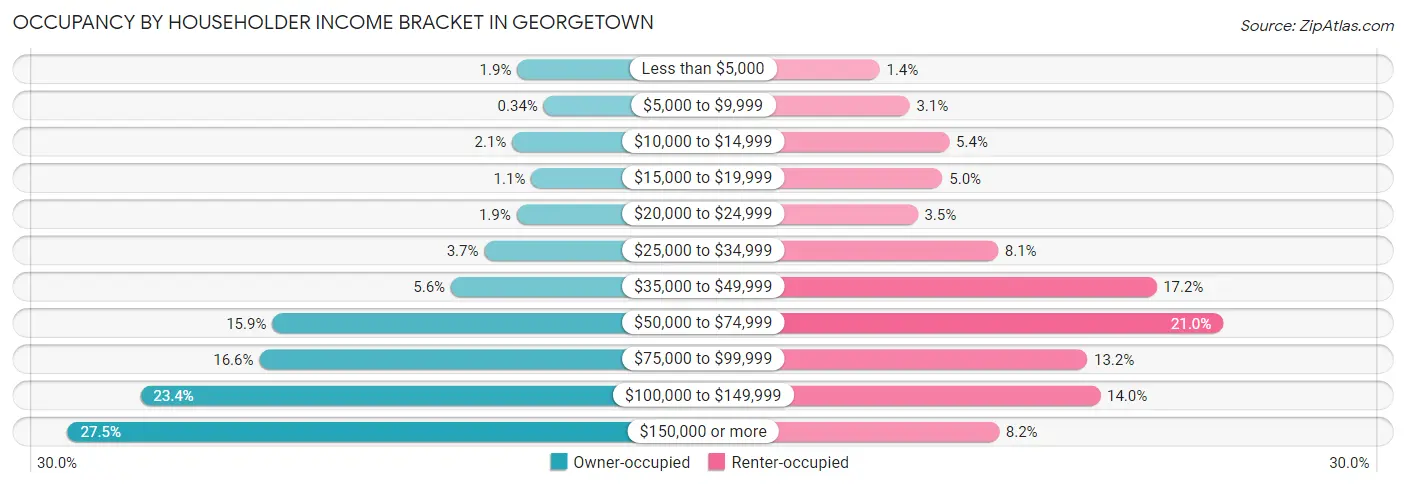
| Income Bracket | Owner-occupied | Renter-occupied |
| Less than $5,000 | 394 (1.8%) | 116 (1.4%) |
| $5,000 to $9,999 | 73 (0.3%) | 260 (3.1%) |
| $10,000 to $14,999 | 456 (2.1%) | 452 (5.3%) |
| $15,000 to $19,999 | 223 (1.1%) | 419 (5.0%) |
| $20,000 to $24,999 | 403 (1.9%) | 299 (3.5%) |
| $25,000 to $34,999 | 796 (3.7%) | 686 (8.1%) |
| $35,000 to $49,999 | 1,202 (5.6%) | 1,450 (17.2%) |
| $50,000 to $74,999 | 3,381 (15.9%) | 1,773 (21.0%) |
| $75,000 to $99,999 | 3,539 (16.6%) | 1,117 (13.2%) |
| $100,000 to $149,999 | 4,985 (23.4%) | 1,179 (14.0%) |
| $150,000 or more | 5,874 (27.5%) | 691 (8.2%) |
| Total | 21,326 (100.0%) | 8,442 (100.0%) |
Monthly Housing Cost Tiers in Georgetown
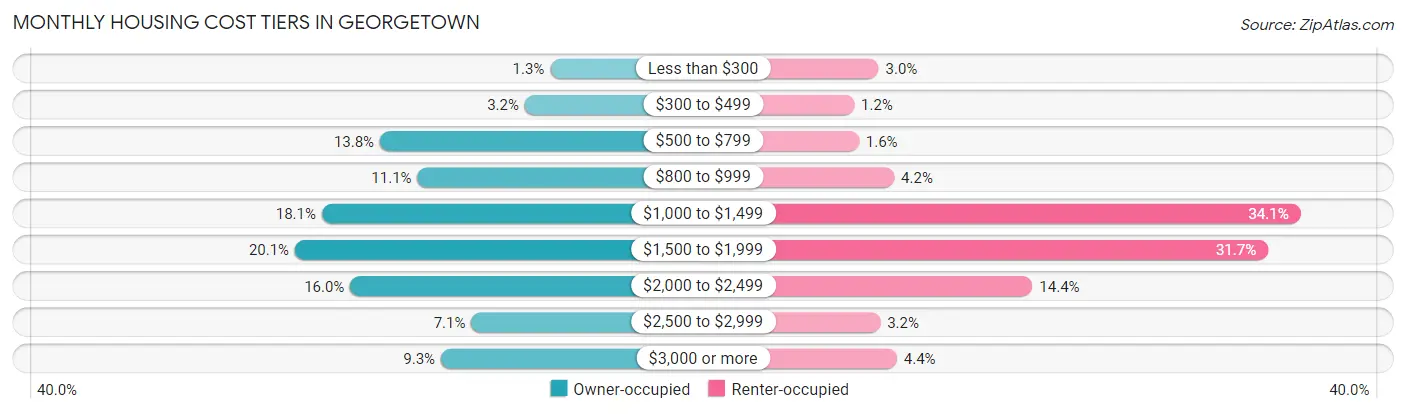
| Monthly Cost | Owner-occupied | Renter-occupied |
| Less than $300 | 276 (1.3%) | 256 (3.0%) |
| $300 to $499 | 673 (3.2%) | 104 (1.2%) |
| $500 to $799 | 2,949 (13.8%) | 133 (1.6%) |
| $800 to $999 | 2,361 (11.1%) | 353 (4.2%) |
| $1,000 to $1,499 | 3,862 (18.1%) | 2,879 (34.1%) |
| $1,500 to $1,999 | 4,284 (20.1%) | 2,677 (31.7%) |
| $2,000 to $2,499 | 3,416 (16.0%) | 1,212 (14.4%) |
| $2,500 to $2,999 | 1,514 (7.1%) | 266 (3.2%) |
| $3,000 or more | 1,991 (9.3%) | 370 (4.4%) |
| Total | 21,326 (100.0%) | 8,442 (100.0%) |
Physical Housing Characteristics in Georgetown
Housing Structures in Georgetown
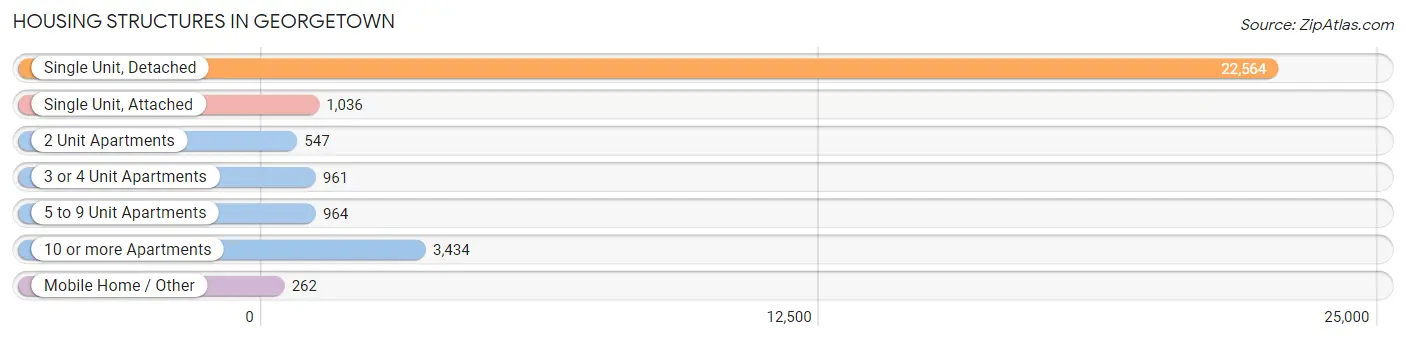
| Structure Type | # Housing Units | % Housing Units |
| Single Unit, Detached | 22,564 | 75.8% |
| Single Unit, Attached | 1,036 | 3.5% |
| 2 Unit Apartments | 547 | 1.8% |
| 3 or 4 Unit Apartments | 961 | 3.2% |
| 5 to 9 Unit Apartments | 964 | 3.2% |
| 10 or more Apartments | 3,434 | 11.5% |
| Mobile Home / Other | 262 | 0.9% |
| Total | 29,768 | 100.0% |
Housing Structures by Occupancy in Georgetown
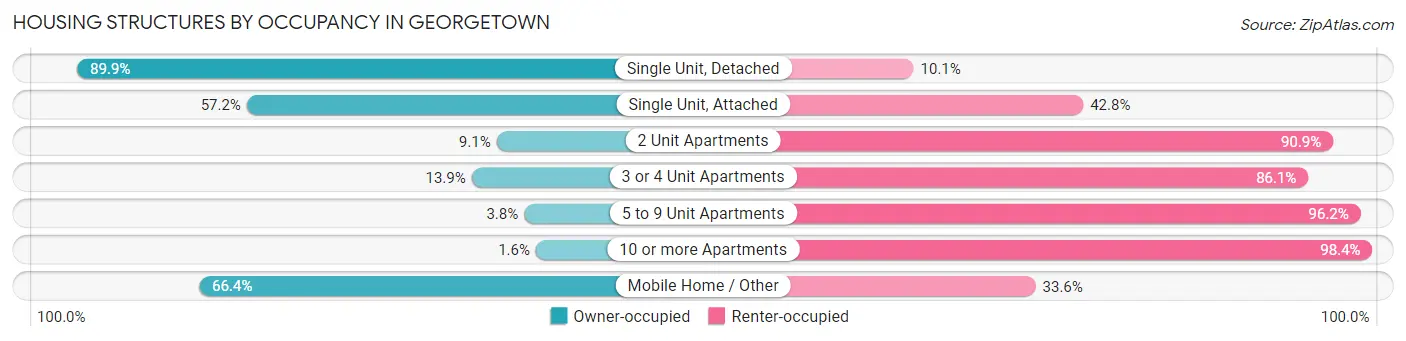
| Structure Type | Owner-occupied | Renter-occupied |
| Single Unit, Detached | 20,284 (89.9%) | 2,280 (10.1%) |
| Single Unit, Attached | 593 (57.2%) | 443 (42.8%) |
| 2 Unit Apartments | 50 (9.1%) | 497 (90.9%) |
| 3 or 4 Unit Apartments | 134 (13.9%) | 827 (86.1%) |
| 5 to 9 Unit Apartments | 37 (3.8%) | 927 (96.2%) |
| 10 or more Apartments | 54 (1.6%) | 3,380 (98.4%) |
| Mobile Home / Other | 174 (66.4%) | 88 (33.6%) |
| Total | 21,326 (71.6%) | 8,442 (28.4%) |
Housing Structures by Number of Rooms in Georgetown
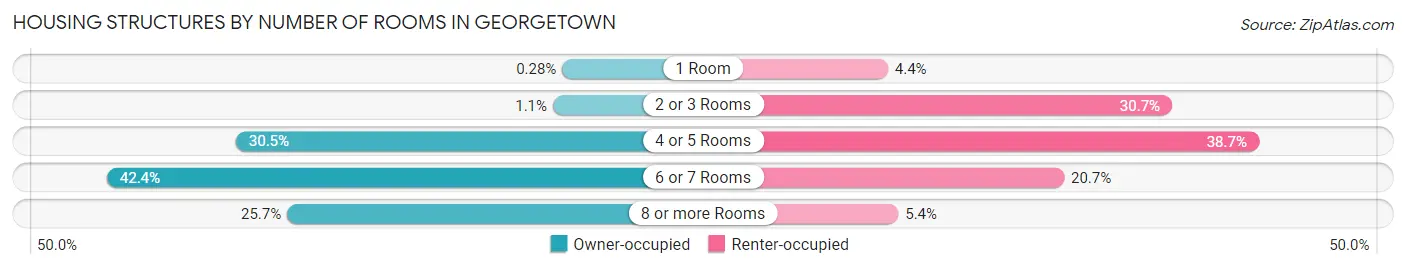
| Number of Rooms | Owner-occupied | Renter-occupied |
| 1 Room | 59 (0.3%) | 374 (4.4%) |
| 2 or 3 Rooms | 244 (1.1%) | 2,592 (30.7%) |
| 4 or 5 Rooms | 6,496 (30.5%) | 3,270 (38.7%) |
| 6 or 7 Rooms | 9,040 (42.4%) | 1,750 (20.7%) |
| 8 or more Rooms | 5,487 (25.7%) | 456 (5.4%) |
| Total | 21,326 (100.0%) | 8,442 (100.0%) |
Housing Structure by Heating Type in Georgetown
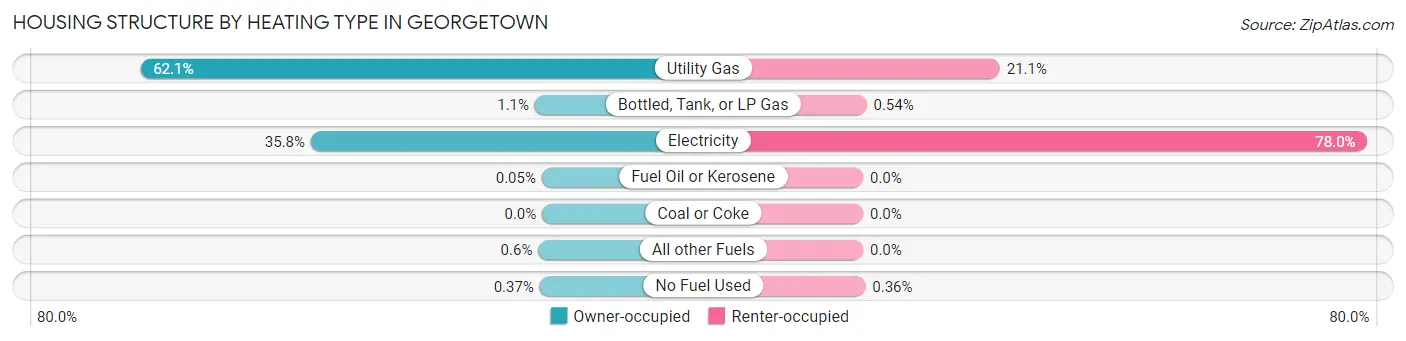
| Heating Type | Owner-occupied | Renter-occupied |
| Utility Gas | 13,247 (62.1%) | 1,785 (21.1%) |
| Bottled, Tank, or LP Gas | 238 (1.1%) | 46 (0.5%) |
| Electricity | 7,623 (35.7%) | 6,581 (78.0%) |
| Fuel Oil or Kerosene | 11 (0.1%) | 0 (0.0%) |
| Coal or Coke | 0 (0.0%) | 0 (0.0%) |
| All other Fuels | 129 (0.6%) | 0 (0.0%) |
| No Fuel Used | 78 (0.4%) | 30 (0.4%) |
| Total | 21,326 (100.0%) | 8,442 (100.0%) |
Household Vehicle Usage in Georgetown
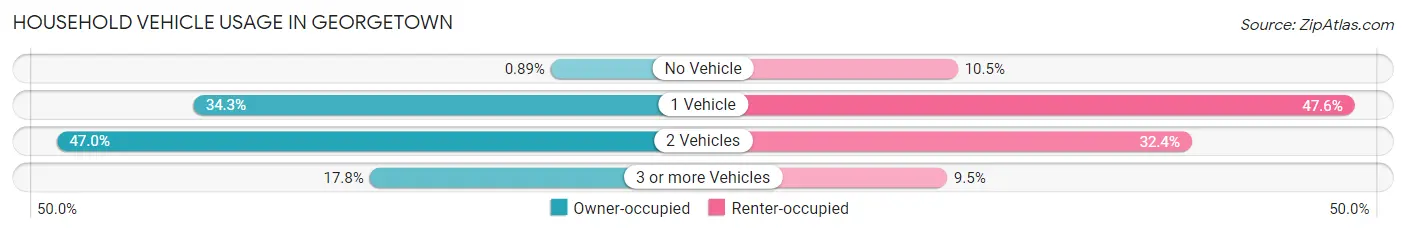
| Vehicles per Household | Owner-occupied | Renter-occupied |
| No Vehicle | 190 (0.9%) | 889 (10.5%) |
| 1 Vehicle | 7,314 (34.3%) | 4,016 (47.6%) |
| 2 Vehicles | 10,027 (47.0%) | 2,733 (32.4%) |
| 3 or more Vehicles | 3,795 (17.8%) | 804 (9.5%) |
| Total | 21,326 (100.0%) | 8,442 (100.0%) |
Real Estate & Mortgages in Georgetown
Real Estate and Mortgage Overview in Georgetown
| Characteristic | Without Mortgage | With Mortgage |
| Housing Units | 8,661 | 12,665 |
| Median Property Value | $360,000 | $362,700 |
| Median Household Income | $86,022 | $3,986 |
| Monthly Housing Costs | $843 | $1,917 |
| Real Estate Taxes | $5,607 | $188 |
Property Value by Mortgage Status in Georgetown
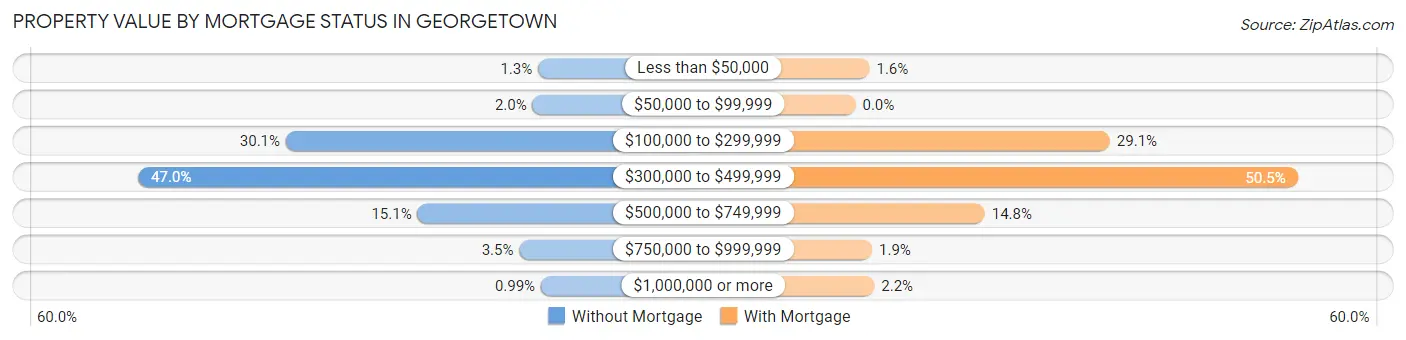
| Property Value | Without Mortgage | With Mortgage |
| Less than $50,000 | 114 (1.3%) | 203 (1.6%) |
| $50,000 to $99,999 | 169 (1.9%) | 0 (0.0%) |
| $100,000 to $299,999 | 2,610 (30.1%) | 3,682 (29.1%) |
| $300,000 to $499,999 | 4,074 (47.0%) | 6,398 (50.5%) |
| $500,000 to $749,999 | 1,308 (15.1%) | 1,870 (14.8%) |
| $750,000 to $999,999 | 300 (3.5%) | 240 (1.9%) |
| $1,000,000 or more | 86 (1.0%) | 272 (2.1%) |
| Total | 8,661 (100.0%) | 12,665 (100.0%) |
Household Income by Mortgage Status in Georgetown
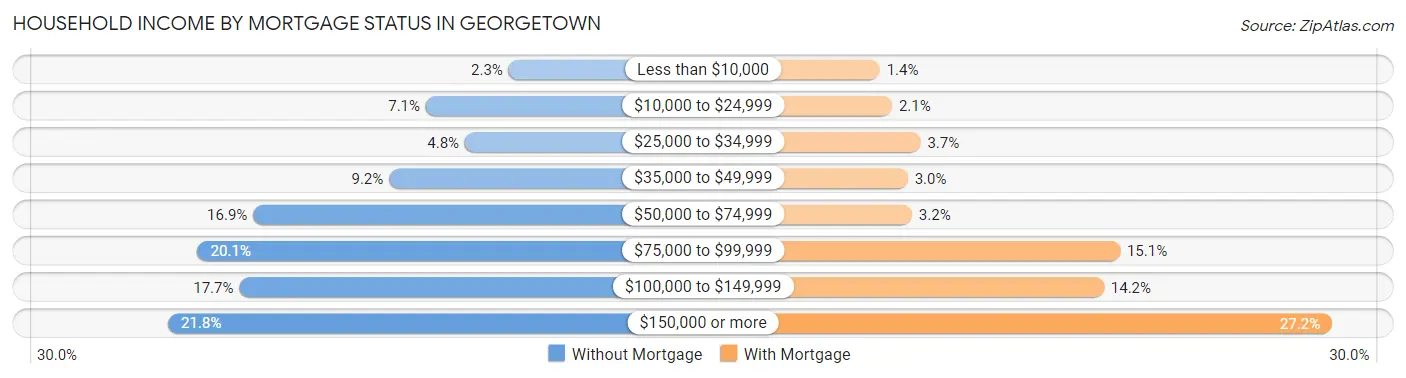
| Household Income | Without Mortgage | With Mortgage |
| Less than $10,000 | 203 (2.3%) | 175 (1.4%) |
| $10,000 to $24,999 | 612 (7.1%) | 264 (2.1%) |
| $25,000 to $34,999 | 419 (4.8%) | 470 (3.7%) |
| $35,000 to $49,999 | 794 (9.2%) | 377 (3.0%) |
| $50,000 to $74,999 | 1,467 (16.9%) | 408 (3.2%) |
| $75,000 to $99,999 | 1,742 (20.1%) | 1,914 (15.1%) |
| $100,000 to $149,999 | 1,536 (17.7%) | 1,797 (14.2%) |
| $150,000 or more | 1,888 (21.8%) | 3,449 (27.2%) |
| Total | 8,661 (100.0%) | 12,665 (100.0%) |
Property Value to Household Income Ratio in Georgetown
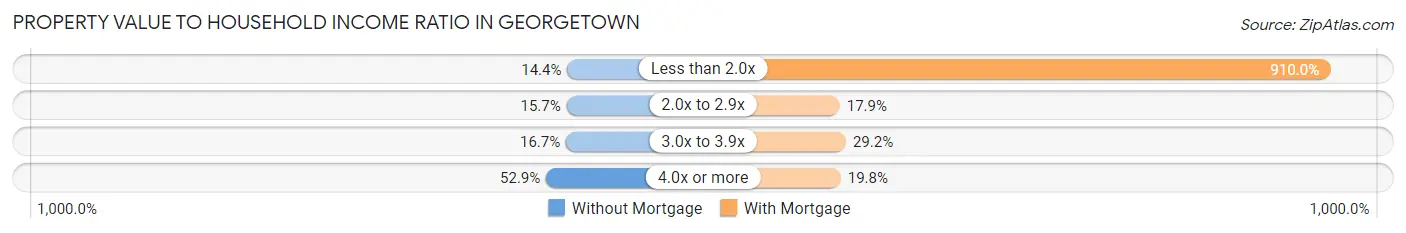
| Value-to-Income Ratio | Without Mortgage | With Mortgage |
| Less than 2.0x | 1,244 (14.4%) | 115,253 (910.0%) |
| 2.0x to 2.9x | 1,361 (15.7%) | 2,266 (17.9%) |
| 3.0x to 3.9x | 1,444 (16.7%) | 3,701 (29.2%) |
| 4.0x or more | 4,581 (52.9%) | 2,502 (19.8%) |
| Total | 8,661 (100.0%) | 12,665 (100.0%) |
Real Estate Taxes by Mortgage Status in Georgetown
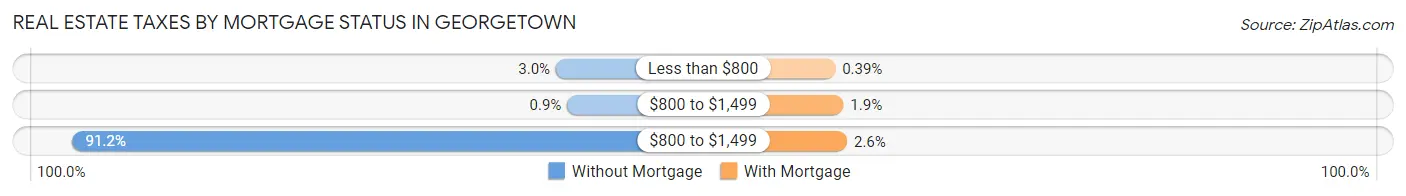
| Property Taxes | Without Mortgage | With Mortgage |
| Less than $800 | 256 (3.0%) | 50 (0.4%) |
| $800 to $1,499 | 78 (0.9%) | 239 (1.9%) |
| $800 to $1,499 | 7,902 (91.2%) | 324 (2.6%) |
| Total | 8,661 (100.0%) | 12,665 (100.0%) |
Health & Disability in Georgetown
Health Insurance Coverage by Age in Georgetown
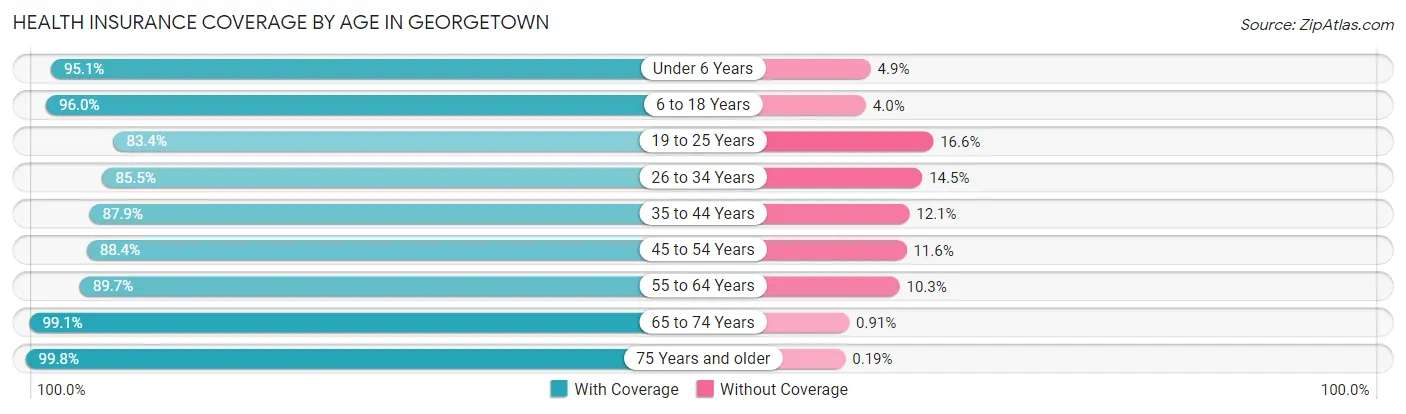
| Age Bracket | With Coverage | Without Coverage |
| Under 6 Years | 4,174 (95.1%) | 216 (4.9%) |
| 6 to 18 Years | 9,766 (96.0%) | 410 (4.0%) |
| 19 to 25 Years | 5,068 (83.4%) | 1,008 (16.6%) |
| 26 to 34 Years | 5,498 (85.5%) | 935 (14.5%) |
| 35 to 44 Years | 7,154 (87.9%) | 988 (12.1%) |
| 45 to 54 Years | 6,547 (88.4%) | 859 (11.6%) |
| 55 to 64 Years | 6,881 (89.7%) | 790 (10.3%) |
| 65 to 74 Years | 10,424 (99.1%) | 96 (0.9%) |
| 75 Years and older | 9,688 (99.8%) | 18 (0.2%) |
| Total | 65,200 (92.5%) | 5,320 (7.5%) |
Health Insurance Coverage by Citizenship Status in Georgetown
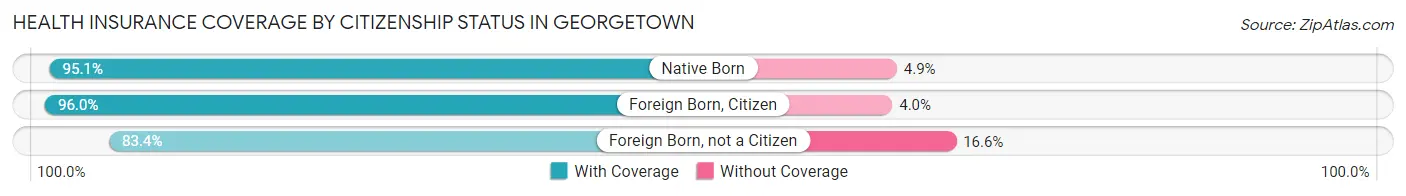
| Citizenship Status | With Coverage | Without Coverage |
| Native Born | 4,174 (95.1%) | 216 (4.9%) |
| Foreign Born, Citizen | 9,766 (96.0%) | 410 (4.0%) |
| Foreign Born, not a Citizen | 5,068 (83.4%) | 1,008 (16.6%) |
Health Insurance Coverage by Household Income in Georgetown
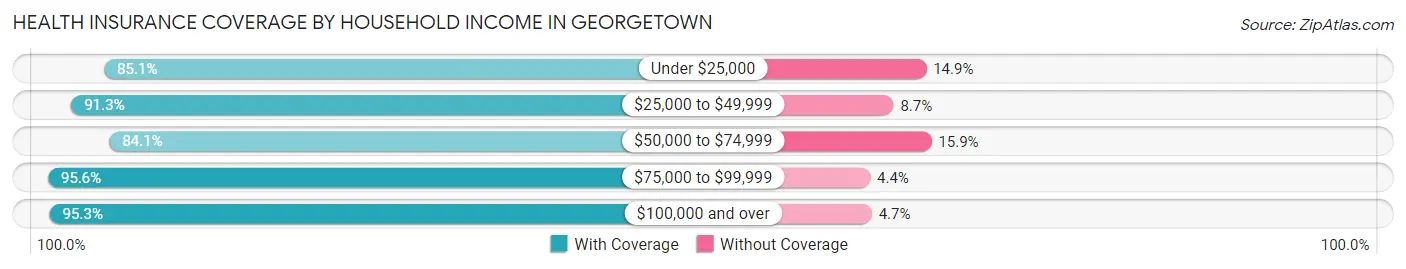
| Household Income | With Coverage | Without Coverage |
| Under $25,000 | 3,999 (85.1%) | 699 (14.9%) |
| $25,000 to $49,999 | 6,704 (91.3%) | 642 (8.7%) |
| $50,000 to $74,999 | 9,185 (84.1%) | 1,731 (15.9%) |
| $75,000 to $99,999 | 10,312 (95.6%) | 470 (4.4%) |
| $100,000 and over | 33,790 (95.3%) | 1,654 (4.7%) |
Public vs Private Health Insurance Coverage by Age in Georgetown
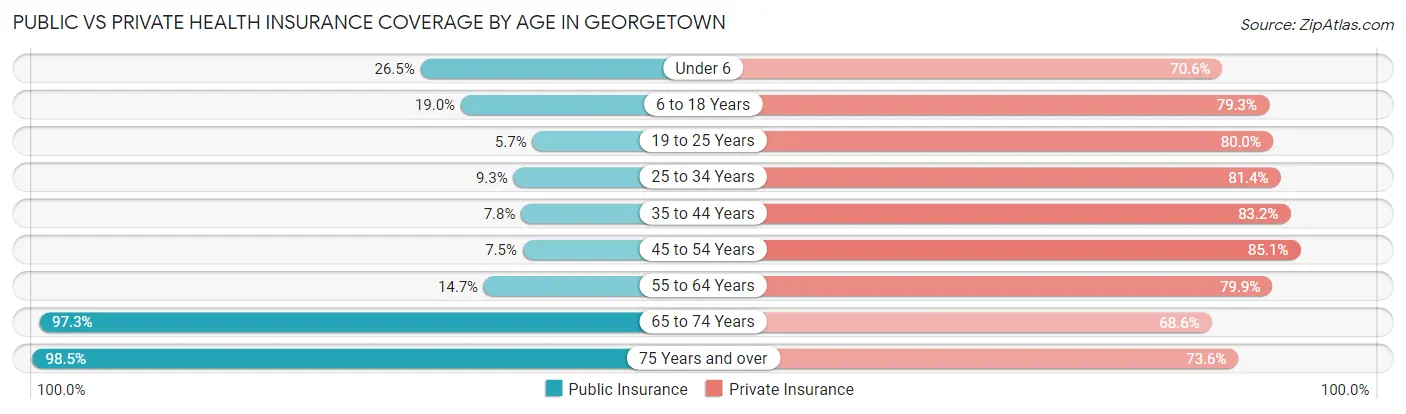
| Age Bracket | Public Insurance | Private Insurance |
| Under 6 | 1,164 (26.5%) | 3,101 (70.6%) |
| 6 to 18 Years | 1,934 (19.0%) | 8,065 (79.3%) |
| 19 to 25 Years | 348 (5.7%) | 4,861 (80.0%) |
| 25 to 34 Years | 595 (9.2%) | 5,237 (81.4%) |
| 35 to 44 Years | 636 (7.8%) | 6,776 (83.2%) |
| 45 to 54 Years | 558 (7.5%) | 6,300 (85.1%) |
| 55 to 64 Years | 1,131 (14.7%) | 6,128 (79.9%) |
| 65 to 74 Years | 10,235 (97.3%) | 7,218 (68.6%) |
| 75 Years and over | 9,560 (98.5%) | 7,143 (73.6%) |
| Total | 26,161 (37.1%) | 54,829 (77.7%) |
Disability Status by Sex by Age in Georgetown
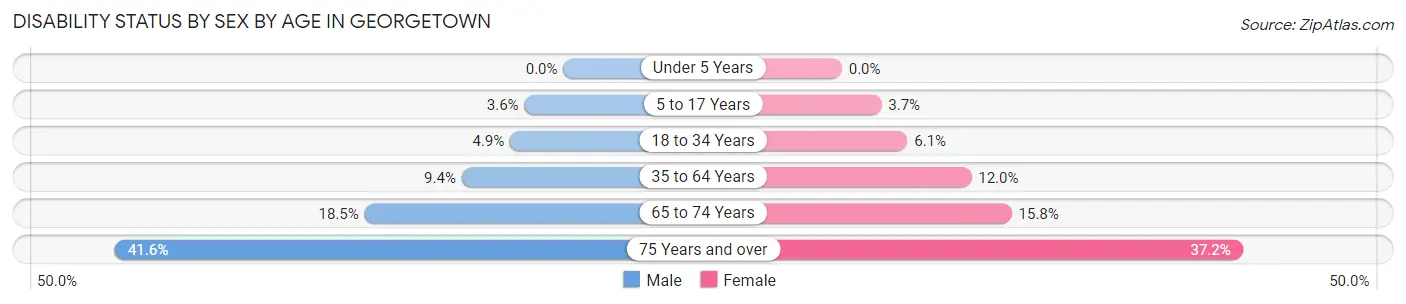
| Age Bracket | Male | Female |
| Under 5 Years | 0 (0.0%) | 0 (0.0%) |
| 5 to 17 Years | 188 (3.6%) | 185 (3.7%) |
| 18 to 34 Years | 302 (4.9%) | 440 (6.1%) |
| 35 to 64 Years | 1,030 (9.4%) | 1,478 (12.0%) |
| 65 to 74 Years | 849 (18.4%) | 933 (15.8%) |
| 75 Years and over | 1,742 (41.6%) | 2,053 (37.2%) |
Disability Class by Sex by Age in Georgetown
Disability Class: Hearing Difficulty
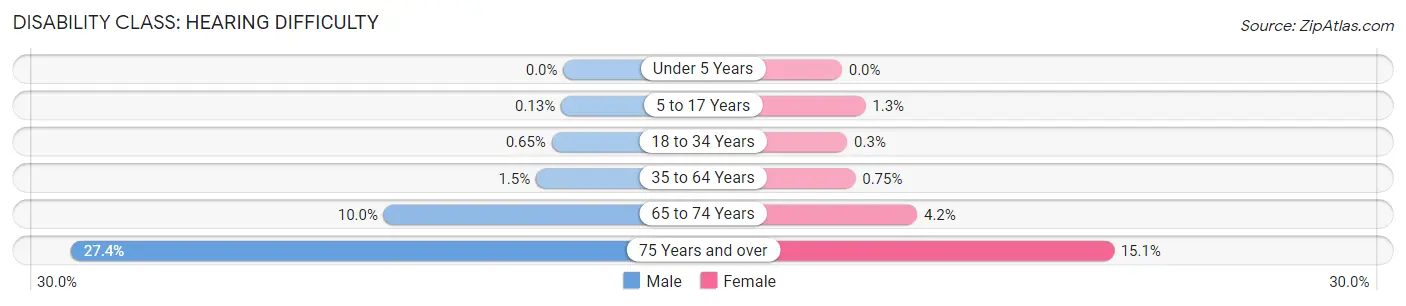
| Age Bracket | Male | Female |
| Under 5 Years | 0 (0.0%) | 0 (0.0%) |
| 5 to 17 Years | 7 (0.1%) | 66 (1.3%) |
| 18 to 34 Years | 40 (0.6%) | 22 (0.3%) |
| 35 to 64 Years | 166 (1.5%) | 92 (0.7%) |
| 65 to 74 Years | 460 (10.0%) | 248 (4.2%) |
| 75 Years and over | 1,148 (27.4%) | 836 (15.1%) |
Disability Class: Vision Difficulty
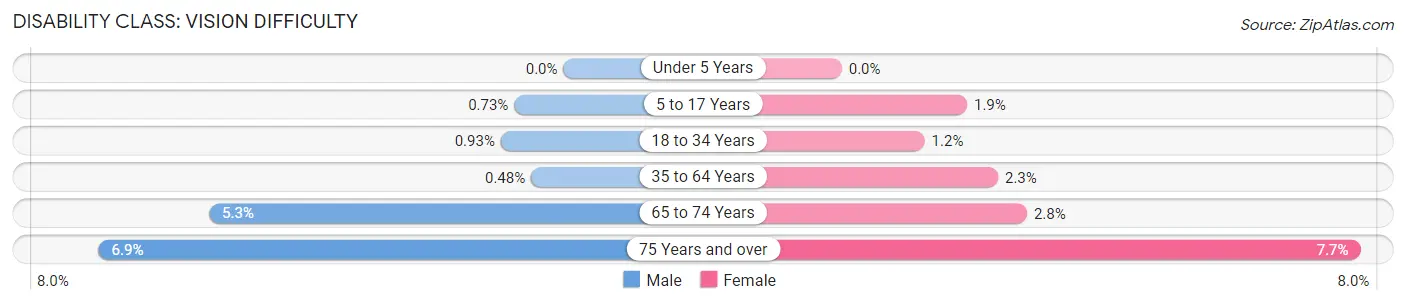
| Age Bracket | Male | Female |
| Under 5 Years | 0 (0.0%) | 0 (0.0%) |
| 5 to 17 Years | 38 (0.7%) | 94 (1.9%) |
| 18 to 34 Years | 57 (0.9%) | 89 (1.2%) |
| 35 to 64 Years | 52 (0.5%) | 285 (2.3%) |
| 65 to 74 Years | 242 (5.3%) | 163 (2.8%) |
| 75 Years and over | 289 (6.9%) | 425 (7.7%) |
Disability Class: Cognitive Difficulty
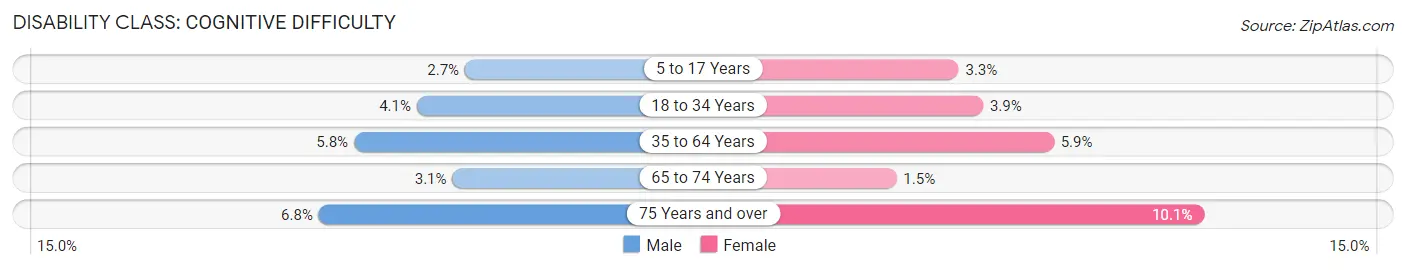
| Age Bracket | Male | Female |
| 5 to 17 Years | 143 (2.7%) | 164 (3.3%) |
| 18 to 34 Years | 249 (4.1%) | 284 (3.9%) |
| 35 to 64 Years | 637 (5.8%) | 725 (5.9%) |
| 65 to 74 Years | 142 (3.1%) | 90 (1.5%) |
| 75 Years and over | 285 (6.8%) | 557 (10.1%) |
Disability Class: Ambulatory Difficulty
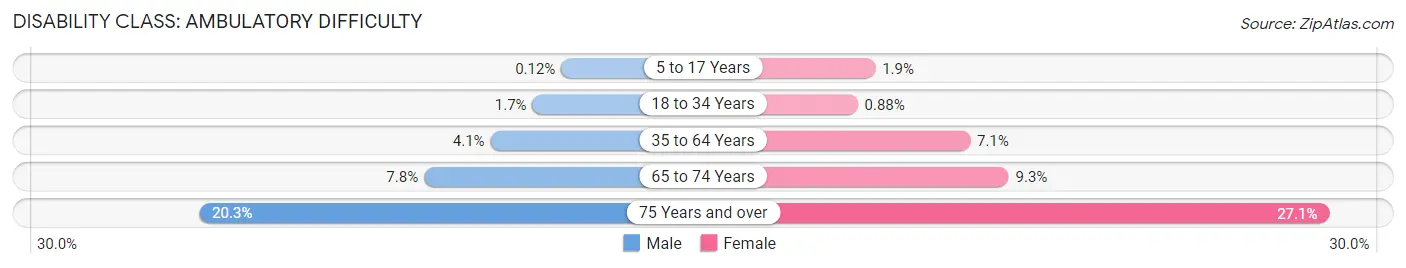
| Age Bracket | Male | Female |
| 5 to 17 Years | 6 (0.1%) | 94 (1.9%) |
| 18 to 34 Years | 105 (1.7%) | 64 (0.9%) |
| 35 to 64 Years | 443 (4.1%) | 878 (7.1%) |
| 65 to 74 Years | 357 (7.8%) | 550 (9.3%) |
| 75 Years and over | 849 (20.3%) | 1,498 (27.1%) |
Disability Class: Self-Care Difficulty
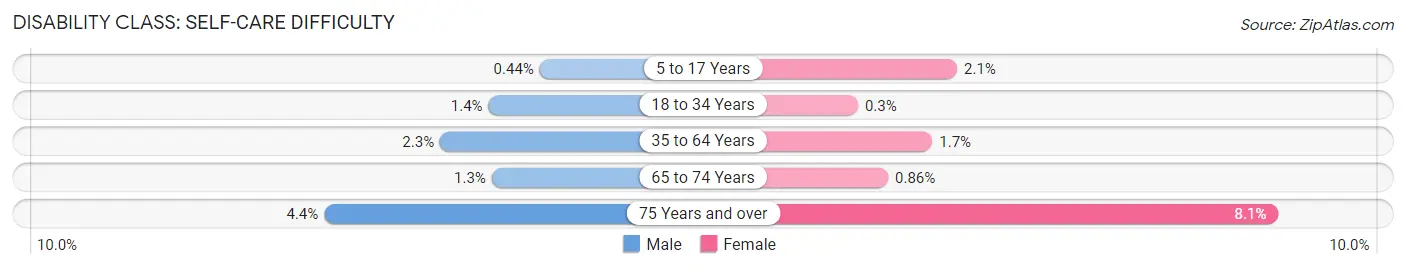
| Age Bracket | Male | Female |
| 5 to 17 Years | 23 (0.4%) | 108 (2.1%) |
| 18 to 34 Years | 85 (1.4%) | 22 (0.3%) |
| 35 to 64 Years | 250 (2.3%) | 206 (1.7%) |
| 65 to 74 Years | 61 (1.3%) | 51 (0.9%) |
| 75 Years and over | 186 (4.4%) | 447 (8.1%) |
Technology Access in Georgetown
Computing Device Access in Georgetown
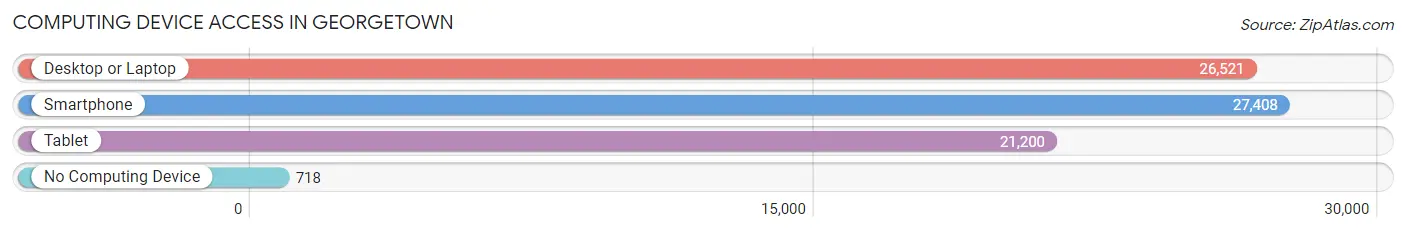
| Device Type | # Households | % Households |
| Desktop or Laptop | 26,521 | 89.1% |
| Smartphone | 27,408 | 92.1% |
| Tablet | 21,200 | 71.2% |
| No Computing Device | 718 | 2.4% |
| Total | 29,768 | 100.0% |
Internet Access in Georgetown
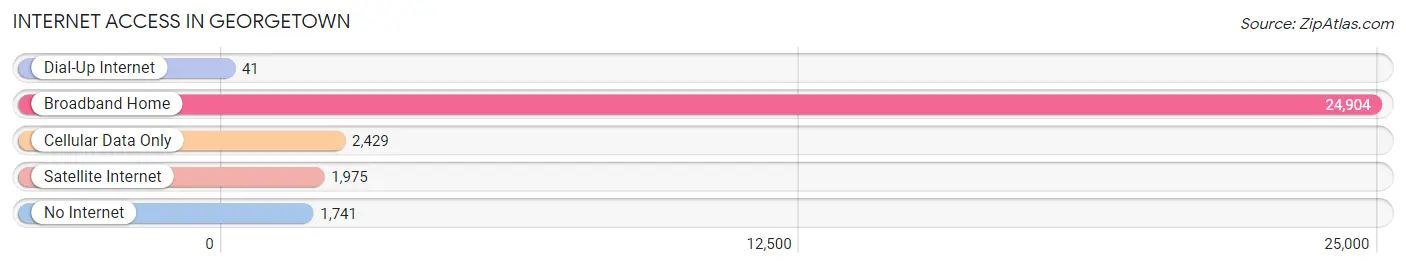
| Internet Type | # Households | % Households |
| Dial-Up Internet | 41 | 0.1% |
| Broadband Home | 24,904 | 83.7% |
| Cellular Data Only | 2,429 | 8.2% |
| Satellite Internet | 1,975 | 6.6% |
| No Internet | 1,741 | 5.9% |
| Total | 29,768 | 100.0% |
Georgetown Summary
Georgetown, Texas is a city located in Williamson County, Texas, United States. It is the county seat of Williamson County and is about 30 miles north of Austin. The population was 47,400 at the 2010 census, making it one of the fastest-growing cities in the United States.
Geography
Georgetown is located at the intersection of Interstate 35 and State Highway 29, about 30 miles north of Austin. The city is situated on the Balcones Escarpment, a fault line in which the areas east of the escarpment are flat and feature blackland prairie soils, while the west features hilly terrain with limestone and granite soils. The city is also located on the Edwards Plateau, which is known for its karst topography.
Georgetown is located in the Central Texas Hill Country, and is known for its rolling hills and scenic views. The city is home to several parks, including San Gabriel Park, which features a large playground, a disc golf course, and a swimming pool. The city is also home to the Inner Space Cavern, a large underground cave system.
Economy
Georgetown is home to a diverse economy, with a variety of industries represented. The city is home to several large employers, including Southwestern University, St. David's Georgetown Hospital, and the Williamson County government. The city is also home to several technology companies, including Dell, National Instruments, and Freescale Semiconductor.
Georgetown is also home to several manufacturing companies, including 3M, Caterpillar, and Texas Instruments. The city is also home to several retail stores, including Walmart, Target, and Home Depot.
Demographics
As of the 2010 census, the population of Georgetown was 47,400. The racial makeup of the city was 79.2% White, 8.2% African American, 0.5% Native American, 2.3% Asian, 0.1% Pacific Islander, 7.2% from other races, and 2.5% from two or more races. Hispanic or Latino of any race were 18.5% of the population.
The median income for a household in the city was $50,943, and the median income for a family was $62,837. The per capita income for the city was $25,945. About 8.2% of families and 11.3% of the population were below the poverty line, including 15.2% of those under age 18 and 8.2% of those age 65 or over.
Georgetown is served by the Georgetown Independent School District, which includes seven elementary schools, two middle schools, and one high school. The city is also home to Southwestern University, a private liberal arts college.
Georgetown is a vibrant and growing city, with a diverse economy and a variety of attractions. The city is home to several large employers, and is a popular destination for tourists and outdoor enthusiasts. With its scenic views and friendly atmosphere, Georgetown is a great place to live and work.
Common Questions
What is the Total Population of Georgetown?
Total Population of Georgetown is 71,788.
What is the Total Male Population of Georgetown?
Total Male Population of Georgetown is 33,816.
What is the Total Female Population of Georgetown?
Total Female Population of Georgetown is 37,972.
What is the Ratio of Males per 100 Females in Georgetown?
There are 89.06 Males per 100 Females in Georgetown.
What is the Ratio of Females per 100 Males in Georgetown?
There are 112.29 Females per 100 Males in Georgetown.
What is the Median Population Age in Georgetown?
Median Population Age in Georgetown is 44.7 Years.
What is the Average Family Size in Georgetown
Average Family Size in Georgetown is 2.9 People.
What is the Average Household Size in Georgetown
Average Household Size in Georgetown is 2.3 People.
What is Per Capita Income in Georgetown?
Per Capita income in Georgetown is $46,727.
What is the Median Family Income in Georgetown?
Median Family Income in Georgetown is $105,890.
What is the Median Household income in Georgetown?
Median Household Income in Georgetown is $87,465.
What is Income or Wage Gap in Georgetown?
Income or Wage Gap in Georgetown is 33.1%.
Women in Georgetown earn 66.9 cents for every dollar earned by a man.
What is Inequality or Gini Index in Georgetown?
Inequality or Gini Index in Georgetown is 0.42.
How Large is the Labor Force in Georgetown?
There are 32,279 People in the Labor Forcein in Georgetown.
What is the Percentage of People in the Labor Force in Georgetown?
54.5% of People are in the Labor Force in Georgetown.
What is the Unemployment Rate in Georgetown?
Unemployment Rate in Georgetown is 5.7%.