Walnut Springs, TX
Walnut Springs Map
Walnut Springs Overview
793
TOTAL POPULATION
457
MALE POPULATION
336
FEMALE POPULATION
136.01
MALES / 100 FEMALES
73.52
FEMALES / 100 MALES
32.2
MEDIAN AGE
2.8
AVG FAMILY SIZE
2.5
AVG HOUSEHOLD SIZE
$22,174
PER CAPITA INCOME
$39,135
AVG FAMILY INCOME
$35,313
AVG HOUSEHOLD INCOME
32.1%
WAGE / INCOME GAP [ % ]
67.9¢/ $1
WAGE / INCOME GAP [ $ ]
0.47
INEQUALITY / GINI INDEX
309
LABOR FORCE [ PEOPLE ]
53.0%
PERCENT IN LABOR FORCE
5.5%
UNEMPLOYMENT RATE
Walnut Springs Zip Codes
Walnut Springs Area Codes
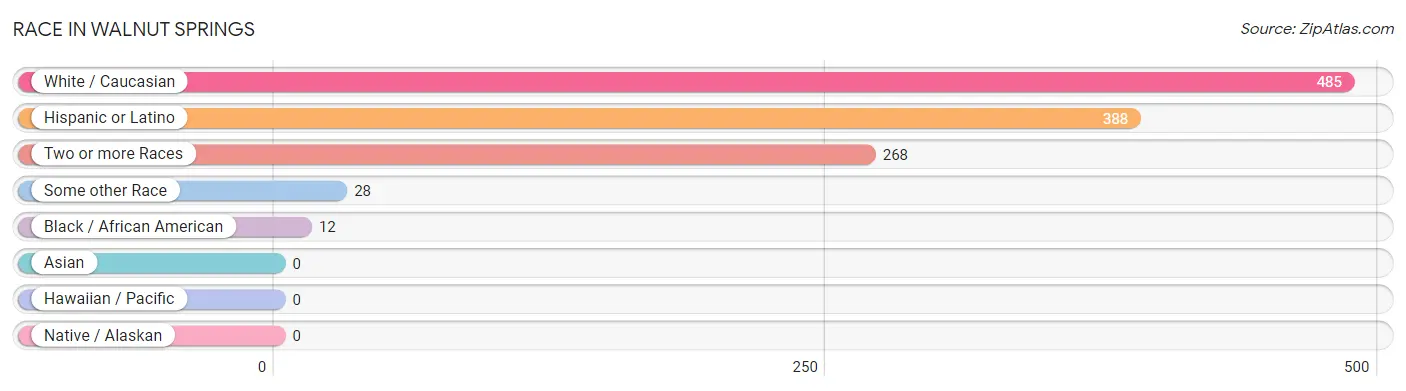
Race in Walnut Springs
The most populous races in Walnut Springs are White / Caucasian (485 | 61.2%), Hispanic or Latino (388 | 48.9%), and Two or more Races (268 | 33.8%).
| Race | # Population | % Population |
| Asian | 0 | 0.0% |
| Black / African American | 12 | 1.5% |
| Hawaiian / Pacific | 0 | 0.0% |
| Hispanic or Latino | 388 | 48.9% |
| Native / Alaskan | 0 | 0.0% |
| White / Caucasian | 485 | 61.2% |
| Two or more Races | 268 | 33.8% |
| Some other Race | 28 | 3.5% |
| Total | 793 | 100.0% |
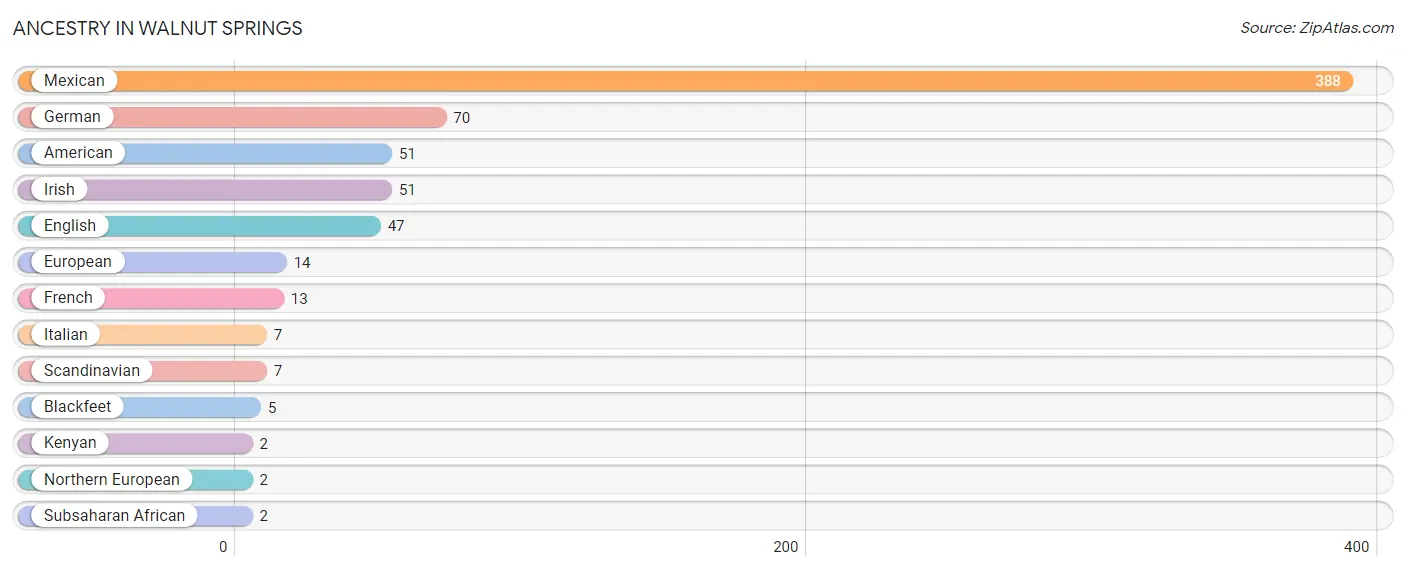
Ancestry in Walnut Springs
The most populous ancestries reported in Walnut Springs are Mexican (388 | 48.9%), German (70 | 8.8%), American (51 | 6.4%), Irish (51 | 6.4%), and English (47 | 5.9%), together accounting for 76.6% of all Walnut Springs residents.
| Ancestry | # Population | % Population |
| American | 51 | 6.4% |
| Blackfeet | 5 | 0.6% |
| English | 47 | 5.9% |
| European | 14 | 1.8% |
| French | 13 | 1.6% |
| German | 70 | 8.8% |
| Irish | 51 | 6.4% |
| Italian | 7 | 0.9% |
| Kenyan | 2 | 0.3% |
| Mexican | 388 | 48.9% |
| Northern European | 2 | 0.3% |
| Scandinavian | 7 | 0.9% |
| Subsaharan African | 2 | 0.3% | View All 13 Rows |
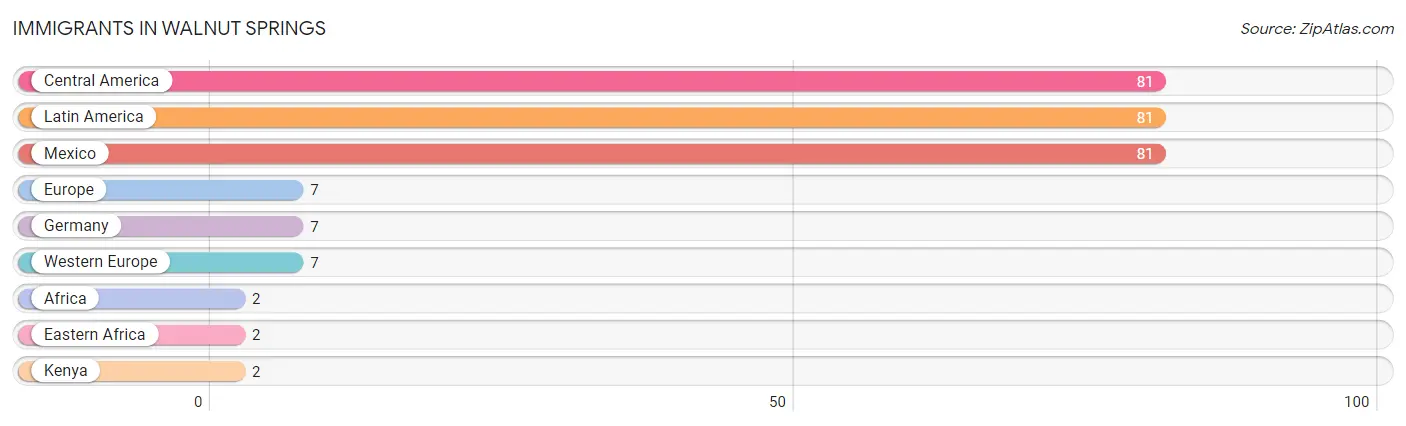
Immigrants in Walnut Springs
The most numerous immigrant groups reported in Walnut Springs came from Central America (81 | 10.2%), Latin America (81 | 10.2%), Mexico (81 | 10.2%), Europe (7 | 0.9%), and Germany (7 | 0.9%), together accounting for 32.4% of all Walnut Springs residents.
| Immigration Origin | # Population | % Population |
| Africa | 2 | 0.3% |
| Central America | 81 | 10.2% |
| Eastern Africa | 2 | 0.3% |
| Europe | 7 | 0.9% |
| Germany | 7 | 0.9% |
| Kenya | 2 | 0.3% |
| Latin America | 81 | 10.2% |
| Mexico | 81 | 10.2% |
| Western Europe | 7 | 0.9% | View All 9 Rows |
Sex and Age in Walnut Springs
Sex and Age in Walnut Springs
The most populous age groups in Walnut Springs are Under 5 Years (96 | 21.0%) for men and 5 to 9 Years (52 | 15.5%) for women.
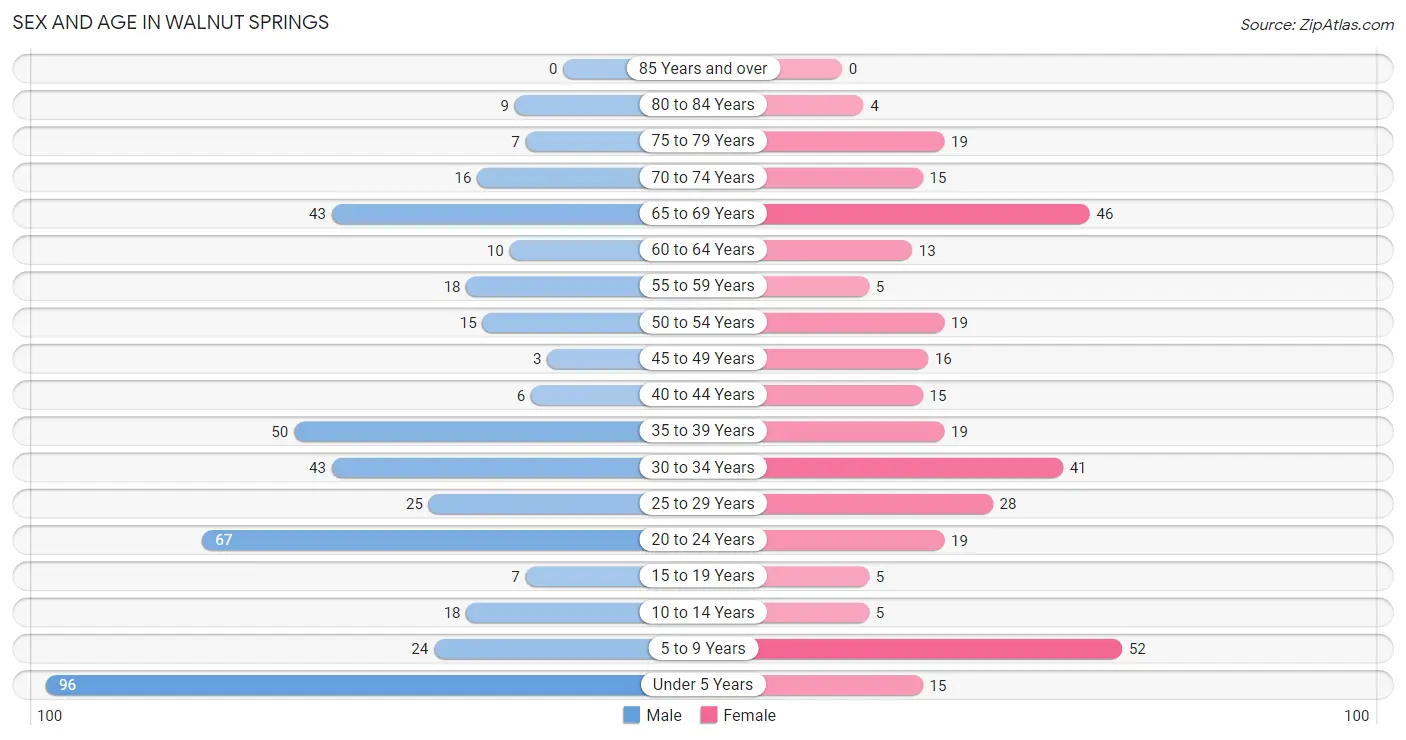
| Age Bracket | Male | Female |
| Under 5 Years | 96 (21.0%) | 15 (4.5%) |
| 5 to 9 Years | 24 (5.2%) | 52 (15.5%) |
| 10 to 14 Years | 18 (3.9%) | 5 (1.5%) |
| 15 to 19 Years | 7 (1.5%) | 5 (1.5%) |
| 20 to 24 Years | 67 (14.7%) | 19 (5.7%) |
| 25 to 29 Years | 25 (5.5%) | 28 (8.3%) |
| 30 to 34 Years | 43 (9.4%) | 41 (12.2%) |
| 35 to 39 Years | 50 (10.9%) | 19 (5.7%) |
| 40 to 44 Years | 6 (1.3%) | 15 (4.5%) |
| 45 to 49 Years | 3 (0.7%) | 16 (4.8%) |
| 50 to 54 Years | 15 (3.3%) | 19 (5.7%) |
| 55 to 59 Years | 18 (3.9%) | 5 (1.5%) |
| 60 to 64 Years | 10 (2.2%) | 13 (3.9%) |
| 65 to 69 Years | 43 (9.4%) | 46 (13.7%) |
| 70 to 74 Years | 16 (3.5%) | 15 (4.5%) |
| 75 to 79 Years | 7 (1.5%) | 19 (5.7%) |
| 80 to 84 Years | 9 (2.0%) | 4 (1.2%) |
| 85 Years and over | 0 (0.0%) | 0 (0.0%) |
| Total | 457 (100.0%) | 336 (100.0%) |
Families and Households in Walnut Springs
Median Family Size in Walnut Springs
The median family size in Walnut Springs is 2.79 persons per family, with married-couple families (160 | 66.9%) accounting for the largest median family size of 3.08 persons per family. On the other hand, single female/mother families (44 | 18.4%) represent the smallest median family size with 2.11 persons per family.
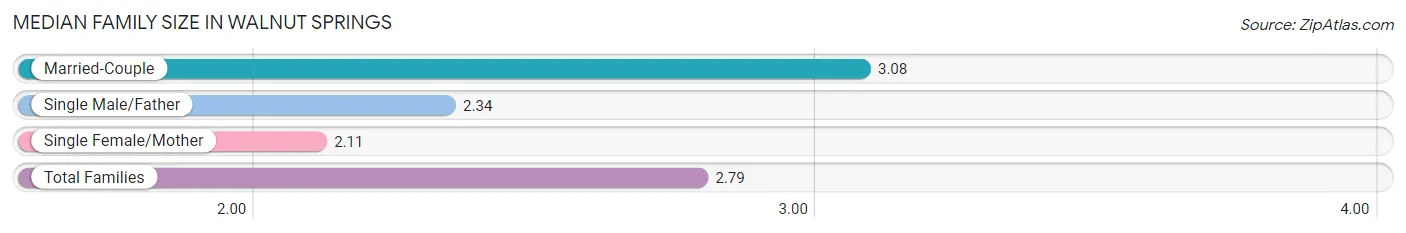
| Family Type | # Families | Family Size |
| Married-Couple | 160 (66.9%) | 3.08 |
| Single Male/Father | 35 (14.6%) | 2.34 |
| Single Female/Mother | 44 (18.4%) | 2.11 |
| Total Families | 239 (100.0%) | 2.79 |
Median Household Size in Walnut Springs
The median household size in Walnut Springs is 2.53 persons per household, with single male/father households (35 | 11.2%) accounting for the largest median household size of 3.14 persons per household. non-family households (75 | 23.9%) represent the smallest median household size with 1.16 persons per household.
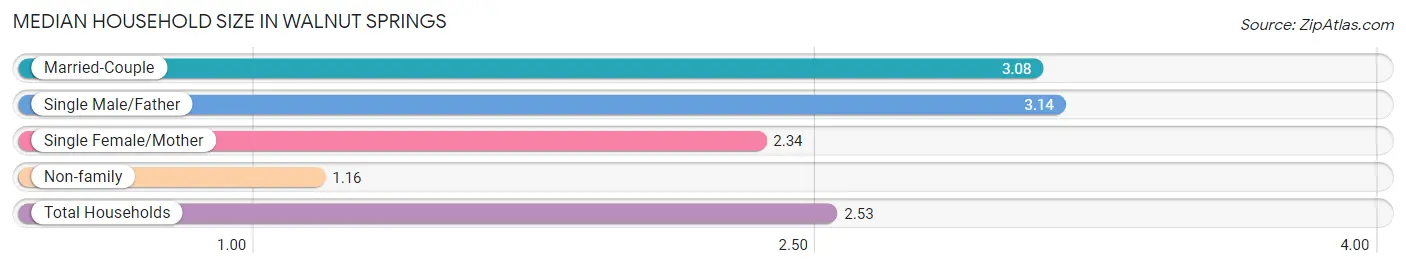
| Household Type | # Households | Household Size |
| Married-Couple | 160 (51.0%) | 3.08 |
| Single Male/Father | 35 (11.2%) | 3.14 |
| Single Female/Mother | 44 (14.0%) | 2.34 |
| Non-family | 75 (23.9%) | 1.16 |
| Total Households | 314 (100.0%) | 2.53 |
Household Size by Marriage Status in Walnut Springs
Out of a total of 314 households in Walnut Springs, 239 (76.1%) are family households, while 75 (23.9%) are nonfamily households. The most numerous type of family households are 2-person households, comprising 135, and the most common type of nonfamily households are 1-person households, comprising 67.
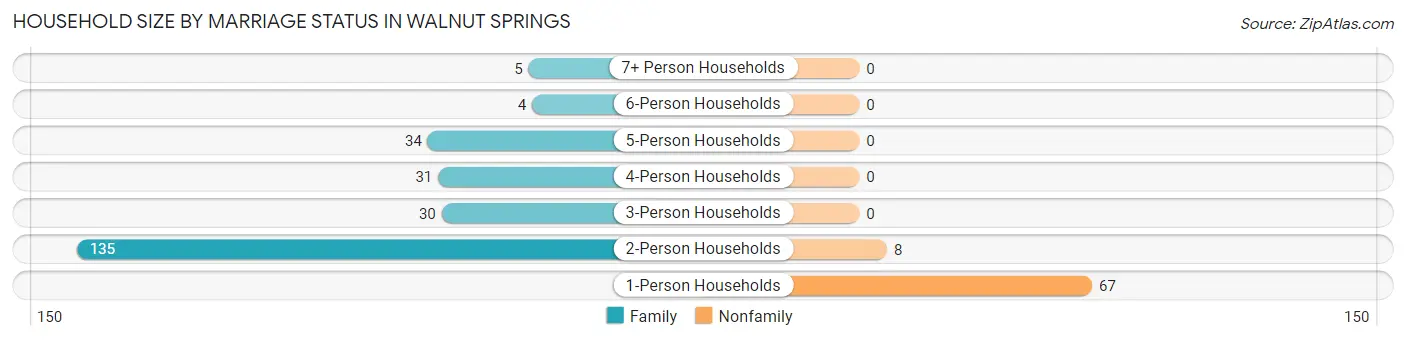
| Household Size | Family Households | Nonfamily Households |
| 1-Person Households | - | 67 (21.3%) |
| 2-Person Households | 135 (43.0%) | 8 (2.5%) |
| 3-Person Households | 30 (9.6%) | 0 (0.0%) |
| 4-Person Households | 31 (9.9%) | 0 (0.0%) |
| 5-Person Households | 34 (10.8%) | 0 (0.0%) |
| 6-Person Households | 4 (1.3%) | 0 (0.0%) |
| 7+ Person Households | 5 (1.6%) | 0 (0.0%) |
| Total | 239 (76.1%) | 75 (23.9%) |
Female Fertility in Walnut Springs
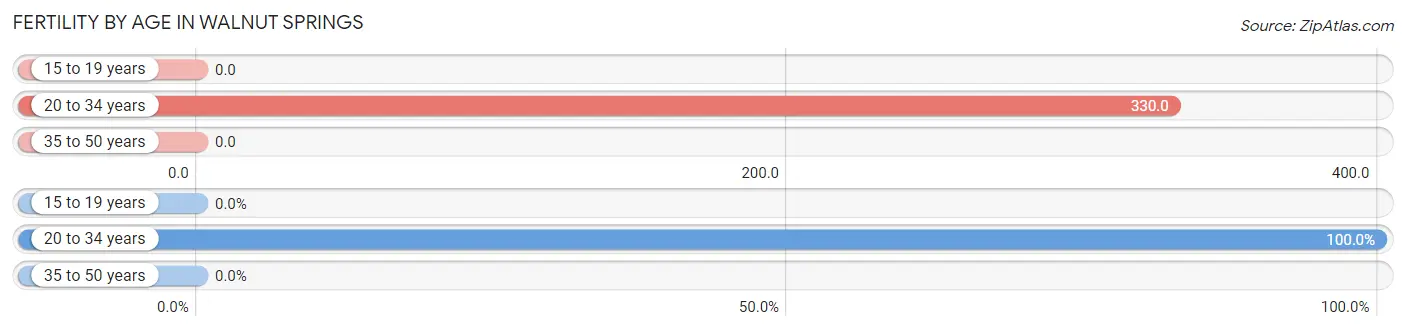
Fertility by Age in Walnut Springs
Average fertility rate in Walnut Springs is 203.0 births per 1,000 women. Women in the age bracket of 20 to 34 years have the highest fertility rate with 330.0 births per 1,000 women. Women in the age bracket of 20 to 34 years acount for 100.0% of all women with births.
| Age Bracket | Women with Births | Births / 1,000 Women |
| 15 to 19 years | 0 (0.0%) | 0.0 |
| 20 to 34 years | 29 (100.0%) | 330.0 |
| 35 to 50 years | 0 (0.0%) | 0.0 |
| Total | 29 (100.0%) | 203.0 |
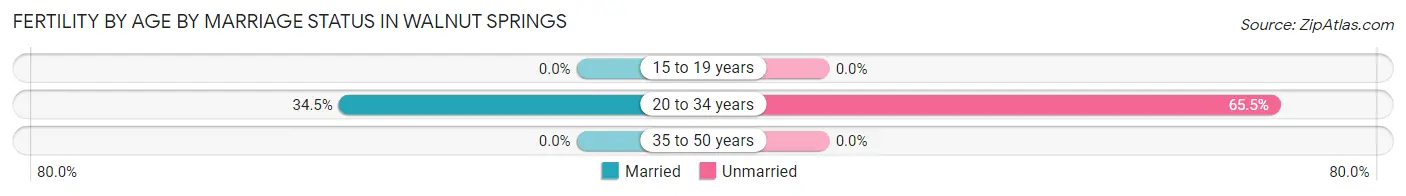
Fertility by Age by Marriage Status in Walnut Springs
34.5% of women with births (29) in Walnut Springs are married. The highest percentage of unmarried women with births falls into 20 to 34 years age bracket with 65.5% of them unmarried at the time of birth, while the lowest percentage of unmarried women with births belong to 20 to 34 years age bracket with 65.5% of them unmarried.
| Age Bracket | Married | Unmarried |
| 15 to 19 years | 0 (0.0%) | 0 (0.0%) |
| 20 to 34 years | 10 (34.5%) | 19 (65.5%) |
| 35 to 50 years | 0 (0.0%) | 0 (0.0%) |
| Total | 10 (34.5%) | 19 (65.5%) |
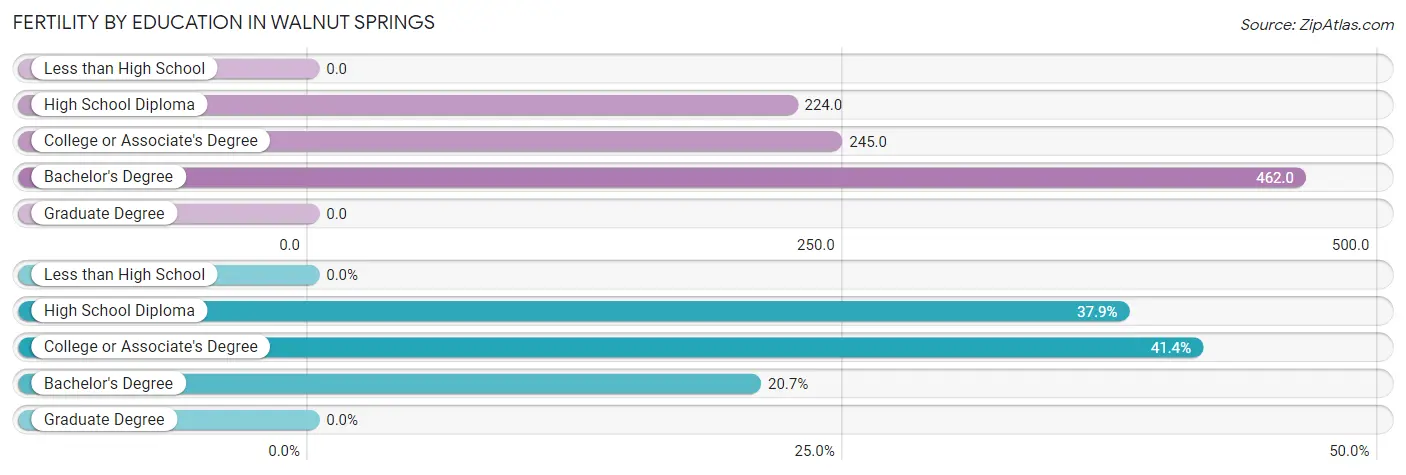
Fertility by Education in Walnut Springs
| Educational Attainment | Women with Births | Births / 1,000 Women |
| Less than High School | 0 (0.0%) | 0.0 |
| High School Diploma | 11 (37.9%) | 224.0 |
| College or Associate's Degree | 12 (41.4%) | 245.0 |
| Bachelor's Degree | 6 (20.7%) | 462.0 |
| Graduate Degree | 0 (0.0%) | 0.0 |
| Total | 29 (100.0%) | 203.0 |
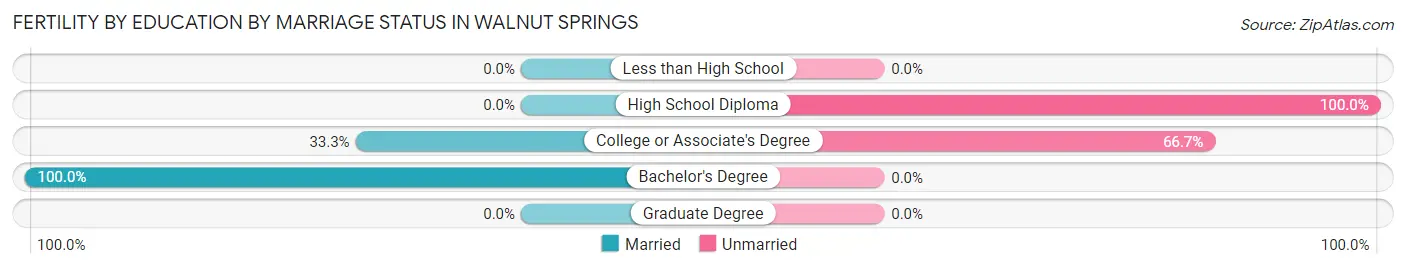
Fertility by Education by Marriage Status in Walnut Springs
65.5% of women with births in Walnut Springs are unmarried. Women with the educational attainment of bachelor's degree are most likely to be married with 100.0% of them married at childbirth, while women with the educational attainment of high school diploma are least likely to be married with 100.0% of them unmarried at childbirth.
| Educational Attainment | Married | Unmarried |
| Less than High School | 0 (0.0%) | 0 (0.0%) |
| High School Diploma | 0 (0.0%) | 11 (100.0%) |
| College or Associate's Degree | 4 (33.3%) | 8 (66.7%) |
| Bachelor's Degree | 6 (100.0%) | 0 (0.0%) |
| Graduate Degree | 0 (0.0%) | 0 (0.0%) |
| Total | 10 (34.5%) | 19 (65.5%) |
Income in Walnut Springs
Income Overview in Walnut Springs
Per Capita Income in Walnut Springs is $22,174, while median incomes of families and households are $39,135 and $35,313 respectively.
| Characteristic | Number | Measure |
| Per Capita Income | 793 | $22,174 |
| Median Family Income | 239 | $39,135 |
| Mean Family Income | 239 | $58,145 |
| Median Household Income | 314 | $35,313 |
| Mean Household Income | 314 | $53,222 |
| Income Deficit | 239 | $0 |
| Wage / Income Gap (%) | 793 | 32.05% |
| Wage / Income Gap ($) | 793 | 67.95¢ per $1 |
| Gini / Inequality Index | 793 | 0.47 |
Earnings by Sex in Walnut Springs
Average Earnings in Walnut Springs are $35,179, $38,194 for men and $25,952 for women, a difference of 32.1%.
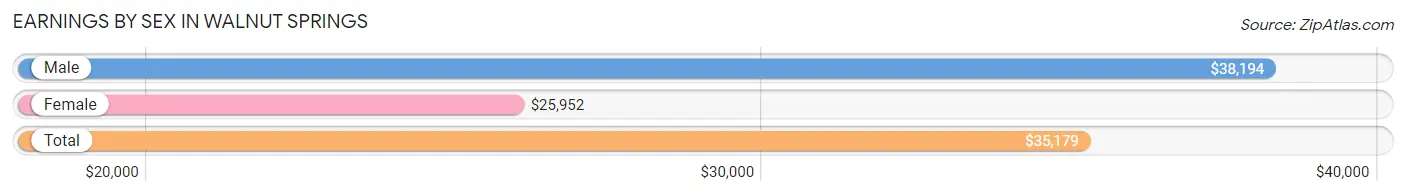
| Sex | Number | Average Earnings |
| Male | 222 (74.5%) | $38,194 |
| Female | 76 (25.5%) | $25,952 |
| Total | 298 (100.0%) | $35,179 |
Earnings by Sex by Income Bracket in Walnut Springs
The most common earnings brackets in Walnut Springs are $35,000 to $39,999 for men (30 | 13.5%) and $25,000 to $29,999 for women (21 | 27.6%).
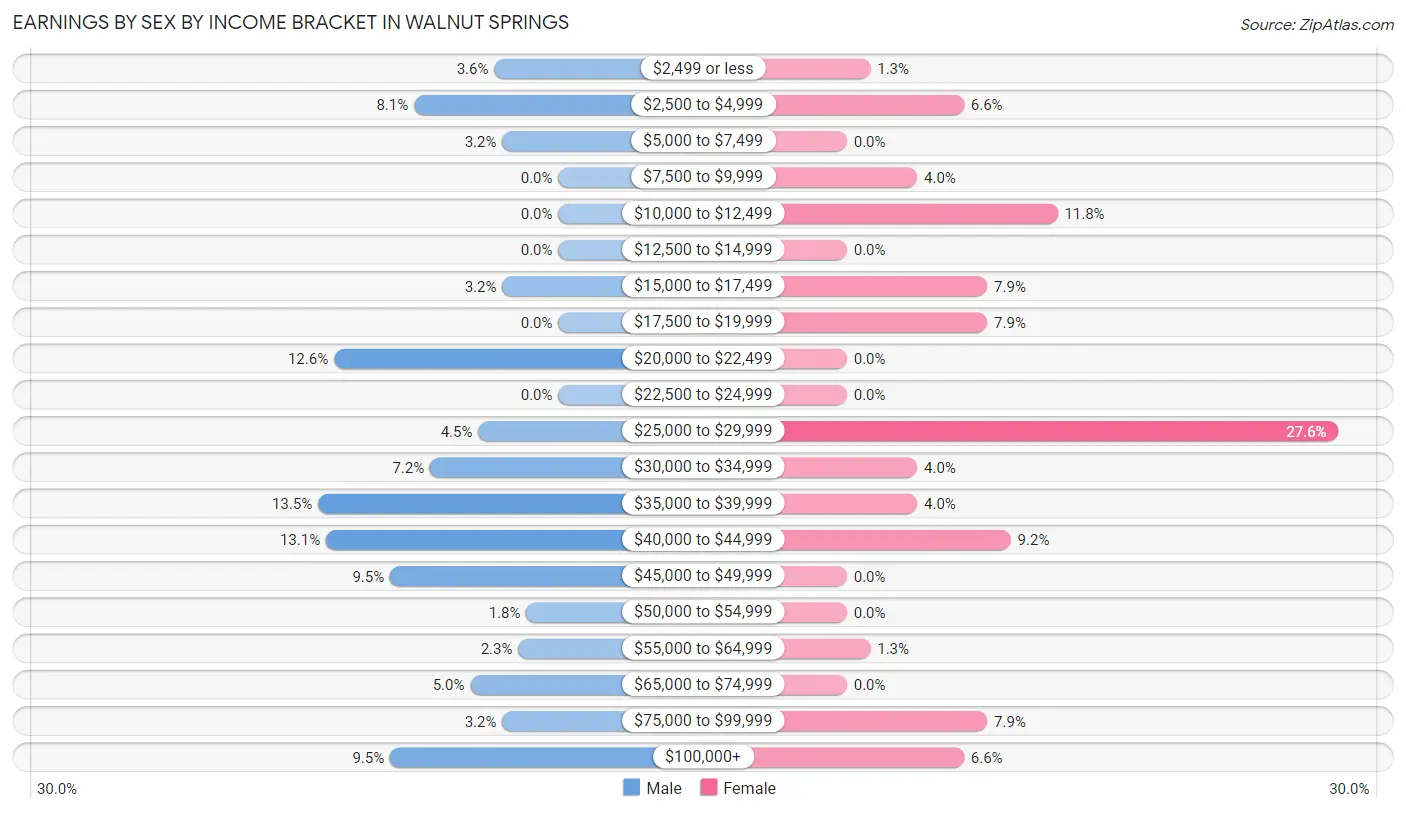
| Income | Male | Female |
| $2,499 or less | 8 (3.6%) | 1 (1.3%) |
| $2,500 to $4,999 | 18 (8.1%) | 5 (6.6%) |
| $5,000 to $7,499 | 7 (3.2%) | 0 (0.0%) |
| $7,500 to $9,999 | 0 (0.0%) | 3 (4.0%) |
| $10,000 to $12,499 | 0 (0.0%) | 9 (11.8%) |
| $12,500 to $14,999 | 0 (0.0%) | 0 (0.0%) |
| $15,000 to $17,499 | 7 (3.2%) | 6 (7.9%) |
| $17,500 to $19,999 | 0 (0.0%) | 6 (7.9%) |
| $20,000 to $22,499 | 28 (12.6%) | 0 (0.0%) |
| $22,500 to $24,999 | 0 (0.0%) | 0 (0.0%) |
| $25,000 to $29,999 | 10 (4.5%) | 21 (27.6%) |
| $30,000 to $34,999 | 16 (7.2%) | 3 (4.0%) |
| $35,000 to $39,999 | 30 (13.5%) | 3 (4.0%) |
| $40,000 to $44,999 | 29 (13.1%) | 7 (9.2%) |
| $45,000 to $49,999 | 21 (9.5%) | 0 (0.0%) |
| $50,000 to $54,999 | 4 (1.8%) | 0 (0.0%) |
| $55,000 to $64,999 | 5 (2.2%) | 1 (1.3%) |
| $65,000 to $74,999 | 11 (5.0%) | 0 (0.0%) |
| $75,000 to $99,999 | 7 (3.2%) | 6 (7.9%) |
| $100,000+ | 21 (9.5%) | 5 (6.6%) |
| Total | 222 (100.0%) | 76 (100.0%) |
Earnings by Sex by Educational Attainment in Walnut Springs
Average earnings in Walnut Springs are $39,750 for men and $25,938 for women, a difference of 34.7%. Men with an educational attainment of college or associate's degree enjoy the highest average annual earnings of $42,750, while those with less than high school education earn the least with $22,344. Women with an educational attainment of less than high school earn the most with the average annual earnings of $25,469, while those with less than high school education have the smallest earnings of $25,469.
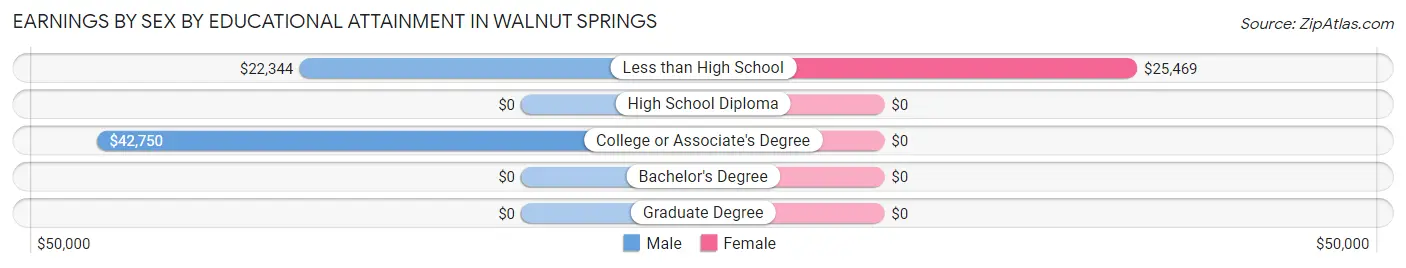
| Educational Attainment | Male Income | Female Income |
| Less than High School | $22,344 | $25,469 |
| High School Diploma | - | - |
| College or Associate's Degree | $42,750 | $0 |
| Bachelor's Degree | - | - |
| Graduate Degree | - | - |
| Total | $39,750 | $25,938 |
Family Income in Walnut Springs
Family Income Brackets in Walnut Springs
According to the Walnut Springs family income data, there are 56 families falling into the $35,000 to $49,999 income range, which is the most common income bracket and makes up 23.4% of all families.
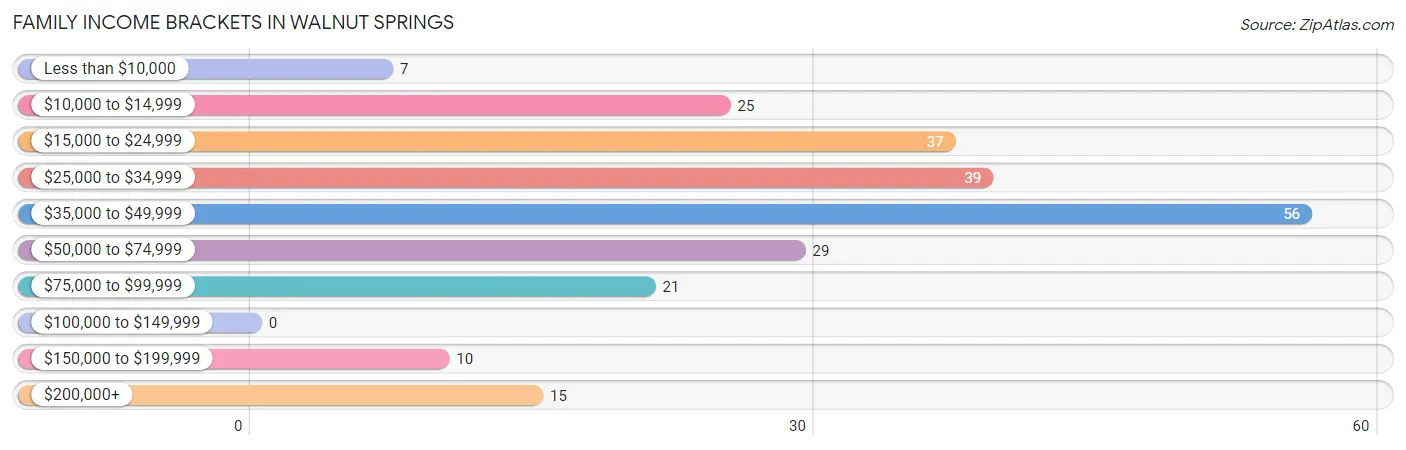
| Income Bracket | # Families | % Families |
| Less than $10,000 | 7 | 2.9% |
| $10,000 to $14,999 | 25 | 10.5% |
| $15,000 to $24,999 | 37 | 15.5% |
| $25,000 to $34,999 | 39 | 16.3% |
| $35,000 to $49,999 | 56 | 23.4% |
| $50,000 to $74,999 | 29 | 12.1% |
| $75,000 to $99,999 | 21 | 8.8% |
| $100,000 to $149,999 | 0 | 0.0% |
| $150,000 to $199,999 | 10 | 4.2% |
| $200,000+ | 15 | 6.3% |
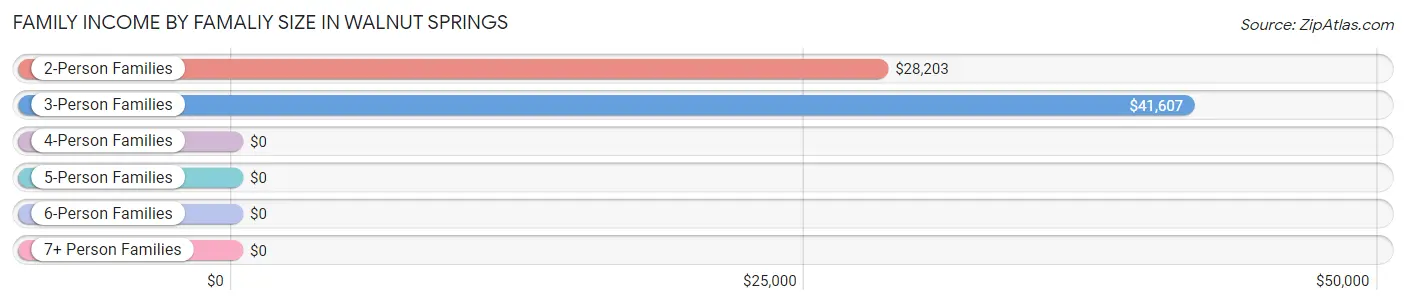
Family Income by Famaliy Size in Walnut Springs
3-person families (36 | 15.1%) account for the highest median family income in Walnut Springs with $41,607 per family, while 2-person families (147 | 61.5%) have the highest median income of $14,102 per family member.
| Income Bracket | # Families | Median Income |
| 2-Person Families | 147 (61.5%) | $28,203 |
| 3-Person Families | 36 (15.1%) | $41,607 |
| 4-Person Families | 13 (5.4%) | $0 |
| 5-Person Families | 38 (15.9%) | $0 |
| 6-Person Families | 0 (0.0%) | $0 |
| 7+ Person Families | 5 (2.1%) | $0 |
| Total | 239 (100.0%) | $39,135 |
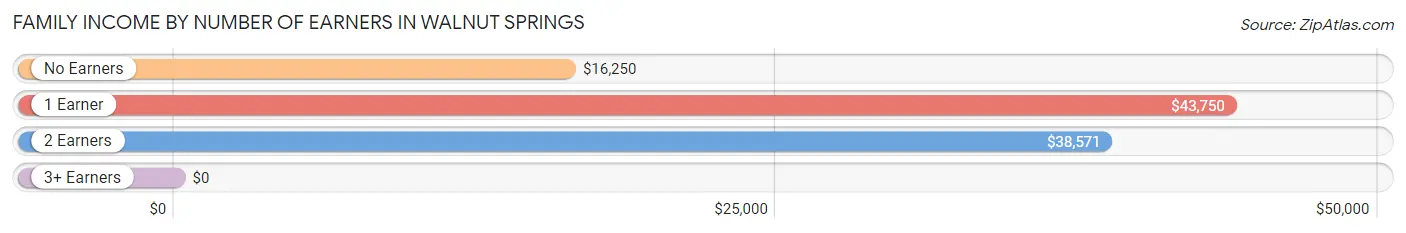
Family Income by Number of Earners in Walnut Springs
| Number of Earners | # Families | Median Income |
| No Earners | 68 (28.4%) | $16,250 |
| 1 Earner | 118 (49.4%) | $43,750 |
| 2 Earners | 46 (19.3%) | $38,571 |
| 3+ Earners | 7 (2.9%) | $0 |
| Total | 239 (100.0%) | $39,135 |
Household Income in Walnut Springs
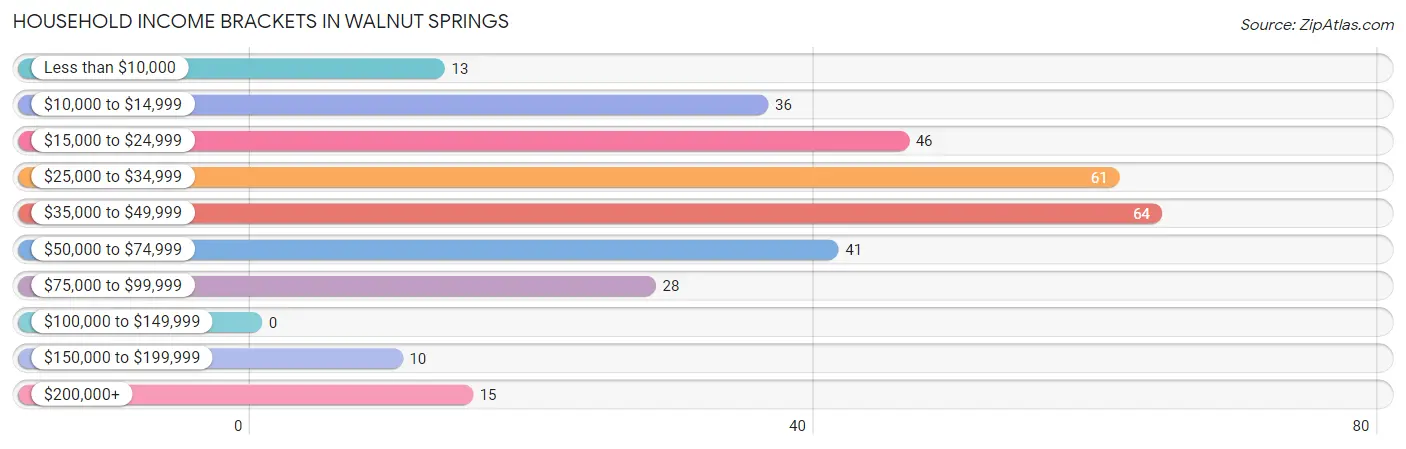
Household Income Brackets in Walnut Springs
With 64 households falling in the category, the $35,000 to $49,999 income range is the most frequent in Walnut Springs, accounting for 20.4% of all households.
| Income Bracket | # Households | % Households |
| Less than $10,000 | 13 | 4.1% |
| $10,000 to $14,999 | 36 | 11.5% |
| $15,000 to $24,999 | 46 | 14.6% |
| $25,000 to $34,999 | 61 | 19.4% |
| $35,000 to $49,999 | 64 | 20.4% |
| $50,000 to $74,999 | 41 | 13.1% |
| $75,000 to $99,999 | 28 | 8.9% |
| $100,000 to $149,999 | 0 | 0.0% |
| $150,000 to $199,999 | 10 | 3.2% |
| $200,000+ | 15 | 4.8% |
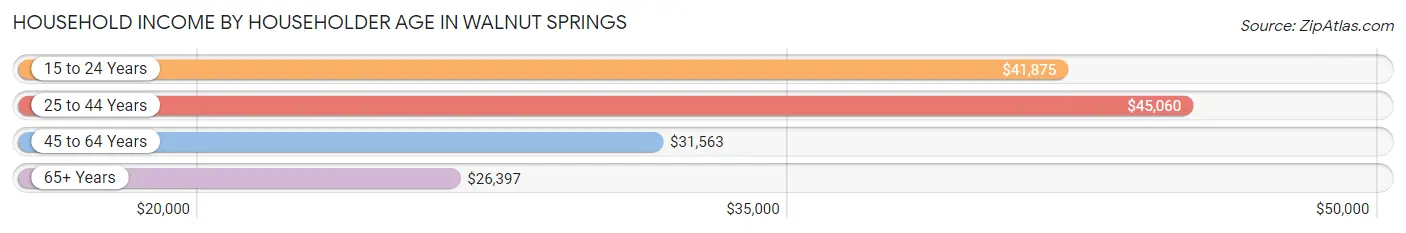
Household Income by Householder Age in Walnut Springs
The median household income in Walnut Springs is $35,313, with the highest median household income of $45,060 found in the 25 to 44 years age bracket for the primary householder. A total of 111 households (35.3%) fall into this category. Meanwhile, the 65+ years age bracket for the primary householder has the lowest median household income of $26,397, with 83 households (26.4%) in this group.
| Income Bracket | # Households | Median Income |
| 15 to 24 Years | 41 (13.1%) | $41,875 |
| 25 to 44 Years | 111 (35.3%) | $45,060 |
| 45 to 64 Years | 79 (25.2%) | $31,563 |
| 65+ Years | 83 (26.4%) | $26,397 |
| Total | 314 (100.0%) | $35,313 |
Poverty in Walnut Springs
Income Below Poverty by Sex and Age in Walnut Springs
With 14.0% poverty level for males and 23.5% for females among the residents of Walnut Springs, 55 to 64 year old males and 18 to 24 year old females are the most vulnerable to poverty, with 13 males (46.4%) and 14 females (70.0%) in their respective age groups living below the poverty level.
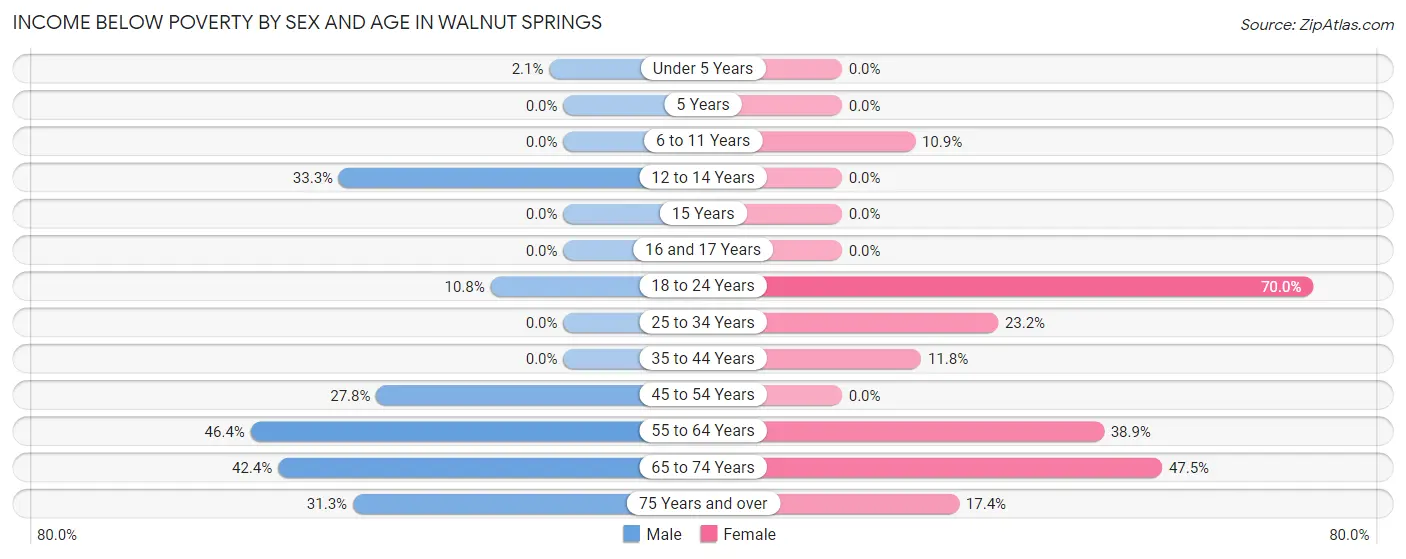
| Age Bracket | Male | Female |
| Under 5 Years | 2 (2.1%) | 0 (0.0%) |
| 5 Years | 0 (0.0%) | 0 (0.0%) |
| 6 to 11 Years | 0 (0.0%) | 5 (10.9%) |
| 12 to 14 Years | 6 (33.3%) | 0 (0.0%) |
| 15 Years | 0 (0.0%) | 0 (0.0%) |
| 16 and 17 Years | 0 (0.0%) | 0 (0.0%) |
| 18 to 24 Years | 8 (10.8%) | 14 (70.0%) |
| 25 to 34 Years | 0 (0.0%) | 16 (23.2%) |
| 35 to 44 Years | 0 (0.0%) | 4 (11.8%) |
| 45 to 54 Years | 5 (27.8%) | 0 (0.0%) |
| 55 to 64 Years | 13 (46.4%) | 7 (38.9%) |
| 65 to 74 Years | 25 (42.4%) | 29 (47.5%) |
| 75 Years and over | 5 (31.2%) | 4 (17.4%) |
| Total | 64 (14.0%) | 79 (23.5%) |
Income Above Poverty by Sex and Age in Walnut Springs
According to the poverty statistics in Walnut Springs, males aged 6 to 11 years and females aged under 5 years are the age groups that are most secure financially, with 100.0% of males and 100.0% of females in these age groups living above the poverty line.
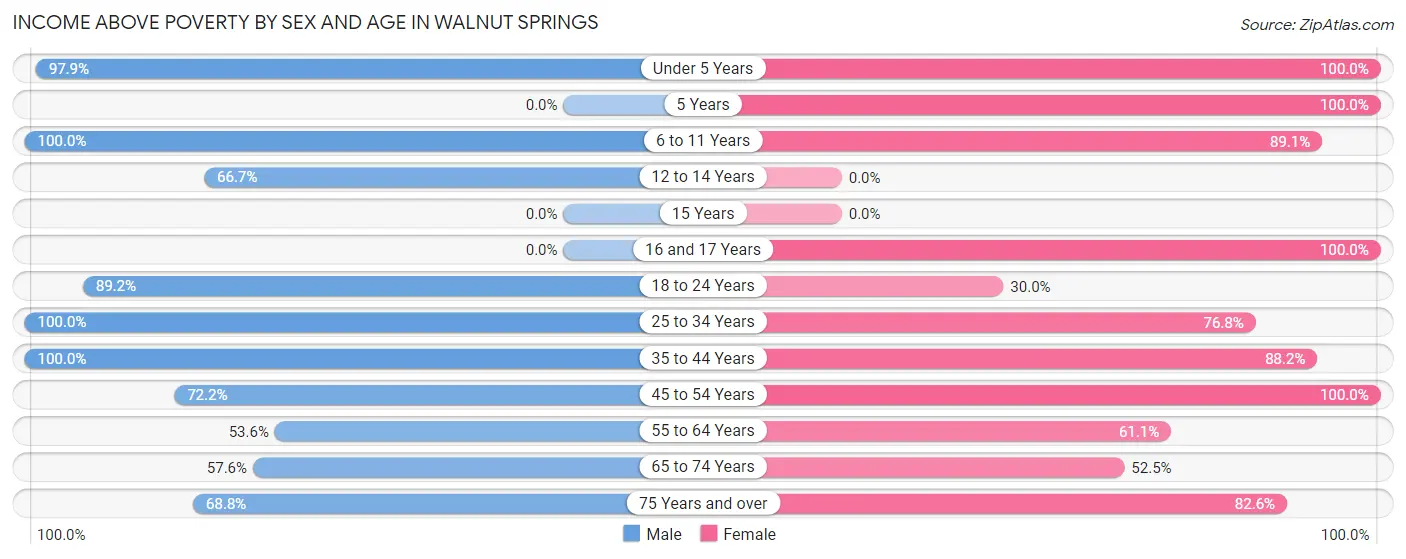
| Age Bracket | Male | Female |
| Under 5 Years | 94 (97.9%) | 15 (100.0%) |
| 5 Years | 0 (0.0%) | 11 (100.0%) |
| 6 to 11 Years | 24 (100.0%) | 41 (89.1%) |
| 12 to 14 Years | 12 (66.7%) | 0 (0.0%) |
| 15 Years | 0 (0.0%) | 0 (0.0%) |
| 16 and 17 Years | 0 (0.0%) | 4 (100.0%) |
| 18 to 24 Years | 66 (89.2%) | 6 (30.0%) |
| 25 to 34 Years | 68 (100.0%) | 53 (76.8%) |
| 35 to 44 Years | 56 (100.0%) | 30 (88.2%) |
| 45 to 54 Years | 13 (72.2%) | 35 (100.0%) |
| 55 to 64 Years | 15 (53.6%) | 11 (61.1%) |
| 65 to 74 Years | 34 (57.6%) | 32 (52.5%) |
| 75 Years and over | 11 (68.8%) | 19 (82.6%) |
| Total | 393 (86.0%) | 257 (76.5%) |
Income Below Poverty Among Married-Couple Families in Walnut Springs
The poverty statistics for married-couple families in Walnut Springs show that 18.1% or 29 of the total 160 families live below the poverty line. Families with no children have the highest poverty rate of 27.1%, comprising of 29 families. On the other hand, families with 1 or 2 children have the lowest poverty rate of 0.0%, which includes 0 families.
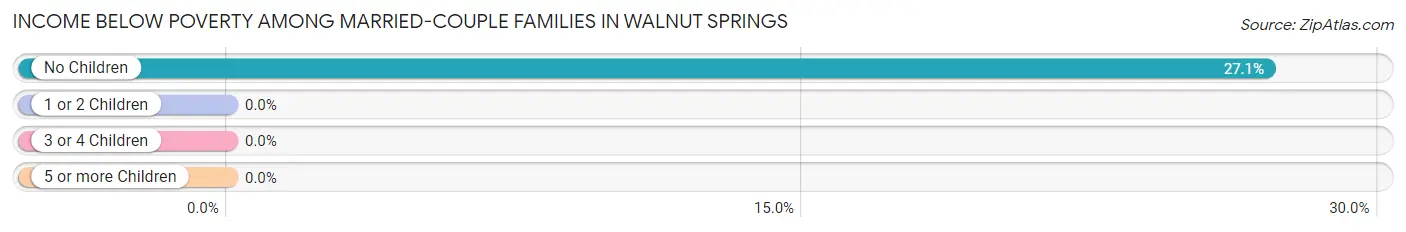
| Children | Above Poverty | Below Poverty |
| No Children | 78 (72.9%) | 29 (27.1%) |
| 1 or 2 Children | 21 (100.0%) | 0 (0.0%) |
| 3 or 4 Children | 32 (100.0%) | 0 (0.0%) |
| 5 or more Children | 0 (0.0%) | 0 (0.0%) |
| Total | 131 (81.9%) | 29 (18.1%) |
Income Below Poverty Among Single-Parent Households in Walnut Springs
According to the poverty data in Walnut Springs, 14.3% or 5 single-father households and 25.0% or 11 single-mother households are living below the poverty line. Among single-father households, those with no children have the highest poverty rate, with 5 households (62.5%) experiencing poverty. Likewise, among single-mother households, those with 1 or 2 children have the highest poverty rate, with 7 households (58.3%) falling below the poverty line.
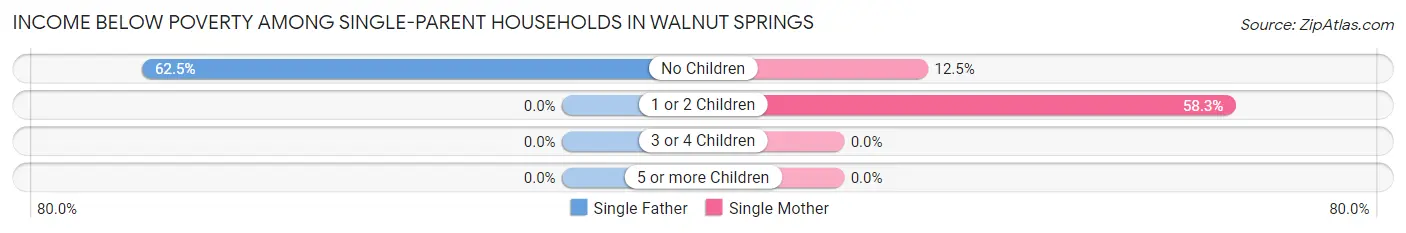
| Children | Single Father | Single Mother |
| No Children | 5 (62.5%) | 4 (12.5%) |
| 1 or 2 Children | 0 (0.0%) | 7 (58.3%) |
| 3 or 4 Children | 0 (0.0%) | 0 (0.0%) |
| 5 or more Children | 0 (0.0%) | 0 (0.0%) |
| Total | 5 (14.3%) | 11 (25.0%) |
Income Below Poverty Among Married-Couple vs Single-Parent Households in Walnut Springs
The poverty data for Walnut Springs shows that 29 of the married-couple family households (18.1%) and 16 of the single-parent households (20.3%) are living below the poverty level. Within the married-couple family households, those with no children have the highest poverty rate, with 29 households (27.1%) falling below the poverty line. Among the single-parent households, those with no children have the highest poverty rate, with 9 household (22.5%) living below poverty.
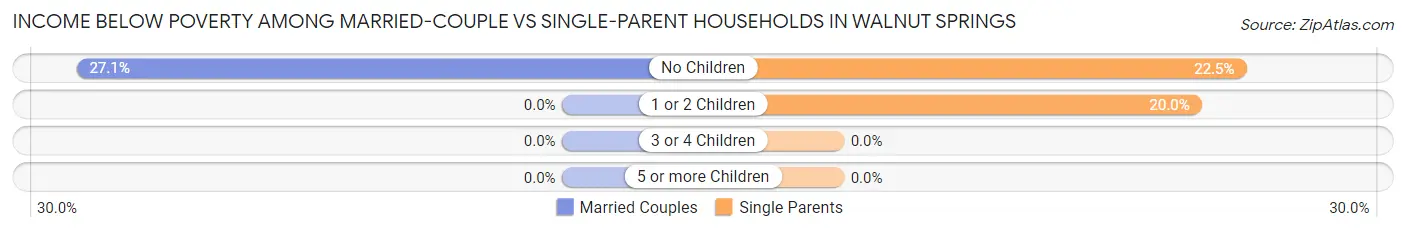
| Children | Married-Couple Families | Single-Parent Households |
| No Children | 29 (27.1%) | 9 (22.5%) |
| 1 or 2 Children | 0 (0.0%) | 7 (20.0%) |
| 3 or 4 Children | 0 (0.0%) | 0 (0.0%) |
| 5 or more Children | 0 (0.0%) | 0 (0.0%) |
| Total | 29 (18.1%) | 16 (20.3%) |
Employment Characteristics in Walnut Springs
Employment by Class of Employer in Walnut Springs
Among the 291 employed individuals in Walnut Springs, private company employees (234 | 80.4%), local government employees (26 | 8.9%), and self-employed (not incorporated) (12 | 4.1%) make up the most common classes of employment.
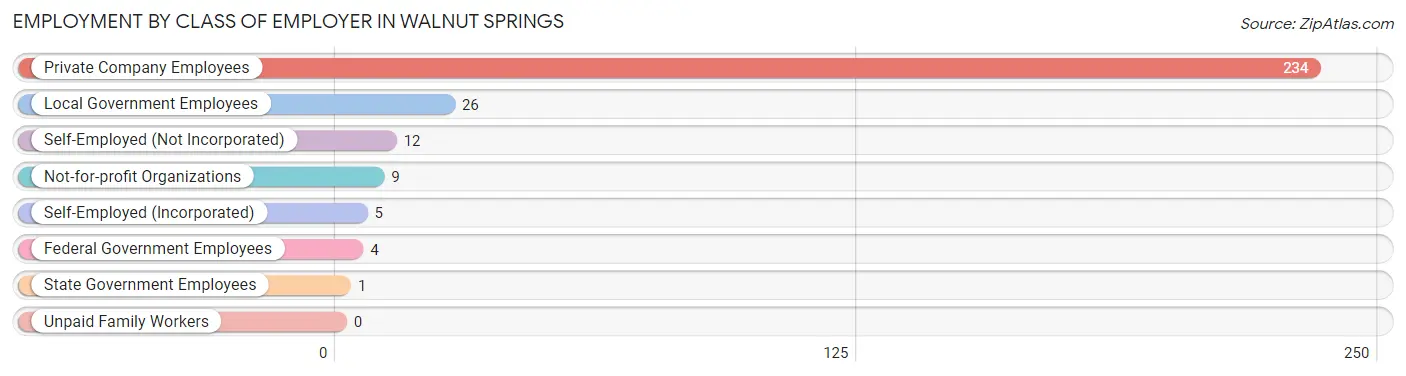
| Employer Class | # Employees | % Employees |
| Private Company Employees | 234 | 80.4% |
| Self-Employed (Incorporated) | 5 | 1.7% |
| Self-Employed (Not Incorporated) | 12 | 4.1% |
| Not-for-profit Organizations | 9 | 3.1% |
| Local Government Employees | 26 | 8.9% |
| State Government Employees | 1 | 0.3% |
| Federal Government Employees | 4 | 1.4% |
| Unpaid Family Workers | 0 | 0.0% |
| Total | 291 | 100.0% |
Employment Status by Age in Walnut Springs
According to the labor force statistics for Walnut Springs, out of the total population over 16 years of age (583), 53.0% or 309 individuals are in the labor force, with 5.5% or 17 of them unemployed. The age group with the highest labor force participation rate is 20 to 24 years, with 82.6% or 71 individuals in the labor force. Within the labor force, the 30 to 34 years age range has the highest percentage of unemployed individuals, with 26.6% or 17 of them being unemployed.
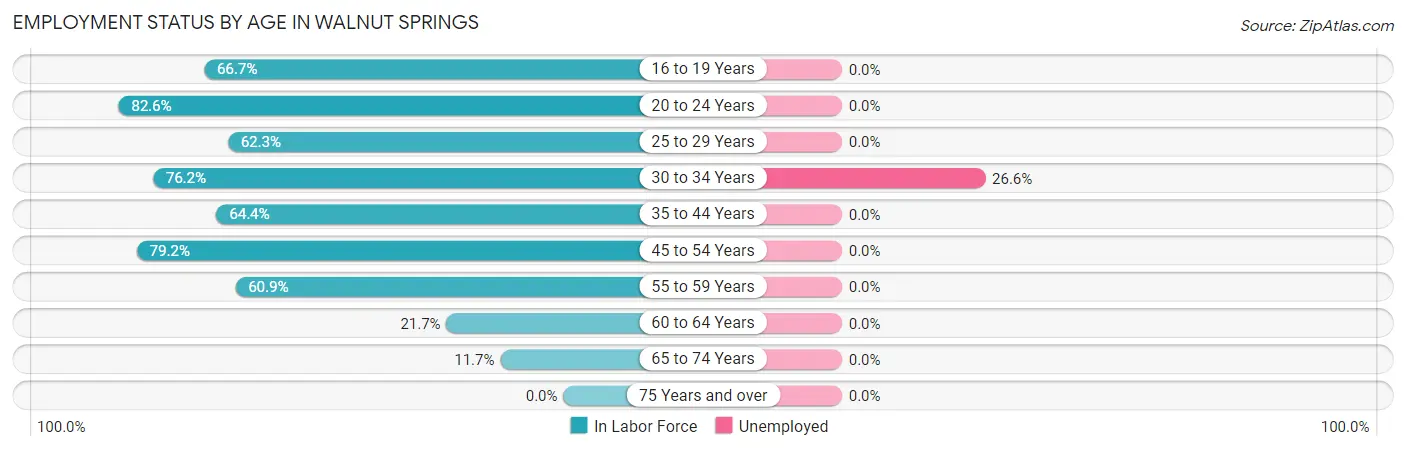
| Age Bracket | In Labor Force | Unemployed |
| 16 to 19 Years | 8 (66.7%) | 0 (0.0%) |
| 20 to 24 Years | 71 (82.6%) | 0 (0.0%) |
| 25 to 29 Years | 33 (62.3%) | 0 (0.0%) |
| 30 to 34 Years | 64 (76.2%) | 17 (26.6%) |
| 35 to 44 Years | 58 (64.4%) | 0 (0.0%) |
| 45 to 54 Years | 42 (79.2%) | 0 (0.0%) |
| 55 to 59 Years | 14 (60.9%) | 0 (0.0%) |
| 60 to 64 Years | 5 (21.7%) | 0 (0.0%) |
| 65 to 74 Years | 14 (11.7%) | 0 (0.0%) |
| 75 Years and over | 0 (0.0%) | 0 (0.0%) |
| Total | 309 (53.0%) | 17 (5.5%) |
Employment Status by Educational Attainment in Walnut Springs
According to labor force statistics for Walnut Springs, 66.3% of individuals (216) out of the total population between 25 and 64 years of age (326) are in the labor force, with 7.9% or 17 of them being unemployed. The group with the highest labor force participation rate are those with the educational attainment of less than high school, with 76.5% or 62 individuals in the labor force. Within the labor force, individuals with college / associate degree education have the highest percentage of unemployment, with 34.7% or 17 of them being unemployed.
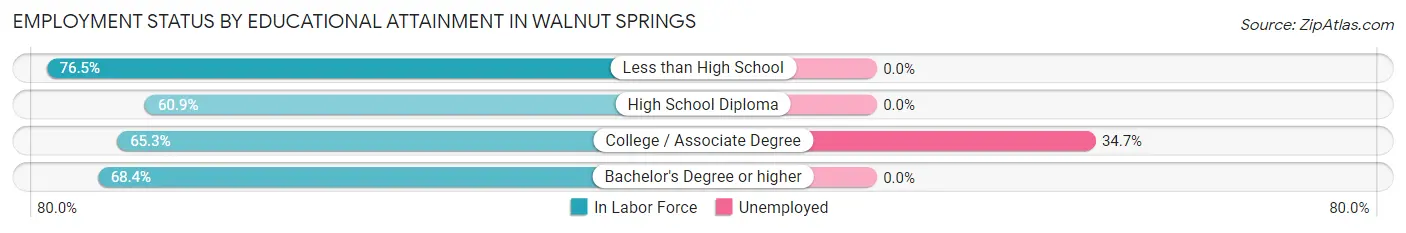
| Educational Attainment | In Labor Force | Unemployed |
| Less than High School | 62 (76.5%) | 0 (0.0%) |
| High School Diploma | 92 (60.9%) | 0 (0.0%) |
| College / Associate Degree | 49 (65.3%) | 26 (34.7%) |
| Bachelor's Degree or higher | 13 (68.4%) | 0 (0.0%) |
| Total | 216 (66.3%) | 26 (7.9%) |
Employment Occupations by Sex in Walnut Springs
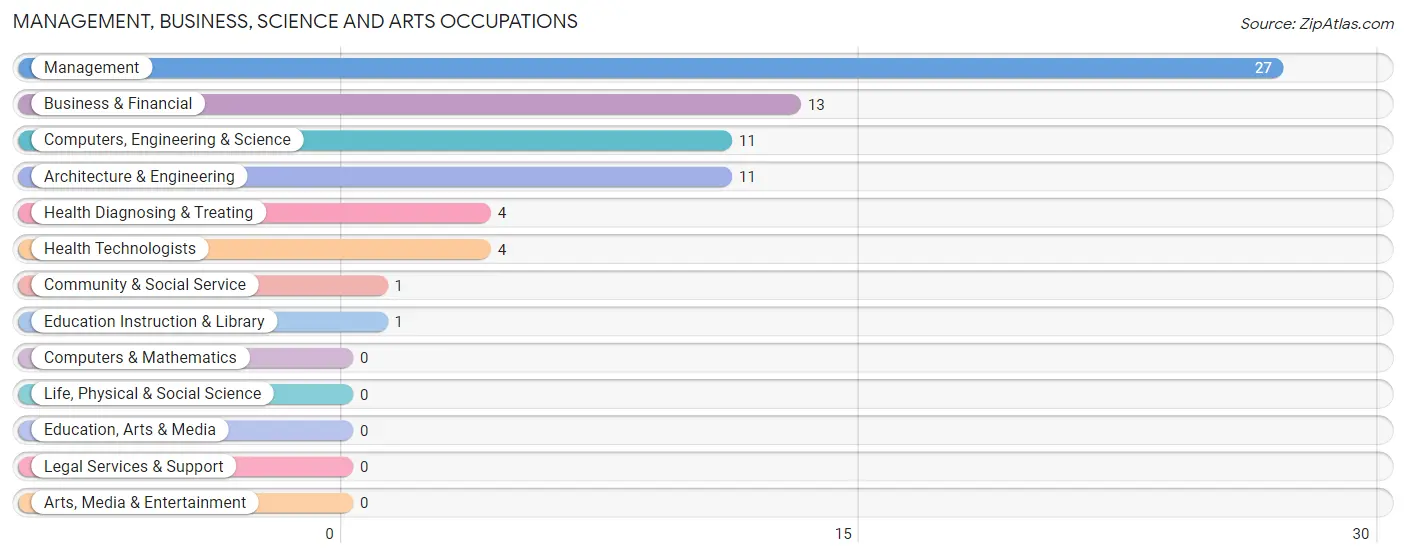
Management, Business, Science and Arts Occupations
The most common Management, Business, Science and Arts occupations in Walnut Springs are Management (27 | 9.2%), Business & Financial (13 | 4.4%), Computers, Engineering & Science (11 | 3.8%), Architecture & Engineering (11 | 3.8%), and Health Diagnosing & Treating (4 | 1.4%).
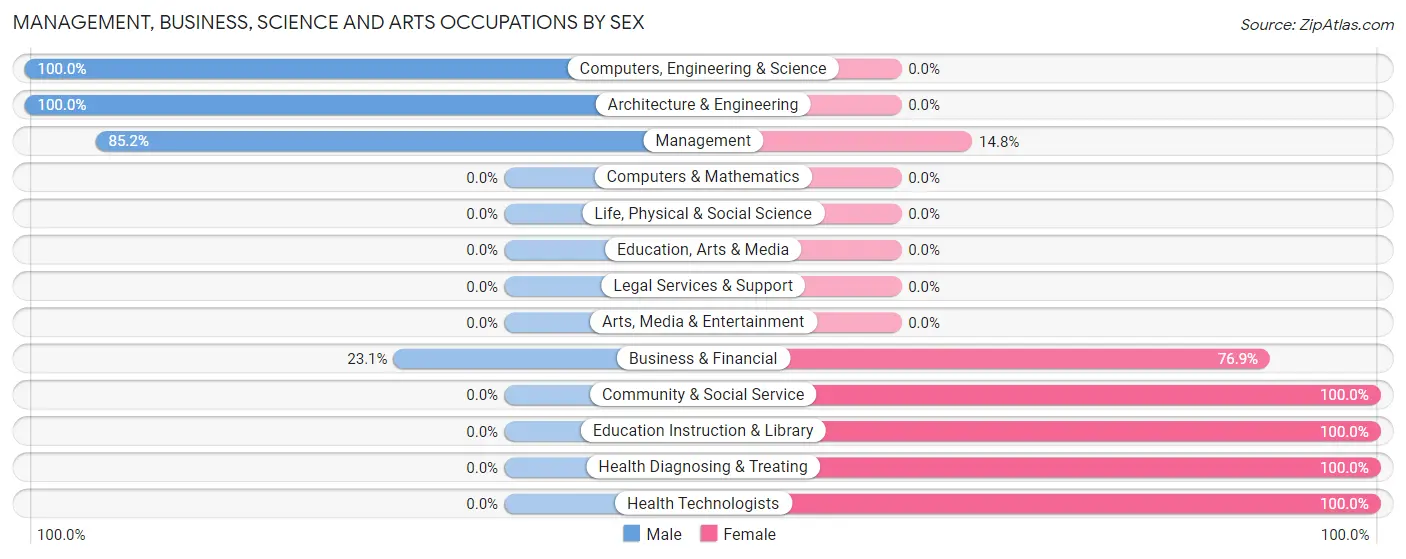
Management, Business, Science and Arts Occupations by Sex
Within the Management, Business, Science and Arts occupations in Walnut Springs, the most male-oriented occupations are Computers, Engineering & Science (100.0%), Architecture & Engineering (100.0%), and Management (85.2%), while the most female-oriented occupations are Community & Social Service (100.0%), Education Instruction & Library (100.0%), and Health Diagnosing & Treating (100.0%).
| Occupation | Male | Female |
| Management | 23 (85.2%) | 4 (14.8%) |
| Business & Financial | 3 (23.1%) | 10 (76.9%) |
| Computers, Engineering & Science | 11 (100.0%) | 0 (0.0%) |
| Computers & Mathematics | 0 (0.0%) | 0 (0.0%) |
| Architecture & Engineering | 11 (100.0%) | 0 (0.0%) |
| Life, Physical & Social Science | 0 (0.0%) | 0 (0.0%) |
| Community & Social Service | 0 (0.0%) | 1 (100.0%) |
| Education, Arts & Media | 0 (0.0%) | 0 (0.0%) |
| Legal Services & Support | 0 (0.0%) | 0 (0.0%) |
| Education Instruction & Library | 0 (0.0%) | 1 (100.0%) |
| Arts, Media & Entertainment | 0 (0.0%) | 0 (0.0%) |
| Health Diagnosing & Treating | 0 (0.0%) | 4 (100.0%) |
| Health Technologists | 0 (0.0%) | 4 (100.0%) |
| Total (Category) | 37 (66.1%) | 19 (33.9%) |
| Total (Overall) | 221 (75.7%) | 71 (24.3%) |
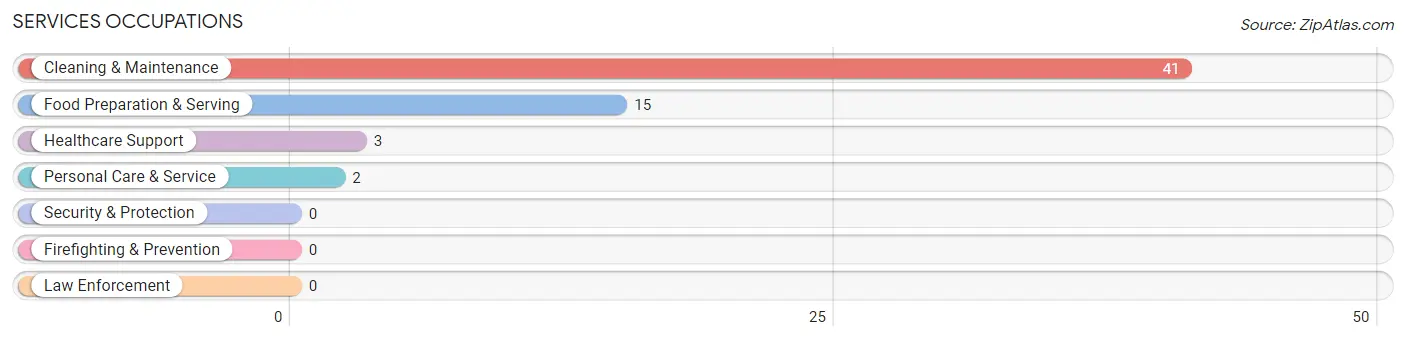
Services Occupations
The most common Services occupations in Walnut Springs are Cleaning & Maintenance (41 | 14.0%), Food Preparation & Serving (15 | 5.1%), Healthcare Support (3 | 1.0%), and Personal Care & Service (2 | 0.7%).
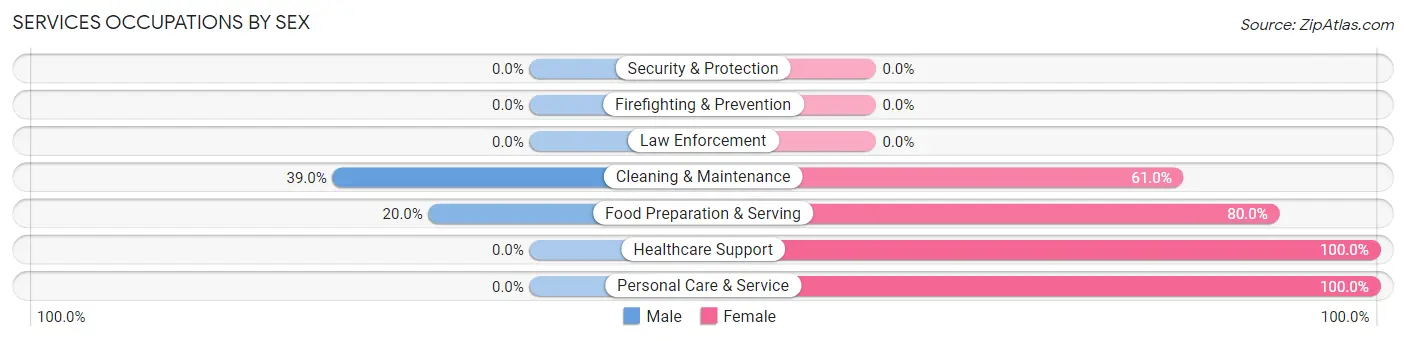
Services Occupations by Sex
Within the Services occupations in Walnut Springs, the most male-oriented occupations are Cleaning & Maintenance (39.0%), and Food Preparation & Serving (20.0%), while the most female-oriented occupations are Healthcare Support (100.0%), Personal Care & Service (100.0%), and Food Preparation & Serving (80.0%).
| Occupation | Male | Female |
| Healthcare Support | 0 (0.0%) | 3 (100.0%) |
| Security & Protection | 0 (0.0%) | 0 (0.0%) |
| Firefighting & Prevention | 0 (0.0%) | 0 (0.0%) |
| Law Enforcement | 0 (0.0%) | 0 (0.0%) |
| Food Preparation & Serving | 3 (20.0%) | 12 (80.0%) |
| Cleaning & Maintenance | 16 (39.0%) | 25 (61.0%) |
| Personal Care & Service | 0 (0.0%) | 2 (100.0%) |
| Total (Category) | 19 (31.1%) | 42 (68.9%) |
| Total (Overall) | 221 (75.7%) | 71 (24.3%) |
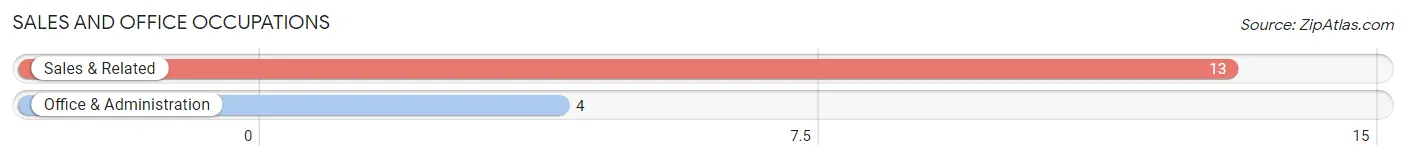
Sales and Office Occupations
The most common Sales and Office occupations in Walnut Springs are Sales & Related (13 | 4.4%), and Office & Administration (4 | 1.4%).
Sales and Office Occupations by Sex

| Occupation | Male | Female |
| Sales & Related | 7 (53.8%) | 6 (46.2%) |
| Office & Administration | 0 (0.0%) | 4 (100.0%) |
| Total (Category) | 7 (41.2%) | 10 (58.8%) |
| Total (Overall) | 221 (75.7%) | 71 (24.3%) |
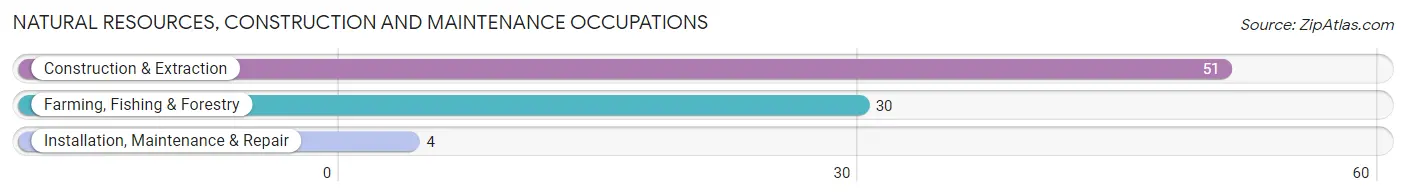
Natural Resources, Construction and Maintenance Occupations
The most common Natural Resources, Construction and Maintenance occupations in Walnut Springs are Construction & Extraction (51 | 17.5%), Farming, Fishing & Forestry (30 | 10.3%), and Installation, Maintenance & Repair (4 | 1.4%).
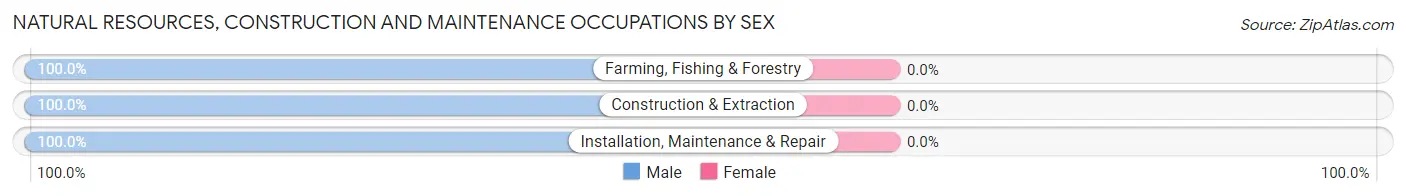
Natural Resources, Construction and Maintenance Occupations by Sex
| Occupation | Male | Female |
| Farming, Fishing & Forestry | 30 (100.0%) | 0 (0.0%) |
| Construction & Extraction | 51 (100.0%) | 0 (0.0%) |
| Installation, Maintenance & Repair | 4 (100.0%) | 0 (0.0%) |
| Total (Category) | 85 (100.0%) | 0 (0.0%) |
| Total (Overall) | 221 (75.7%) | 71 (24.3%) |
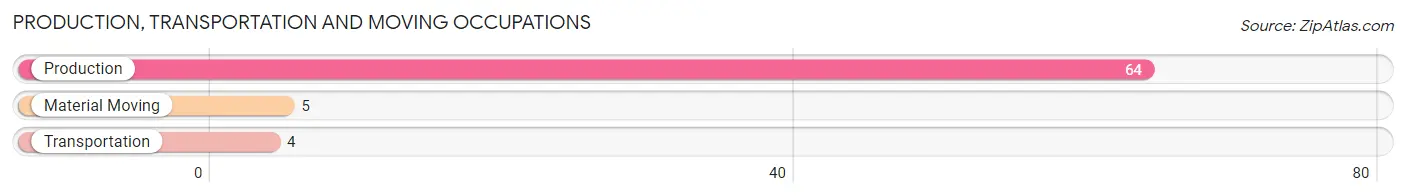
Production, Transportation and Moving Occupations
The most common Production, Transportation and Moving occupations in Walnut Springs are Production (64 | 21.9%), Material Moving (5 | 1.7%), and Transportation (4 | 1.4%).
Production, Transportation and Moving Occupations by Sex
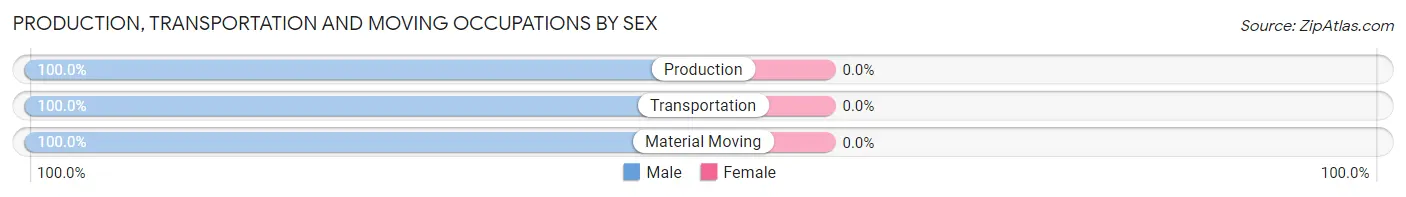
| Occupation | Male | Female |
| Production | 64 (100.0%) | 0 (0.0%) |
| Transportation | 4 (100.0%) | 0 (0.0%) |
| Material Moving | 5 (100.0%) | 0 (0.0%) |
| Total (Category) | 73 (100.0%) | 0 (0.0%) |
| Total (Overall) | 221 (75.7%) | 71 (24.3%) |
Employment Industries by Sex in Walnut Springs
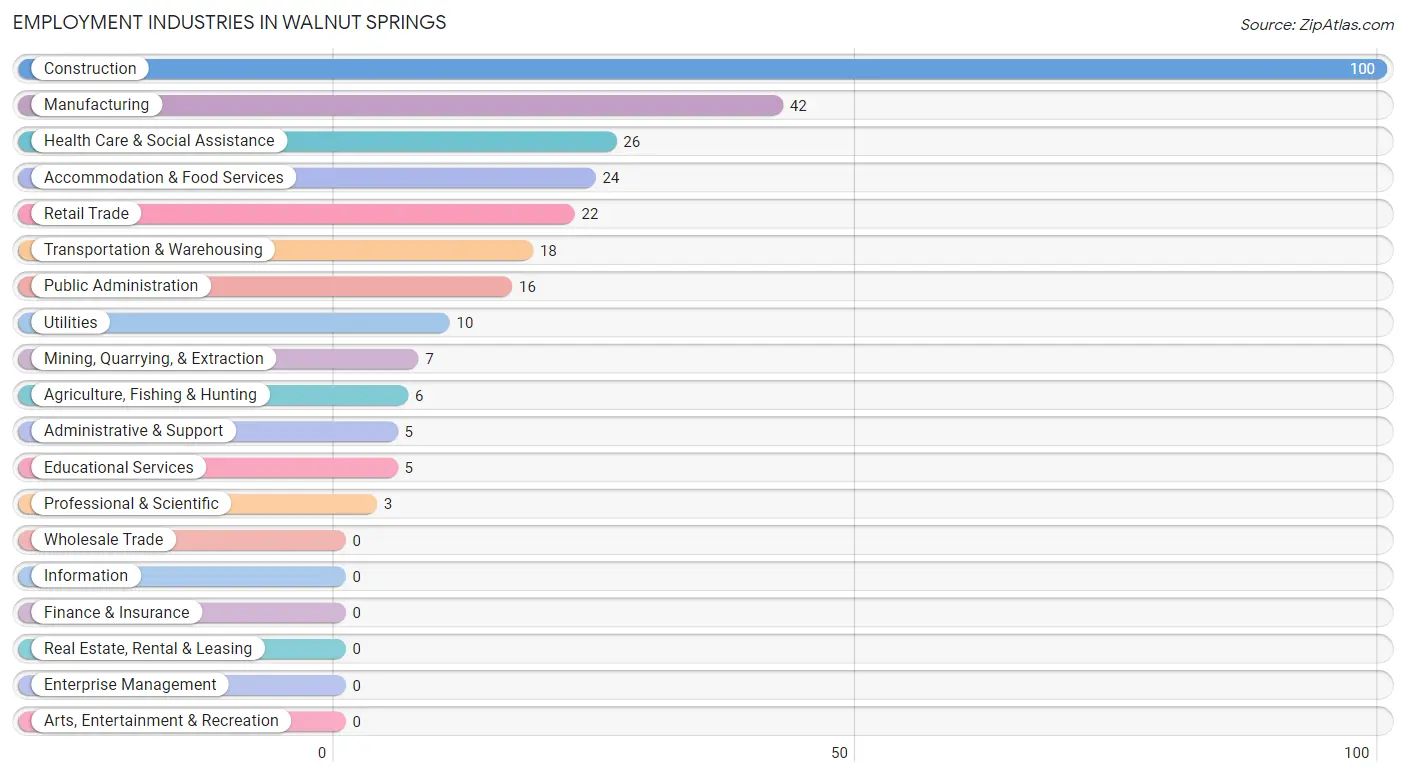
Employment Industries in Walnut Springs
The major employment industries in Walnut Springs include Construction (100 | 34.3%), Manufacturing (42 | 14.4%), Health Care & Social Assistance (26 | 8.9%), Accommodation & Food Services (24 | 8.2%), and Retail Trade (22 | 7.5%).
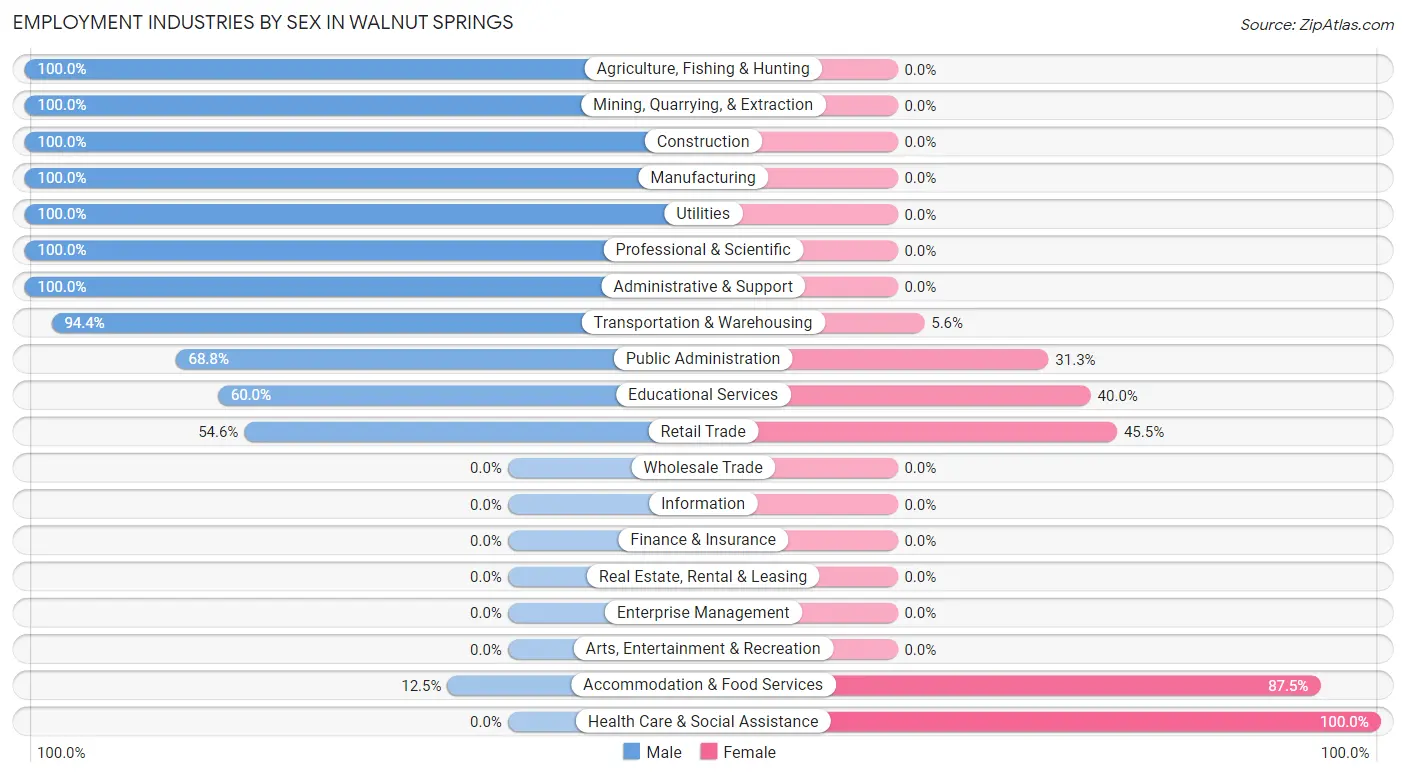
Employment Industries by Sex in Walnut Springs
The Walnut Springs industries that see more men than women are Agriculture, Fishing & Hunting (100.0%), Mining, Quarrying, & Extraction (100.0%), and Construction (100.0%), whereas the industries that tend to have a higher number of women are Health Care & Social Assistance (100.0%), Accommodation & Food Services (87.5%), and Retail Trade (45.5%).
| Industry | Male | Female |
| Agriculture, Fishing & Hunting | 6 (100.0%) | 0 (0.0%) |
| Mining, Quarrying, & Extraction | 7 (100.0%) | 0 (0.0%) |
| Construction | 100 (100.0%) | 0 (0.0%) |
| Manufacturing | 42 (100.0%) | 0 (0.0%) |
| Wholesale Trade | 0 (0.0%) | 0 (0.0%) |
| Retail Trade | 12 (54.5%) | 10 (45.5%) |
| Transportation & Warehousing | 17 (94.4%) | 1 (5.6%) |
| Utilities | 10 (100.0%) | 0 (0.0%) |
| Information | 0 (0.0%) | 0 (0.0%) |
| Finance & Insurance | 0 (0.0%) | 0 (0.0%) |
| Real Estate, Rental & Leasing | 0 (0.0%) | 0 (0.0%) |
| Professional & Scientific | 3 (100.0%) | 0 (0.0%) |
| Enterprise Management | 0 (0.0%) | 0 (0.0%) |
| Administrative & Support | 5 (100.0%) | 0 (0.0%) |
| Educational Services | 3 (60.0%) | 2 (40.0%) |
| Health Care & Social Assistance | 0 (0.0%) | 26 (100.0%) |
| Arts, Entertainment & Recreation | 0 (0.0%) | 0 (0.0%) |
| Accommodation & Food Services | 3 (12.5%) | 21 (87.5%) |
| Public Administration | 11 (68.8%) | 5 (31.2%) |
| Total | 221 (75.7%) | 71 (24.3%) |
Education in Walnut Springs
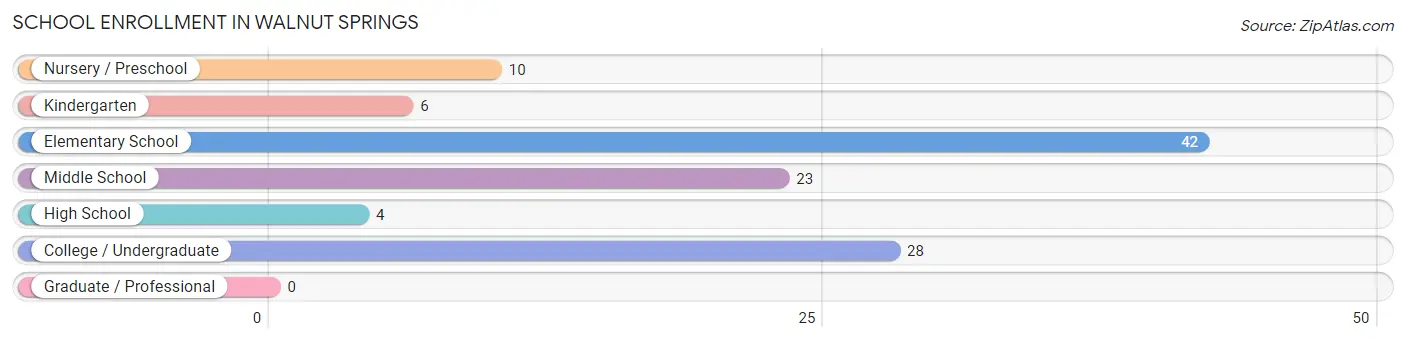
School Enrollment in Walnut Springs
The most common levels of schooling among the 113 students in Walnut Springs are elementary school (42 | 37.2%), college / undergraduate (28 | 24.8%), and middle school (23 | 20.3%).
| School Level | # Students | % Students |
| Nursery / Preschool | 10 | 8.8% |
| Kindergarten | 6 | 5.3% |
| Elementary School | 42 | 37.2% |
| Middle School | 23 | 20.3% |
| High School | 4 | 3.5% |
| College / Undergraduate | 28 | 24.8% |
| Graduate / Professional | 0 | 0.0% |
| Total | 113 | 100.0% |
School Enrollment by Age by Funding Source in Walnut Springs
Out of a total of 113 students who are enrolled in schools in Walnut Springs, 2 (1.8%) attend a private institution, while the remaining 111 (98.2%) are enrolled in public schools. The age group of 20 to 24 year olds has the highest likelihood of being enrolled in private schools, with 2 (100.0% in the age bracket) enrolled. Conversely, the age group of 3 to 4 year olds has the lowest likelihood of being enrolled in a private school, with 10 (100.0% in the age bracket) attending a public institution.
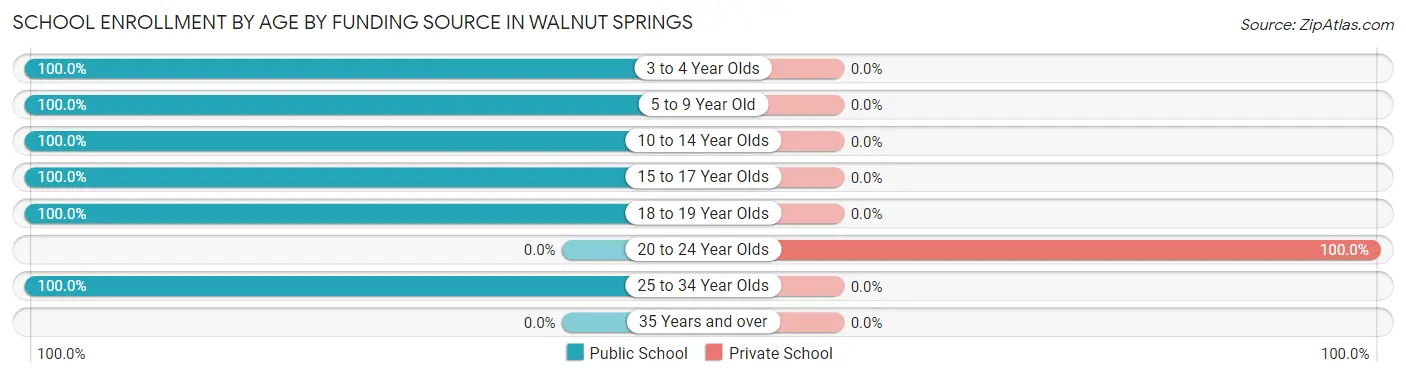
| Age Bracket | Public School | Private School |
| 3 to 4 Year Olds | 10 (100.0%) | 0 (0.0%) |
| 5 to 9 Year Old | 48 (100.0%) | 0 (0.0%) |
| 10 to 14 Year Olds | 23 (100.0%) | 0 (0.0%) |
| 15 to 17 Year Olds | 4 (100.0%) | 0 (0.0%) |
| 18 to 19 Year Olds | 8 (100.0%) | 0 (0.0%) |
| 20 to 24 Year Olds | 0 (0.0%) | 2 (100.0%) |
| 25 to 34 Year Olds | 18 (100.0%) | 0 (0.0%) |
| 35 Years and over | 0 (0.0%) | 0 (0.0%) |
| Total | 111 (98.2%) | 2 (1.8%) |
Educational Attainment by Field of Study in Walnut Springs
Arts & humanities (13 | 35.1%), education (11 | 29.7%), bio, nature & agricultural (7 | 18.9%), engineering (3 | 8.1%), and business (2 | 5.4%) are the most common fields of study among 37 individuals in Walnut Springs who have obtained a bachelor's degree or higher.
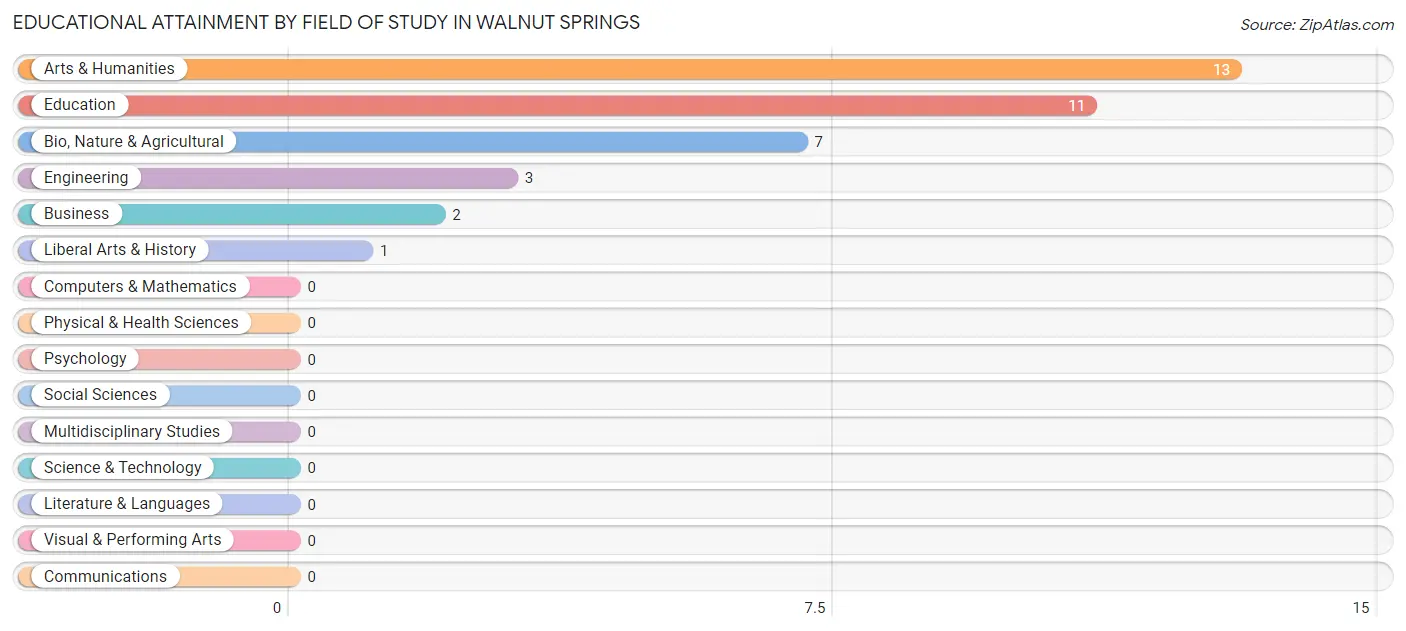
| Field of Study | # Graduates | % Graduates |
| Computers & Mathematics | 0 | 0.0% |
| Bio, Nature & Agricultural | 7 | 18.9% |
| Physical & Health Sciences | 0 | 0.0% |
| Psychology | 0 | 0.0% |
| Social Sciences | 0 | 0.0% |
| Engineering | 3 | 8.1% |
| Multidisciplinary Studies | 0 | 0.0% |
| Science & Technology | 0 | 0.0% |
| Business | 2 | 5.4% |
| Education | 11 | 29.7% |
| Literature & Languages | 0 | 0.0% |
| Liberal Arts & History | 1 | 2.7% |
| Visual & Performing Arts | 0 | 0.0% |
| Communications | 0 | 0.0% |
| Arts & Humanities | 13 | 35.1% |
| Total | 37 | 100.0% |
Transportation & Commute in Walnut Springs
Vehicle Availability by Sex in Walnut Springs
The most prevalent vehicle ownership categories in Walnut Springs are males with 3 vehicles (86, accounting for 38.9%) and females with 3 vehicles (12, making up 122.9%).
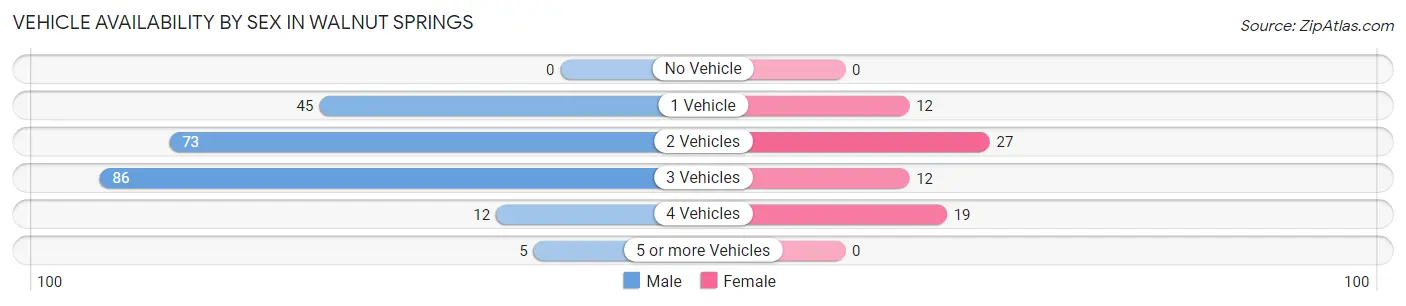
| Vehicles Available | Male | Female |
| No Vehicle | 0 (0.0%) | 0 (0.0%) |
| 1 Vehicle | 45 (20.4%) | 12 (17.1%) |
| 2 Vehicles | 73 (33.0%) | 27 (38.6%) |
| 3 Vehicles | 86 (38.9%) | 12 (17.1%) |
| 4 Vehicles | 12 (5.4%) | 19 (27.1%) |
| 5 or more Vehicles | 5 (2.3%) | 0 (0.0%) |
| Total | 221 (100.0%) | 70 (100.0%) |
Commute Time in Walnut Springs
The most frequently occuring commute durations in Walnut Springs are 20 to 24 minutes (58 commuters, 21.2%), 45 to 59 minutes (49 commuters, 17.9%), and 60 to 89 minutes (45 commuters, 16.4%).
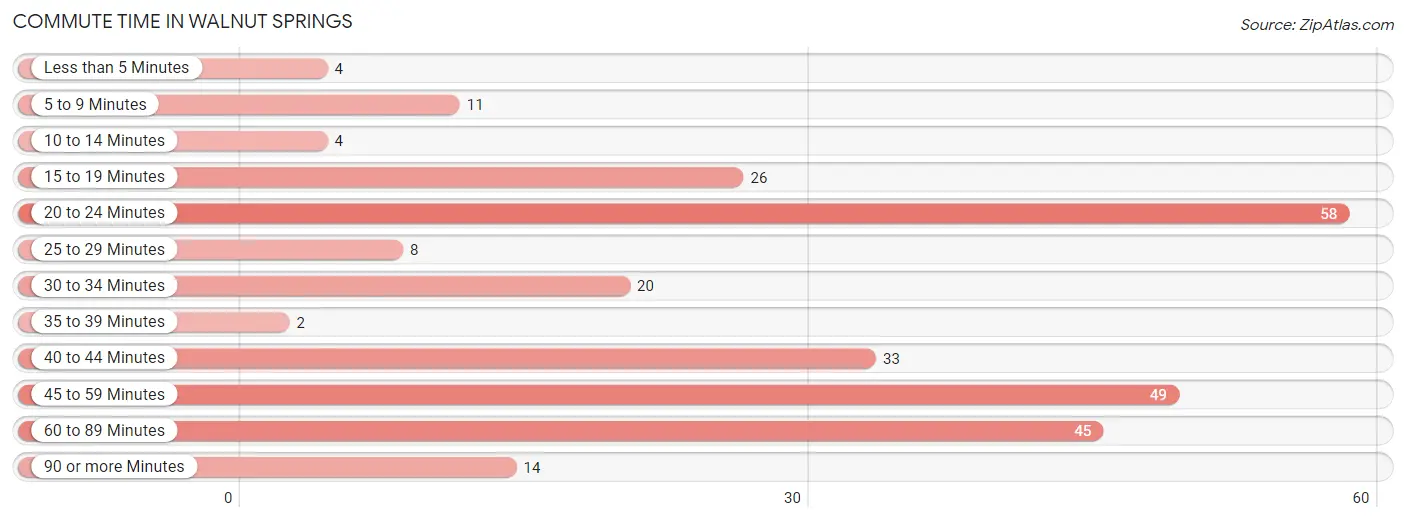
| Commute Time | # Commuters | % Commuters |
| Less than 5 Minutes | 4 | 1.5% |
| 5 to 9 Minutes | 11 | 4.0% |
| 10 to 14 Minutes | 4 | 1.5% |
| 15 to 19 Minutes | 26 | 9.5% |
| 20 to 24 Minutes | 58 | 21.2% |
| 25 to 29 Minutes | 8 | 2.9% |
| 30 to 34 Minutes | 20 | 7.3% |
| 35 to 39 Minutes | 2 | 0.7% |
| 40 to 44 Minutes | 33 | 12.0% |
| 45 to 59 Minutes | 49 | 17.9% |
| 60 to 89 Minutes | 45 | 16.4% |
| 90 or more Minutes | 14 | 5.1% |
Commute Time by Sex in Walnut Springs
The most common commute times in Walnut Springs are 45 to 59 minutes (47 commuters, 22.0%) for males and 20 to 24 minutes (24 commuters, 40.0%) for females.
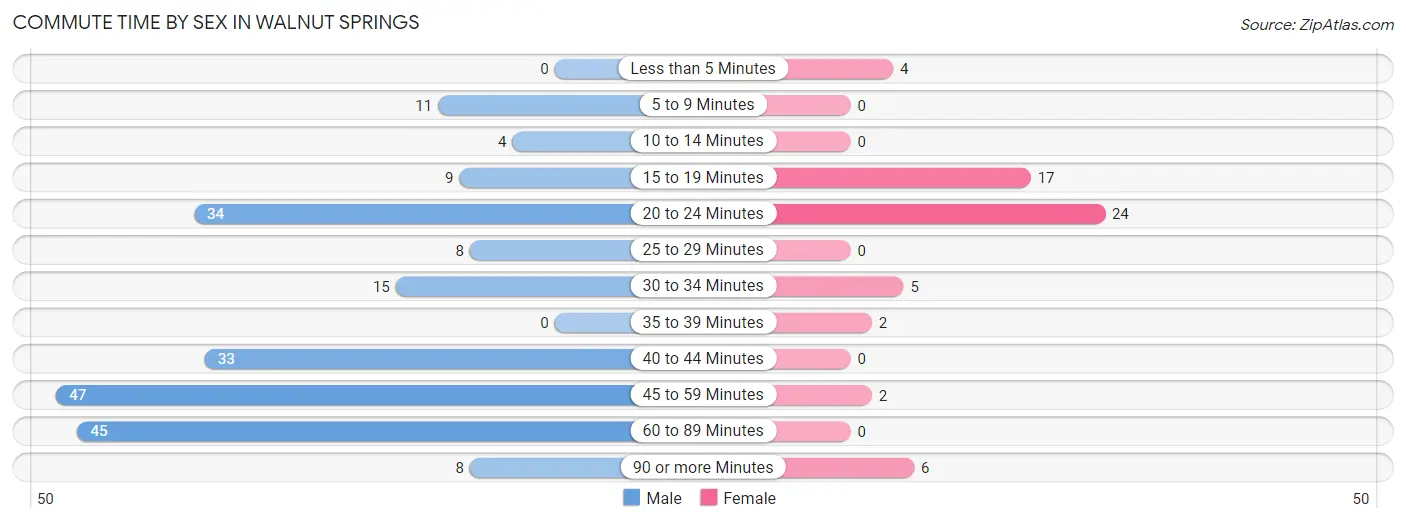
| Commute Time | Male | Female |
| Less than 5 Minutes | 0 (0.0%) | 4 (6.7%) |
| 5 to 9 Minutes | 11 (5.1%) | 0 (0.0%) |
| 10 to 14 Minutes | 4 (1.9%) | 0 (0.0%) |
| 15 to 19 Minutes | 9 (4.2%) | 17 (28.3%) |
| 20 to 24 Minutes | 34 (15.9%) | 24 (40.0%) |
| 25 to 29 Minutes | 8 (3.7%) | 0 (0.0%) |
| 30 to 34 Minutes | 15 (7.0%) | 5 (8.3%) |
| 35 to 39 Minutes | 0 (0.0%) | 2 (3.3%) |
| 40 to 44 Minutes | 33 (15.4%) | 0 (0.0%) |
| 45 to 59 Minutes | 47 (22.0%) | 2 (3.3%) |
| 60 to 89 Minutes | 45 (21.0%) | 0 (0.0%) |
| 90 or more Minutes | 8 (3.7%) | 6 (10.0%) |
Time of Departure to Work by Sex in Walnut Springs
The most frequent times of departure to work in Walnut Springs are 6:30 AM to 6:59 AM (69, 32.2%) for males and 7:30 AM to 7:59 AM (18, 30.0%) for females.
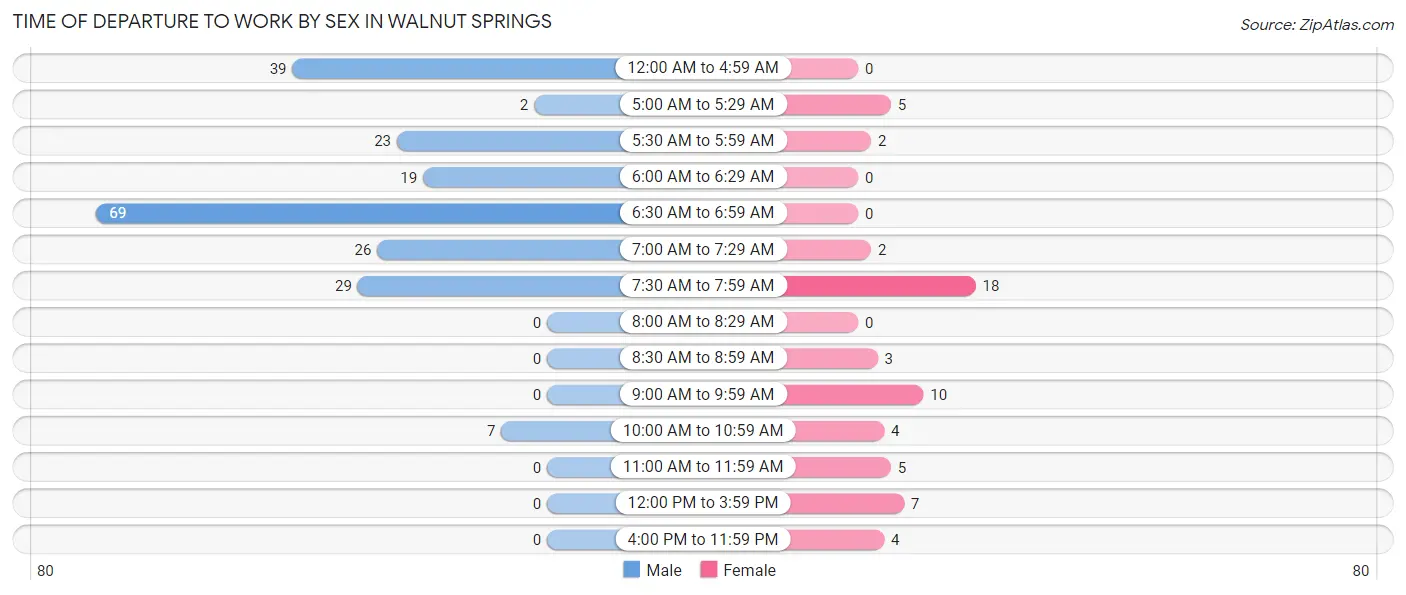
| Time of Departure | Male | Female |
| 12:00 AM to 4:59 AM | 39 (18.2%) | 0 (0.0%) |
| 5:00 AM to 5:29 AM | 2 (0.9%) | 5 (8.3%) |
| 5:30 AM to 5:59 AM | 23 (10.7%) | 2 (3.3%) |
| 6:00 AM to 6:29 AM | 19 (8.9%) | 0 (0.0%) |
| 6:30 AM to 6:59 AM | 69 (32.2%) | 0 (0.0%) |
| 7:00 AM to 7:29 AM | 26 (12.1%) | 2 (3.3%) |
| 7:30 AM to 7:59 AM | 29 (13.6%) | 18 (30.0%) |
| 8:00 AM to 8:29 AM | 0 (0.0%) | 0 (0.0%) |
| 8:30 AM to 8:59 AM | 0 (0.0%) | 3 (5.0%) |
| 9:00 AM to 9:59 AM | 0 (0.0%) | 10 (16.7%) |
| 10:00 AM to 10:59 AM | 7 (3.3%) | 4 (6.7%) |
| 11:00 AM to 11:59 AM | 0 (0.0%) | 5 (8.3%) |
| 12:00 PM to 3:59 PM | 0 (0.0%) | 7 (11.7%) |
| 4:00 PM to 11:59 PM | 0 (0.0%) | 4 (6.7%) |
| Total | 214 (100.0%) | 60 (100.0%) |
Housing Occupancy in Walnut Springs
Occupancy by Ownership in Walnut Springs
Of the total 314 dwellings in Walnut Springs, owner-occupied units account for 192 (61.2%), while renter-occupied units make up 122 (38.9%).
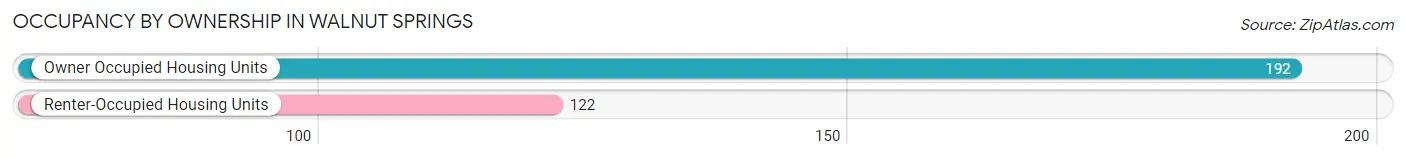
| Occupancy | # Housing Units | % Housing Units |
| Owner Occupied Housing Units | 192 | 61.2% |
| Renter-Occupied Housing Units | 122 | 38.9% |
| Total Occupied Housing Units | 314 | 100.0% |
Occupancy by Household Size in Walnut Springs
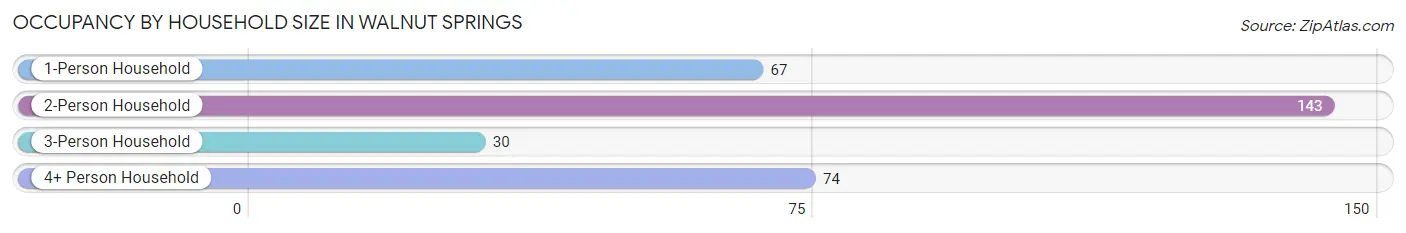
| Household Size | # Housing Units | % Housing Units |
| 1-Person Household | 67 | 21.3% |
| 2-Person Household | 143 | 45.5% |
| 3-Person Household | 30 | 9.6% |
| 4+ Person Household | 74 | 23.6% |
| Total Housing Units | 314 | 100.0% |
Occupancy by Ownership by Household Size in Walnut Springs
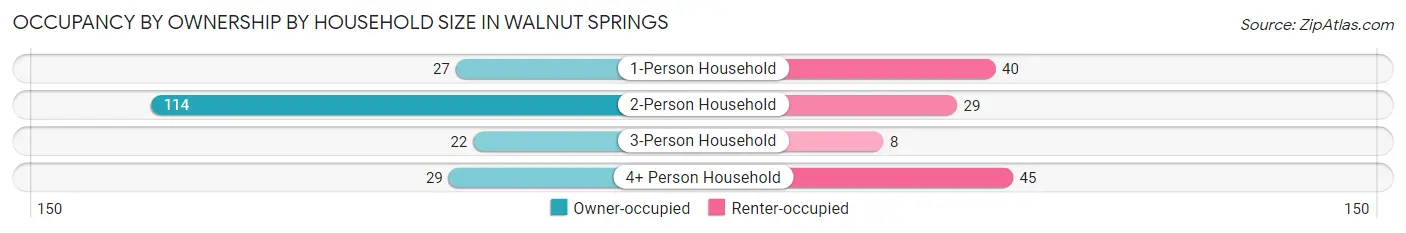
| Household Size | Owner-occupied | Renter-occupied |
| 1-Person Household | 27 (40.3%) | 40 (59.7%) |
| 2-Person Household | 114 (79.7%) | 29 (20.3%) |
| 3-Person Household | 22 (73.3%) | 8 (26.7%) |
| 4+ Person Household | 29 (39.2%) | 45 (60.8%) |
| Total Housing Units | 192 (61.2%) | 122 (38.9%) |
Occupancy by Educational Attainment in Walnut Springs
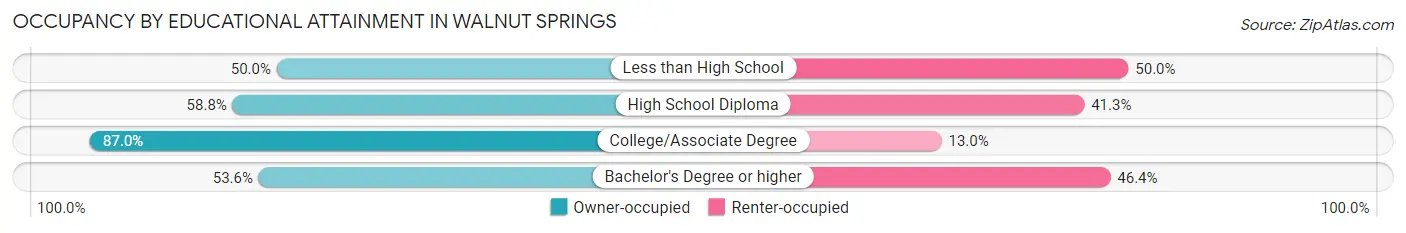
| Household Size | Owner-occupied | Renter-occupied |
| Less than High School | 36 (50.0%) | 36 (50.0%) |
| High School Diploma | 94 (58.8%) | 66 (41.2%) |
| College/Associate Degree | 47 (87.0%) | 7 (13.0%) |
| Bachelor's Degree or higher | 15 (53.6%) | 13 (46.4%) |
Occupancy by Age of Householder in Walnut Springs
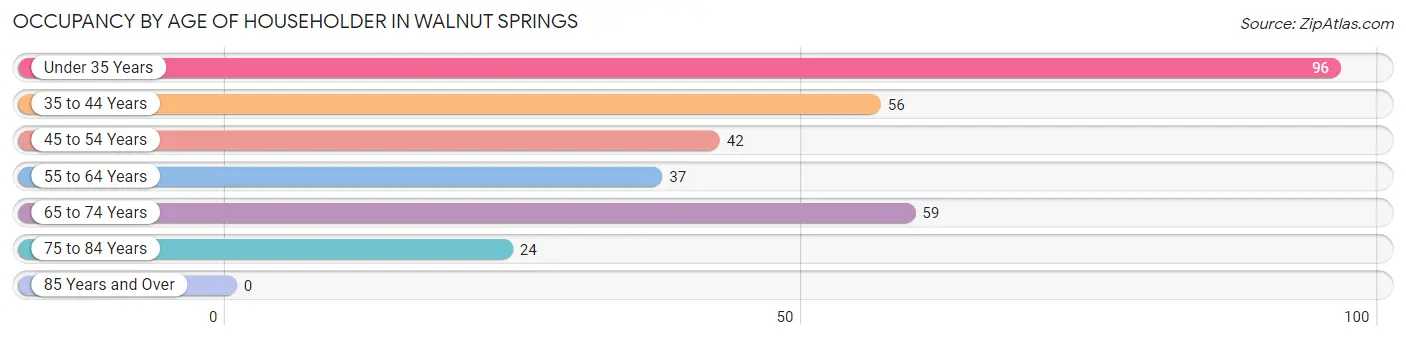
| Age Bracket | # Households | % Households |
| Under 35 Years | 96 | 30.6% |
| 35 to 44 Years | 56 | 17.8% |
| 45 to 54 Years | 42 | 13.4% |
| 55 to 64 Years | 37 | 11.8% |
| 65 to 74 Years | 59 | 18.8% |
| 75 to 84 Years | 24 | 7.6% |
| 85 Years and Over | 0 | 0.0% |
| Total | 314 | 100.0% |
Housing Finances in Walnut Springs
Median Income by Occupancy in Walnut Springs
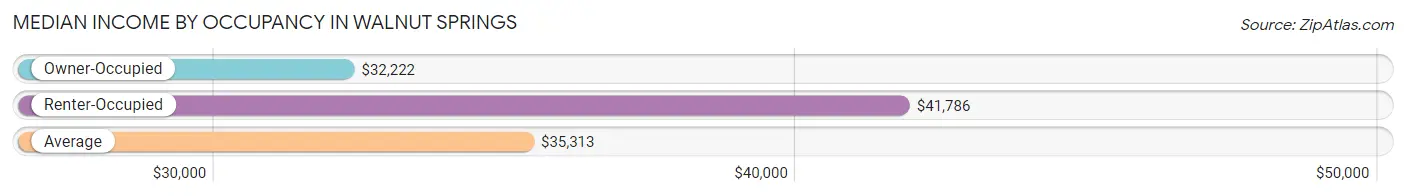
| Occupancy Type | # Households | Median Income |
| Owner-Occupied | 192 (61.2%) | $32,222 |
| Renter-Occupied | 122 (38.9%) | $41,786 |
| Average | 314 (100.0%) | $35,313 |
Occupancy by Householder Income Bracket in Walnut Springs
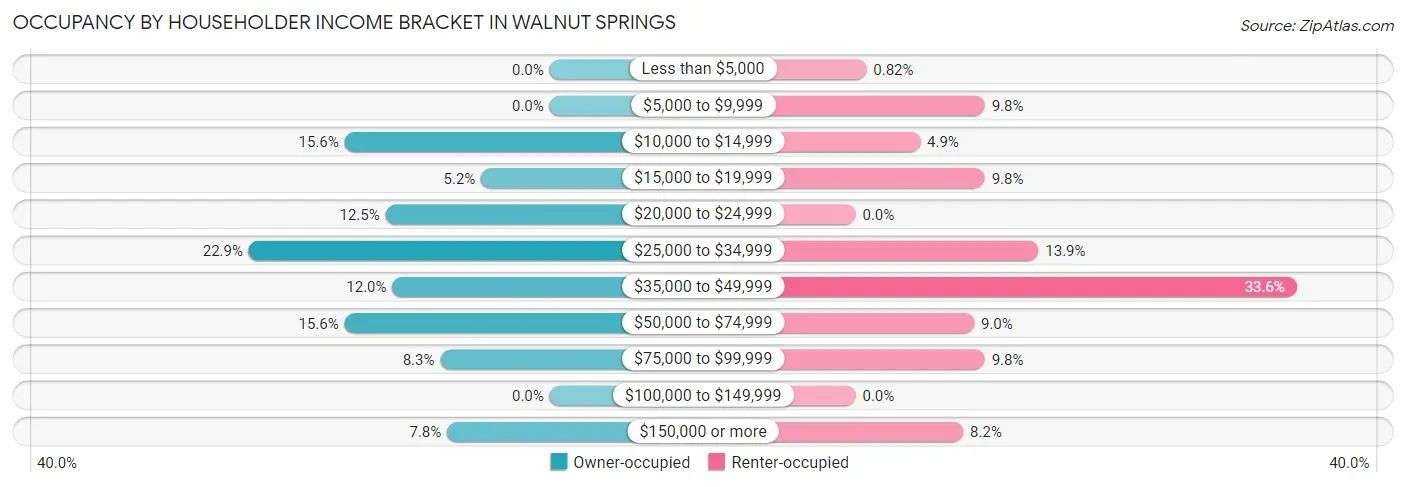
| Income Bracket | Owner-occupied | Renter-occupied |
| Less than $5,000 | 0 (0.0%) | 1 (0.8%) |
| $5,000 to $9,999 | 0 (0.0%) | 12 (9.8%) |
| $10,000 to $14,999 | 30 (15.6%) | 6 (4.9%) |
| $15,000 to $19,999 | 10 (5.2%) | 12 (9.8%) |
| $20,000 to $24,999 | 24 (12.5%) | 0 (0.0%) |
| $25,000 to $34,999 | 44 (22.9%) | 17 (13.9%) |
| $35,000 to $49,999 | 23 (12.0%) | 41 (33.6%) |
| $50,000 to $74,999 | 30 (15.6%) | 11 (9.0%) |
| $75,000 to $99,999 | 16 (8.3%) | 12 (9.8%) |
| $100,000 to $149,999 | 0 (0.0%) | 0 (0.0%) |
| $150,000 or more | 15 (7.8%) | 10 (8.2%) |
| Total | 192 (100.0%) | 122 (100.0%) |
Monthly Housing Cost Tiers in Walnut Springs
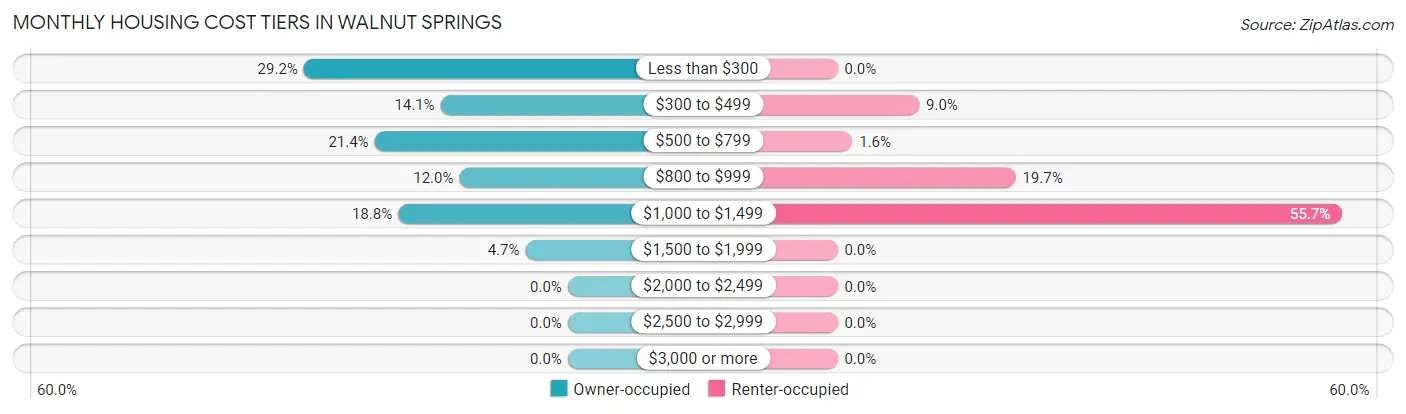
| Monthly Cost | Owner-occupied | Renter-occupied |
| Less than $300 | 56 (29.2%) | 0 (0.0%) |
| $300 to $499 | 27 (14.1%) | 11 (9.0%) |
| $500 to $799 | 41 (21.3%) | 2 (1.6%) |
| $800 to $999 | 23 (12.0%) | 24 (19.7%) |
| $1,000 to $1,499 | 36 (18.8%) | 68 (55.7%) |
| $1,500 to $1,999 | 9 (4.7%) | 0 (0.0%) |
| $2,000 to $2,499 | 0 (0.0%) | 0 (0.0%) |
| $2,500 to $2,999 | 0 (0.0%) | 0 (0.0%) |
| $3,000 or more | 0 (0.0%) | 0 (0.0%) |
| Total | 192 (100.0%) | 122 (100.0%) |
Physical Housing Characteristics in Walnut Springs
Housing Structures in Walnut Springs
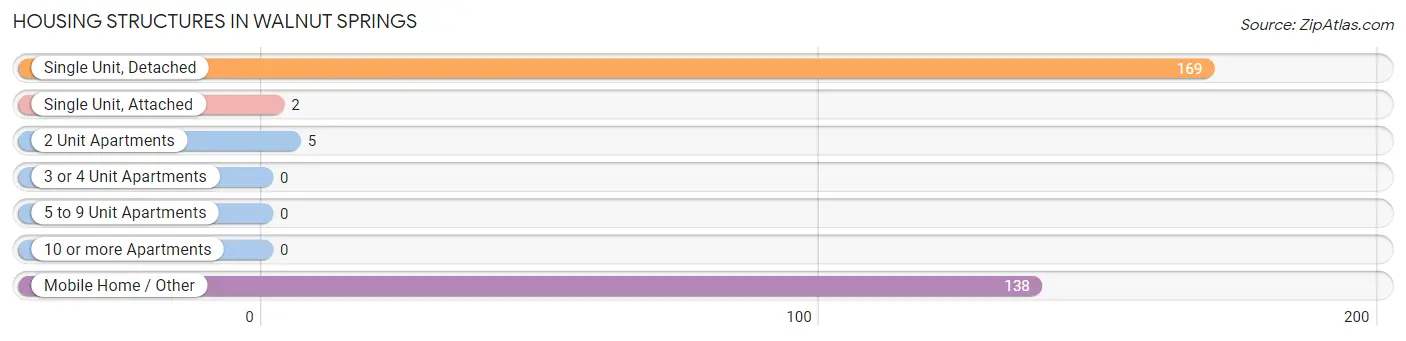
| Structure Type | # Housing Units | % Housing Units |
| Single Unit, Detached | 169 | 53.8% |
| Single Unit, Attached | 2 | 0.6% |
| 2 Unit Apartments | 5 | 1.6% |
| 3 or 4 Unit Apartments | 0 | 0.0% |
| 5 to 9 Unit Apartments | 0 | 0.0% |
| 10 or more Apartments | 0 | 0.0% |
| Mobile Home / Other | 138 | 44.0% |
| Total | 314 | 100.0% |
Housing Structures by Occupancy in Walnut Springs
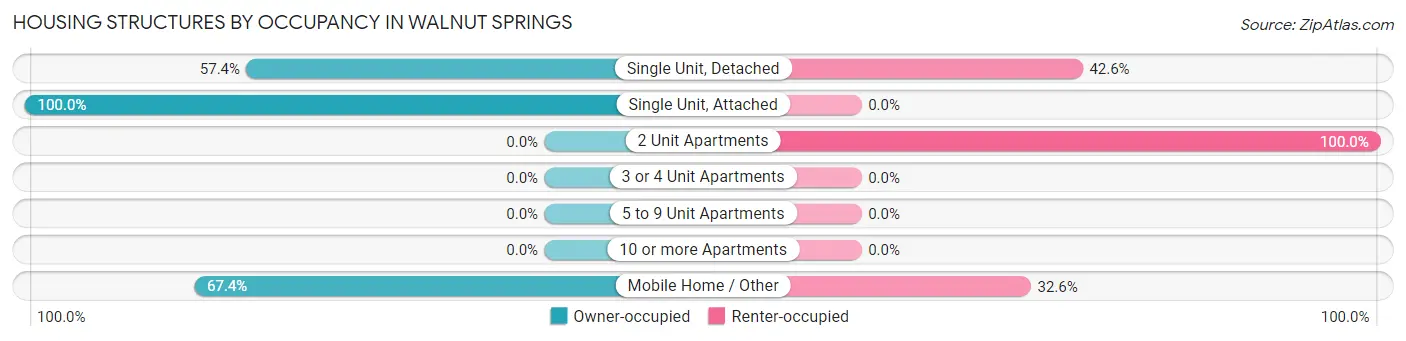
| Structure Type | Owner-occupied | Renter-occupied |
| Single Unit, Detached | 97 (57.4%) | 72 (42.6%) |
| Single Unit, Attached | 2 (100.0%) | 0 (0.0%) |
| 2 Unit Apartments | 0 (0.0%) | 5 (100.0%) |
| 3 or 4 Unit Apartments | 0 (0.0%) | 0 (0.0%) |
| 5 to 9 Unit Apartments | 0 (0.0%) | 0 (0.0%) |
| 10 or more Apartments | 0 (0.0%) | 0 (0.0%) |
| Mobile Home / Other | 93 (67.4%) | 45 (32.6%) |
| Total | 192 (61.2%) | 122 (38.9%) |
Housing Structures by Number of Rooms in Walnut Springs
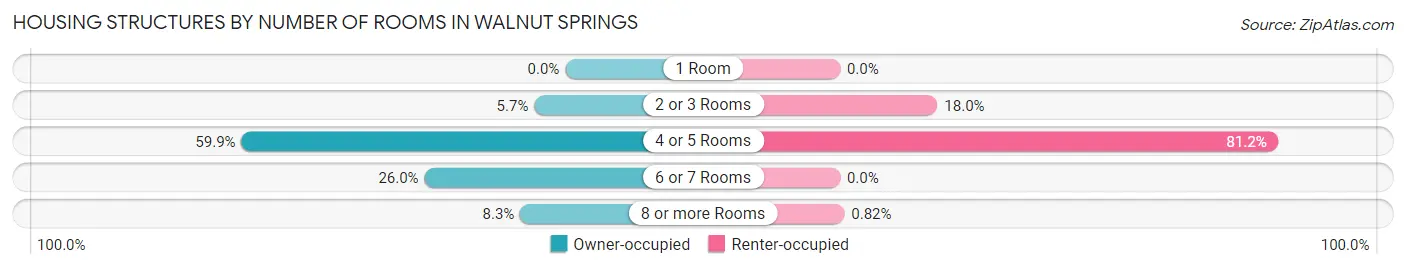
| Number of Rooms | Owner-occupied | Renter-occupied |
| 1 Room | 0 (0.0%) | 0 (0.0%) |
| 2 or 3 Rooms | 11 (5.7%) | 22 (18.0%) |
| 4 or 5 Rooms | 115 (59.9%) | 99 (81.1%) |
| 6 or 7 Rooms | 50 (26.0%) | 0 (0.0%) |
| 8 or more Rooms | 16 (8.3%) | 1 (0.8%) |
| Total | 192 (100.0%) | 122 (100.0%) |
Housing Structure by Heating Type in Walnut Springs
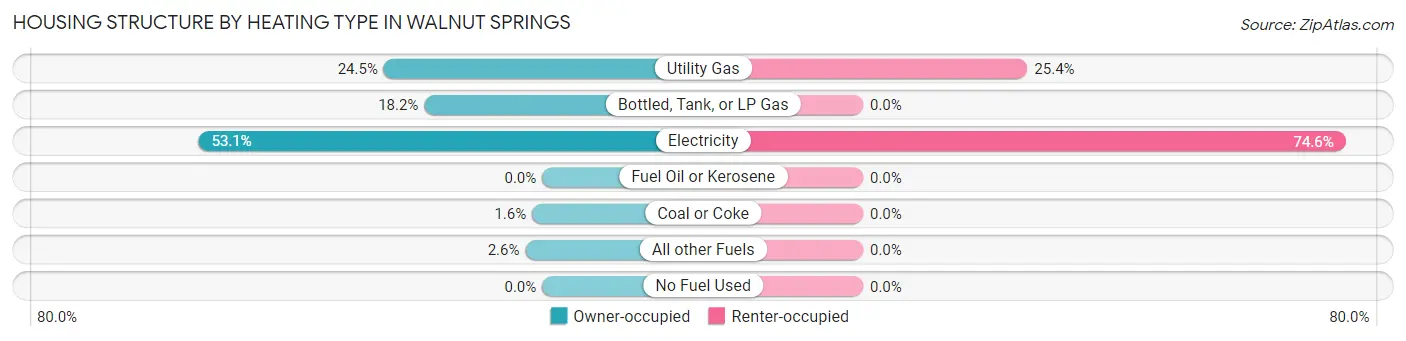
| Heating Type | Owner-occupied | Renter-occupied |
| Utility Gas | 47 (24.5%) | 31 (25.4%) |
| Bottled, Tank, or LP Gas | 35 (18.2%) | 0 (0.0%) |
| Electricity | 102 (53.1%) | 91 (74.6%) |
| Fuel Oil or Kerosene | 0 (0.0%) | 0 (0.0%) |
| Coal or Coke | 3 (1.6%) | 0 (0.0%) |
| All other Fuels | 5 (2.6%) | 0 (0.0%) |
| No Fuel Used | 0 (0.0%) | 0 (0.0%) |
| Total | 192 (100.0%) | 122 (100.0%) |
Household Vehicle Usage in Walnut Springs
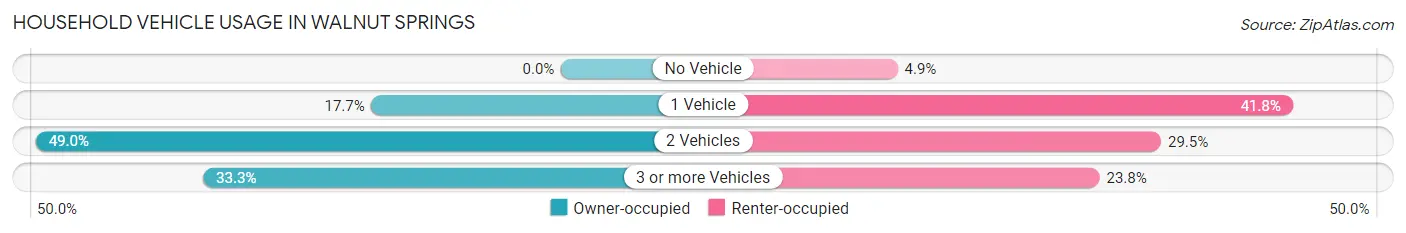
| Vehicles per Household | Owner-occupied | Renter-occupied |
| No Vehicle | 0 (0.0%) | 6 (4.9%) |
| 1 Vehicle | 34 (17.7%) | 51 (41.8%) |
| 2 Vehicles | 94 (49.0%) | 36 (29.5%) |
| 3 or more Vehicles | 64 (33.3%) | 29 (23.8%) |
| Total | 192 (100.0%) | 122 (100.0%) |
Real Estate & Mortgages in Walnut Springs
Real Estate and Mortgage Overview in Walnut Springs
| Characteristic | Without Mortgage | With Mortgage |
| Housing Units | 128 | 64 |
| Median Property Value | $52,300 | $75,000 |
| Median Household Income | $30,000 | $6 |
| Monthly Housing Costs | $379 | $0 |
| Real Estate Taxes | $562 | $0 |
Property Value by Mortgage Status in Walnut Springs
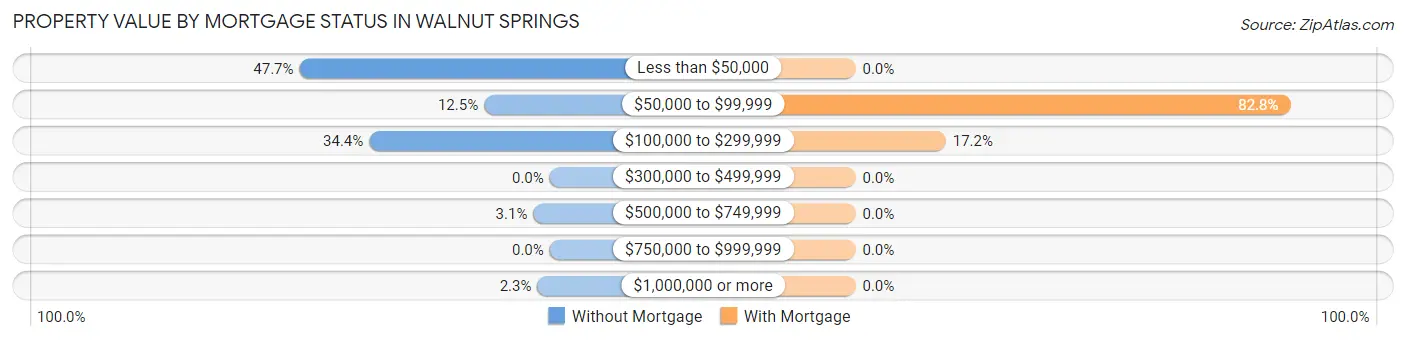
| Property Value | Without Mortgage | With Mortgage |
| Less than $50,000 | 61 (47.7%) | 0 (0.0%) |
| $50,000 to $99,999 | 16 (12.5%) | 53 (82.8%) |
| $100,000 to $299,999 | 44 (34.4%) | 11 (17.2%) |
| $300,000 to $499,999 | 0 (0.0%) | 0 (0.0%) |
| $500,000 to $749,999 | 4 (3.1%) | 0 (0.0%) |
| $750,000 to $999,999 | 0 (0.0%) | 0 (0.0%) |
| $1,000,000 or more | 3 (2.3%) | 0 (0.0%) |
| Total | 128 (100.0%) | 64 (100.0%) |
Household Income by Mortgage Status in Walnut Springs
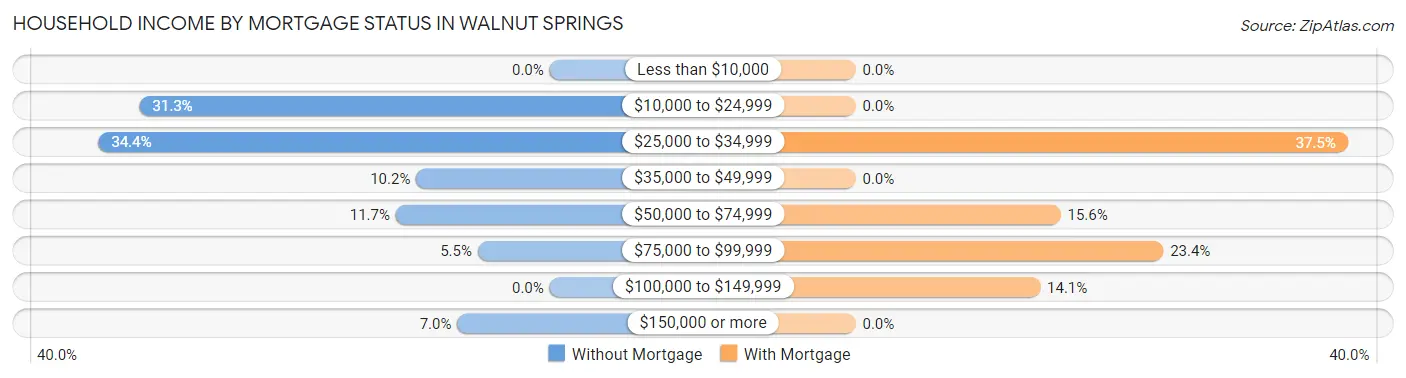
| Household Income | Without Mortgage | With Mortgage |
| Less than $10,000 | 0 (0.0%) | 0 (0.0%) |
| $10,000 to $24,999 | 40 (31.2%) | 0 (0.0%) |
| $25,000 to $34,999 | 44 (34.4%) | 24 (37.5%) |
| $35,000 to $49,999 | 13 (10.2%) | 0 (0.0%) |
| $50,000 to $74,999 | 15 (11.7%) | 10 (15.6%) |
| $75,000 to $99,999 | 7 (5.5%) | 15 (23.4%) |
| $100,000 to $149,999 | 0 (0.0%) | 9 (14.1%) |
| $150,000 or more | 9 (7.0%) | 0 (0.0%) |
| Total | 128 (100.0%) | 64 (100.0%) |
Property Value to Household Income Ratio in Walnut Springs
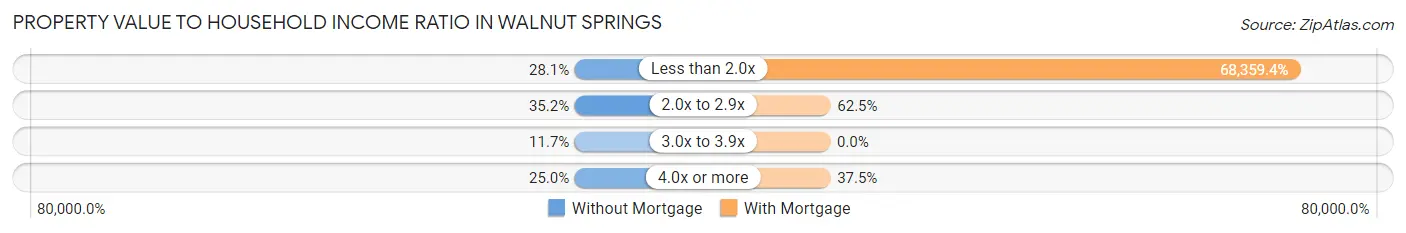
| Value-to-Income Ratio | Without Mortgage | With Mortgage |
| Less than 2.0x | 36 (28.1%) | 43,750 (68,359.4%) |
| 2.0x to 2.9x | 45 (35.2%) | 40 (62.5%) |
| 3.0x to 3.9x | 15 (11.7%) | 0 (0.0%) |
| 4.0x or more | 32 (25.0%) | 24 (37.5%) |
| Total | 128 (100.0%) | 64 (100.0%) |
Real Estate Taxes by Mortgage Status in Walnut Springs
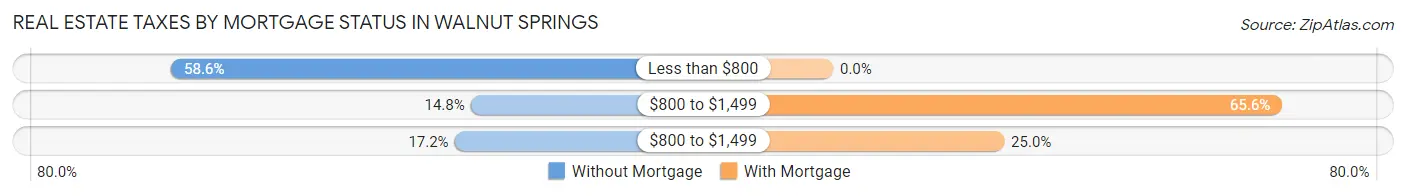
| Property Taxes | Without Mortgage | With Mortgage |
| Less than $800 | 75 (58.6%) | 0 (0.0%) |
| $800 to $1,499 | 19 (14.8%) | 42 (65.6%) |
| $800 to $1,499 | 22 (17.2%) | 16 (25.0%) |
| Total | 128 (100.0%) | 64 (100.0%) |
Health & Disability in Walnut Springs
Health Insurance Coverage by Age in Walnut Springs
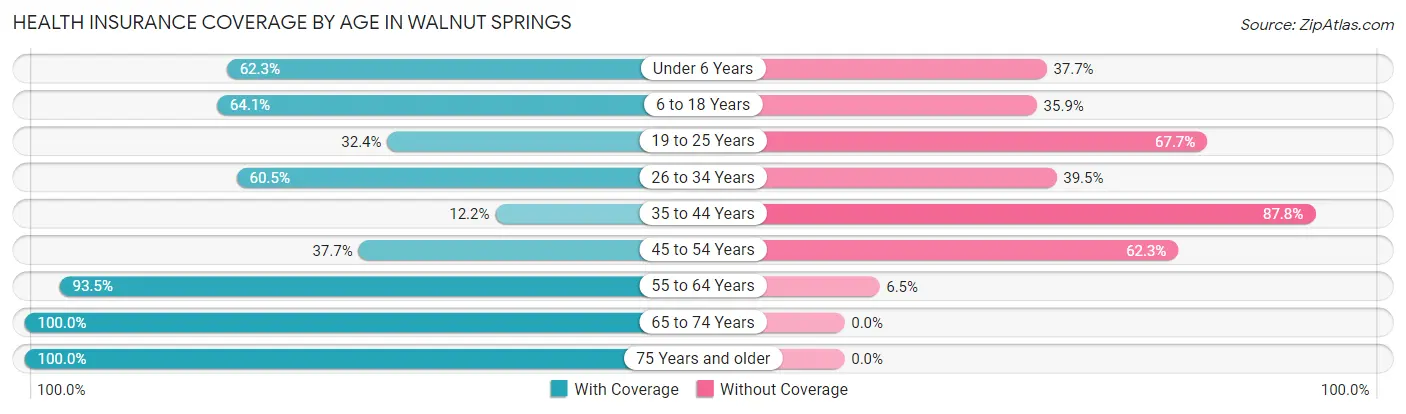
| Age Bracket | With Coverage | Without Coverage |
| Under 6 Years | 76 (62.3%) | 46 (37.7%) |
| 6 to 18 Years | 59 (64.1%) | 33 (35.9%) |
| 19 to 25 Years | 33 (32.4%) | 69 (67.6%) |
| 26 to 34 Years | 78 (60.5%) | 51 (39.5%) |
| 35 to 44 Years | 11 (12.2%) | 79 (87.8%) |
| 45 to 54 Years | 20 (37.7%) | 33 (62.3%) |
| 55 to 64 Years | 43 (93.5%) | 3 (6.5%) |
| 65 to 74 Years | 120 (100.0%) | 0 (0.0%) |
| 75 Years and older | 39 (100.0%) | 0 (0.0%) |
| Total | 479 (60.4%) | 314 (39.6%) |
Health Insurance Coverage by Citizenship Status in Walnut Springs
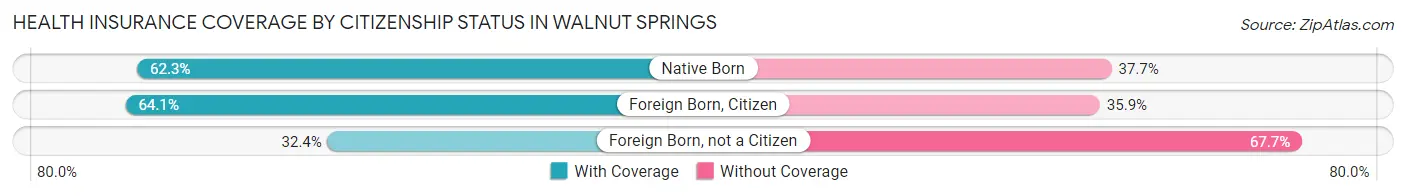
| Citizenship Status | With Coverage | Without Coverage |
| Native Born | 76 (62.3%) | 46 (37.7%) |
| Foreign Born, Citizen | 59 (64.1%) | 33 (35.9%) |
| Foreign Born, not a Citizen | 33 (32.4%) | 69 (67.6%) |
Health Insurance Coverage by Household Income in Walnut Springs
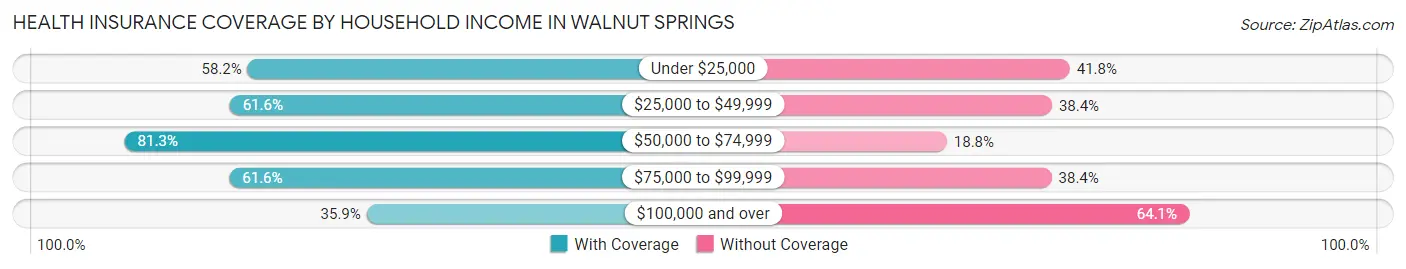
| Household Income | With Coverage | Without Coverage |
| Under $25,000 | 85 (58.2%) | 61 (41.8%) |
| $25,000 to $49,999 | 213 (61.6%) | 133 (38.4%) |
| $50,000 to $74,999 | 91 (81.2%) | 21 (18.8%) |
| $75,000 to $99,999 | 53 (61.6%) | 33 (38.4%) |
| $100,000 and over | 37 (35.9%) | 66 (64.1%) |
Public vs Private Health Insurance Coverage by Age in Walnut Springs
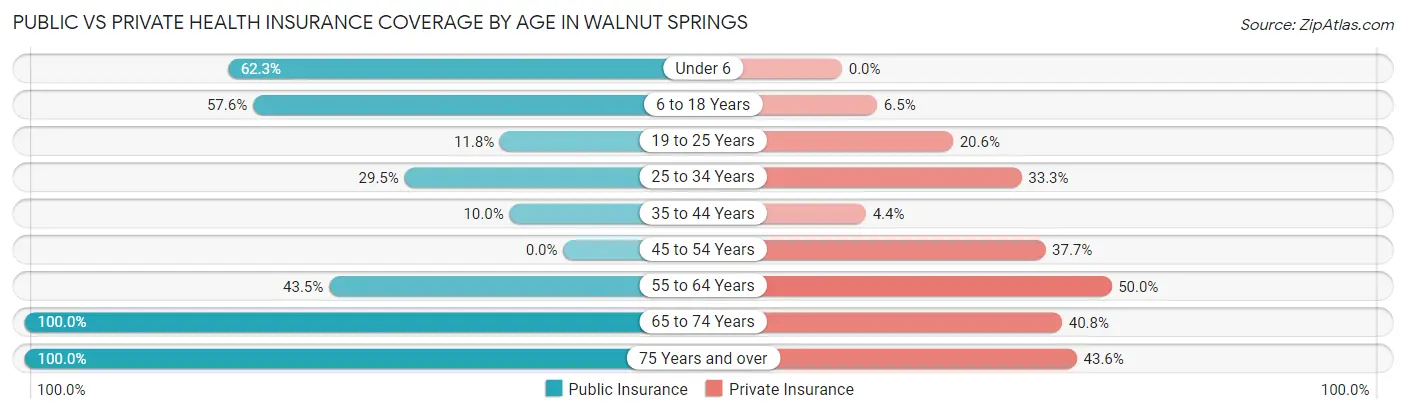
| Age Bracket | Public Insurance | Private Insurance |
| Under 6 | 76 (62.3%) | 0 (0.0%) |
| 6 to 18 Years | 53 (57.6%) | 6 (6.5%) |
| 19 to 25 Years | 12 (11.8%) | 21 (20.6%) |
| 25 to 34 Years | 38 (29.5%) | 43 (33.3%) |
| 35 to 44 Years | 9 (10.0%) | 4 (4.4%) |
| 45 to 54 Years | 0 (0.0%) | 20 (37.7%) |
| 55 to 64 Years | 20 (43.5%) | 23 (50.0%) |
| 65 to 74 Years | 120 (100.0%) | 49 (40.8%) |
| 75 Years and over | 39 (100.0%) | 17 (43.6%) |
| Total | 367 (46.3%) | 183 (23.1%) |
Disability Status by Sex by Age in Walnut Springs
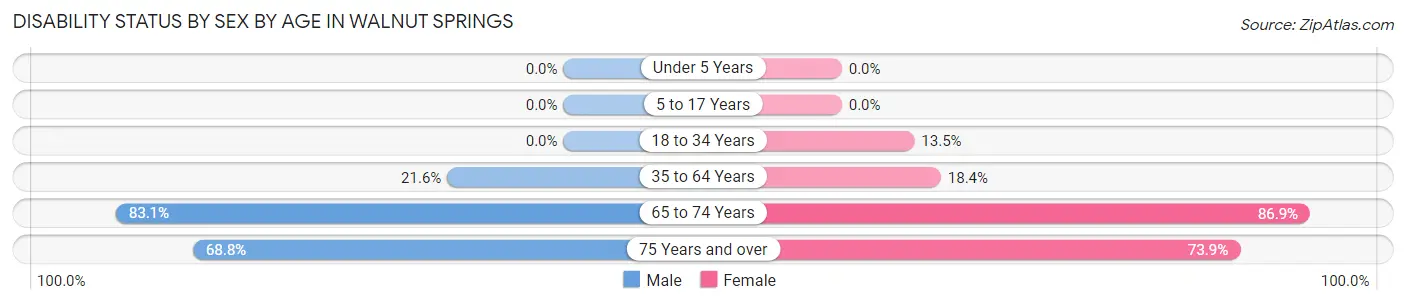
| Age Bracket | Male | Female |
| Under 5 Years | 0 (0.0%) | 0 (0.0%) |
| 5 to 17 Years | 0 (0.0%) | 0 (0.0%) |
| 18 to 34 Years | 0 (0.0%) | 12 (13.5%) |
| 35 to 64 Years | 22 (21.6%) | 16 (18.4%) |
| 65 to 74 Years | 49 (83.1%) | 53 (86.9%) |
| 75 Years and over | 11 (68.8%) | 17 (73.9%) |
Disability Class by Sex by Age in Walnut Springs
Disability Class: Hearing Difficulty
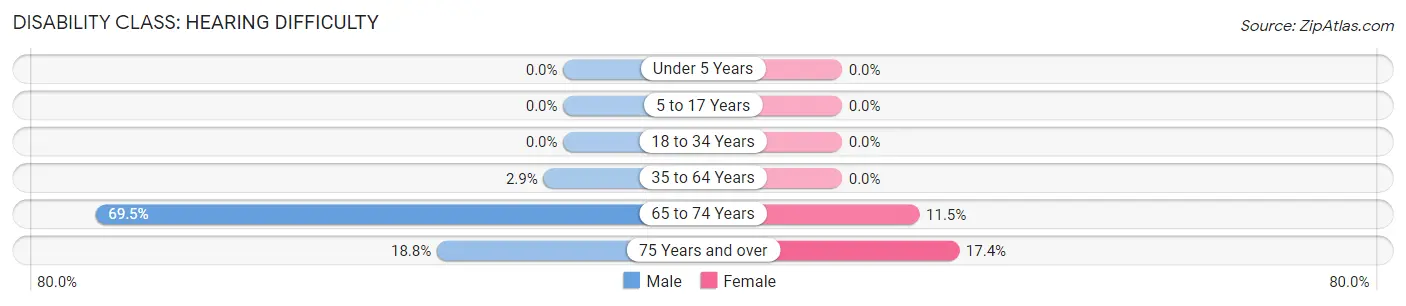
| Age Bracket | Male | Female |
| Under 5 Years | 0 (0.0%) | 0 (0.0%) |
| 5 to 17 Years | 0 (0.0%) | 0 (0.0%) |
| 18 to 34 Years | 0 (0.0%) | 0 (0.0%) |
| 35 to 64 Years | 3 (2.9%) | 0 (0.0%) |
| 65 to 74 Years | 41 (69.5%) | 7 (11.5%) |
| 75 Years and over | 3 (18.8%) | 4 (17.4%) |
Disability Class: Vision Difficulty
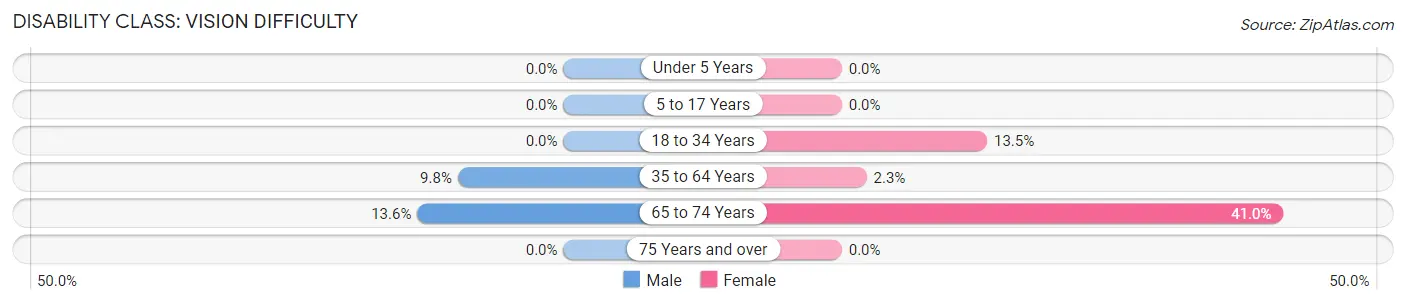
| Age Bracket | Male | Female |
| Under 5 Years | 0 (0.0%) | 0 (0.0%) |
| 5 to 17 Years | 0 (0.0%) | 0 (0.0%) |
| 18 to 34 Years | 0 (0.0%) | 12 (13.5%) |
| 35 to 64 Years | 10 (9.8%) | 2 (2.3%) |
| 65 to 74 Years | 8 (13.6%) | 25 (41.0%) |
| 75 Years and over | 0 (0.0%) | 0 (0.0%) |
Disability Class: Cognitive Difficulty
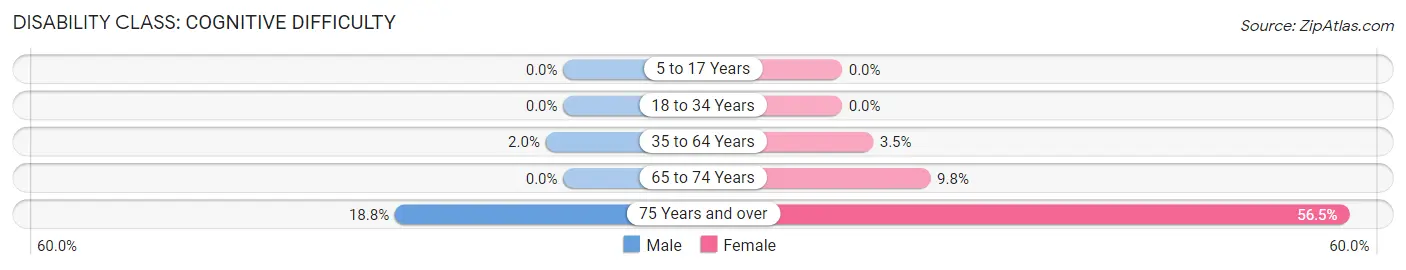
| Age Bracket | Male | Female |
| 5 to 17 Years | 0 (0.0%) | 0 (0.0%) |
| 18 to 34 Years | 0 (0.0%) | 0 (0.0%) |
| 35 to 64 Years | 2 (2.0%) | 3 (3.5%) |
| 65 to 74 Years | 0 (0.0%) | 6 (9.8%) |
| 75 Years and over | 3 (18.8%) | 13 (56.5%) |
Disability Class: Ambulatory Difficulty
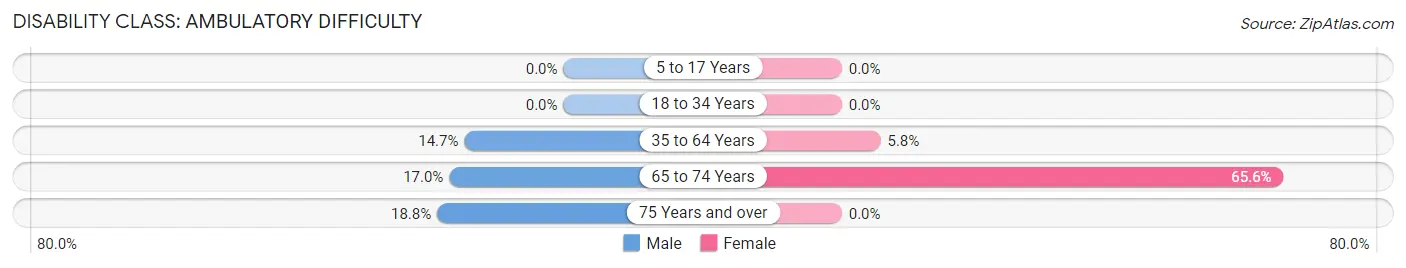
| Age Bracket | Male | Female |
| 5 to 17 Years | 0 (0.0%) | 0 (0.0%) |
| 18 to 34 Years | 0 (0.0%) | 0 (0.0%) |
| 35 to 64 Years | 15 (14.7%) | 5 (5.8%) |
| 65 to 74 Years | 10 (17.0%) | 40 (65.6%) |
| 75 Years and over | 3 (18.8%) | 0 (0.0%) |
Disability Class: Self-Care Difficulty
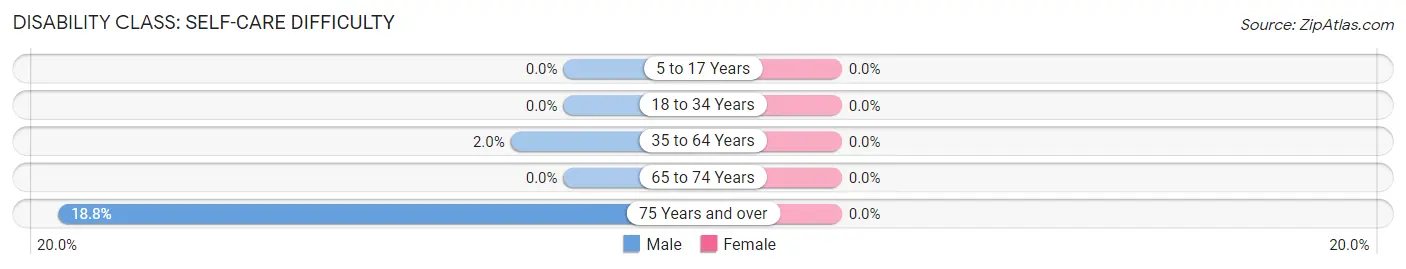
| Age Bracket | Male | Female |
| 5 to 17 Years | 0 (0.0%) | 0 (0.0%) |
| 18 to 34 Years | 0 (0.0%) | 0 (0.0%) |
| 35 to 64 Years | 2 (2.0%) | 0 (0.0%) |
| 65 to 74 Years | 0 (0.0%) | 0 (0.0%) |
| 75 Years and over | 3 (18.8%) | 0 (0.0%) |
Technology Access in Walnut Springs
Computing Device Access in Walnut Springs
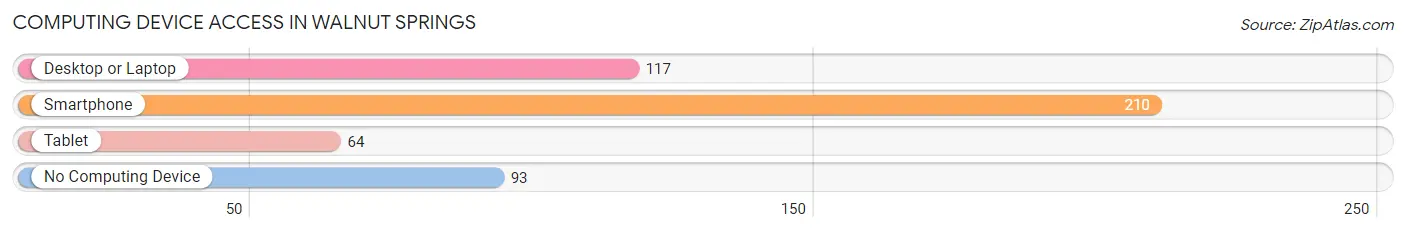
| Device Type | # Households | % Households |
| Desktop or Laptop | 117 | 37.3% |
| Smartphone | 210 | 66.9% |
| Tablet | 64 | 20.4% |
| No Computing Device | 93 | 29.6% |
| Total | 314 | 100.0% |
Internet Access in Walnut Springs
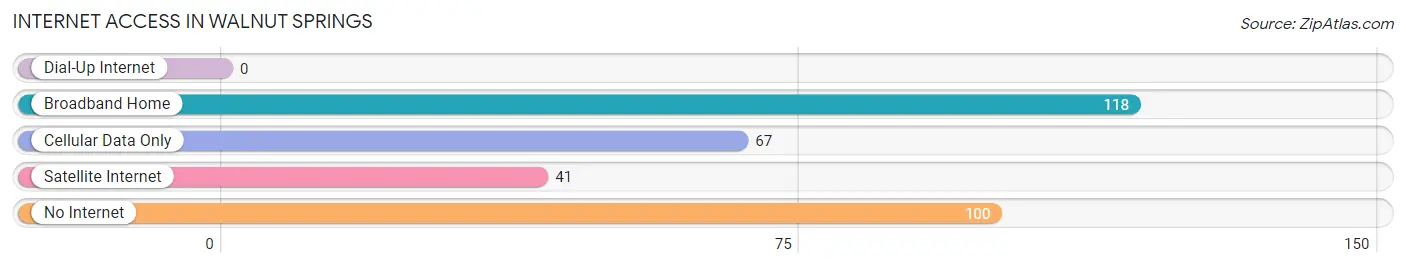
| Internet Type | # Households | % Households |
| Dial-Up Internet | 0 | 0.0% |
| Broadband Home | 118 | 37.6% |
| Cellular Data Only | 67 | 21.3% |
| Satellite Internet | 41 | 13.1% |
| No Internet | 100 | 31.9% |
| Total | 314 | 100.0% |
Walnut Springs Summary
Walnut Springs, Texas is a small town located in Bosque County, Texas. It is situated on the banks of the Brazos River, about 25 miles south of Waco. The town was founded in 1854 and has a population of approximately 1,000 people.
History
Walnut Springs was founded in 1854 by a group of settlers from Tennessee. The town was named after the walnut trees that grew in the area. The settlers built a log cabin and a small store, and the town quickly grew. By the late 1800s, the town had a post office, a school, a church, and several businesses.
In the early 1900s, the town experienced a period of growth. The population increased, and new businesses opened. The town also became a popular destination for tourists, who came to enjoy the natural beauty of the area.
In the 1950s, the town experienced a decline in population as people moved away to larger cities. However, the town has since experienced a resurgence in population and is now home to a diverse population of people from all walks of life.
Geography
Walnut Springs is located in Bosque County, Texas. It is situated on the banks of the Brazos River, about 25 miles south of Waco. The town is surrounded by rolling hills and lush green pastures. The climate is mild and humid, with temperatures ranging from the mid-50s in the winter to the mid-90s in the summer.
Economy
The economy of Walnut Springs is largely based on agriculture. The town is home to several farms, which produce a variety of crops, including cotton, corn, and hay. The town also has a few small businesses, including a grocery store, a hardware store, and a few restaurants.
Demographics
As of the 2010 census, the population of Walnut Springs was 1,000 people. The racial makeup of the town was 94.2% White, 0.7% African American, 0.3% Native American, 0.2% Asian, 0.1% Pacific Islander, and 4.5% from other races. The median household income was $37,500, and the median age was 39.
Conclusion
Walnut Springs, Texas is a small town with a rich history and a diverse population. The town is situated on the banks of the Brazos River and is surrounded by rolling hills and lush green pastures. The economy of the town is largely based on agriculture, and the town is home to several small businesses. The population of the town is approximately 1,000 people, and the median household income is $37,500.
Common Questions
What is the Total Population of Walnut Springs?
Total Population of Walnut Springs is 793.
What is the Total Male Population of Walnut Springs?
Total Male Population of Walnut Springs is 457.
What is the Total Female Population of Walnut Springs?
Total Female Population of Walnut Springs is 336.
What is the Ratio of Males per 100 Females in Walnut Springs?
There are 136.01 Males per 100 Females in Walnut Springs.
What is the Ratio of Females per 100 Males in Walnut Springs?
There are 73.52 Females per 100 Males in Walnut Springs.
What is the Median Population Age in Walnut Springs?
Median Population Age in Walnut Springs is 32.2 Years.
What is the Average Family Size in Walnut Springs
Average Family Size in Walnut Springs is 2.8 People.
What is the Average Household Size in Walnut Springs
Average Household Size in Walnut Springs is 2.5 People.
What is Per Capita Income in Walnut Springs?
Per Capita income in Walnut Springs is $22,174.
What is the Median Family Income in Walnut Springs?
Median Family Income in Walnut Springs is $39,135.
What is the Median Household income in Walnut Springs?
Median Household Income in Walnut Springs is $35,313.
What is Income or Wage Gap in Walnut Springs?
Income or Wage Gap in Walnut Springs is 32.1%.
Women in Walnut Springs earn 67.9 cents for every dollar earned by a man.
What is Inequality or Gini Index in Walnut Springs?
Inequality or Gini Index in Walnut Springs is 0.47.
How Large is the Labor Force in Walnut Springs?
There are 309 People in the Labor Forcein in Walnut Springs.
What is the Percentage of People in the Labor Force in Walnut Springs?
53.0% of People are in the Labor Force in Walnut Springs.
What is the Unemployment Rate in Walnut Springs?
Unemployment Rate in Walnut Springs is 5.5%.