Colleyville, TX
Colleyville Map
Colleyville Overview
25,876
TOTAL POPULATION
13,722
MALE POPULATION
12,154
FEMALE POPULATION
112.90
MALES / 100 FEMALES
88.57
FEMALES / 100 MALES
47.3
MEDIAN AGE
3.0
AVG FAMILY SIZE
2.8
AVG HOUSEHOLD SIZE
$92,557
PER CAPITA INCOME
$215,158
AVG FAMILY INCOME
$196,298
AVG HOUSEHOLD INCOME
49.6%
WAGE / INCOME GAP [ % ]
50.4¢/ $1
WAGE / INCOME GAP [ $ ]
$9,075
FAMILY INCOME DEFICIT
0.43
INEQUALITY / GINI INDEX
13,135
LABOR FORCE [ PEOPLE ]
63.9%
PERCENT IN LABOR FORCE
3.7%
UNEMPLOYMENT RATE
Colleyville Zip Codes
Colleyville Area Codes
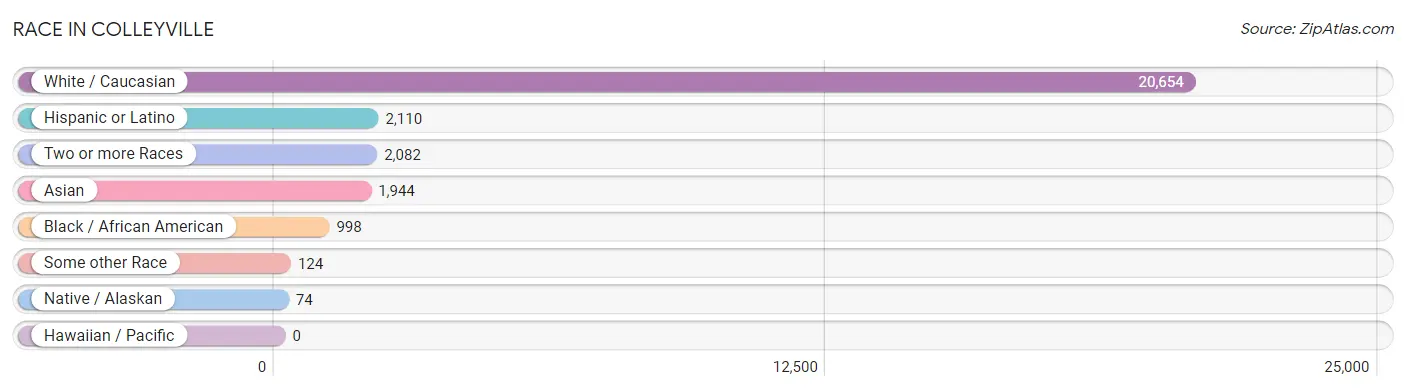
Race in Colleyville
The most populous races in Colleyville are White / Caucasian (20,654 | 79.8%), Hispanic or Latino (2,110 | 8.2%), and Two or more Races (2,082 | 8.1%).
| Race | # Population | % Population |
| Asian | 1,944 | 7.5% |
| Black / African American | 998 | 3.9% |
| Hawaiian / Pacific | 0 | 0.0% |
| Hispanic or Latino | 2,110 | 8.2% |
| Native / Alaskan | 74 | 0.3% |
| White / Caucasian | 20,654 | 79.8% |
| Two or more Races | 2,082 | 8.1% |
| Some other Race | 124 | 0.5% |
| Total | 25,876 | 100.0% |
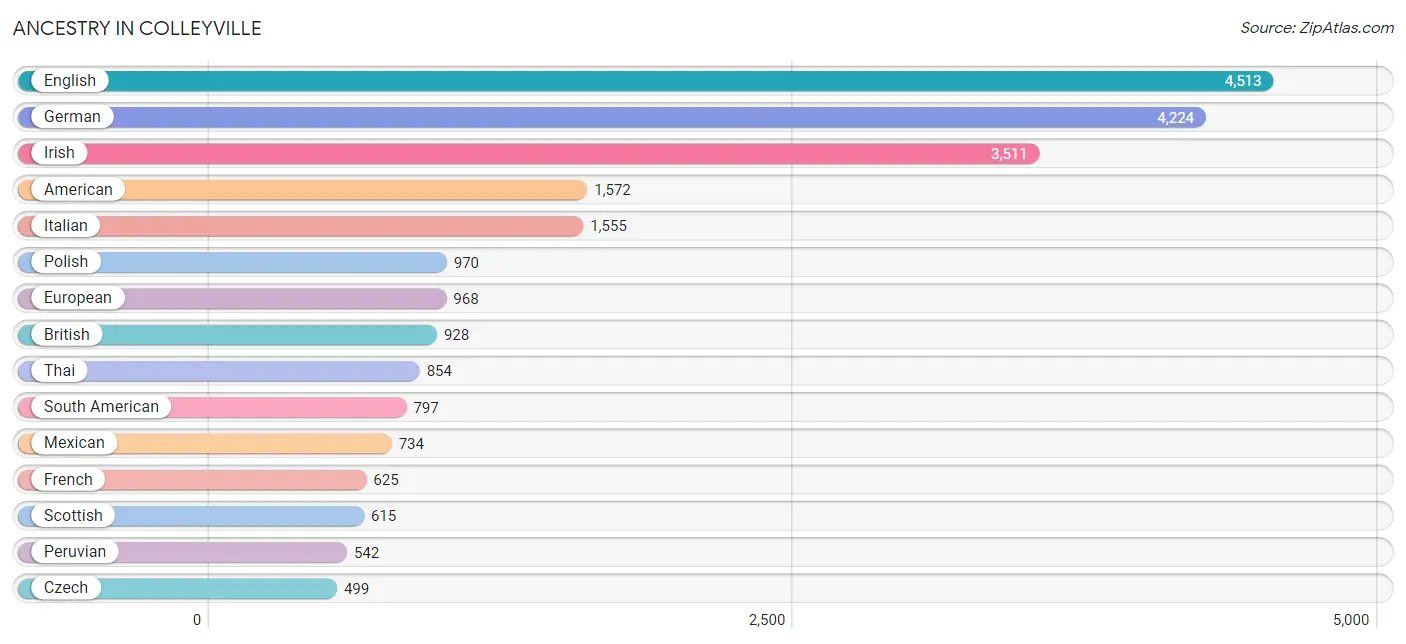
Ancestry in Colleyville
The most populous ancestries reported in Colleyville are English (4,513 | 17.4%), German (4,224 | 16.3%), Irish (3,511 | 13.6%), American (1,572 | 6.1%), and Italian (1,555 | 6.0%), together accounting for 59.4% of all Colleyville residents.
| Ancestry | # Population | % Population |
| African | 206 | 0.8% |
| American | 1,572 | 6.1% |
| Arab | 132 | 0.5% |
| Argentinean | 27 | 0.1% |
| Armenian | 11 | 0.0% |
| Austrian | 34 | 0.1% |
| Belgian | 69 | 0.3% |
| Belizean | 8 | 0.0% |
| Bermudan | 13 | 0.1% |
| Bhutanese | 130 | 0.5% |
| Brazilian | 13 | 0.1% |
| British | 928 | 3.6% |
| Burmese | 152 | 0.6% |
| Cajun | 82 | 0.3% |
| Canadian | 21 | 0.1% |
| Carpatho Rusyn | 10 | 0.0% |
| Central American | 48 | 0.2% |
| Cherokee | 115 | 0.4% |
| Chickasaw | 5 | 0.0% |
| Chilean | 7 | 0.0% |
| Colombian | 14 | 0.1% |
| Costa Rican | 33 | 0.1% |
| Croatian | 42 | 0.2% |
| Cuban | 47 | 0.2% |
| Czech | 499 | 1.9% |
| Czechoslovakian | 39 | 0.2% |
| Danish | 256 | 1.0% |
| Delaware | 10 | 0.0% |
| Dutch | 222 | 0.9% |
| Eastern European | 161 | 0.6% |
| Ecuadorian | 35 | 0.1% |
| Egyptian | 3 | 0.0% |
| English | 4,513 | 17.4% |
| European | 968 | 3.7% |
| Finnish | 20 | 0.1% |
| French | 625 | 2.4% |
| French Canadian | 122 | 0.5% |
| German | 4,224 | 16.3% |
| Greek | 61 | 0.2% |
| Guatemalan | 15 | 0.1% |
| Hungarian | 101 | 0.4% |
| Indian (Asian) | 248 | 1.0% |
| Iranian | 66 | 0.3% |
| Irish | 3,511 | 13.6% |
| Israeli | 8 | 0.0% |
| Italian | 1,555 | 6.0% |
| Japanese | 27 | 0.1% |
| Korean | 125 | 0.5% |
| Lebanese | 121 | 0.5% |
| Lithuanian | 10 | 0.0% |
| Mexican | 734 | 2.8% |
| Northern European | 75 | 0.3% |
| Norwegian | 146 | 0.6% |
| Pakistani | 196 | 0.8% |
| Peruvian | 542 | 2.1% |
| Polish | 970 | 3.7% |
| Portuguese | 12 | 0.1% |
| Puerto Rican | 115 | 0.4% |
| Russian | 346 | 1.3% |
| Scandinavian | 125 | 0.5% |
| Scotch-Irish | 304 | 1.2% |
| Scottish | 615 | 2.4% |
| Slavic | 18 | 0.1% |
| Slovak | 59 | 0.2% |
| Slovene | 43 | 0.2% |
| South African | 35 | 0.1% |
| South American | 797 | 3.1% |
| Spanish | 62 | 0.2% |
| Sri Lankan | 337 | 1.3% |
| Subsaharan African | 241 | 0.9% |
| Swedish | 362 | 1.4% |
| Swiss | 60 | 0.2% |
| Thai | 854 | 3.3% |
| Trinidadian and Tobagonian | 23 | 0.1% |
| Turkish | 6 | 0.0% |
| Ukrainian | 9 | 0.0% |
| Venezuelan | 129 | 0.5% |
| Vietnamese | 20 | 0.1% |
| Welsh | 168 | 0.6% | View All 79 Rows |
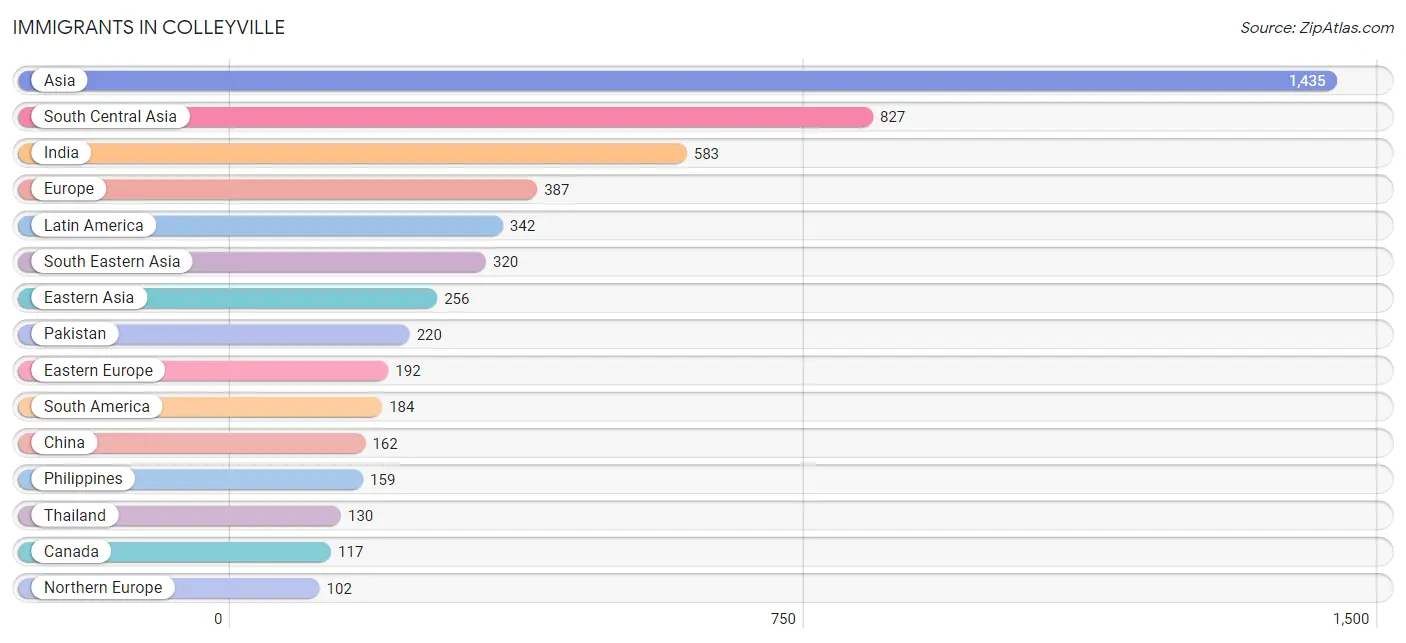
Immigrants in Colleyville
The most numerous immigrant groups reported in Colleyville came from Asia (1,435 | 5.6%), South Central Asia (827 | 3.2%), India (583 | 2.2%), Europe (387 | 1.5%), and Latin America (342 | 1.3%), together accounting for 13.8% of all Colleyville residents.
| Immigration Origin | # Population | % Population |
| Africa | 67 | 0.3% |
| Argentina | 80 | 0.3% |
| Asia | 1,435 | 5.6% |
| Australia | 10 | 0.0% |
| Austria | 17 | 0.1% |
| Bangladesh | 15 | 0.1% |
| Belarus | 52 | 0.2% |
| Belgium | 10 | 0.0% |
| Brazil | 13 | 0.1% |
| Canada | 117 | 0.4% |
| Caribbean | 89 | 0.3% |
| Central America | 69 | 0.3% |
| Chile | 7 | 0.0% |
| China | 162 | 0.6% |
| Costa Rica | 11 | 0.0% |
| Cuba | 47 | 0.2% |
| Eastern Asia | 256 | 1.0% |
| Eastern Europe | 192 | 0.7% |
| Ecuador | 17 | 0.1% |
| Egypt | 3 | 0.0% |
| England | 15 | 0.1% |
| Europe | 387 | 1.5% |
| France | 47 | 0.2% |
| Grenada | 12 | 0.1% |
| Guatemala | 15 | 0.1% |
| India | 583 | 2.2% |
| Iran | 9 | 0.0% |
| Ireland | 9 | 0.0% |
| Israel | 8 | 0.0% |
| Italy | 7 | 0.0% |
| Japan | 24 | 0.1% |
| Korea | 70 | 0.3% |
| Latin America | 342 | 1.3% |
| Lebanon | 18 | 0.1% |
| Mexico | 43 | 0.2% |
| Northern Africa | 3 | 0.0% |
| Northern Europe | 102 | 0.4% |
| Oceania | 10 | 0.0% |
| Pakistan | 220 | 0.9% |
| Peru | 30 | 0.1% |
| Philippines | 159 | 0.6% |
| Poland | 99 | 0.4% |
| Russia | 20 | 0.1% |
| South Africa | 64 | 0.3% |
| South America | 184 | 0.7% |
| South Central Asia | 827 | 3.2% |
| South Eastern Asia | 320 | 1.2% |
| Southern Europe | 7 | 0.0% |
| Switzerland | 12 | 0.1% |
| Taiwan | 79 | 0.3% |
| Thailand | 130 | 0.5% |
| Trinidad and Tobago | 30 | 0.1% |
| Turkey | 6 | 0.0% |
| Venezuela | 37 | 0.1% |
| Vietnam | 31 | 0.1% |
| Western Asia | 32 | 0.1% |
| Western Europe | 86 | 0.3% | View All 57 Rows |
Sex and Age in Colleyville
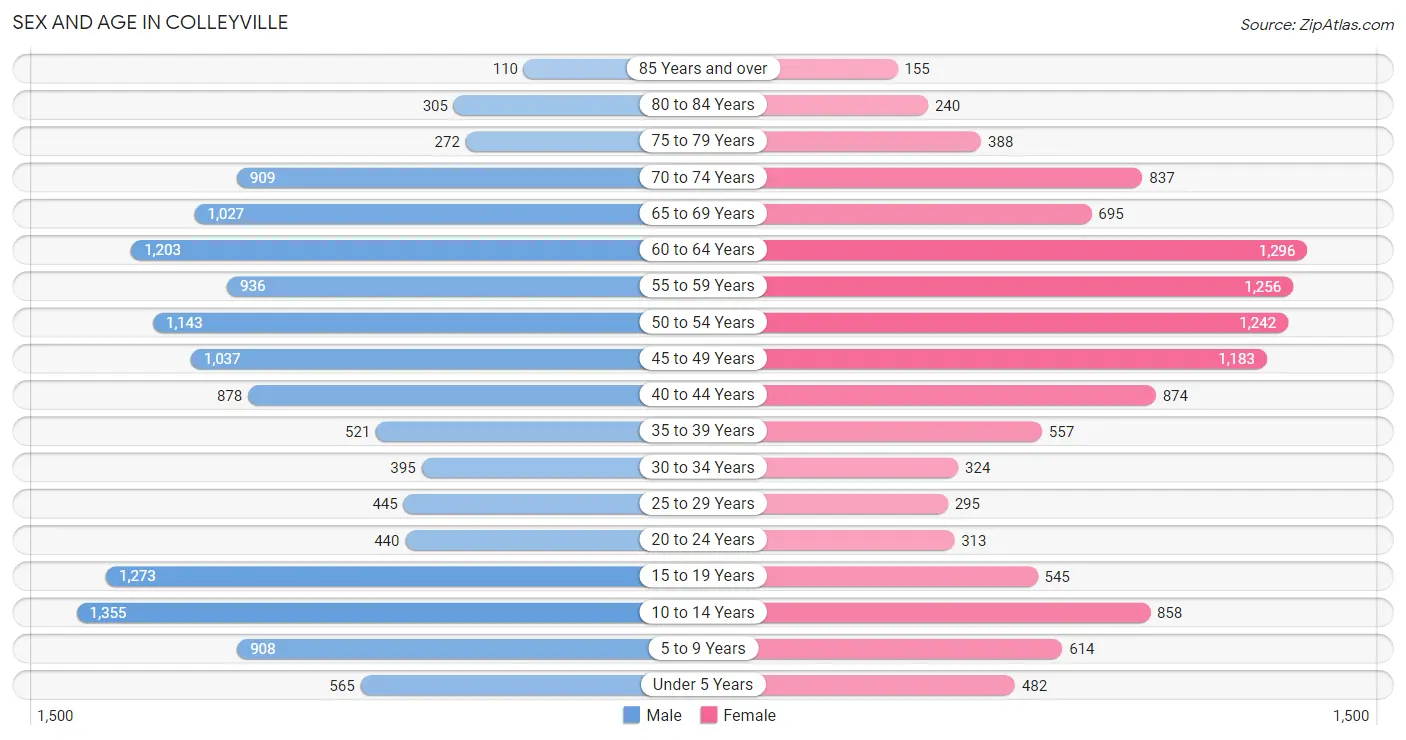
Sex and Age in Colleyville
The most populous age groups in Colleyville are 10 to 14 Years (1,355 | 9.9%) for men and 60 to 64 Years (1,296 | 10.7%) for women.
| Age Bracket | Male | Female |
| Under 5 Years | 565 (4.1%) | 482 (4.0%) |
| 5 to 9 Years | 908 (6.6%) | 614 (5.1%) |
| 10 to 14 Years | 1,355 (9.9%) | 858 (7.1%) |
| 15 to 19 Years | 1,273 (9.3%) | 545 (4.5%) |
| 20 to 24 Years | 440 (3.2%) | 313 (2.6%) |
| 25 to 29 Years | 445 (3.2%) | 295 (2.4%) |
| 30 to 34 Years | 395 (2.9%) | 324 (2.7%) |
| 35 to 39 Years | 521 (3.8%) | 557 (4.6%) |
| 40 to 44 Years | 878 (6.4%) | 874 (7.2%) |
| 45 to 49 Years | 1,037 (7.6%) | 1,183 (9.7%) |
| 50 to 54 Years | 1,143 (8.3%) | 1,242 (10.2%) |
| 55 to 59 Years | 936 (6.8%) | 1,256 (10.3%) |
| 60 to 64 Years | 1,203 (8.8%) | 1,296 (10.7%) |
| 65 to 69 Years | 1,027 (7.5%) | 695 (5.7%) |
| 70 to 74 Years | 909 (6.6%) | 837 (6.9%) |
| 75 to 79 Years | 272 (2.0%) | 388 (3.2%) |
| 80 to 84 Years | 305 (2.2%) | 240 (2.0%) |
| 85 Years and over | 110 (0.8%) | 155 (1.3%) |
| Total | 13,722 (100.0%) | 12,154 (100.0%) |
Families and Households in Colleyville
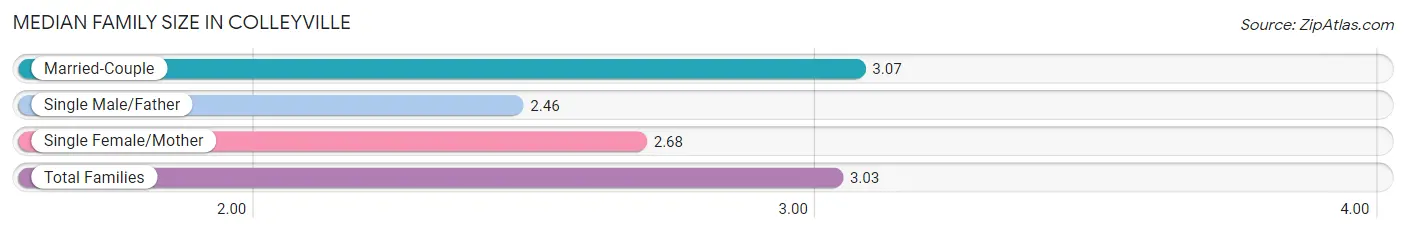
Median Family Size in Colleyville
The median family size in Colleyville is 3.03 persons per family, with married-couple families (7,242 | 91.4%) accounting for the largest median family size of 3.07 persons per family. On the other hand, single male/father families (230 | 2.9%) represent the smallest median family size with 2.46 persons per family.
| Family Type | # Families | Family Size |
| Married-Couple | 7,242 (91.4%) | 3.07 |
| Single Male/Father | 230 (2.9%) | 2.46 |
| Single Female/Mother | 455 (5.7%) | 2.68 |
| Total Families | 7,927 (100.0%) | 3.03 |
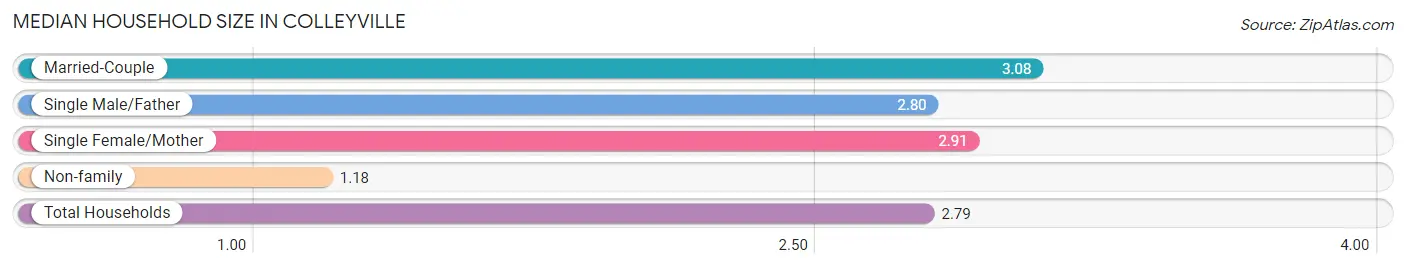
Median Household Size in Colleyville
The median household size in Colleyville is 2.79 persons per household, with married-couple households (7,242 | 78.2%) accounting for the largest median household size of 3.08 persons per household. non-family households (1,331 | 14.4%) represent the smallest median household size with 1.18 persons per household.
| Household Type | # Households | Household Size |
| Married-Couple | 7,242 (78.2%) | 3.08 |
| Single Male/Father | 230 (2.5%) | 2.80 |
| Single Female/Mother | 455 (4.9%) | 2.91 |
| Non-family | 1,331 (14.4%) | 1.18 |
| Total Households | 9,258 (100.0%) | 2.79 |
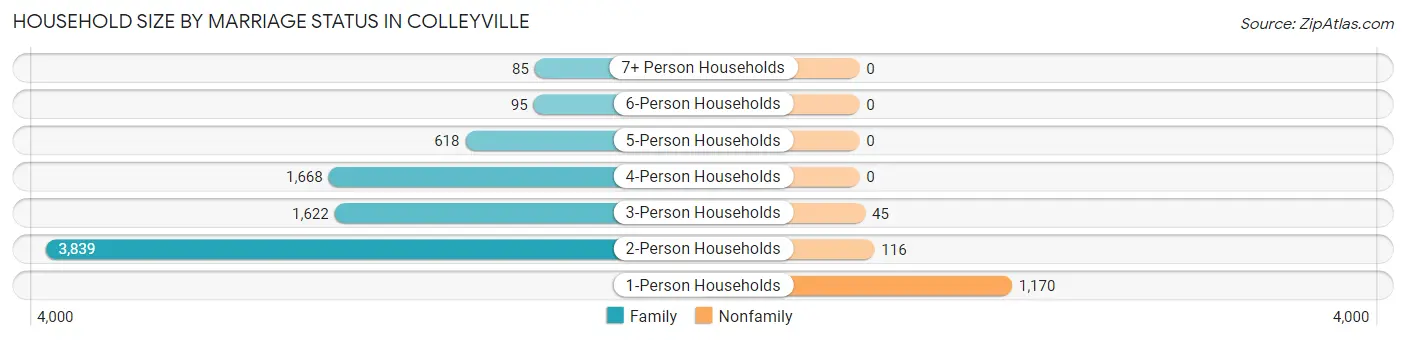
Household Size by Marriage Status in Colleyville
Out of a total of 9,258 households in Colleyville, 7,927 (85.6%) are family households, while 1,331 (14.4%) are nonfamily households. The most numerous type of family households are 2-person households, comprising 3,839, and the most common type of nonfamily households are 1-person households, comprising 1,170.
| Household Size | Family Households | Nonfamily Households |
| 1-Person Households | - | 1,170 (12.6%) |
| 2-Person Households | 3,839 (41.5%) | 116 (1.3%) |
| 3-Person Households | 1,622 (17.5%) | 45 (0.5%) |
| 4-Person Households | 1,668 (18.0%) | 0 (0.0%) |
| 5-Person Households | 618 (6.7%) | 0 (0.0%) |
| 6-Person Households | 95 (1.0%) | 0 (0.0%) |
| 7+ Person Households | 85 (0.9%) | 0 (0.0%) |
| Total | 7,927 (85.6%) | 1,331 (14.4%) |
Female Fertility in Colleyville
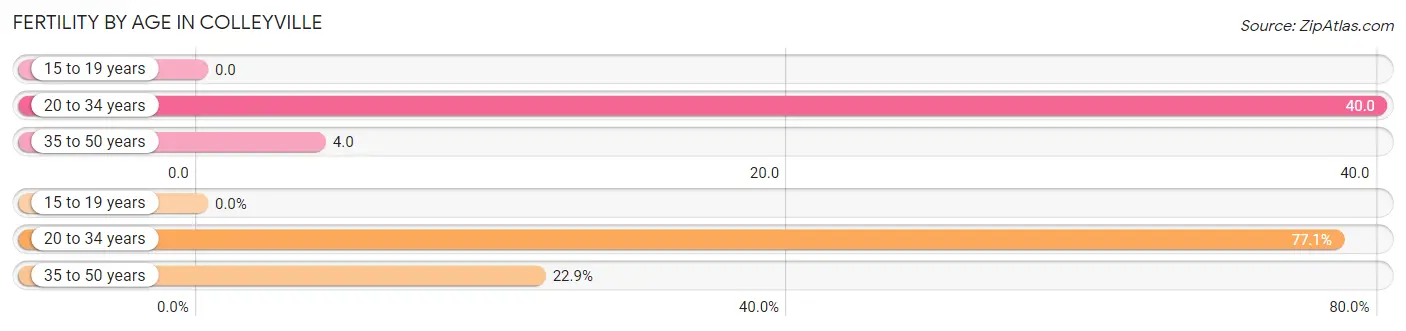
Fertility by Age in Colleyville
Average fertility rate in Colleyville is 11.0 births per 1,000 women. Women in the age bracket of 20 to 34 years have the highest fertility rate with 40.0 births per 1,000 women. Women in the age bracket of 20 to 34 years acount for 77.1% of all women with births.
| Age Bracket | Women with Births | Births / 1,000 Women |
| 15 to 19 years | 0 (0.0%) | 0.0 |
| 20 to 34 years | 37 (77.1%) | 40.0 |
| 35 to 50 years | 11 (22.9%) | 4.0 |
| Total | 48 (100.0%) | 11.0 |
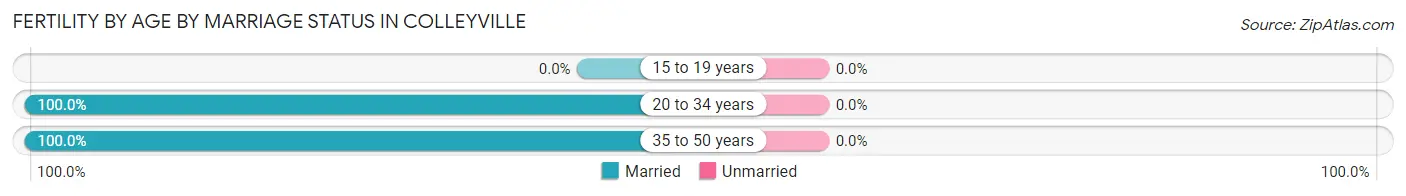
Fertility by Age by Marriage Status in Colleyville
| Age Bracket | Married | Unmarried |
| 15 to 19 years | 0 (0.0%) | 0 (0.0%) |
| 20 to 34 years | 37 (100.0%) | 0 (0.0%) |
| 35 to 50 years | 11 (100.0%) | 0 (0.0%) |
| Total | 48 (100.0%) | 0 (0.0%) |
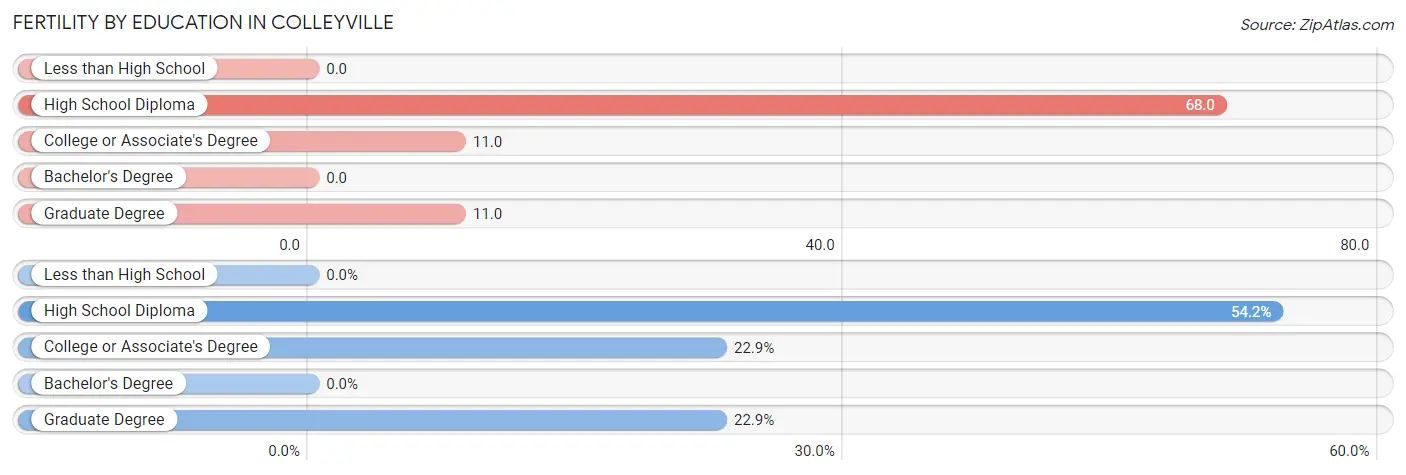
Fertility by Education in Colleyville
| Educational Attainment | Women with Births | Births / 1,000 Women |
| Less than High School | 0 (0.0%) | 0.0 |
| High School Diploma | 26 (54.2%) | 68.0 |
| College or Associate's Degree | 11 (22.9%) | 11.0 |
| Bachelor's Degree | 0 (0.0%) | 0.0 |
| Graduate Degree | 11 (22.9%) | 11.0 |
| Total | 48 (100.0%) | 11.0 |
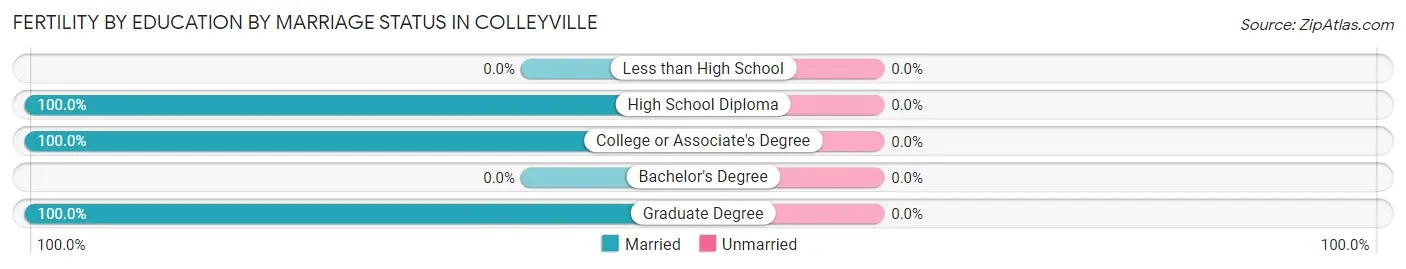
Fertility by Education by Marriage Status in Colleyville
| Educational Attainment | Married | Unmarried |
| Less than High School | 0 (0.0%) | 0 (0.0%) |
| High School Diploma | 26 (100.0%) | 0 (0.0%) |
| College or Associate's Degree | 11 (100.0%) | 0 (0.0%) |
| Bachelor's Degree | 0 (0.0%) | 0 (0.0%) |
| Graduate Degree | 11 (100.0%) | 0 (0.0%) |
| Total | 48 (100.0%) | 0 (0.0%) |
Income in Colleyville
Income Overview in Colleyville
Per Capita Income in Colleyville is $92,557, while median incomes of families and households are $215,158 and $196,298 respectively.
| Characteristic | Number | Measure |
| Per Capita Income | 25,876 | $92,557 |
| Median Family Income | 7,927 | $215,158 |
| Mean Family Income | 7,927 | $277,826 |
| Median Household Income | 9,258 | $196,298 |
| Mean Household Income | 9,258 | $255,838 |
| Income Deficit | 7,927 | $9,075 |
| Wage / Income Gap (%) | 25,876 | 49.61% |
| Wage / Income Gap ($) | 25,876 | 50.39¢ per $1 |
| Gini / Inequality Index | 25,876 | 0.43 |
Earnings by Sex in Colleyville
Average Earnings in Colleyville are $86,667, $120,198 for men and $60,568 for women, a difference of 49.6%.
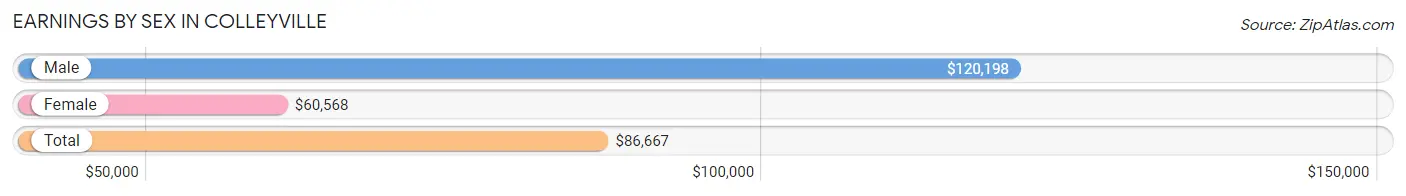
| Sex | Number | Average Earnings |
| Male | 7,875 (56.3%) | $120,198 |
| Female | 6,117 (43.7%) | $60,568 |
| Total | 13,992 (100.0%) | $86,667 |
Earnings by Sex by Income Bracket in Colleyville
The most common earnings brackets in Colleyville are $100,000+ for men (4,312 | 54.8%) and $100,000+ for women (1,919 | 31.4%).
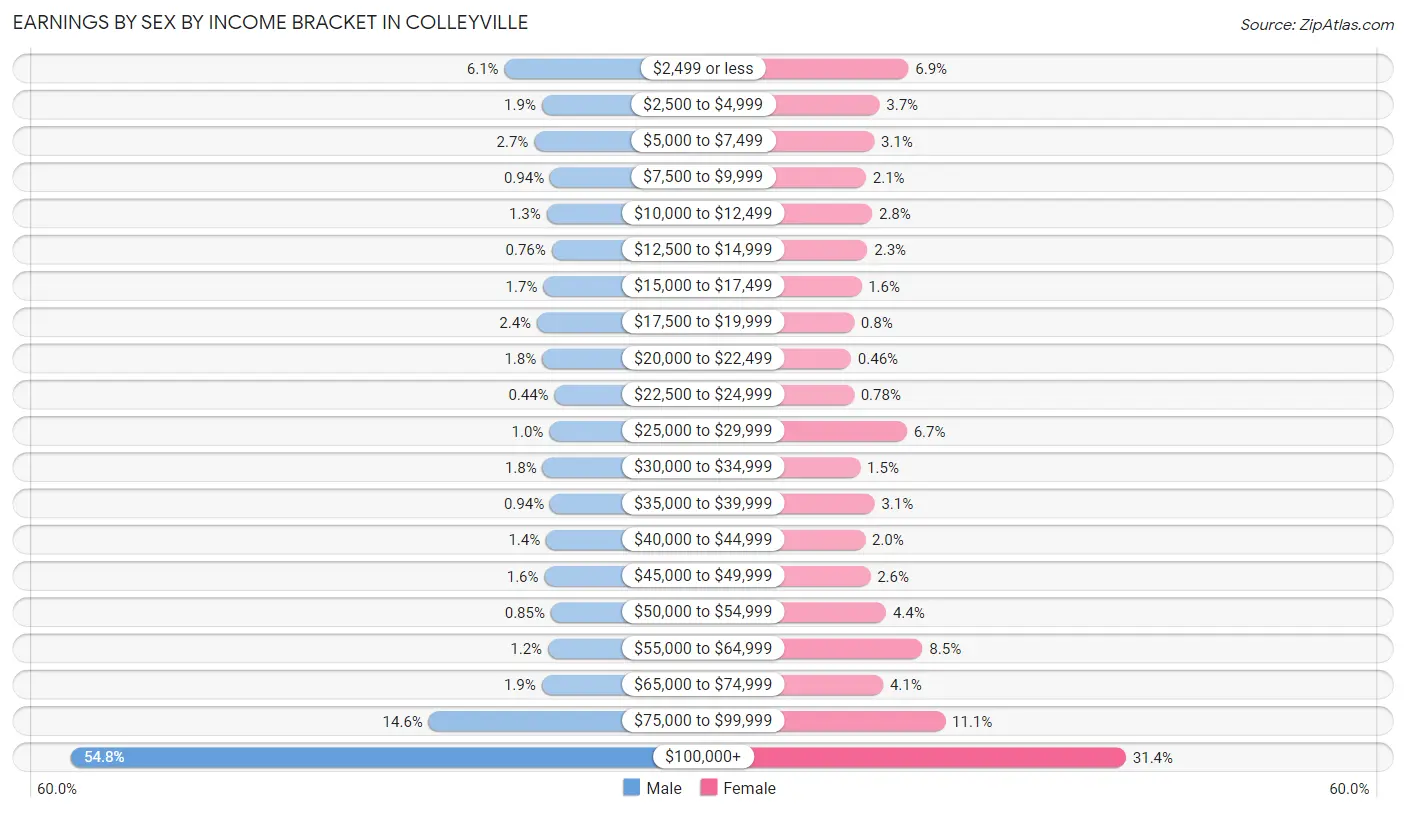
| Income | Male | Female |
| $2,499 or less | 477 (6.1%) | 423 (6.9%) |
| $2,500 to $4,999 | 147 (1.9%) | 224 (3.7%) |
| $5,000 to $7,499 | 214 (2.7%) | 187 (3.1%) |
| $7,500 to $9,999 | 74 (0.9%) | 131 (2.1%) |
| $10,000 to $12,499 | 104 (1.3%) | 174 (2.8%) |
| $12,500 to $14,999 | 60 (0.8%) | 141 (2.3%) |
| $15,000 to $17,499 | 134 (1.7%) | 99 (1.6%) |
| $17,500 to $19,999 | 190 (2.4%) | 49 (0.8%) |
| $20,000 to $22,499 | 144 (1.8%) | 28 (0.5%) |
| $22,500 to $24,999 | 35 (0.4%) | 48 (0.8%) |
| $25,000 to $29,999 | 81 (1.0%) | 412 (6.7%) |
| $30,000 to $34,999 | 140 (1.8%) | 92 (1.5%) |
| $35,000 to $39,999 | 74 (0.9%) | 190 (3.1%) |
| $40,000 to $44,999 | 109 (1.4%) | 125 (2.0%) |
| $45,000 to $49,999 | 124 (1.6%) | 161 (2.6%) |
| $50,000 to $54,999 | 67 (0.9%) | 269 (4.4%) |
| $55,000 to $64,999 | 92 (1.2%) | 520 (8.5%) |
| $65,000 to $74,999 | 149 (1.9%) | 249 (4.1%) |
| $75,000 to $99,999 | 1,148 (14.6%) | 676 (11.1%) |
| $100,000+ | 4,312 (54.8%) | 1,919 (31.4%) |
| Total | 7,875 (100.0%) | 6,117 (100.0%) |
Earnings by Sex by Educational Attainment in Colleyville
Average earnings in Colleyville are $134,485 for men and $66,449 for women, a difference of 50.6%. Men with an educational attainment of graduate degree enjoy the highest average annual earnings of $189,762, while those with high school diploma education earn the least with $76,813. Women with an educational attainment of graduate degree earn the most with the average annual earnings of $82,500, while those with high school diploma education have the smallest earnings of $41,659.
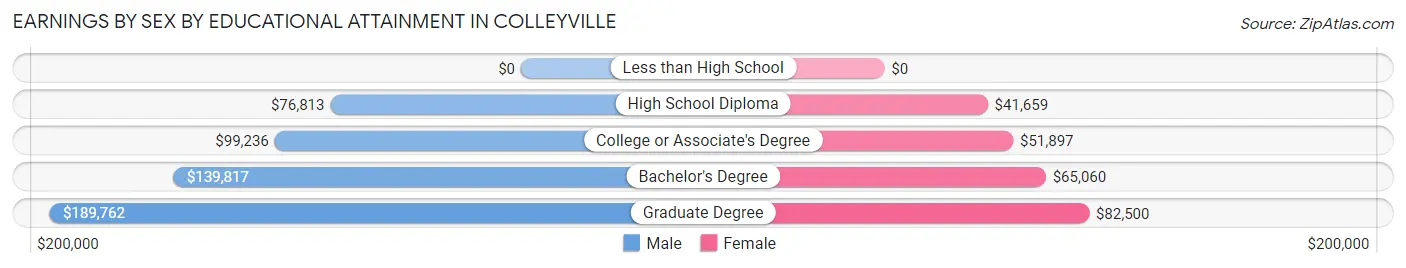
| Educational Attainment | Male Income | Female Income |
| Less than High School | - | - |
| High School Diploma | $76,813 | $41,659 |
| College or Associate's Degree | $99,236 | $51,897 |
| Bachelor's Degree | $139,817 | $65,060 |
| Graduate Degree | $189,762 | $82,500 |
| Total | $134,485 | $66,449 |
Family Income in Colleyville
Family Income Brackets in Colleyville
According to the Colleyville family income data, there are 4,399 families falling into the $200,000+ income range, which is the most common income bracket and makes up 55.5% of all families. Conversely, the $10,000 to $14,999 income bracket is the least frequent group with only 48 families (0.6%) belonging to this category.
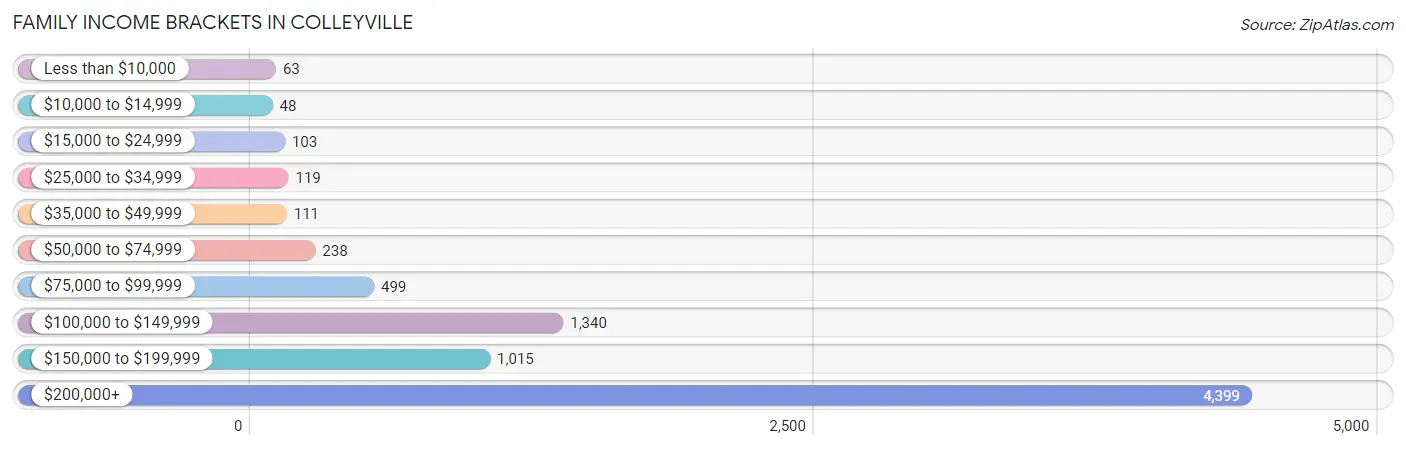
| Income Bracket | # Families | % Families |
| Less than $10,000 | 63 | 0.8% |
| $10,000 to $14,999 | 48 | 0.6% |
| $15,000 to $24,999 | 103 | 1.3% |
| $25,000 to $34,999 | 119 | 1.5% |
| $35,000 to $49,999 | 111 | 1.4% |
| $50,000 to $74,999 | 238 | 3.0% |
| $75,000 to $99,999 | 499 | 6.3% |
| $100,000 to $149,999 | 1,340 | 16.9% |
| $150,000 to $199,999 | 1,015 | 12.8% |
| $200,000+ | 4,399 | 55.5% |
Family Income by Famaliy Size in Colleyville
4-person families (1,663 | 21.0%) account for the highest median family income in Colleyville with $250,001 per family, while 2-person families (3,964 | 50.0%) have the highest median income of $89,016 per family member.
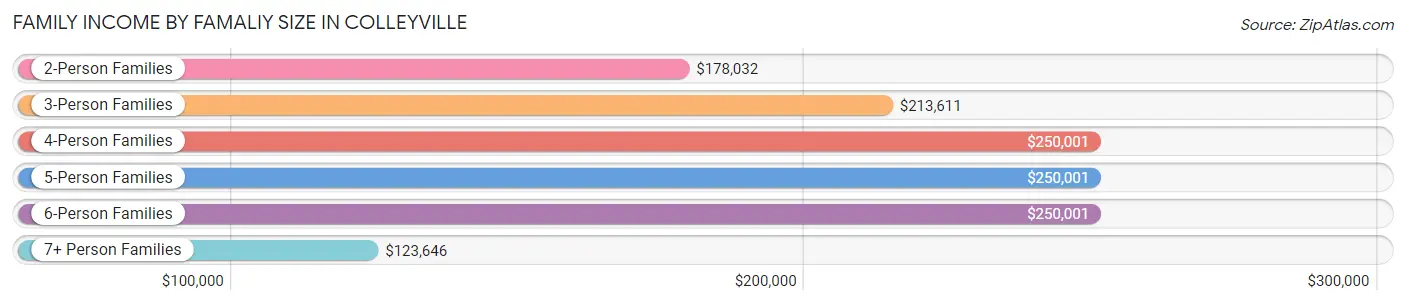
| Income Bracket | # Families | Median Income |
| 2-Person Families | 3,964 (50.0%) | $178,032 |
| 3-Person Families | 1,548 (19.5%) | $213,611 |
| 4-Person Families | 1,663 (21.0%) | $250,001 |
| 5-Person Families | 572 (7.2%) | $250,001 |
| 6-Person Families | 95 (1.2%) | $250,001 |
| 7+ Person Families | 85 (1.1%) | $123,646 |
| Total | 7,927 (100.0%) | $215,158 |
Family Income by Number of Earners in Colleyville
The median family income in Colleyville is $215,158, with families comprising 3+ earners (880) having the highest median family income of $250,001, while families with no earners (1,248) have the lowest median family income of $107,054, accounting for 11.1% and 15.7% of families, respectively.
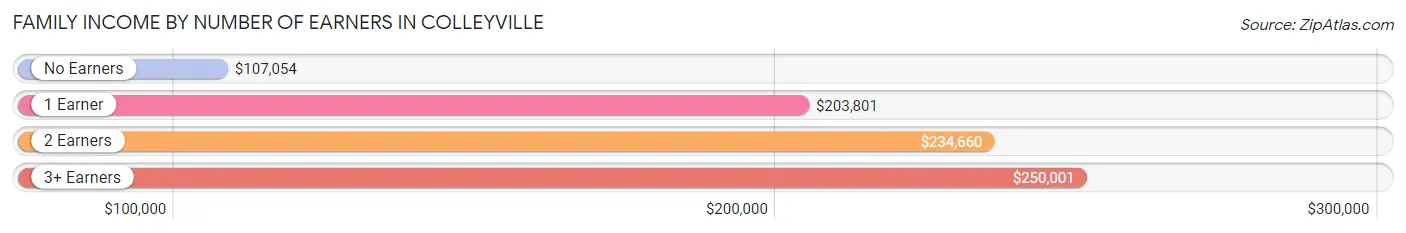
| Number of Earners | # Families | Median Income |
| No Earners | 1,248 (15.7%) | $107,054 |
| 1 Earner | 2,151 (27.1%) | $203,801 |
| 2 Earners | 3,648 (46.0%) | $234,660 |
| 3+ Earners | 880 (11.1%) | $250,001 |
| Total | 7,927 (100.0%) | $215,158 |
Household Income in Colleyville
Household Income Brackets in Colleyville
With 4,564 households falling in the category, the $200,000+ income range is the most frequent in Colleyville, accounting for 49.3% of all households. In contrast, only 65 households (0.7%) fall into the $10,000 to $14,999 income bracket, making it the least populous group.
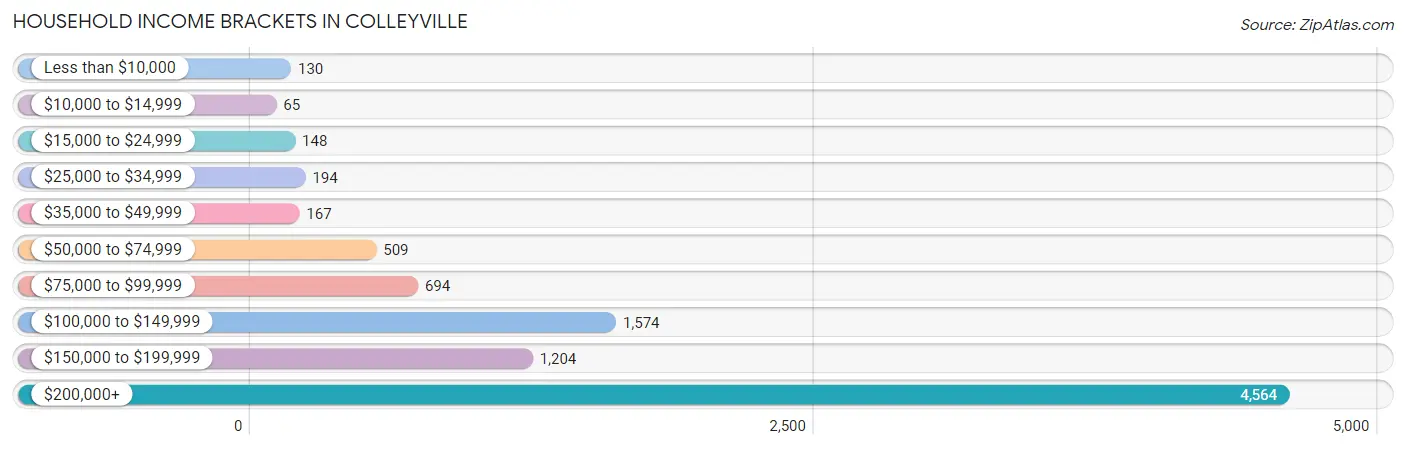
| Income Bracket | # Households | % Households |
| Less than $10,000 | 130 | 1.4% |
| $10,000 to $14,999 | 65 | 0.7% |
| $15,000 to $24,999 | 148 | 1.6% |
| $25,000 to $34,999 | 194 | 2.1% |
| $35,000 to $49,999 | 167 | 1.8% |
| $50,000 to $74,999 | 509 | 5.5% |
| $75,000 to $99,999 | 694 | 7.5% |
| $100,000 to $149,999 | 1,574 | 17.0% |
| $150,000 to $199,999 | 1,204 | 13.0% |
| $200,000+ | 4,564 | 49.3% |
Household Income by Householder Age in Colleyville
The median household income in Colleyville is $196,298, with the highest median household income of $232,875 found in the 25 to 44 years age bracket for the primary householder. A total of 1,613 households (17.4%) fall into this category.
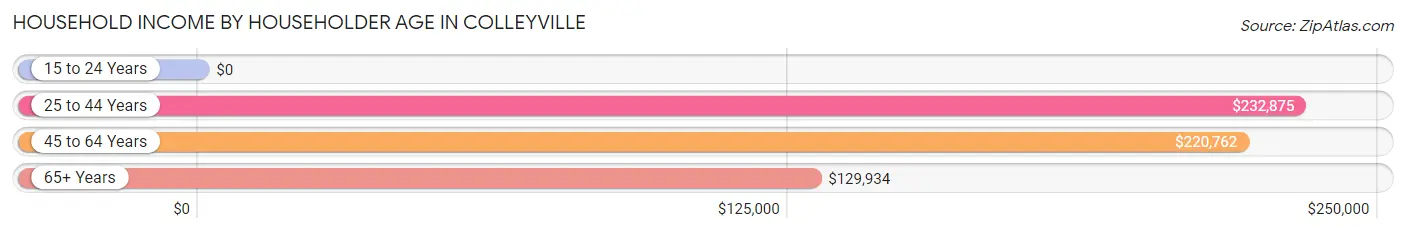
| Income Bracket | # Households | Median Income |
| 15 to 24 Years | 0 (0.0%) | $0 |
| 25 to 44 Years | 1,613 (17.4%) | $232,875 |
| 45 to 64 Years | 5,036 (54.4%) | $220,762 |
| 65+ Years | 2,609 (28.2%) | $129,934 |
| Total | 9,258 (100.0%) | $196,298 |
Poverty in Colleyville
Income Below Poverty by Sex and Age in Colleyville
With 3.1% poverty level for males and 3.6% for females among the residents of Colleyville, 6 to 11 year old males and 45 to 54 year old females are the most vulnerable to poverty, with 62 males (5.7%) and 155 females (6.4%) in their respective age groups living below the poverty level.
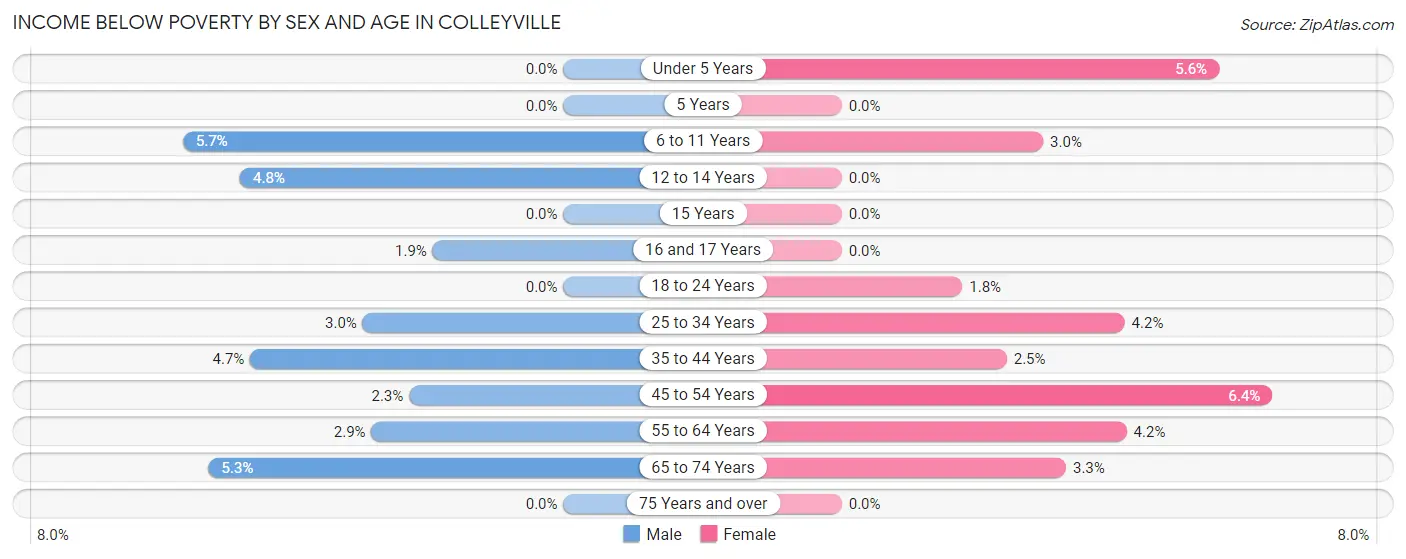
| Age Bracket | Male | Female |
| Under 5 Years | 0 (0.0%) | 27 (5.6%) |
| 5 Years | 0 (0.0%) | 0 (0.0%) |
| 6 to 11 Years | 62 (5.7%) | 31 (3.0%) |
| 12 to 14 Years | 46 (4.8%) | 0 (0.0%) |
| 15 Years | 0 (0.0%) | 0 (0.0%) |
| 16 and 17 Years | 9 (1.9%) | 0 (0.0%) |
| 18 to 24 Years | 0 (0.0%) | 9 (1.8%) |
| 25 to 34 Years | 25 (3.0%) | 26 (4.2%) |
| 35 to 44 Years | 65 (4.6%) | 35 (2.5%) |
| 45 to 54 Years | 50 (2.3%) | 155 (6.4%) |
| 55 to 64 Years | 61 (2.9%) | 108 (4.2%) |
| 65 to 74 Years | 102 (5.3%) | 51 (3.3%) |
| 75 Years and over | 0 (0.0%) | 0 (0.0%) |
| Total | 420 (3.1%) | 442 (3.6%) |
Income Above Poverty by Sex and Age in Colleyville
According to the poverty statistics in Colleyville, males aged under 5 years and females aged 5 years are the age groups that are most secure financially, with 100.0% of males and 100.0% of females in these age groups living above the poverty line.
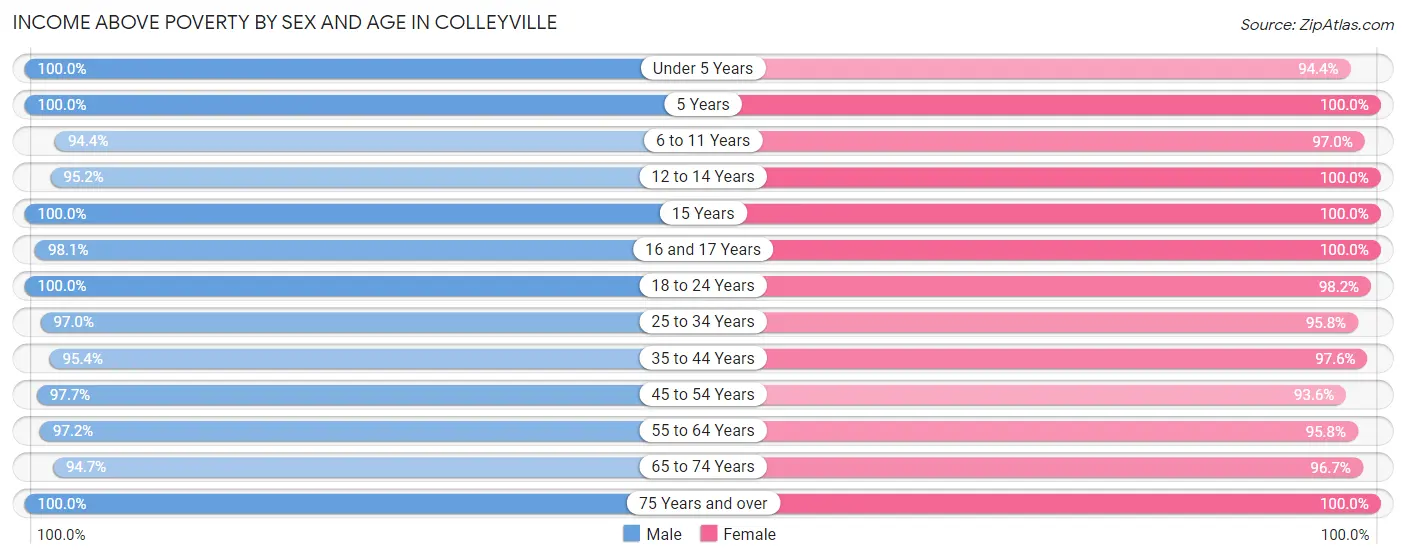
| Age Bracket | Male | Female |
| Under 5 Years | 549 (100.0%) | 455 (94.4%) |
| 5 Years | 207 (100.0%) | 83 (100.0%) |
| 6 to 11 Years | 1,035 (94.4%) | 1,005 (97.0%) |
| 12 to 14 Years | 913 (95.2%) | 353 (100.0%) |
| 15 Years | 436 (100.0%) | 103 (100.0%) |
| 16 and 17 Years | 455 (98.1%) | 253 (100.0%) |
| 18 to 24 Years | 813 (100.0%) | 493 (98.2%) |
| 25 to 34 Years | 815 (97.0%) | 593 (95.8%) |
| 35 to 44 Years | 1,334 (95.4%) | 1,396 (97.6%) |
| 45 to 54 Years | 2,130 (97.7%) | 2,270 (93.6%) |
| 55 to 64 Years | 2,078 (97.2%) | 2,444 (95.8%) |
| 65 to 74 Years | 1,834 (94.7%) | 1,481 (96.7%) |
| 75 Years and over | 687 (100.0%) | 768 (100.0%) |
| Total | 13,286 (96.9%) | 11,697 (96.4%) |
Income Below Poverty Among Married-Couple Families in Colleyville
The poverty statistics for married-couple families in Colleyville show that 2.8% or 206 of the total 7,242 families live below the poverty line. Families with 5 or more children have the highest poverty rate of 14.5%, comprising of 9 families. On the other hand, families with 1 or 2 children have the lowest poverty rate of 2.2%, which includes 52 families.
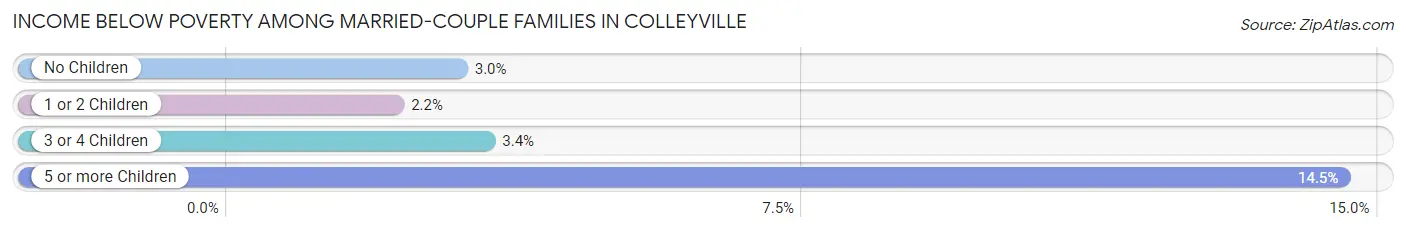
| Children | Above Poverty | Below Poverty |
| No Children | 4,202 (97.0%) | 130 (3.0%) |
| 1 or 2 Children | 2,349 (97.8%) | 52 (2.2%) |
| 3 or 4 Children | 432 (96.6%) | 15 (3.4%) |
| 5 or more Children | 53 (85.5%) | 9 (14.5%) |
| Total | 7,036 (97.2%) | 206 (2.8%) |
Income Below Poverty Among Single-Parent Households in Colleyville
| Children | Single Father | Single Mother |
| No Children | 0 (0.0%) | 0 (0.0%) |
| 1 or 2 Children | 0 (0.0%) | 0 (0.0%) |
| 3 or 4 Children | 0 (0.0%) | 0 (0.0%) |
| 5 or more Children | 0 (0.0%) | 0 (0.0%) |
| Total | 0 (0.0%) | 0 (0.0%) |
Income Below Poverty Among Married-Couple vs Single-Parent Households in Colleyville
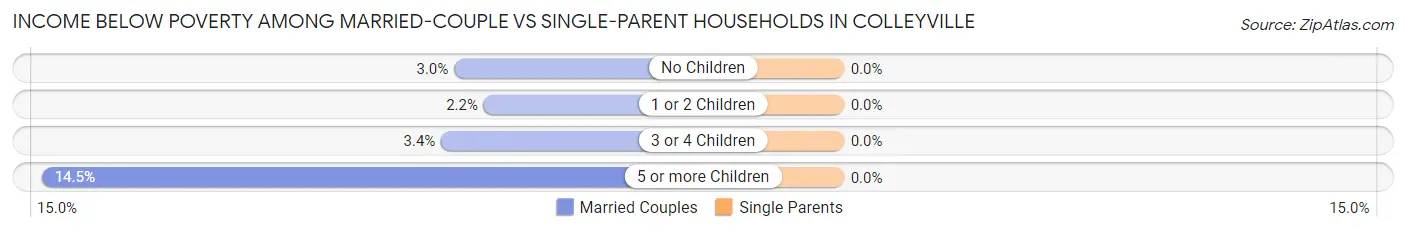
| Children | Married-Couple Families | Single-Parent Households |
| No Children | 130 (3.0%) | 0 (0.0%) |
| 1 or 2 Children | 52 (2.2%) | 0 (0.0%) |
| 3 or 4 Children | 15 (3.4%) | 0 (0.0%) |
| 5 or more Children | 9 (14.5%) | 0 (0.0%) |
| Total | 206 (2.8%) | 0 (0.0%) |
Employment Characteristics in Colleyville
Employment by Class of Employer in Colleyville
Among the 12,497 employed individuals in Colleyville, private company employees (9,069 | 72.6%), self-employed (incorporated) (992 | 7.9%), and self-employed (not incorporated) (752 | 6.0%) make up the most common classes of employment.
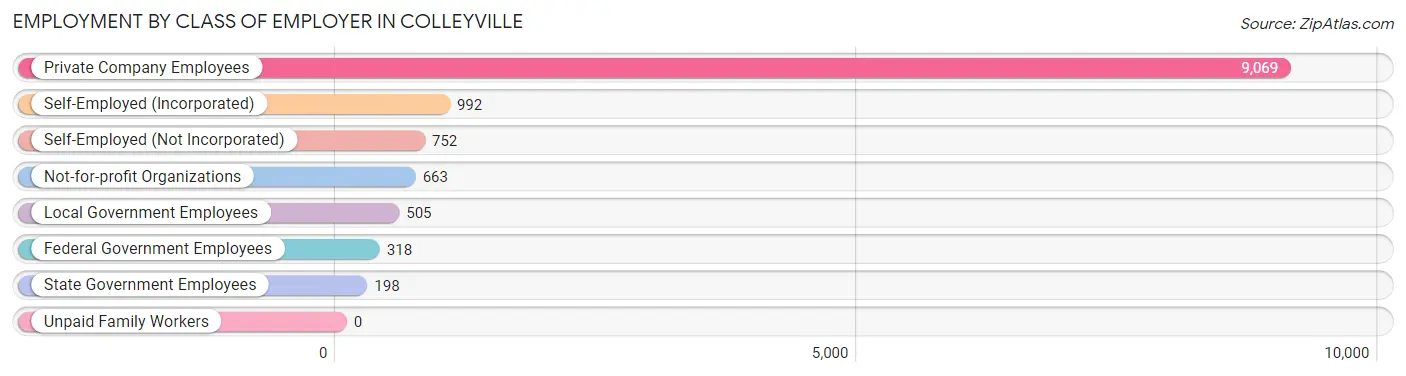
| Employer Class | # Employees | % Employees |
| Private Company Employees | 9,069 | 72.6% |
| Self-Employed (Incorporated) | 992 | 7.9% |
| Self-Employed (Not Incorporated) | 752 | 6.0% |
| Not-for-profit Organizations | 663 | 5.3% |
| Local Government Employees | 505 | 4.0% |
| State Government Employees | 198 | 1.6% |
| Federal Government Employees | 318 | 2.5% |
| Unpaid Family Workers | 0 | 0.0% |
| Total | 12,497 | 100.0% |
Employment Status by Age in Colleyville
According to the labor force statistics for Colleyville, out of the total population over 16 years of age (20,555), 63.9% or 13,135 individuals are in the labor force, with 3.7% or 486 of them unemployed. The age group with the highest labor force participation rate is 30 to 34 years, with 96.8% or 696 individuals in the labor force. Within the labor force, the 16 to 19 years age range has the highest percentage of unemployed individuals, with 10.7% or 72 of them being unemployed.
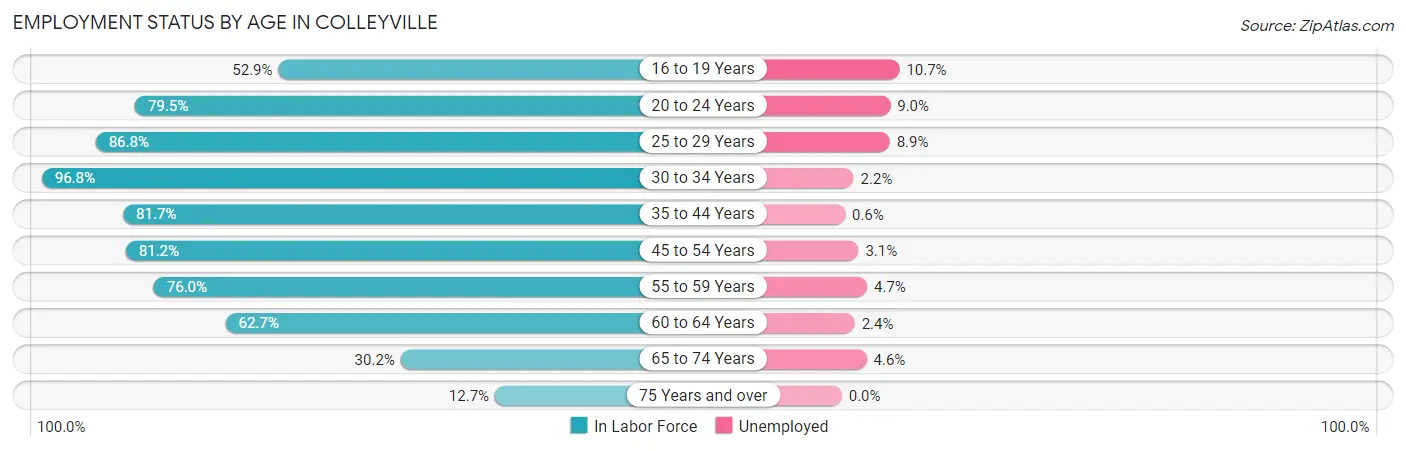
| Age Bracket | In Labor Force | Unemployed |
| 16 to 19 Years | 677 (52.9%) | 72 (10.7%) |
| 20 to 24 Years | 599 (79.5%) | 54 (9.0%) |
| 25 to 29 Years | 642 (86.8%) | 57 (8.9%) |
| 30 to 34 Years | 696 (96.8%) | 15 (2.2%) |
| 35 to 44 Years | 2,312 (81.7%) | 14 (0.6%) |
| 45 to 54 Years | 3,739 (81.2%) | 116 (3.1%) |
| 55 to 59 Years | 1,666 (76.0%) | 78 (4.7%) |
| 60 to 64 Years | 1,567 (62.7%) | 38 (2.4%) |
| 65 to 74 Years | 1,047 (30.2%) | 48 (4.6%) |
| 75 Years and over | 187 (12.7%) | 0 (0.0%) |
| Total | 13,135 (63.9%) | 486 (3.7%) |
Employment Status by Educational Attainment in Colleyville
According to labor force statistics for Colleyville, 78.2% of individuals (10,623) out of the total population between 25 and 64 years of age (13,585) are in the labor force, with 3.0% or 319 of them being unemployed. The group with the highest labor force participation rate are those with the educational attainment of high school diploma, with 79.4% or 569 individuals in the labor force. Within the labor force, individuals with high school diploma education have the highest percentage of unemployment, with 10.0% or 57 of them being unemployed.
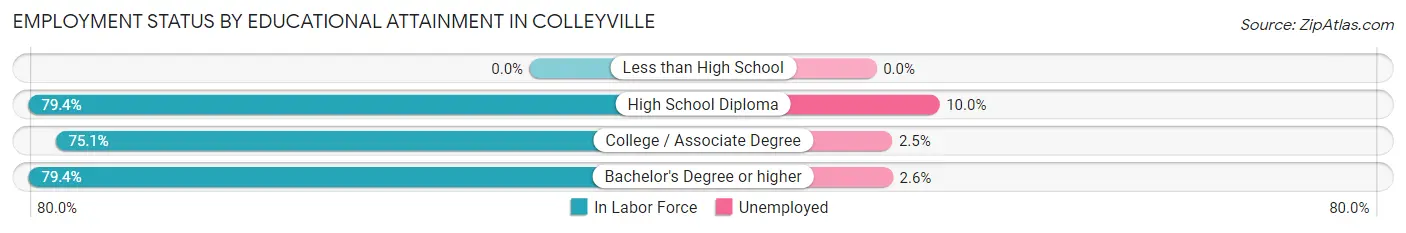
| Educational Attainment | In Labor Force | Unemployed |
| Less than High School | 0 (0.0%) | 0 (0.0%) |
| High School Diploma | 569 (79.4%) | 72 (10.0%) |
| College / Associate Degree | 2,251 (75.1%) | 75 (2.5%) |
| Bachelor's Degree or higher | 7,802 (79.4%) | 255 (2.6%) |
| Total | 10,623 (78.2%) | 408 (3.0%) |
Employment Occupations by Sex in Colleyville
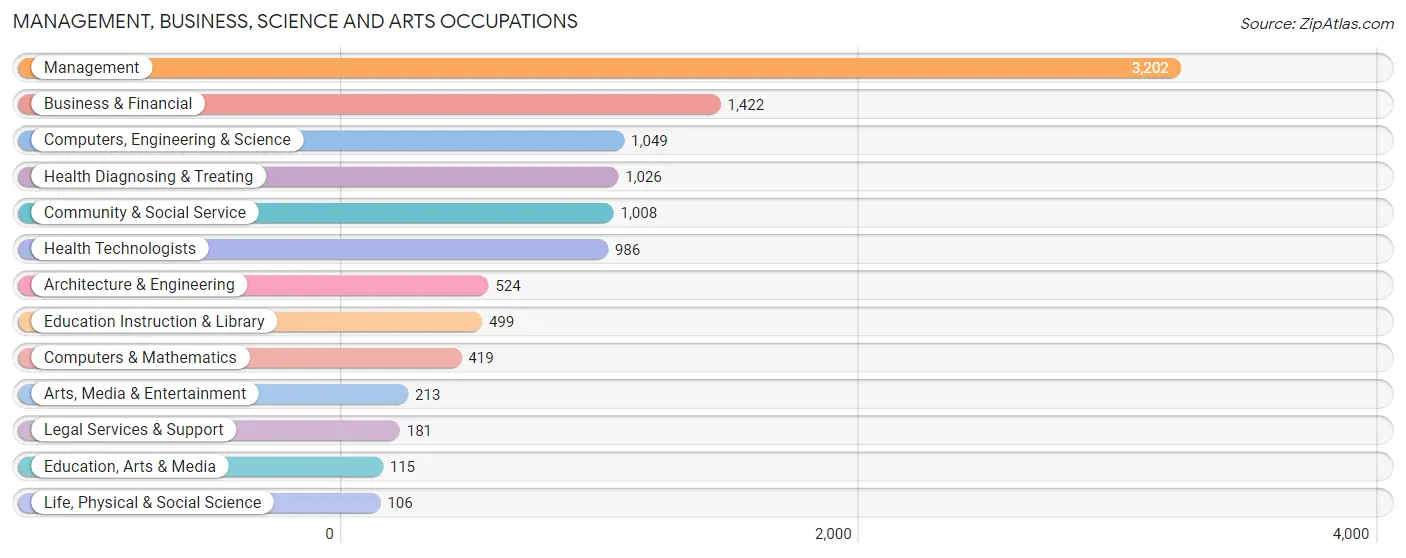
Management, Business, Science and Arts Occupations
The most common Management, Business, Science and Arts occupations in Colleyville are Management (3,202 | 25.3%), Business & Financial (1,422 | 11.3%), Computers, Engineering & Science (1,049 | 8.3%), Health Diagnosing & Treating (1,026 | 8.1%), and Community & Social Service (1,008 | 8.0%).
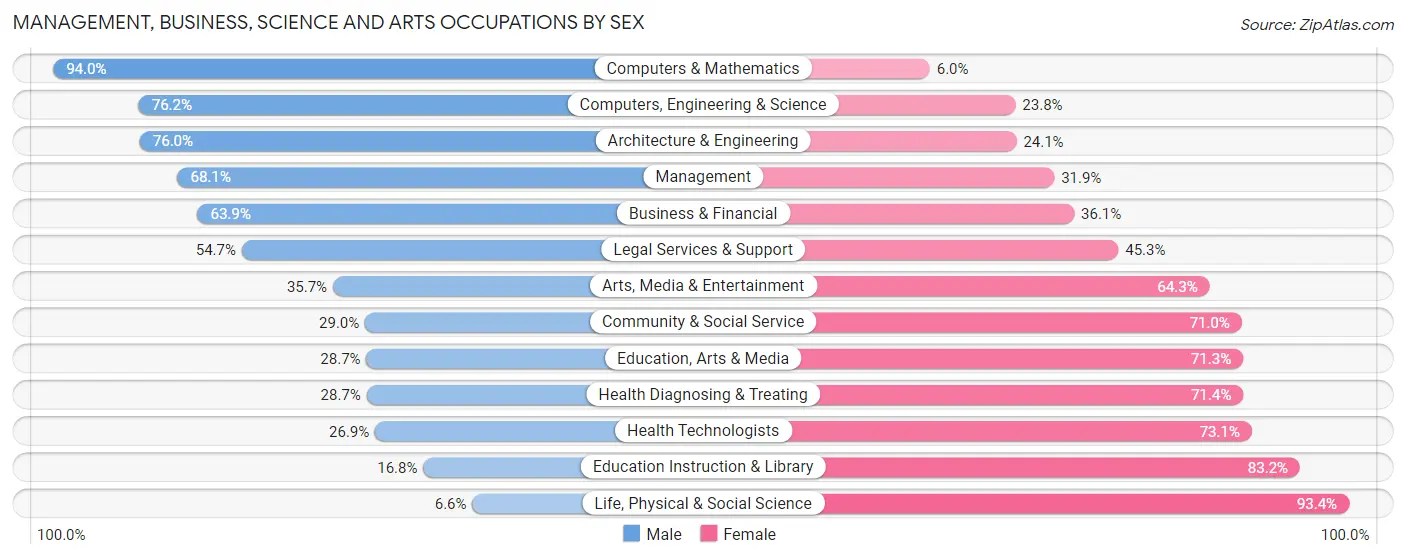
Management, Business, Science and Arts Occupations by Sex
Within the Management, Business, Science and Arts occupations in Colleyville, the most male-oriented occupations are Computers & Mathematics (94.0%), Computers, Engineering & Science (76.2%), and Architecture & Engineering (75.9%), while the most female-oriented occupations are Life, Physical & Social Science (93.4%), Education Instruction & Library (83.2%), and Health Technologists (73.1%).
| Occupation | Male | Female |
| Management | 2,180 (68.1%) | 1,022 (31.9%) |
| Business & Financial | 909 (63.9%) | 513 (36.1%) |
| Computers, Engineering & Science | 799 (76.2%) | 250 (23.8%) |
| Computers & Mathematics | 394 (94.0%) | 25 (6.0%) |
| Architecture & Engineering | 398 (75.9%) | 126 (24.0%) |
| Life, Physical & Social Science | 7 (6.6%) | 99 (93.4%) |
| Community & Social Service | 292 (29.0%) | 716 (71.0%) |
| Education, Arts & Media | 33 (28.7%) | 82 (71.3%) |
| Legal Services & Support | 99 (54.7%) | 82 (45.3%) |
| Education Instruction & Library | 84 (16.8%) | 415 (83.2%) |
| Arts, Media & Entertainment | 76 (35.7%) | 137 (64.3%) |
| Health Diagnosing & Treating | 294 (28.6%) | 732 (71.4%) |
| Health Technologists | 265 (26.9%) | 721 (73.1%) |
| Total (Category) | 4,474 (58.1%) | 3,233 (41.9%) |
| Total (Overall) | 7,404 (58.6%) | 5,240 (41.4%) |
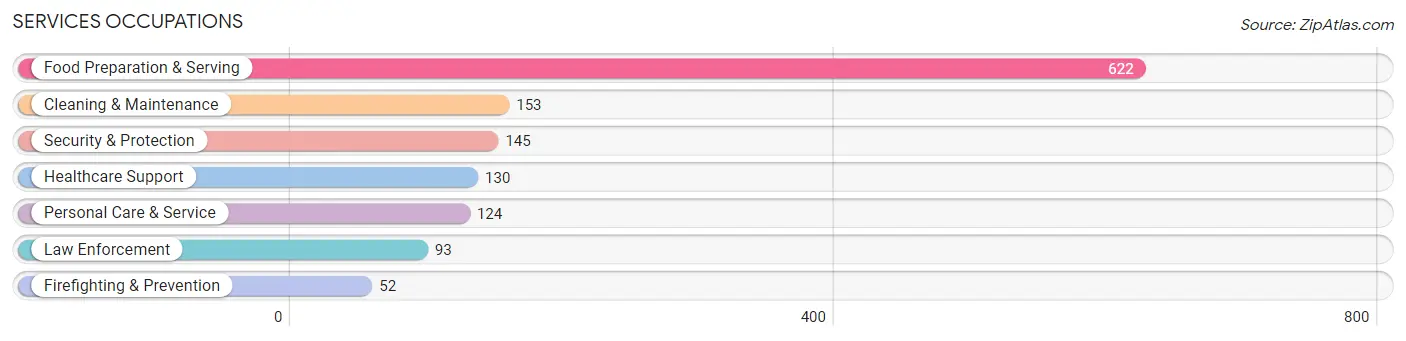
Services Occupations
The most common Services occupations in Colleyville are Food Preparation & Serving (622 | 4.9%), Cleaning & Maintenance (153 | 1.2%), Security & Protection (145 | 1.1%), Healthcare Support (130 | 1.0%), and Personal Care & Service (124 | 1.0%).
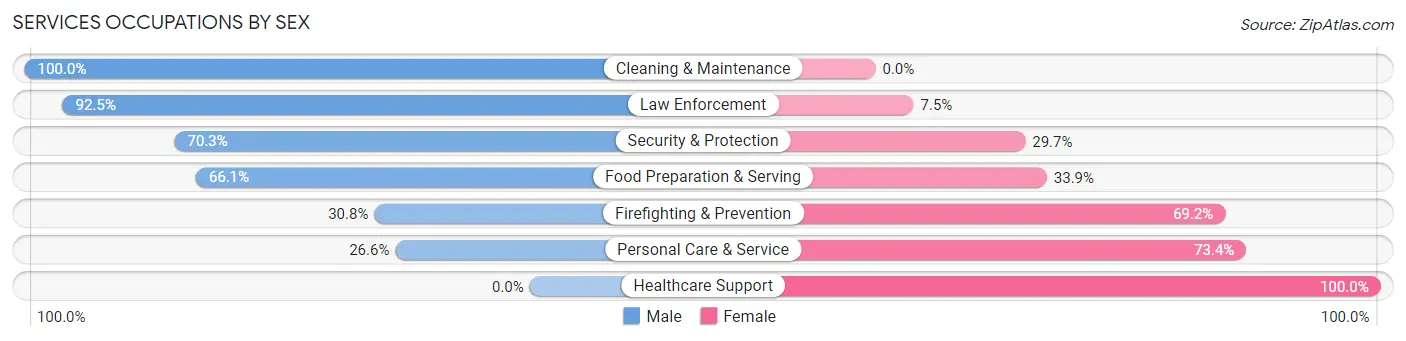
Services Occupations by Sex
Within the Services occupations in Colleyville, the most male-oriented occupations are Cleaning & Maintenance (100.0%), Law Enforcement (92.5%), and Security & Protection (70.3%), while the most female-oriented occupations are Healthcare Support (100.0%), Personal Care & Service (73.4%), and Firefighting & Prevention (69.2%).
| Occupation | Male | Female |
| Healthcare Support | 0 (0.0%) | 130 (100.0%) |
| Security & Protection | 102 (70.3%) | 43 (29.7%) |
| Firefighting & Prevention | 16 (30.8%) | 36 (69.2%) |
| Law Enforcement | 86 (92.5%) | 7 (7.5%) |
| Food Preparation & Serving | 411 (66.1%) | 211 (33.9%) |
| Cleaning & Maintenance | 153 (100.0%) | 0 (0.0%) |
| Personal Care & Service | 33 (26.6%) | 91 (73.4%) |
| Total (Category) | 699 (59.5%) | 475 (40.5%) |
| Total (Overall) | 7,404 (58.6%) | 5,240 (41.4%) |
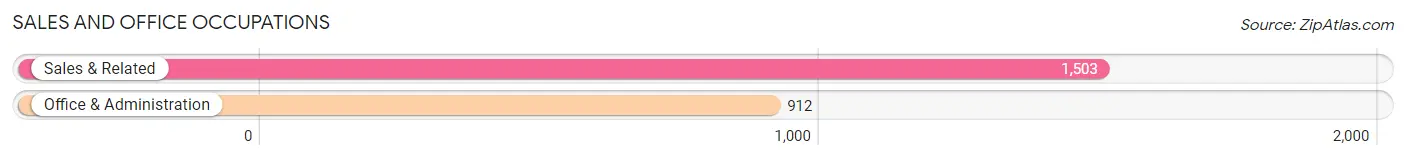
Sales and Office Occupations
The most common Sales and Office occupations in Colleyville are Sales & Related (1,503 | 11.9%), and Office & Administration (912 | 7.2%).
Sales and Office Occupations by Sex
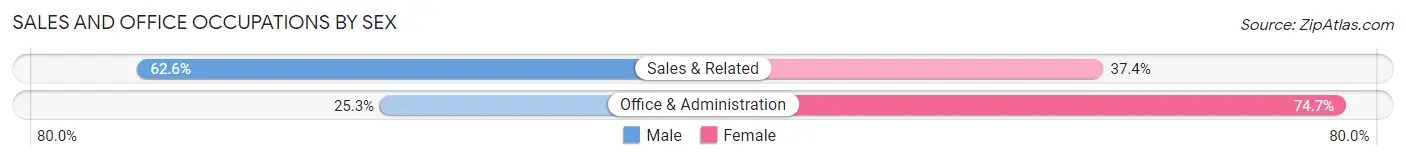
| Occupation | Male | Female |
| Sales & Related | 941 (62.6%) | 562 (37.4%) |
| Office & Administration | 231 (25.3%) | 681 (74.7%) |
| Total (Category) | 1,172 (48.5%) | 1,243 (51.5%) |
| Total (Overall) | 7,404 (58.6%) | 5,240 (41.4%) |
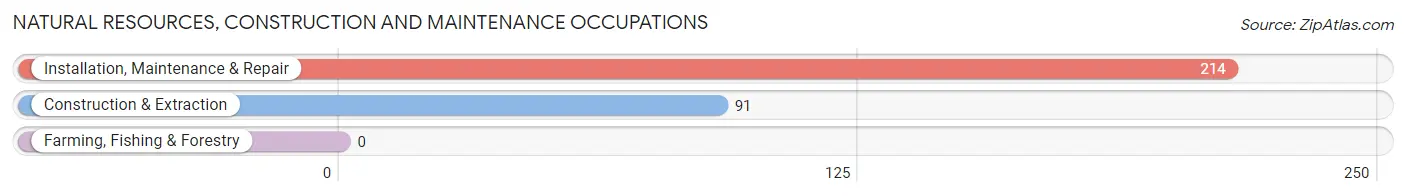
Natural Resources, Construction and Maintenance Occupations
The most common Natural Resources, Construction and Maintenance occupations in Colleyville are Installation, Maintenance & Repair (214 | 1.7%), and Construction & Extraction (91 | 0.7%).
Natural Resources, Construction and Maintenance Occupations by Sex
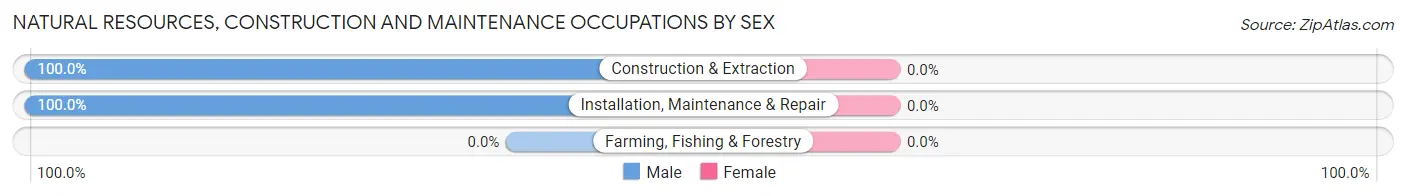
| Occupation | Male | Female |
| Farming, Fishing & Forestry | 0 (0.0%) | 0 (0.0%) |
| Construction & Extraction | 91 (100.0%) | 0 (0.0%) |
| Installation, Maintenance & Repair | 214 (100.0%) | 0 (0.0%) |
| Total (Category) | 305 (100.0%) | 0 (0.0%) |
| Total (Overall) | 7,404 (58.6%) | 5,240 (41.4%) |
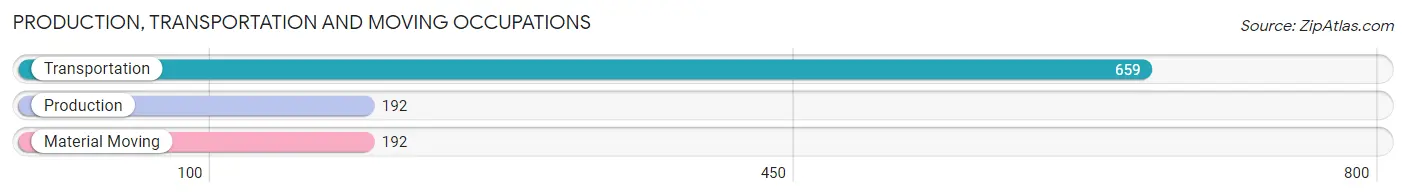
Production, Transportation and Moving Occupations
The most common Production, Transportation and Moving occupations in Colleyville are Transportation (659 | 5.2%), Production (192 | 1.5%), and Material Moving (192 | 1.5%).
Production, Transportation and Moving Occupations by Sex
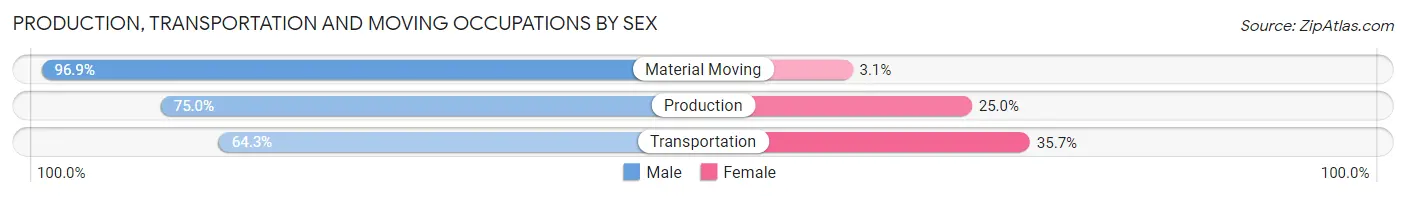
| Occupation | Male | Female |
| Production | 144 (75.0%) | 48 (25.0%) |
| Transportation | 424 (64.3%) | 235 (35.7%) |
| Material Moving | 186 (96.9%) | 6 (3.1%) |
| Total (Category) | 754 (72.3%) | 289 (27.7%) |
| Total (Overall) | 7,404 (58.6%) | 5,240 (41.4%) |
Employment Industries by Sex in Colleyville
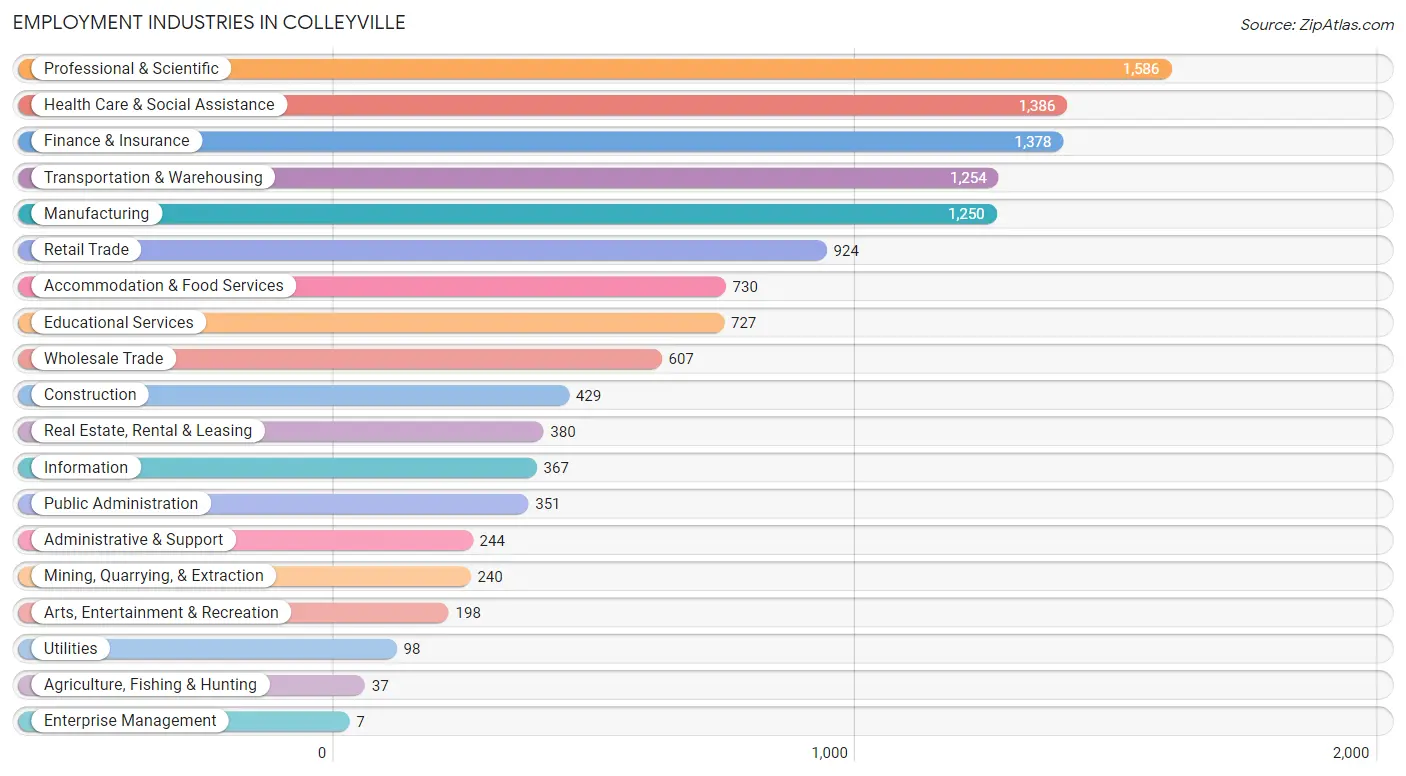
Employment Industries in Colleyville
The major employment industries in Colleyville include Professional & Scientific (1,586 | 12.5%), Health Care & Social Assistance (1,386 | 11.0%), Finance & Insurance (1,378 | 10.9%), Transportation & Warehousing (1,254 | 9.9%), and Manufacturing (1,250 | 9.9%).
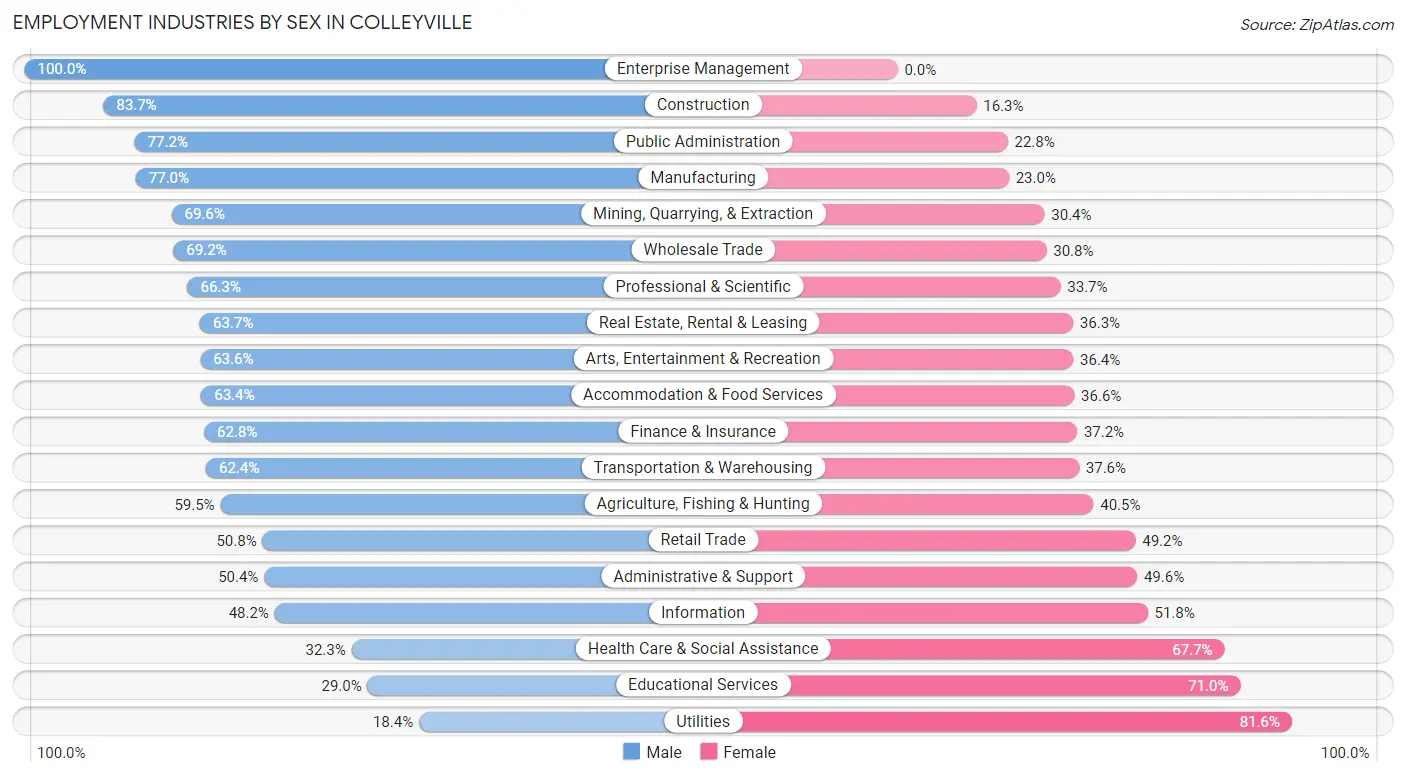
Employment Industries by Sex in Colleyville
The Colleyville industries that see more men than women are Enterprise Management (100.0%), Construction (83.7%), and Public Administration (77.2%), whereas the industries that tend to have a higher number of women are Utilities (81.6%), Educational Services (71.0%), and Health Care & Social Assistance (67.7%).
| Industry | Male | Female |
| Agriculture, Fishing & Hunting | 22 (59.5%) | 15 (40.5%) |
| Mining, Quarrying, & Extraction | 167 (69.6%) | 73 (30.4%) |
| Construction | 359 (83.7%) | 70 (16.3%) |
| Manufacturing | 962 (77.0%) | 288 (23.0%) |
| Wholesale Trade | 420 (69.2%) | 187 (30.8%) |
| Retail Trade | 469 (50.8%) | 455 (49.2%) |
| Transportation & Warehousing | 783 (62.4%) | 471 (37.6%) |
| Utilities | 18 (18.4%) | 80 (81.6%) |
| Information | 177 (48.2%) | 190 (51.8%) |
| Finance & Insurance | 866 (62.8%) | 512 (37.2%) |
| Real Estate, Rental & Leasing | 242 (63.7%) | 138 (36.3%) |
| Professional & Scientific | 1,051 (66.3%) | 535 (33.7%) |
| Enterprise Management | 7 (100.0%) | 0 (0.0%) |
| Administrative & Support | 123 (50.4%) | 121 (49.6%) |
| Educational Services | 211 (29.0%) | 516 (71.0%) |
| Health Care & Social Assistance | 448 (32.3%) | 938 (67.7%) |
| Arts, Entertainment & Recreation | 126 (63.6%) | 72 (36.4%) |
| Accommodation & Food Services | 463 (63.4%) | 267 (36.6%) |
| Public Administration | 271 (77.2%) | 80 (22.8%) |
| Total | 7,404 (58.6%) | 5,240 (41.4%) |
Education in Colleyville
School Enrollment in Colleyville
The most common levels of schooling among the 6,577 students in Colleyville are middle school (1,811 | 27.5%), high school (1,677 | 25.5%), and elementary school (1,185 | 18.0%).
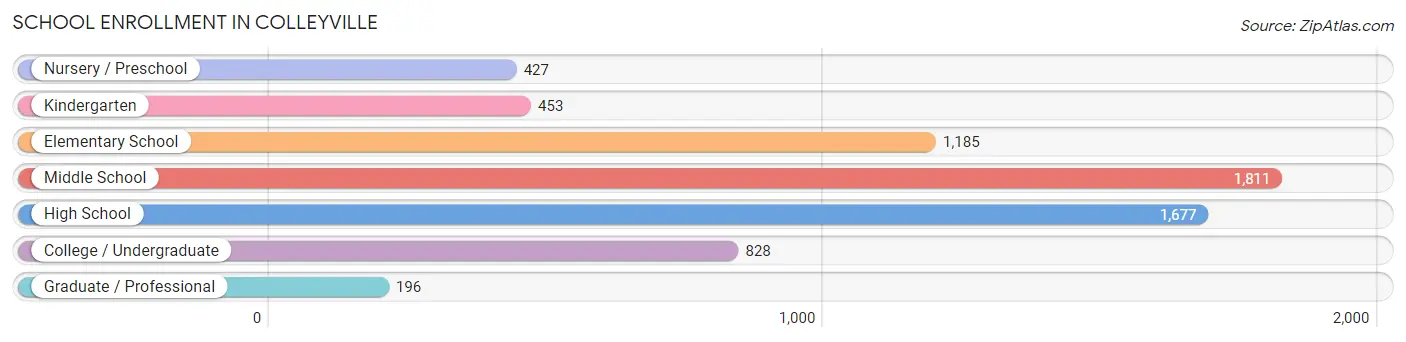
| School Level | # Students | % Students |
| Nursery / Preschool | 427 | 6.5% |
| Kindergarten | 453 | 6.9% |
| Elementary School | 1,185 | 18.0% |
| Middle School | 1,811 | 27.5% |
| High School | 1,677 | 25.5% |
| College / Undergraduate | 828 | 12.6% |
| Graduate / Professional | 196 | 3.0% |
| Total | 6,577 | 100.0% |
School Enrollment by Age by Funding Source in Colleyville
Out of a total of 6,577 students who are enrolled in schools in Colleyville, 1,486 (22.6%) attend a private institution, while the remaining 5,091 (77.4%) are enrolled in public schools. The age group of 3 to 4 year olds has the highest likelihood of being enrolled in private schools, with 280 (75.5% in the age bracket) enrolled. Conversely, the age group of 15 to 17 year olds has the lowest likelihood of being enrolled in a private school, with 1,063 (88.1% in the age bracket) attending a public institution.
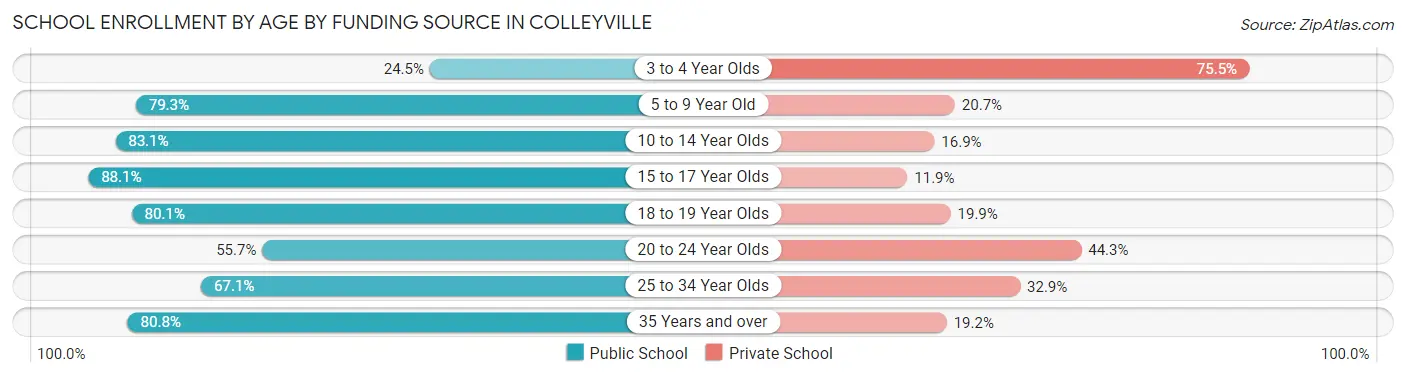
| Age Bracket | Public School | Private School |
| 3 to 4 Year Olds | 91 (24.5%) | 280 (75.5%) |
| 5 to 9 Year Old | 1,163 (79.3%) | 304 (20.7%) |
| 10 to 14 Year Olds | 1,824 (83.1%) | 371 (16.9%) |
| 15 to 17 Year Olds | 1,063 (88.1%) | 143 (11.9%) |
| 18 to 19 Year Olds | 418 (80.1%) | 104 (19.9%) |
| 20 to 24 Year Olds | 262 (55.7%) | 208 (44.3%) |
| 25 to 34 Year Olds | 47 (67.1%) | 23 (32.9%) |
| 35 Years and over | 223 (80.8%) | 53 (19.2%) |
| Total | 5,091 (77.4%) | 1,486 (22.6%) |
Educational Attainment by Field of Study in Colleyville
Business (4,071 | 30.6%), engineering (1,483 | 11.2%), education (1,137 | 8.6%), science & technology (1,104 | 8.3%), and computers & mathematics (802 | 6.0%) are the most common fields of study among 13,294 individuals in Colleyville who have obtained a bachelor's degree or higher.
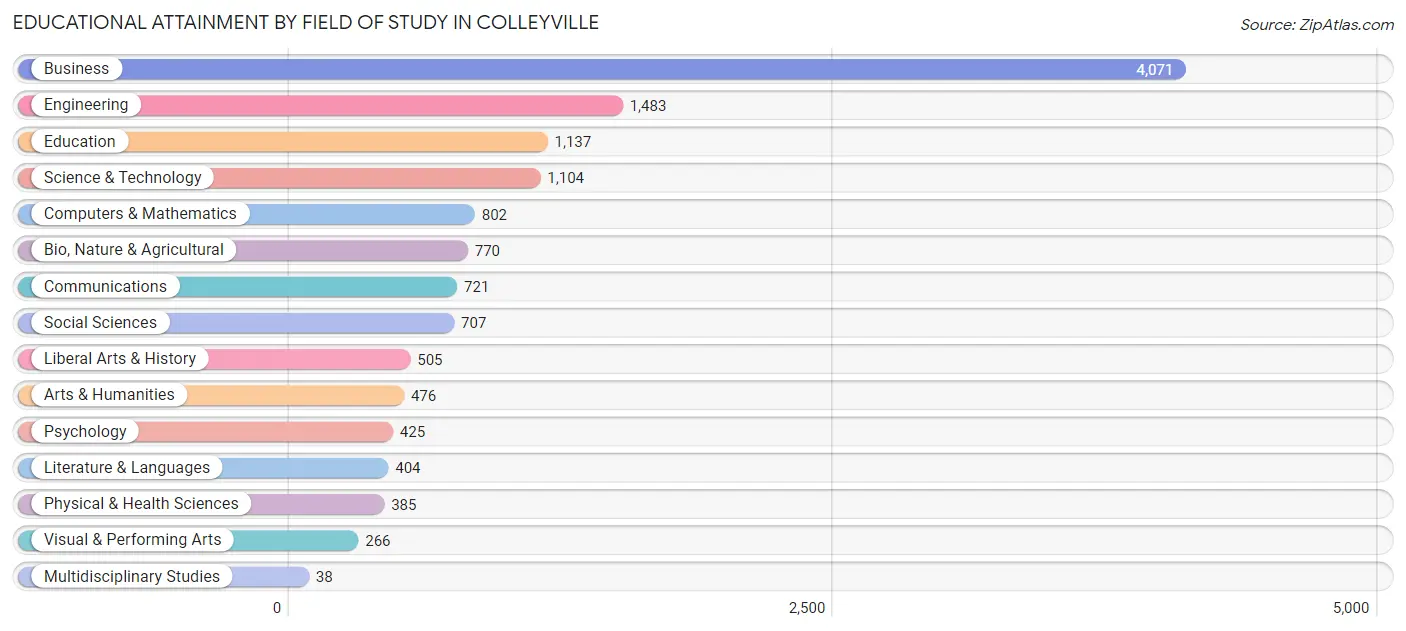
| Field of Study | # Graduates | % Graduates |
| Computers & Mathematics | 802 | 6.0% |
| Bio, Nature & Agricultural | 770 | 5.8% |
| Physical & Health Sciences | 385 | 2.9% |
| Psychology | 425 | 3.2% |
| Social Sciences | 707 | 5.3% |
| Engineering | 1,483 | 11.2% |
| Multidisciplinary Studies | 38 | 0.3% |
| Science & Technology | 1,104 | 8.3% |
| Business | 4,071 | 30.6% |
| Education | 1,137 | 8.6% |
| Literature & Languages | 404 | 3.0% |
| Liberal Arts & History | 505 | 3.8% |
| Visual & Performing Arts | 266 | 2.0% |
| Communications | 721 | 5.4% |
| Arts & Humanities | 476 | 3.6% |
| Total | 13,294 | 100.0% |
Transportation & Commute in Colleyville
Vehicle Availability by Sex in Colleyville
The most prevalent vehicle ownership categories in Colleyville are males with 2 vehicles (3,180, accounting for 43.0%) and females with 2 vehicles (2,117, making up 62.3%).
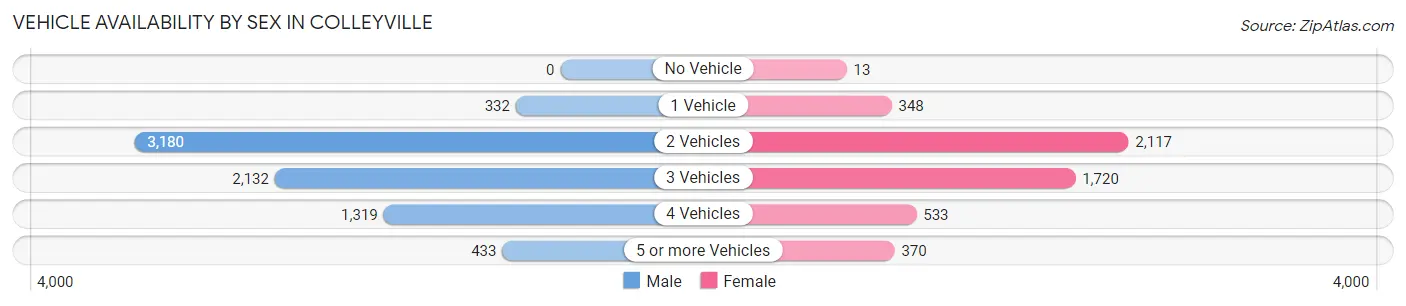
| Vehicles Available | Male | Female |
| No Vehicle | 0 (0.0%) | 13 (0.3%) |
| 1 Vehicle | 332 (4.5%) | 348 (6.8%) |
| 2 Vehicles | 3,180 (43.0%) | 2,117 (41.5%) |
| 3 Vehicles | 2,132 (28.8%) | 1,720 (33.7%) |
| 4 Vehicles | 1,319 (17.8%) | 533 (10.4%) |
| 5 or more Vehicles | 433 (5.9%) | 370 (7.2%) |
| Total | 7,396 (100.0%) | 5,101 (100.0%) |
Commute Time in Colleyville
The most frequently occuring commute durations in Colleyville are 20 to 24 minutes (1,786 commuters, 18.7%), 30 to 34 minutes (1,461 commuters, 15.3%), and 15 to 19 minutes (1,393 commuters, 14.6%).
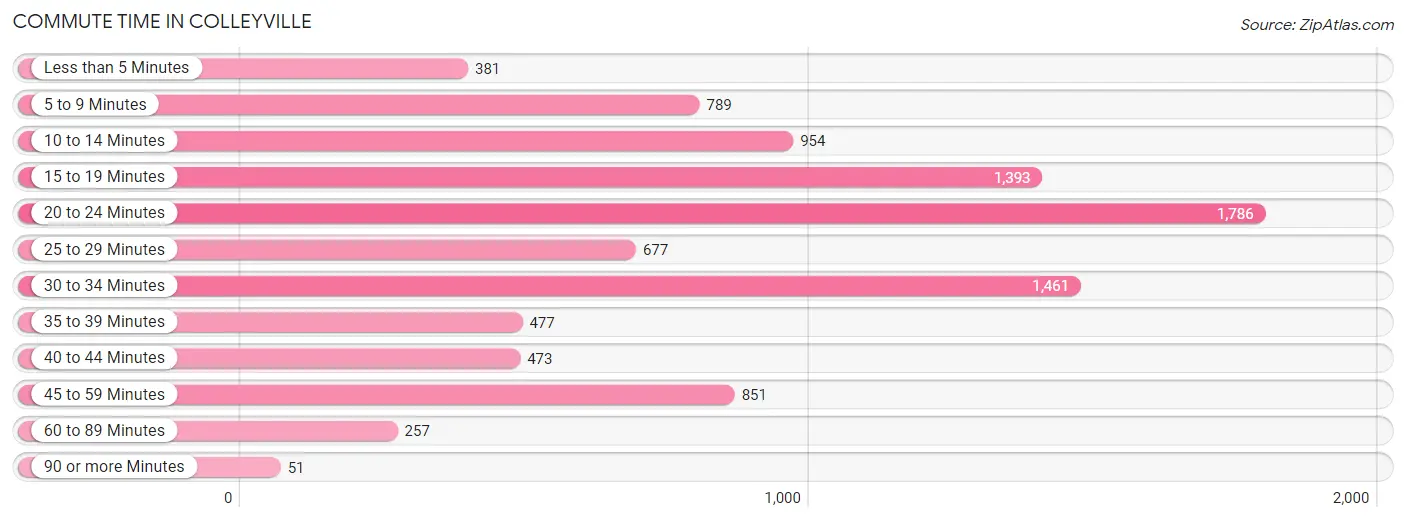
| Commute Time | # Commuters | % Commuters |
| Less than 5 Minutes | 381 | 4.0% |
| 5 to 9 Minutes | 789 | 8.3% |
| 10 to 14 Minutes | 954 | 10.0% |
| 15 to 19 Minutes | 1,393 | 14.6% |
| 20 to 24 Minutes | 1,786 | 18.7% |
| 25 to 29 Minutes | 677 | 7.1% |
| 30 to 34 Minutes | 1,461 | 15.3% |
| 35 to 39 Minutes | 477 | 5.0% |
| 40 to 44 Minutes | 473 | 5.0% |
| 45 to 59 Minutes | 851 | 8.9% |
| 60 to 89 Minutes | 257 | 2.7% |
| 90 or more Minutes | 51 | 0.5% |
Commute Time by Sex in Colleyville
The most common commute times in Colleyville are 20 to 24 minutes (1,064 commuters, 18.6%) for males and 20 to 24 minutes (722 commuters, 18.8%) for females.
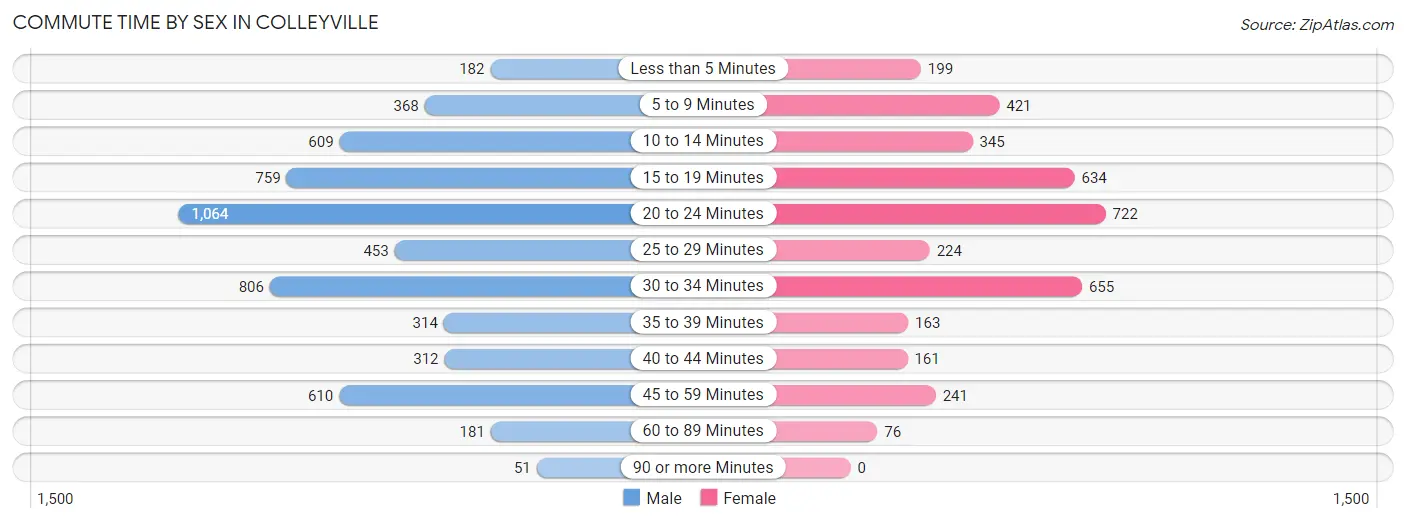
| Commute Time | Male | Female |
| Less than 5 Minutes | 182 (3.2%) | 199 (5.2%) |
| 5 to 9 Minutes | 368 (6.5%) | 421 (11.0%) |
| 10 to 14 Minutes | 609 (10.7%) | 345 (9.0%) |
| 15 to 19 Minutes | 759 (13.3%) | 634 (16.5%) |
| 20 to 24 Minutes | 1,064 (18.6%) | 722 (18.8%) |
| 25 to 29 Minutes | 453 (7.9%) | 224 (5.8%) |
| 30 to 34 Minutes | 806 (14.1%) | 655 (17.1%) |
| 35 to 39 Minutes | 314 (5.5%) | 163 (4.2%) |
| 40 to 44 Minutes | 312 (5.5%) | 161 (4.2%) |
| 45 to 59 Minutes | 610 (10.7%) | 241 (6.3%) |
| 60 to 89 Minutes | 181 (3.2%) | 76 (2.0%) |
| 90 or more Minutes | 51 (0.9%) | 0 (0.0%) |
Time of Departure to Work by Sex in Colleyville
The most frequent times of departure to work in Colleyville are 8:00 AM to 8:29 AM (1,028, 18.0%) for males and 7:00 AM to 7:29 AM (693, 18.0%) for females.
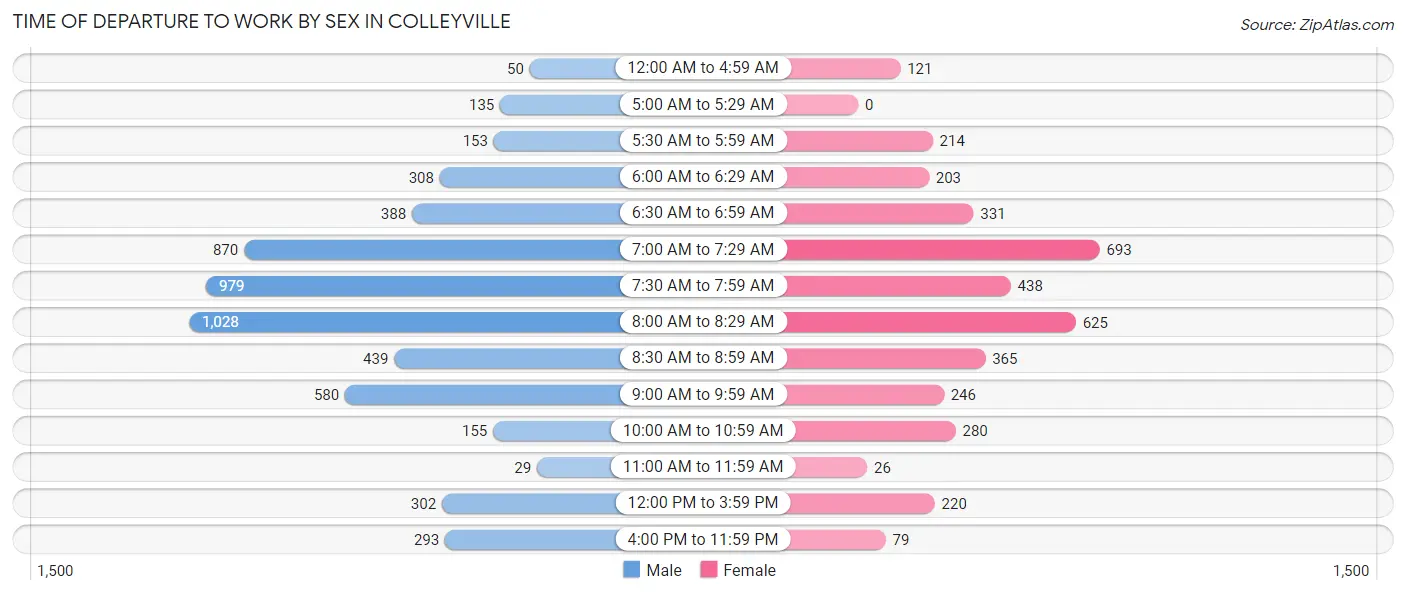
| Time of Departure | Male | Female |
| 12:00 AM to 4:59 AM | 50 (0.9%) | 121 (3.2%) |
| 5:00 AM to 5:29 AM | 135 (2.4%) | 0 (0.0%) |
| 5:30 AM to 5:59 AM | 153 (2.7%) | 214 (5.6%) |
| 6:00 AM to 6:29 AM | 308 (5.4%) | 203 (5.3%) |
| 6:30 AM to 6:59 AM | 388 (6.8%) | 331 (8.6%) |
| 7:00 AM to 7:29 AM | 870 (15.2%) | 693 (18.0%) |
| 7:30 AM to 7:59 AM | 979 (17.2%) | 438 (11.4%) |
| 8:00 AM to 8:29 AM | 1,028 (18.0%) | 625 (16.3%) |
| 8:30 AM to 8:59 AM | 439 (7.7%) | 365 (9.5%) |
| 9:00 AM to 9:59 AM | 580 (10.2%) | 246 (6.4%) |
| 10:00 AM to 10:59 AM | 155 (2.7%) | 280 (7.3%) |
| 11:00 AM to 11:59 AM | 29 (0.5%) | 26 (0.7%) |
| 12:00 PM to 3:59 PM | 302 (5.3%) | 220 (5.7%) |
| 4:00 PM to 11:59 PM | 293 (5.1%) | 79 (2.1%) |
| Total | 5,709 (100.0%) | 3,841 (100.0%) |
Housing Occupancy in Colleyville
Occupancy by Ownership in Colleyville
Of the total 9,258 dwellings in Colleyville, owner-occupied units account for 8,880 (95.9%), while renter-occupied units make up 378 (4.1%).
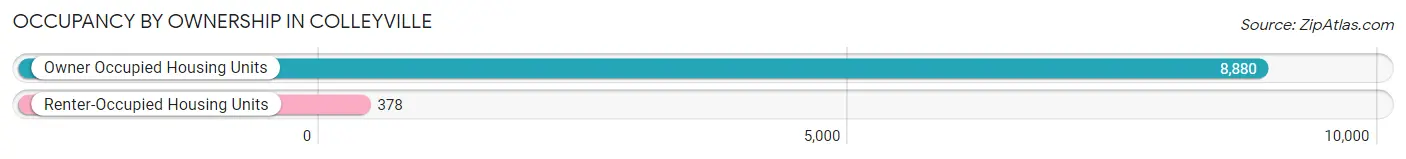
| Occupancy | # Housing Units | % Housing Units |
| Owner Occupied Housing Units | 8,880 | 95.9% |
| Renter-Occupied Housing Units | 378 | 4.1% |
| Total Occupied Housing Units | 9,258 | 100.0% |
Occupancy by Household Size in Colleyville
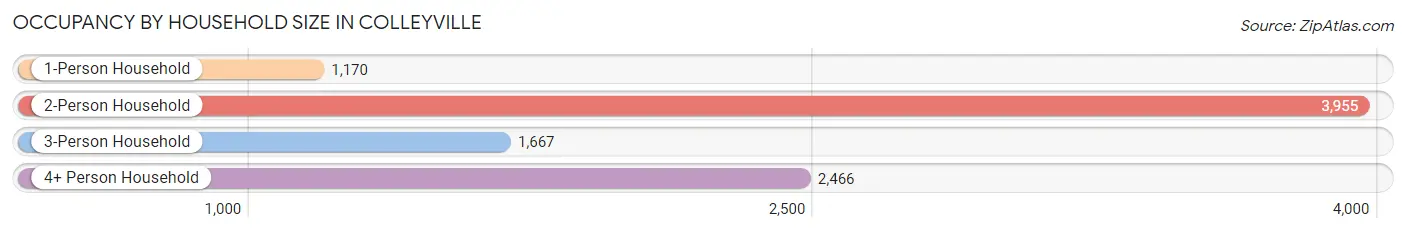
| Household Size | # Housing Units | % Housing Units |
| 1-Person Household | 1,170 | 12.6% |
| 2-Person Household | 3,955 | 42.7% |
| 3-Person Household | 1,667 | 18.0% |
| 4+ Person Household | 2,466 | 26.6% |
| Total Housing Units | 9,258 | 100.0% |
Occupancy by Ownership by Household Size in Colleyville
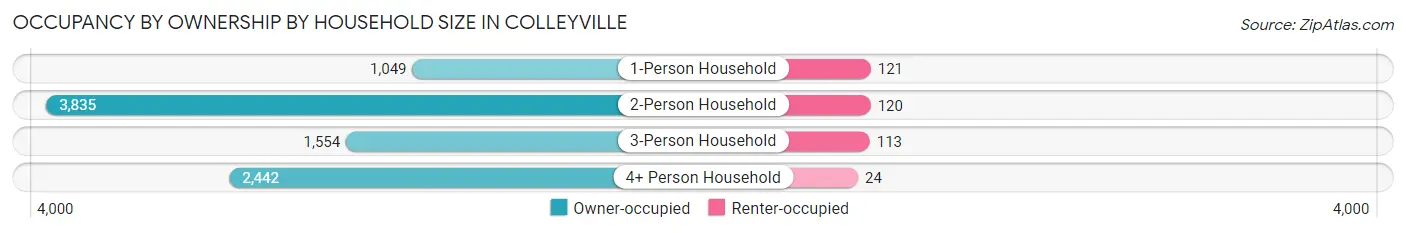
| Household Size | Owner-occupied | Renter-occupied |
| 1-Person Household | 1,049 (89.7%) | 121 (10.3%) |
| 2-Person Household | 3,835 (97.0%) | 120 (3.0%) |
| 3-Person Household | 1,554 (93.2%) | 113 (6.8%) |
| 4+ Person Household | 2,442 (99.0%) | 24 (1.0%) |
| Total Housing Units | 8,880 (95.9%) | 378 (4.1%) |
Occupancy by Educational Attainment in Colleyville
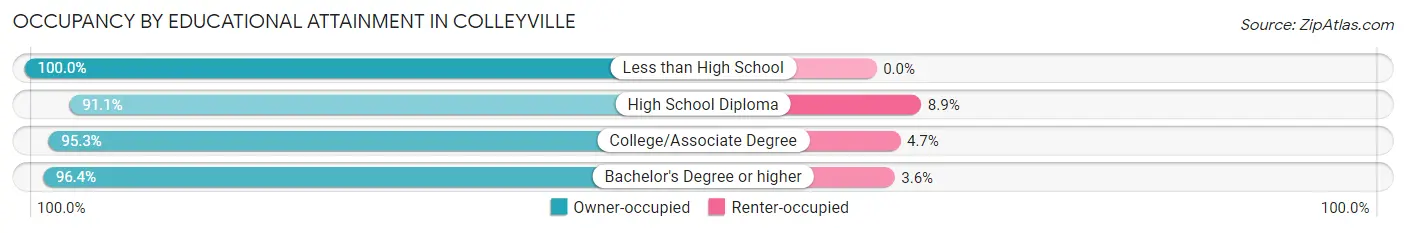
| Household Size | Owner-occupied | Renter-occupied |
| Less than High School | 27 (100.0%) | 0 (0.0%) |
| High School Diploma | 370 (91.1%) | 36 (8.9%) |
| College/Associate Degree | 2,016 (95.3%) | 100 (4.7%) |
| Bachelor's Degree or higher | 6,467 (96.4%) | 242 (3.6%) |
Occupancy by Age of Householder in Colleyville
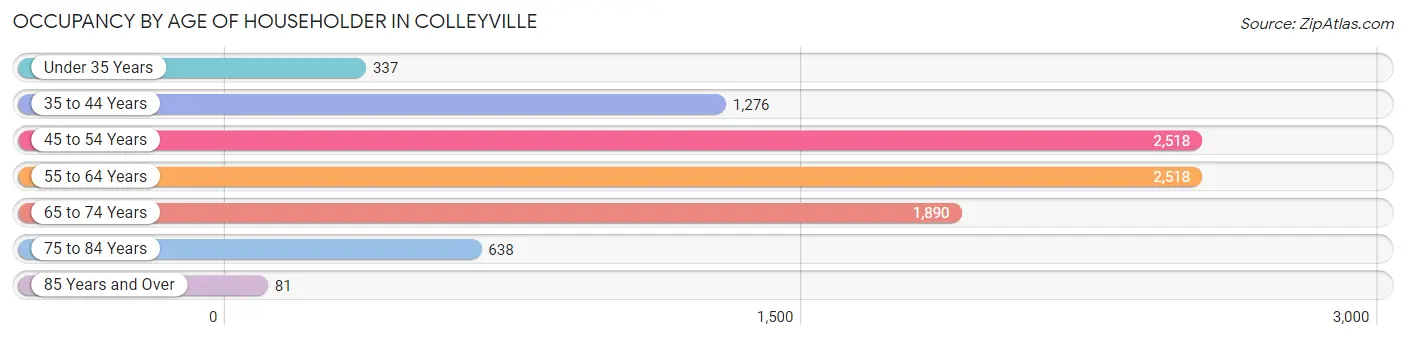
| Age Bracket | # Households | % Households |
| Under 35 Years | 337 | 3.6% |
| 35 to 44 Years | 1,276 | 13.8% |
| 45 to 54 Years | 2,518 | 27.2% |
| 55 to 64 Years | 2,518 | 27.2% |
| 65 to 74 Years | 1,890 | 20.4% |
| 75 to 84 Years | 638 | 6.9% |
| 85 Years and Over | 81 | 0.9% |
| Total | 9,258 | 100.0% |
Housing Finances in Colleyville
Median Income by Occupancy in Colleyville
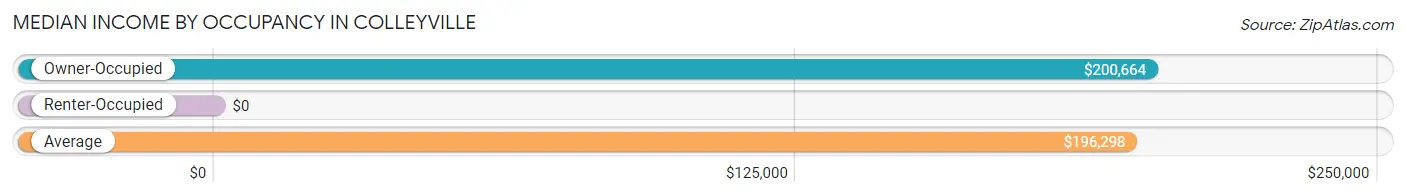
| Occupancy Type | # Households | Median Income |
| Owner-Occupied | 8,880 (95.9%) | $200,664 |
| Renter-Occupied | 378 (4.1%) | $0 |
| Average | 9,258 (100.0%) | $196,298 |
Occupancy by Householder Income Bracket in Colleyville
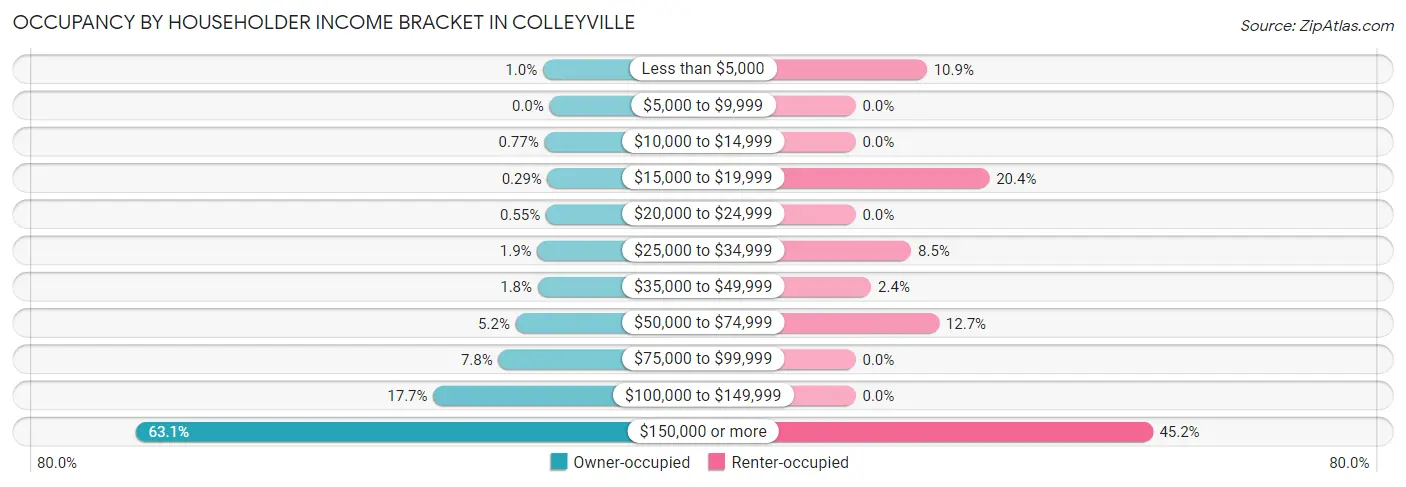
| Income Bracket | Owner-occupied | Renter-occupied |
| Less than $5,000 | 90 (1.0%) | 41 (10.8%) |
| $5,000 to $9,999 | 0 (0.0%) | 0 (0.0%) |
| $10,000 to $14,999 | 68 (0.8%) | 0 (0.0%) |
| $15,000 to $19,999 | 26 (0.3%) | 77 (20.4%) |
| $20,000 to $24,999 | 49 (0.5%) | 0 (0.0%) |
| $25,000 to $34,999 | 165 (1.9%) | 32 (8.5%) |
| $35,000 to $49,999 | 159 (1.8%) | 9 (2.4%) |
| $50,000 to $74,999 | 458 (5.2%) | 48 (12.7%) |
| $75,000 to $99,999 | 691 (7.8%) | 0 (0.0%) |
| $100,000 to $149,999 | 1,573 (17.7%) | 0 (0.0%) |
| $150,000 or more | 5,601 (63.1%) | 171 (45.2%) |
| Total | 8,880 (100.0%) | 378 (100.0%) |
Monthly Housing Cost Tiers in Colleyville
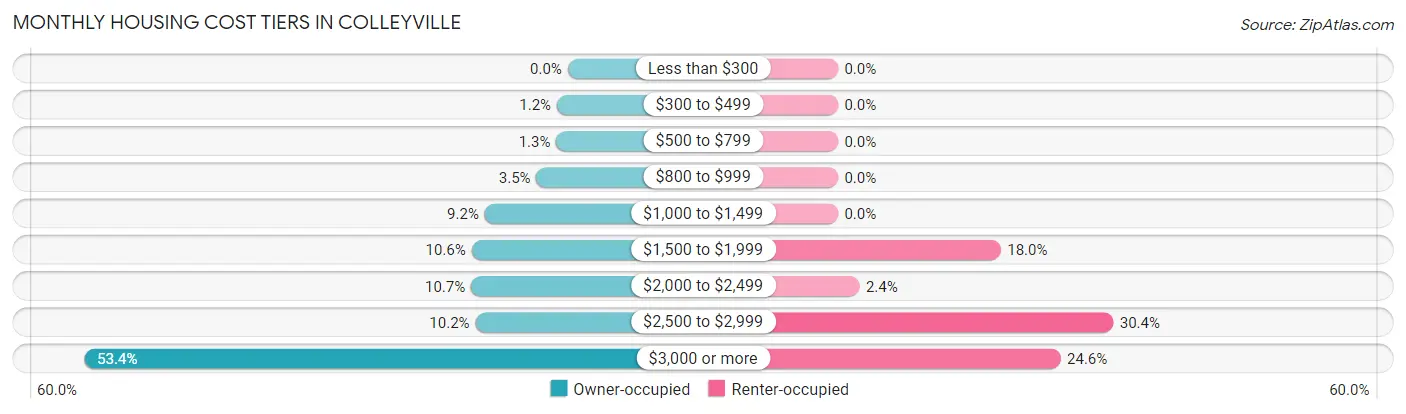
| Monthly Cost | Owner-occupied | Renter-occupied |
| Less than $300 | 0 (0.0%) | 0 (0.0%) |
| $300 to $499 | 106 (1.2%) | 0 (0.0%) |
| $500 to $799 | 112 (1.3%) | 0 (0.0%) |
| $800 to $999 | 307 (3.5%) | 0 (0.0%) |
| $1,000 to $1,499 | 814 (9.2%) | 0 (0.0%) |
| $1,500 to $1,999 | 943 (10.6%) | 68 (18.0%) |
| $2,000 to $2,499 | 948 (10.7%) | 9 (2.4%) |
| $2,500 to $2,999 | 906 (10.2%) | 115 (30.4%) |
| $3,000 or more | 4,744 (53.4%) | 93 (24.6%) |
| Total | 8,880 (100.0%) | 378 (100.0%) |
Physical Housing Characteristics in Colleyville
Housing Structures in Colleyville
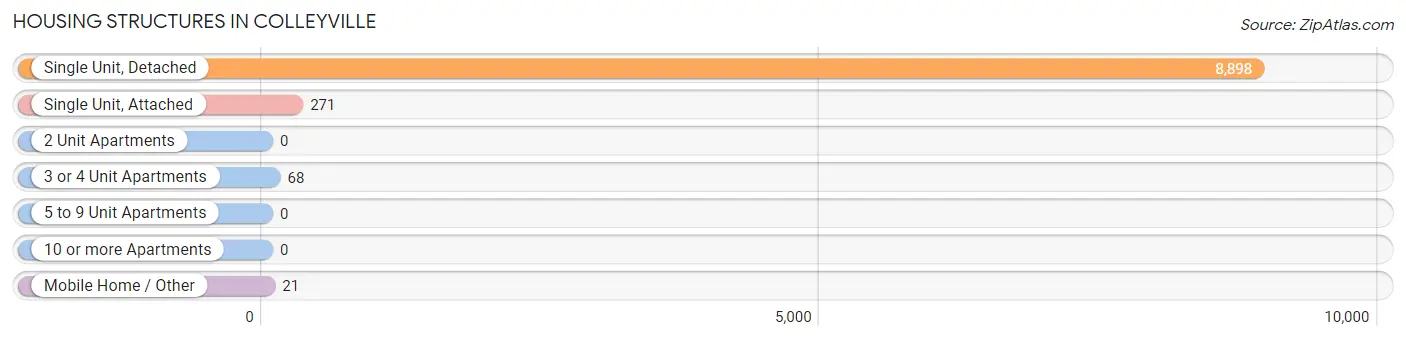
| Structure Type | # Housing Units | % Housing Units |
| Single Unit, Detached | 8,898 | 96.1% |
| Single Unit, Attached | 271 | 2.9% |
| 2 Unit Apartments | 0 | 0.0% |
| 3 or 4 Unit Apartments | 68 | 0.7% |
| 5 to 9 Unit Apartments | 0 | 0.0% |
| 10 or more Apartments | 0 | 0.0% |
| Mobile Home / Other | 21 | 0.2% |
| Total | 9,258 | 100.0% |
Housing Structures by Occupancy in Colleyville
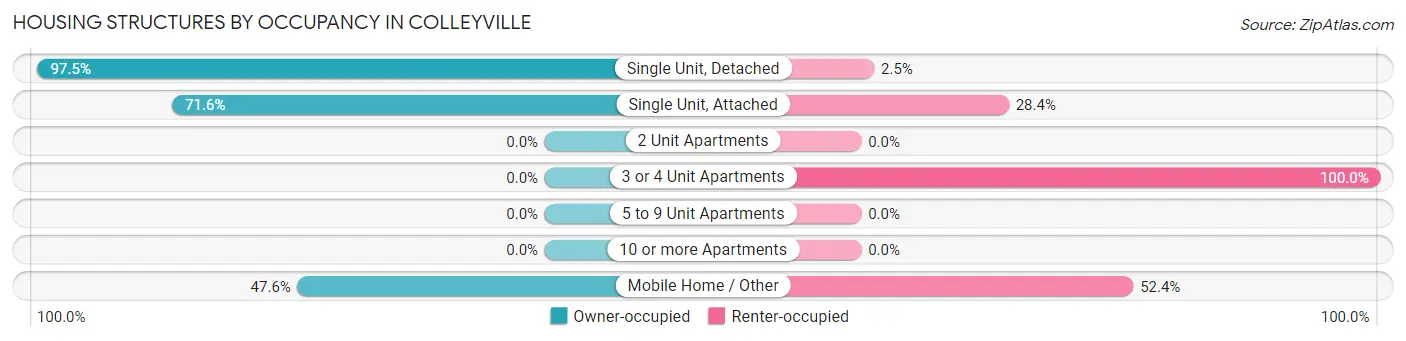
| Structure Type | Owner-occupied | Renter-occupied |
| Single Unit, Detached | 8,676 (97.5%) | 222 (2.5%) |
| Single Unit, Attached | 194 (71.6%) | 77 (28.4%) |
| 2 Unit Apartments | 0 (0.0%) | 0 (0.0%) |
| 3 or 4 Unit Apartments | 0 (0.0%) | 68 (100.0%) |
| 5 to 9 Unit Apartments | 0 (0.0%) | 0 (0.0%) |
| 10 or more Apartments | 0 (0.0%) | 0 (0.0%) |
| Mobile Home / Other | 10 (47.6%) | 11 (52.4%) |
| Total | 8,880 (95.9%) | 378 (4.1%) |
Housing Structures by Number of Rooms in Colleyville
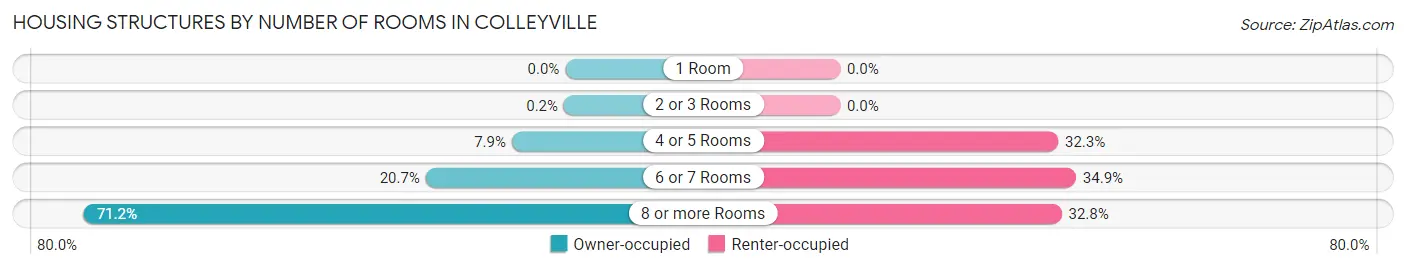
| Number of Rooms | Owner-occupied | Renter-occupied |
| 1 Room | 0 (0.0%) | 0 (0.0%) |
| 2 or 3 Rooms | 18 (0.2%) | 0 (0.0%) |
| 4 or 5 Rooms | 702 (7.9%) | 122 (32.3%) |
| 6 or 7 Rooms | 1,834 (20.6%) | 132 (34.9%) |
| 8 or more Rooms | 6,326 (71.2%) | 124 (32.8%) |
| Total | 8,880 (100.0%) | 378 (100.0%) |
Housing Structure by Heating Type in Colleyville
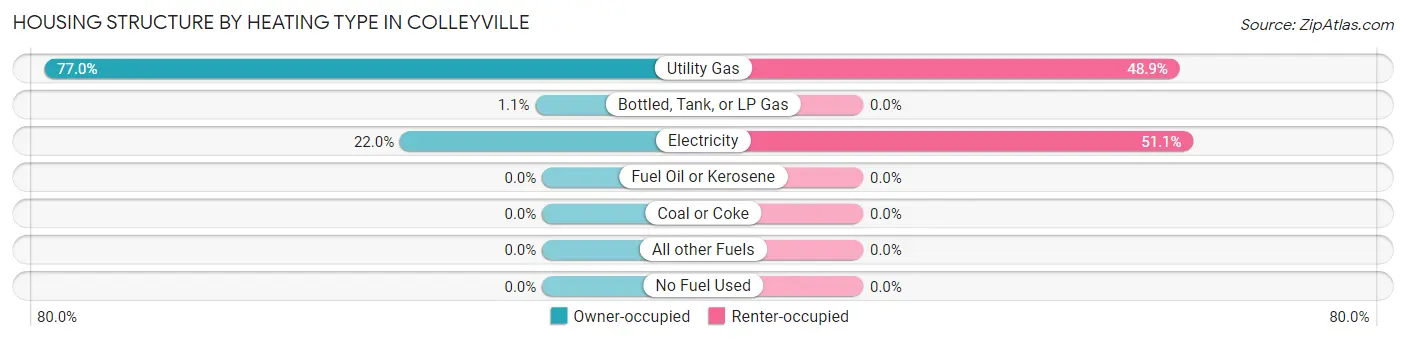
| Heating Type | Owner-occupied | Renter-occupied |
| Utility Gas | 6,836 (77.0%) | 185 (48.9%) |
| Bottled, Tank, or LP Gas | 93 (1.1%) | 0 (0.0%) |
| Electricity | 1,951 (22.0%) | 193 (51.1%) |
| Fuel Oil or Kerosene | 0 (0.0%) | 0 (0.0%) |
| Coal or Coke | 0 (0.0%) | 0 (0.0%) |
| All other Fuels | 0 (0.0%) | 0 (0.0%) |
| No Fuel Used | 0 (0.0%) | 0 (0.0%) |
| Total | 8,880 (100.0%) | 378 (100.0%) |
Household Vehicle Usage in Colleyville
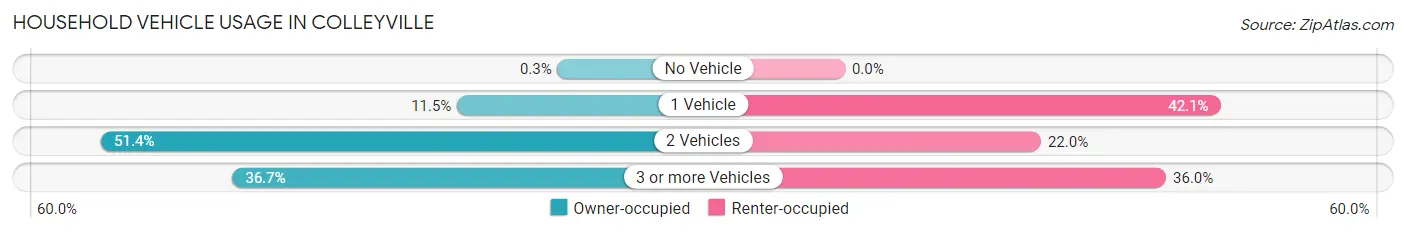
| Vehicles per Household | Owner-occupied | Renter-occupied |
| No Vehicle | 27 (0.3%) | 0 (0.0%) |
| 1 Vehicle | 1,025 (11.5%) | 159 (42.1%) |
| 2 Vehicles | 4,566 (51.4%) | 83 (22.0%) |
| 3 or more Vehicles | 3,262 (36.7%) | 136 (36.0%) |
| Total | 8,880 (100.0%) | 378 (100.0%) |
Real Estate & Mortgages in Colleyville
Real Estate and Mortgage Overview in Colleyville
| Characteristic | Without Mortgage | With Mortgage |
| Housing Units | 3,064 | 5,816 |
| Median Property Value | $665,200 | $678,500 |
| Median Household Income | $149,858 | $4,072 |
| Monthly Housing Costs | $1,501 | $4,411 |
| Real Estate Taxes | $10,001 | $30 |
Property Value by Mortgage Status in Colleyville
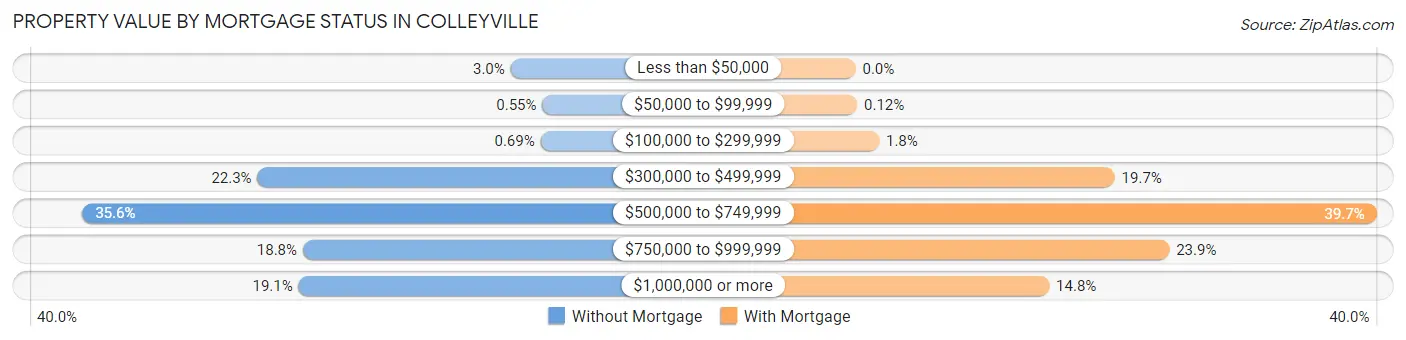
| Property Value | Without Mortgage | With Mortgage |
| Less than $50,000 | 91 (3.0%) | 0 (0.0%) |
| $50,000 to $99,999 | 17 (0.5%) | 7 (0.1%) |
| $100,000 to $299,999 | 21 (0.7%) | 104 (1.8%) |
| $300,000 to $499,999 | 682 (22.3%) | 1,148 (19.7%) |
| $500,000 to $749,999 | 1,091 (35.6%) | 2,309 (39.7%) |
| $750,000 to $999,999 | 576 (18.8%) | 1,390 (23.9%) |
| $1,000,000 or more | 586 (19.1%) | 858 (14.7%) |
| Total | 3,064 (100.0%) | 5,816 (100.0%) |
Household Income by Mortgage Status in Colleyville
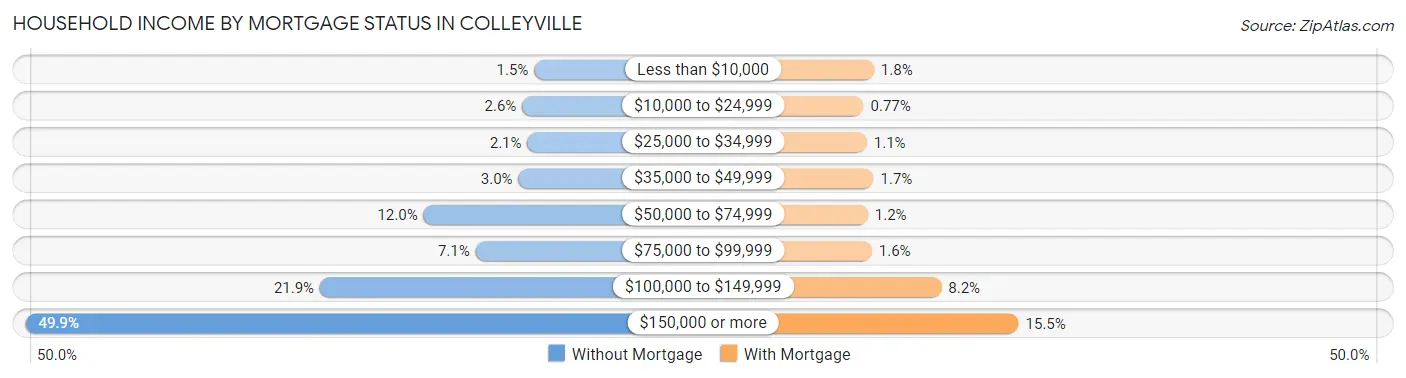
| Household Income | Without Mortgage | With Mortgage |
| Less than $10,000 | 45 (1.5%) | 102 (1.8%) |
| $10,000 to $24,999 | 80 (2.6%) | 45 (0.8%) |
| $25,000 to $34,999 | 65 (2.1%) | 63 (1.1%) |
| $35,000 to $49,999 | 91 (3.0%) | 100 (1.7%) |
| $50,000 to $74,999 | 368 (12.0%) | 68 (1.2%) |
| $75,000 to $99,999 | 216 (7.0%) | 90 (1.5%) |
| $100,000 to $149,999 | 670 (21.9%) | 475 (8.2%) |
| $150,000 or more | 1,529 (49.9%) | 903 (15.5%) |
| Total | 3,064 (100.0%) | 5,816 (100.0%) |
Property Value to Household Income Ratio in Colleyville
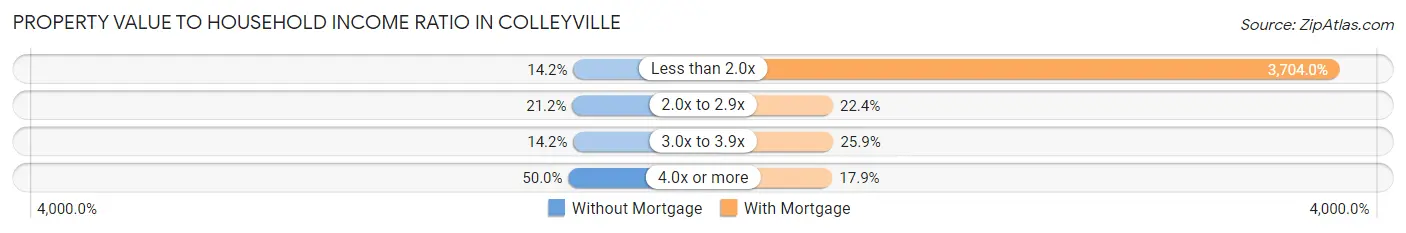
| Value-to-Income Ratio | Without Mortgage | With Mortgage |
| Less than 2.0x | 436 (14.2%) | 215,427 (3,704.0%) |
| 2.0x to 2.9x | 648 (21.1%) | 1,304 (22.4%) |
| 3.0x to 3.9x | 434 (14.2%) | 1,506 (25.9%) |
| 4.0x or more | 1,531 (50.0%) | 1,043 (17.9%) |
| Total | 3,064 (100.0%) | 5,816 (100.0%) |
Real Estate Taxes by Mortgage Status in Colleyville
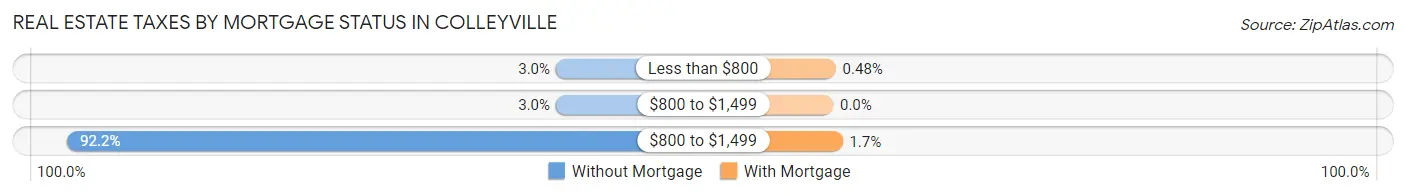
| Property Taxes | Without Mortgage | With Mortgage |
| Less than $800 | 91 (3.0%) | 28 (0.5%) |
| $800 to $1,499 | 91 (3.0%) | 0 (0.0%) |
| $800 to $1,499 | 2,826 (92.2%) | 100 (1.7%) |
| Total | 3,064 (100.0%) | 5,816 (100.0%) |
Health & Disability in Colleyville
Health Insurance Coverage by Age in Colleyville
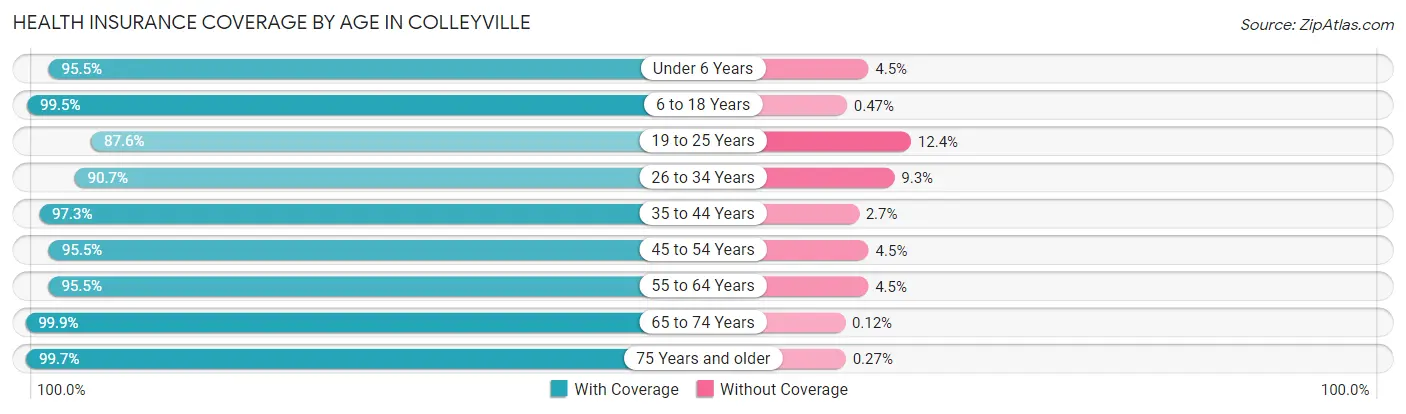
| Age Bracket | With Coverage | Without Coverage |
| Under 6 Years | 1,277 (95.5%) | 60 (4.5%) |
| 6 to 18 Years | 5,040 (99.5%) | 24 (0.5%) |
| 19 to 25 Years | 966 (87.6%) | 137 (12.4%) |
| 26 to 34 Years | 1,186 (90.7%) | 122 (9.3%) |
| 35 to 44 Years | 2,754 (97.3%) | 76 (2.7%) |
| 45 to 54 Years | 4,396 (95.5%) | 209 (4.5%) |
| 55 to 64 Years | 4,482 (95.5%) | 209 (4.5%) |
| 65 to 74 Years | 3,464 (99.9%) | 4 (0.1%) |
| 75 Years and older | 1,451 (99.7%) | 4 (0.3%) |
| Total | 25,016 (96.7%) | 845 (3.3%) |
Health Insurance Coverage by Citizenship Status in Colleyville
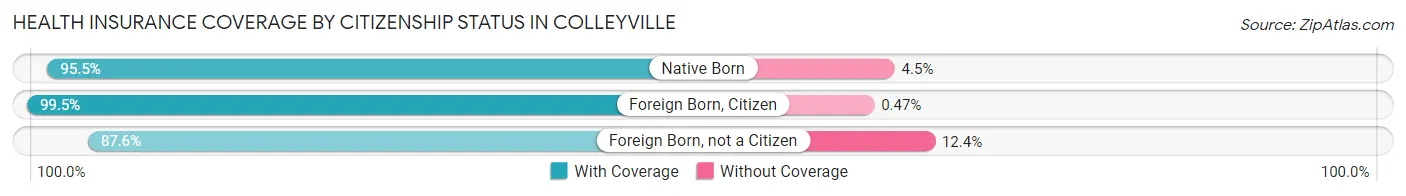
| Citizenship Status | With Coverage | Without Coverage |
| Native Born | 1,277 (95.5%) | 60 (4.5%) |
| Foreign Born, Citizen | 5,040 (99.5%) | 24 (0.5%) |
| Foreign Born, not a Citizen | 966 (87.6%) | 137 (12.4%) |
Health Insurance Coverage by Household Income in Colleyville
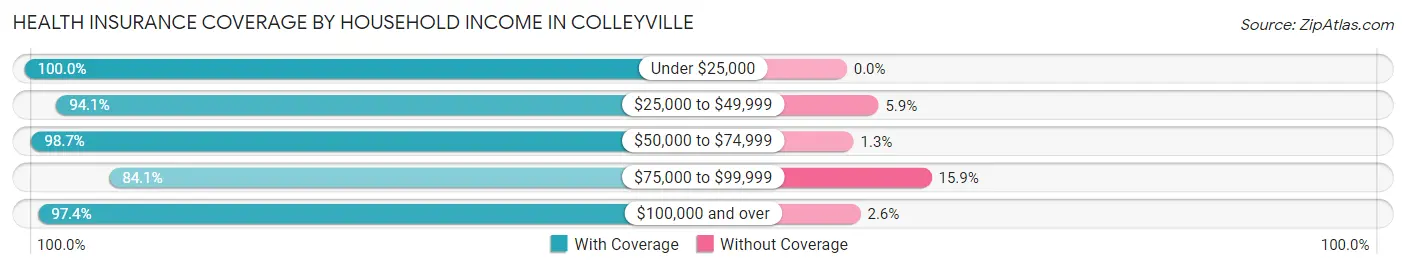
| Household Income | With Coverage | Without Coverage |
| Under $25,000 | 687 (100.0%) | 0 (0.0%) |
| $25,000 to $49,999 | 681 (94.1%) | 43 (5.9%) |
| $50,000 to $74,999 | 849 (98.7%) | 11 (1.3%) |
| $75,000 to $99,999 | 1,171 (84.1%) | 221 (15.9%) |
| $100,000 and over | 21,627 (97.4%) | 570 (2.6%) |
Public vs Private Health Insurance Coverage by Age in Colleyville
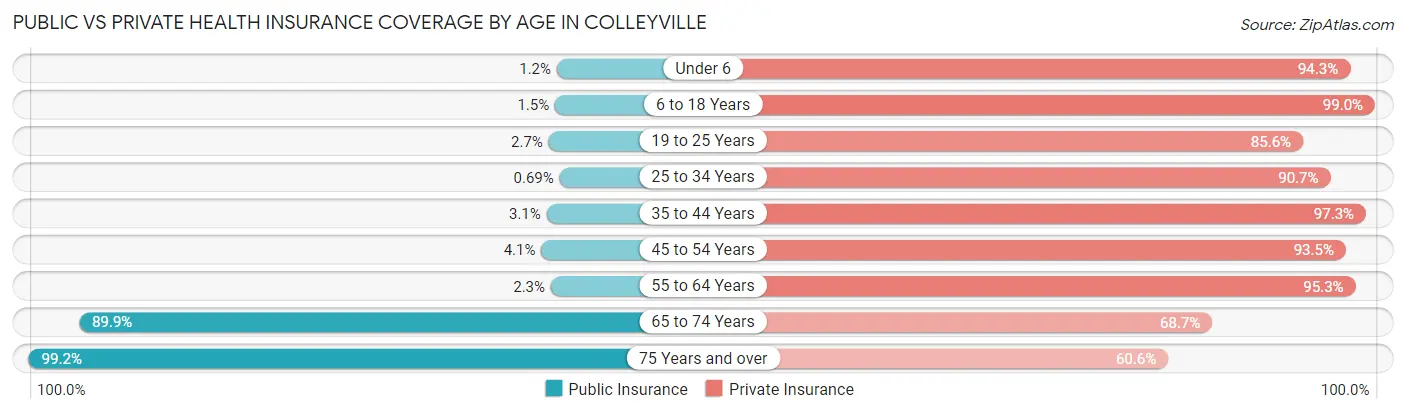
| Age Bracket | Public Insurance | Private Insurance |
| Under 6 | 16 (1.2%) | 1,261 (94.3%) |
| 6 to 18 Years | 78 (1.5%) | 5,011 (99.0%) |
| 19 to 25 Years | 30 (2.7%) | 944 (85.6%) |
| 25 to 34 Years | 9 (0.7%) | 1,186 (90.7%) |
| 35 to 44 Years | 88 (3.1%) | 2,753 (97.3%) |
| 45 to 54 Years | 189 (4.1%) | 4,307 (93.5%) |
| 55 to 64 Years | 109 (2.3%) | 4,472 (95.3%) |
| 65 to 74 Years | 3,118 (89.9%) | 2,384 (68.7%) |
| 75 Years and over | 1,444 (99.2%) | 881 (60.6%) |
| Total | 5,081 (19.7%) | 23,199 (89.7%) |
Disability Status by Sex by Age in Colleyville
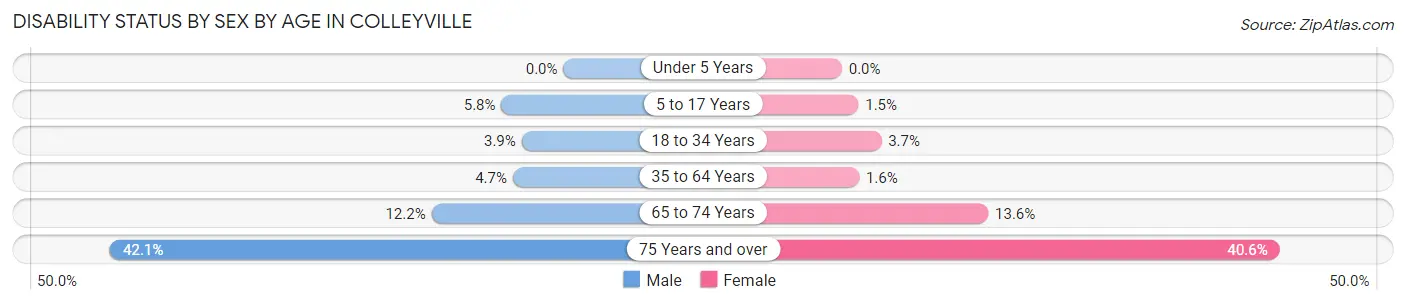
| Age Bracket | Male | Female |
| Under 5 Years | 0 (0.0%) | 0 (0.0%) |
| 5 to 17 Years | 182 (5.8%) | 28 (1.5%) |
| 18 to 34 Years | 64 (3.9%) | 41 (3.7%) |
| 35 to 64 Years | 268 (4.7%) | 102 (1.6%) |
| 65 to 74 Years | 237 (12.2%) | 208 (13.6%) |
| 75 Years and over | 289 (42.1%) | 312 (40.6%) |
Disability Class by Sex by Age in Colleyville
Disability Class: Hearing Difficulty
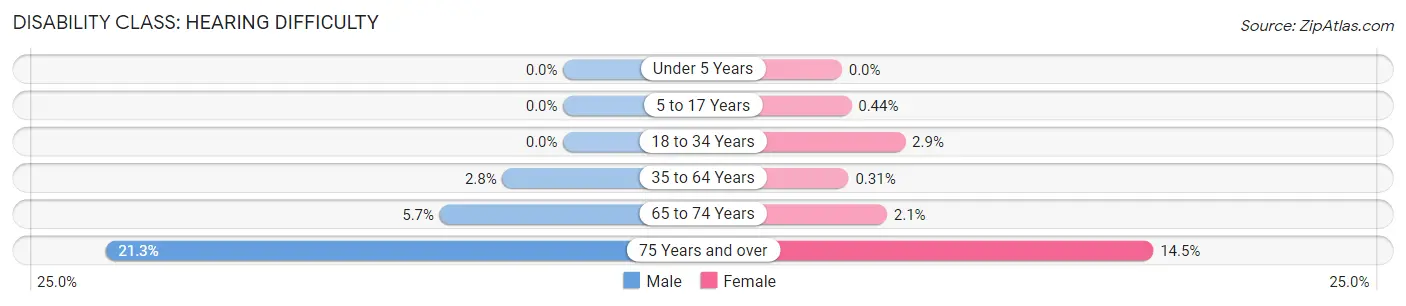
| Age Bracket | Male | Female |
| Under 5 Years | 0 (0.0%) | 0 (0.0%) |
| 5 to 17 Years | 0 (0.0%) | 8 (0.4%) |
| 18 to 34 Years | 0 (0.0%) | 33 (2.9%) |
| 35 to 64 Years | 161 (2.8%) | 20 (0.3%) |
| 65 to 74 Years | 111 (5.7%) | 32 (2.1%) |
| 75 Years and over | 146 (21.2%) | 111 (14.4%) |
Disability Class: Vision Difficulty
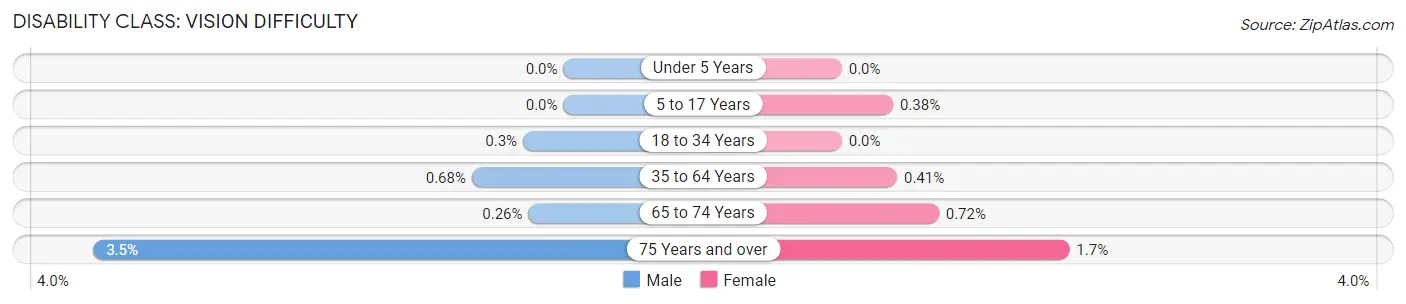
| Age Bracket | Male | Female |
| Under 5 Years | 0 (0.0%) | 0 (0.0%) |
| 5 to 17 Years | 0 (0.0%) | 7 (0.4%) |
| 18 to 34 Years | 5 (0.3%) | 0 (0.0%) |
| 35 to 64 Years | 39 (0.7%) | 26 (0.4%) |
| 65 to 74 Years | 5 (0.3%) | 11 (0.7%) |
| 75 Years and over | 24 (3.5%) | 13 (1.7%) |
Disability Class: Cognitive Difficulty
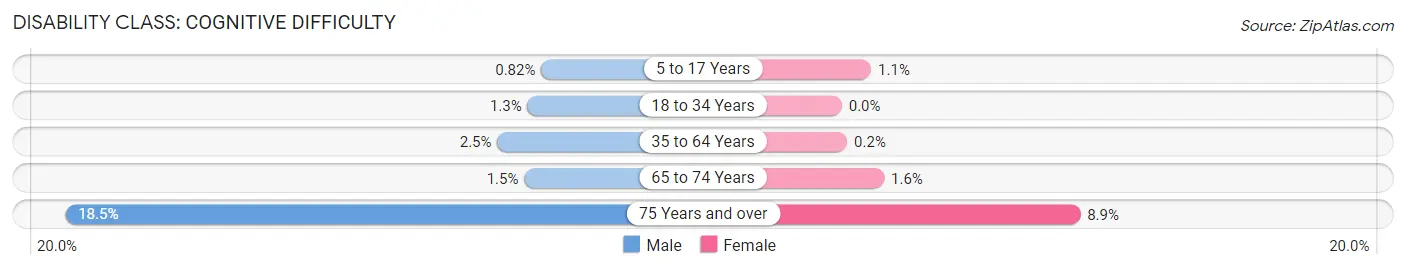
| Age Bracket | Male | Female |
| 5 to 17 Years | 26 (0.8%) | 20 (1.1%) |
| 18 to 34 Years | 22 (1.3%) | 0 (0.0%) |
| 35 to 64 Years | 140 (2.5%) | 13 (0.2%) |
| 65 to 74 Years | 28 (1.5%) | 24 (1.6%) |
| 75 Years and over | 127 (18.5%) | 68 (8.8%) |
Disability Class: Ambulatory Difficulty
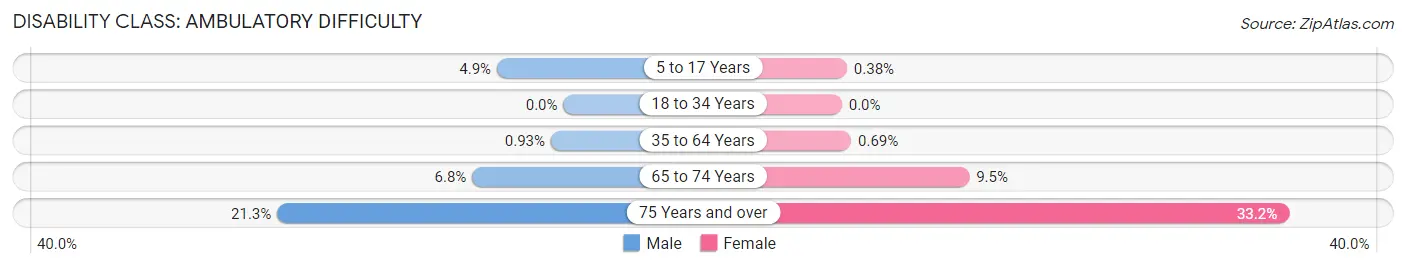
| Age Bracket | Male | Female |
| 5 to 17 Years | 156 (4.9%) | 7 (0.4%) |
| 18 to 34 Years | 0 (0.0%) | 0 (0.0%) |
| 35 to 64 Years | 53 (0.9%) | 44 (0.7%) |
| 65 to 74 Years | 131 (6.8%) | 145 (9.5%) |
| 75 Years and over | 146 (21.2%) | 255 (33.2%) |
Disability Class: Self-Care Difficulty
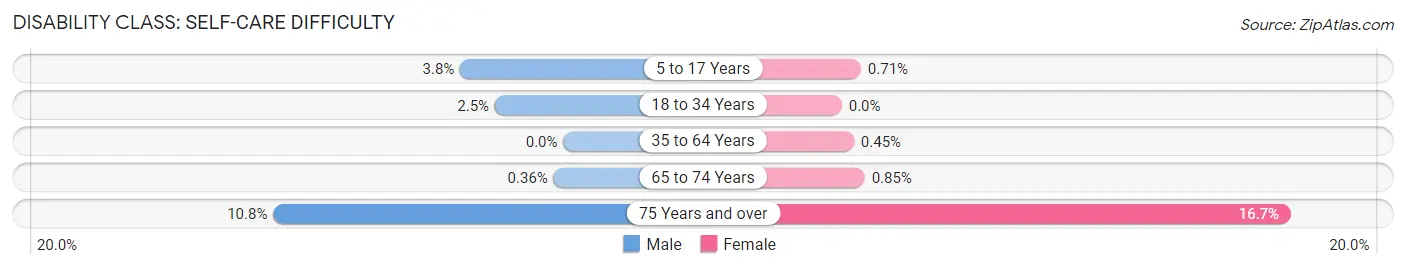
| Age Bracket | Male | Female |
| 5 to 17 Years | 121 (3.8%) | 13 (0.7%) |
| 18 to 34 Years | 42 (2.5%) | 0 (0.0%) |
| 35 to 64 Years | 0 (0.0%) | 29 (0.4%) |
| 65 to 74 Years | 7 (0.4%) | 13 (0.9%) |
| 75 Years and over | 74 (10.8%) | 128 (16.7%) |
Technology Access in Colleyville
Computing Device Access in Colleyville
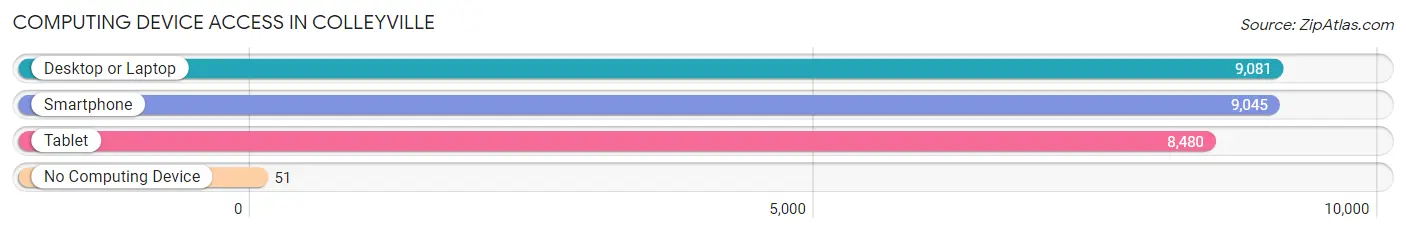
| Device Type | # Households | % Households |
| Desktop or Laptop | 9,081 | 98.1% |
| Smartphone | 9,045 | 97.7% |
| Tablet | 8,480 | 91.6% |
| No Computing Device | 51 | 0.5% |
| Total | 9,258 | 100.0% |
Internet Access in Colleyville
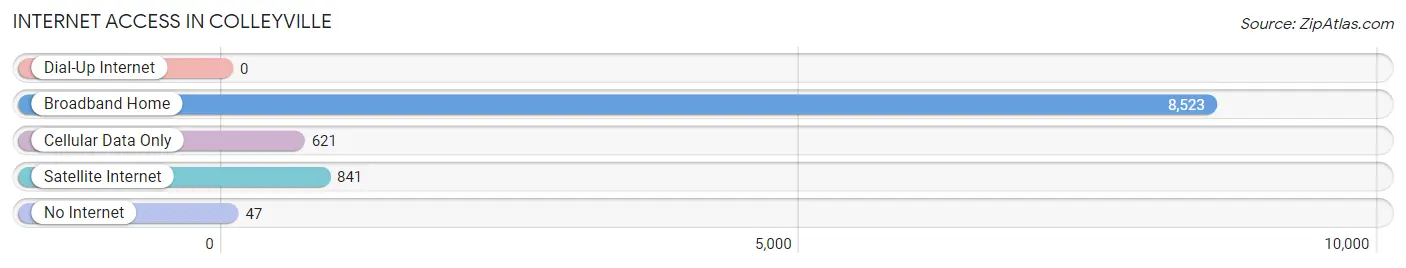
| Internet Type | # Households | % Households |
| Dial-Up Internet | 0 | 0.0% |
| Broadband Home | 8,523 | 92.1% |
| Cellular Data Only | 621 | 6.7% |
| Satellite Internet | 841 | 9.1% |
| No Internet | 47 | 0.5% |
| Total | 9,258 | 100.0% |
Colleyville Summary
Colleyville, Texas is a city located in Tarrant County, Texas, United States. The city is part of the Dallas-Fort Worth-Arlington metropolitan area and is located about 25 miles northeast of downtown Fort Worth and 20 miles northwest of downtown Dallas. The city had a population of 24,788 at the 2010 census, making it one of the most populous cities in the Dallas-Fort Worth metroplex.
History
Colleyville was founded in 1882 by Dr. Lilburn Colley, a physician from Tennessee. He purchased land in the area and built a home, which he named Colleyville. The town was originally known as Bransford, but the name was changed to Colleyville in 1892. The town was incorporated in 1956 and has since grown to become one of the most affluent cities in the Dallas-Fort Worth metroplex.
Geography
Colleyville is located at 32°54'25" North, 97°10'17" West (32.906944, -97.171444). According to the United States Census Bureau, the city has a total area of 16.2 square miles, of which 16.1 square miles is land and 0.1 square miles is water.
Economy
Colleyville is a prosperous city with a strong economy. The city is home to a variety of businesses, including retail stores, restaurants, and professional services. The city is also home to several corporate headquarters, including the headquarters of the Dr Pepper Snapple Group, the world’s largest independent bottler of carbonated soft drinks.
Demographics
As of the 2010 census, there were 24,788 people, 8,845 households, and 6,945 families residing in the city. The population density was 1,531.2 people per square mile. The racial makeup of the city was 87.2% White, 4.2% African American, 0.3% Native American, 4.3% Asian, 0.1% Pacific Islander, 1.7% from other races, and 2.3% from two or more races. Hispanic or Latino of any race were 8.2% of the population.
The median income for a household in the city was $117,845, and the median income for a family was $133,945. The per capita income for the city was $50,945. About 2.2% of families and 3.2% of the population were below the poverty line, including 3.7% of those under age 18 and 3.2% of those age 65 or over.
Colleyville is a prosperous city with a strong economy and a diverse population. The city is home to a variety of businesses, corporate headquarters, and a variety of people from all walks of life. The city is a great place to live, work, and play, and is sure to continue to grow and prosper in the years to come.
Common Questions
What is the Total Population of Colleyville?
Total Population of Colleyville is 25,876.
What is the Total Male Population of Colleyville?
Total Male Population of Colleyville is 13,722.
What is the Total Female Population of Colleyville?
Total Female Population of Colleyville is 12,154.
What is the Ratio of Males per 100 Females in Colleyville?
There are 112.90 Males per 100 Females in Colleyville.
What is the Ratio of Females per 100 Males in Colleyville?
There are 88.57 Females per 100 Males in Colleyville.
What is the Median Population Age in Colleyville?
Median Population Age in Colleyville is 47.3 Years.
What is the Average Family Size in Colleyville
Average Family Size in Colleyville is 3.0 People.
What is the Average Household Size in Colleyville
Average Household Size in Colleyville is 2.8 People.
What is Per Capita Income in Colleyville?
Per Capita income in Colleyville is $92,557.
What is the Median Family Income in Colleyville?
Median Family Income in Colleyville is $215,158.
What is the Median Household income in Colleyville?
Median Household Income in Colleyville is $196,298.
What is Income or Wage Gap in Colleyville?
Income or Wage Gap in Colleyville is 49.6%.
Women in Colleyville earn 50.4 cents for every dollar earned by a man.
What is Family Income Deficit in Colleyville?
Family Income Deficit in Colleyville is $9,075.
Families that are below poverty line in Colleyville earn $9,075 less on average than the poverty threshold level.
What is Inequality or Gini Index in Colleyville?
Inequality or Gini Index in Colleyville is 0.43.
How Large is the Labor Force in Colleyville?
There are 13,135 People in the Labor Forcein in Colleyville.
What is the Percentage of People in the Labor Force in Colleyville?
63.9% of People are in the Labor Force in Colleyville.
What is the Unemployment Rate in Colleyville?
Unemployment Rate in Colleyville is 3.7%.