Surfside Beach, TX
Surfside Beach Map
Surfside Beach Overview
617
TOTAL POPULATION
328
MALE POPULATION
289
FEMALE POPULATION
113.49
MALES / 100 FEMALES
88.11
FEMALES / 100 MALES
62.1
MEDIAN AGE
2.3
AVG FAMILY SIZE
1.8
AVG HOUSEHOLD SIZE
$50,717
PER CAPITA INCOME
$102,708
AVG FAMILY INCOME
$86,544
AVG HOUSEHOLD INCOME
68.5%
WAGE / INCOME GAP [ % ]
31.5¢/ $1
WAGE / INCOME GAP [ $ ]
0.39
INEQUALITY / GINI INDEX
304
LABOR FORCE [ PEOPLE ]
51.6%
PERCENT IN LABOR FORCE
5.9%
UNEMPLOYMENT RATE
Surfside Beach Area Codes
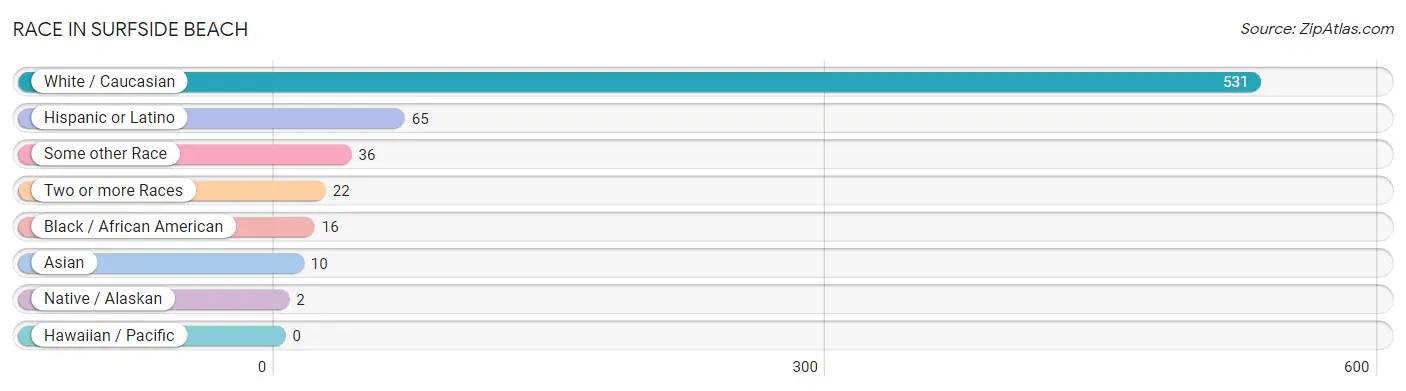
Race in Surfside Beach
The most populous races in Surfside Beach are White / Caucasian (531 | 86.1%), Hispanic or Latino (65 | 10.5%), and Some other Race (36 | 5.8%).
| Race | # Population | % Population |
| Asian | 10 | 1.6% |
| Black / African American | 16 | 2.6% |
| Hawaiian / Pacific | 0 | 0.0% |
| Hispanic or Latino | 65 | 10.5% |
| Native / Alaskan | 2 | 0.3% |
| White / Caucasian | 531 | 86.1% |
| Two or more Races | 22 | 3.6% |
| Some other Race | 36 | 5.8% |
| Total | 617 | 100.0% |
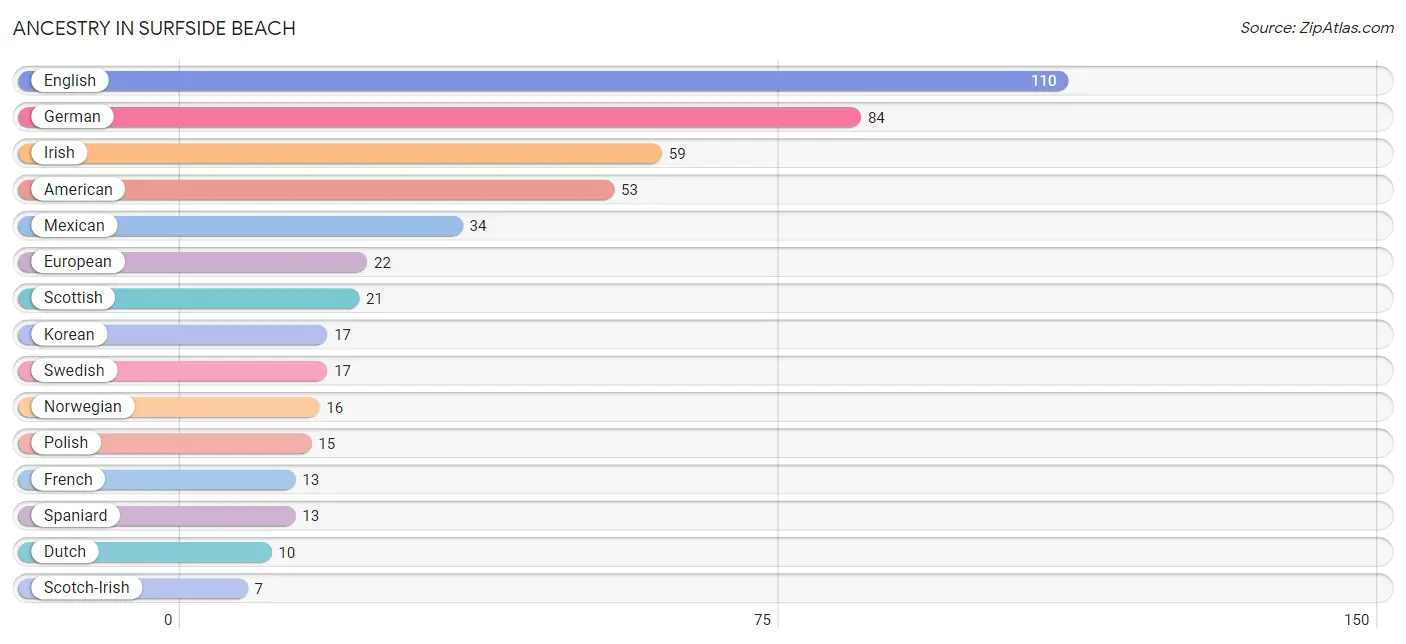
Ancestry in Surfside Beach
The most populous ancestries reported in Surfside Beach are English (110 | 17.8%), German (84 | 13.6%), Irish (59 | 9.6%), American (53 | 8.6%), and Mexican (34 | 5.5%), together accounting for 55.1% of all Surfside Beach residents.
| Ancestry | # Population | % Population |
| American | 53 | 8.6% |
| Arab | 4 | 0.6% |
| British | 5 | 0.8% |
| Celtic | 6 | 1.0% |
| Choctaw | 3 | 0.5% |
| Czech | 6 | 1.0% |
| Dutch | 10 | 1.6% |
| English | 110 | 17.8% |
| European | 22 | 3.6% |
| French | 13 | 2.1% |
| German | 84 | 13.6% |
| Irish | 59 | 9.6% |
| Italian | 6 | 1.0% |
| Korean | 17 | 2.8% |
| Lebanese | 4 | 0.6% |
| Mexican | 34 | 5.5% |
| Northern European | 2 | 0.3% |
| Norwegian | 16 | 2.6% |
| Polish | 15 | 2.4% |
| Potawatomi | 4 | 0.6% |
| Russian | 3 | 0.5% |
| Scotch-Irish | 7 | 1.1% |
| Scottish | 21 | 3.4% |
| Slovak | 3 | 0.5% |
| Spaniard | 13 | 2.1% |
| Sri Lankan | 2 | 0.3% |
| Swedish | 17 | 2.8% |
| Ukrainian | 3 | 0.5% |
| Welsh | 2 | 0.3% | View All 29 Rows |
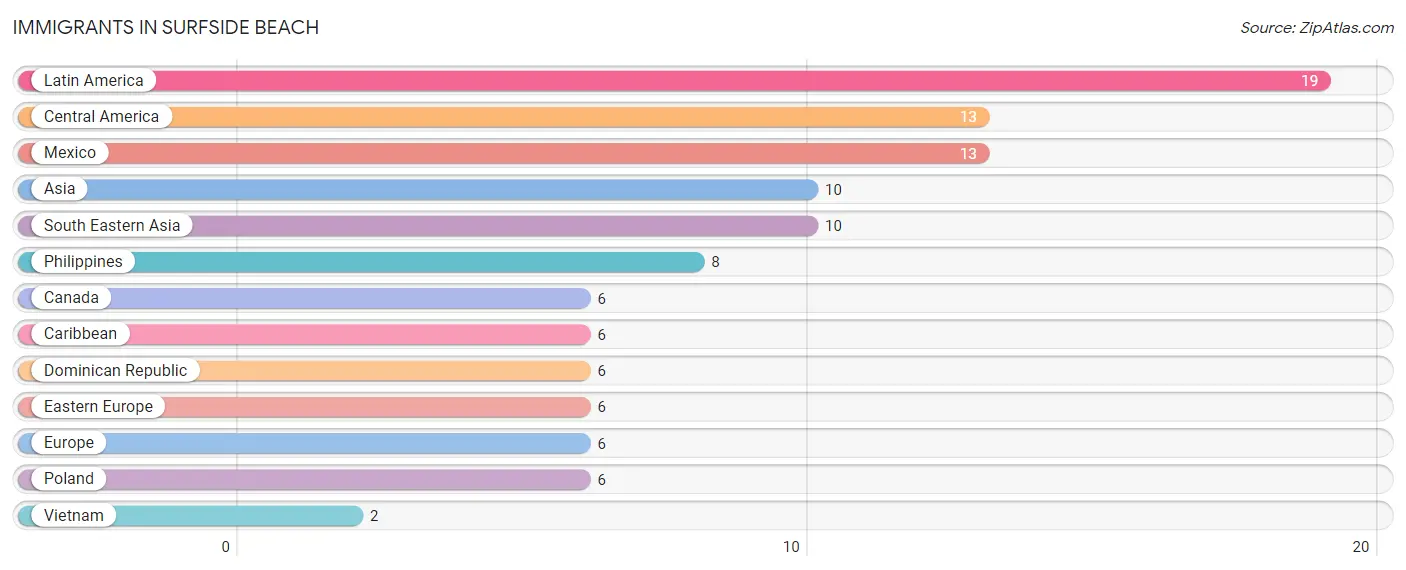
Immigrants in Surfside Beach
The most numerous immigrant groups reported in Surfside Beach came from Latin America (19 | 3.1%), Central America (13 | 2.1%), Mexico (13 | 2.1%), Asia (10 | 1.6%), and South Eastern Asia (10 | 1.6%), together accounting for 10.5% of all Surfside Beach residents.
| Immigration Origin | # Population | % Population |
| Asia | 10 | 1.6% |
| Canada | 6 | 1.0% |
| Caribbean | 6 | 1.0% |
| Central America | 13 | 2.1% |
| Dominican Republic | 6 | 1.0% |
| Eastern Europe | 6 | 1.0% |
| Europe | 6 | 1.0% |
| Latin America | 19 | 3.1% |
| Mexico | 13 | 2.1% |
| Philippines | 8 | 1.3% |
| Poland | 6 | 1.0% |
| South Eastern Asia | 10 | 1.6% |
| Vietnam | 2 | 0.3% | View All 13 Rows |
Sex and Age in Surfside Beach
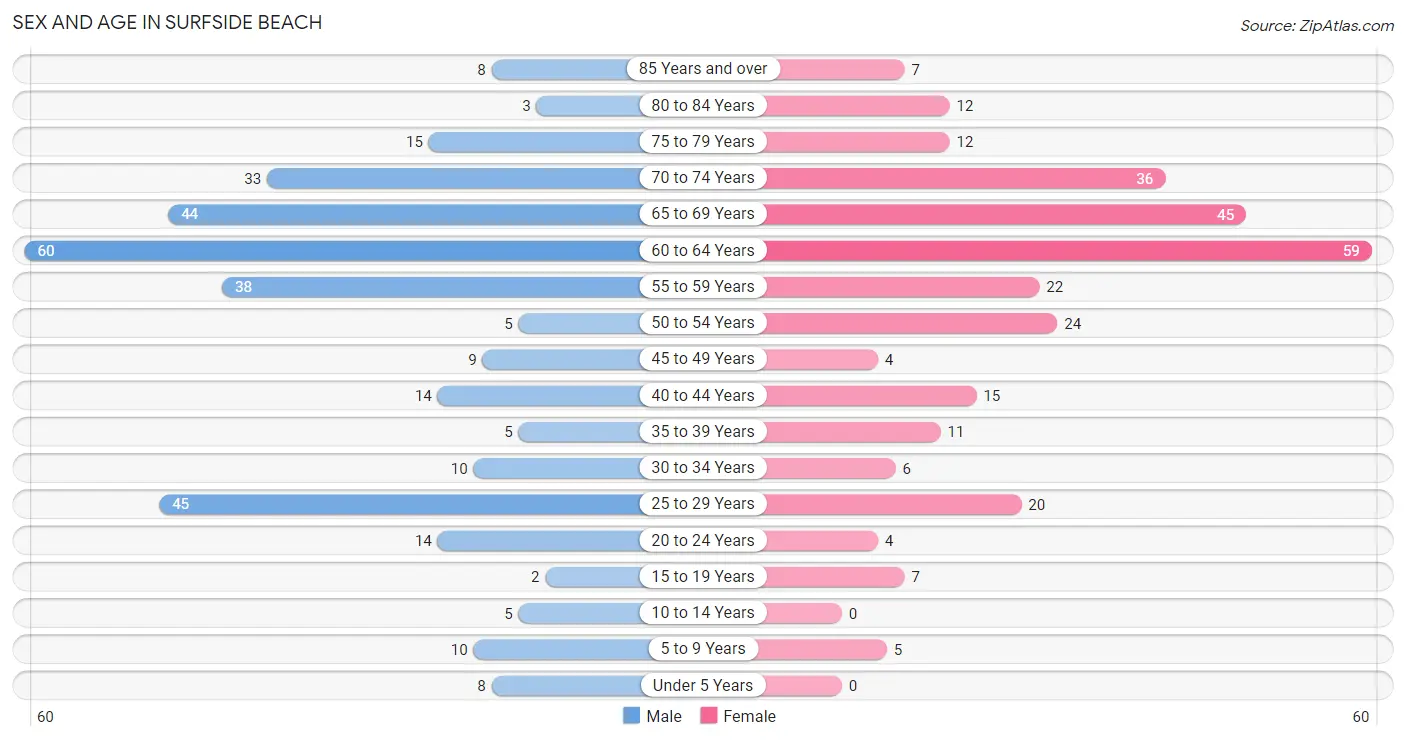
Sex and Age in Surfside Beach
The most populous age groups in Surfside Beach are 60 to 64 Years (60 | 18.3%) for men and 60 to 64 Years (59 | 20.4%) for women.
| Age Bracket | Male | Female |
| Under 5 Years | 8 (2.4%) | 0 (0.0%) |
| 5 to 9 Years | 10 (3.0%) | 5 (1.7%) |
| 10 to 14 Years | 5 (1.5%) | 0 (0.0%) |
| 15 to 19 Years | 2 (0.6%) | 7 (2.4%) |
| 20 to 24 Years | 14 (4.3%) | 4 (1.4%) |
| 25 to 29 Years | 45 (13.7%) | 20 (6.9%) |
| 30 to 34 Years | 10 (3.0%) | 6 (2.1%) |
| 35 to 39 Years | 5 (1.5%) | 11 (3.8%) |
| 40 to 44 Years | 14 (4.3%) | 15 (5.2%) |
| 45 to 49 Years | 9 (2.7%) | 4 (1.4%) |
| 50 to 54 Years | 5 (1.5%) | 24 (8.3%) |
| 55 to 59 Years | 38 (11.6%) | 22 (7.6%) |
| 60 to 64 Years | 60 (18.3%) | 59 (20.4%) |
| 65 to 69 Years | 44 (13.4%) | 45 (15.6%) |
| 70 to 74 Years | 33 (10.1%) | 36 (12.5%) |
| 75 to 79 Years | 15 (4.6%) | 12 (4.2%) |
| 80 to 84 Years | 3 (0.9%) | 12 (4.2%) |
| 85 Years and over | 8 (2.4%) | 7 (2.4%) |
| Total | 328 (100.0%) | 289 (100.0%) |
Families and Households in Surfside Beach
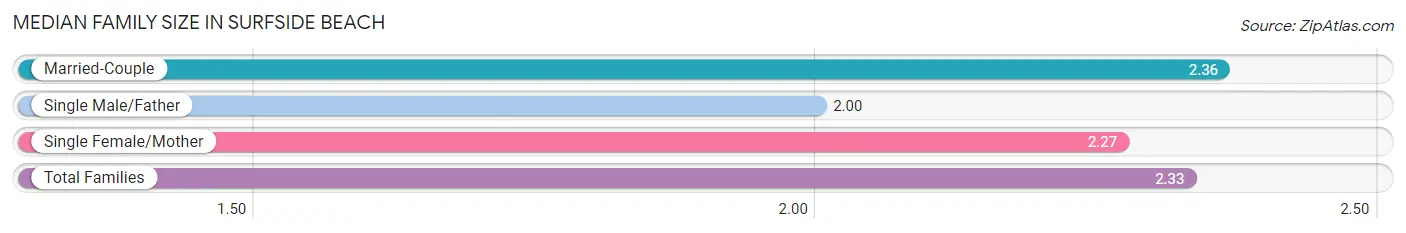
Median Family Size in Surfside Beach
The median family size in Surfside Beach is 2.33 persons per family, with married-couple families (145 | 86.3%) accounting for the largest median family size of 2.36 persons per family. On the other hand, single male/father families (8 | 4.8%) represent the smallest median family size with 2.00 persons per family.
| Family Type | # Families | Family Size |
| Married-Couple | 145 (86.3%) | 2.36 |
| Single Male/Father | 8 (4.8%) | 2.00 |
| Single Female/Mother | 15 (8.9%) | 2.27 |
| Total Families | 168 (100.0%) | 2.33 |
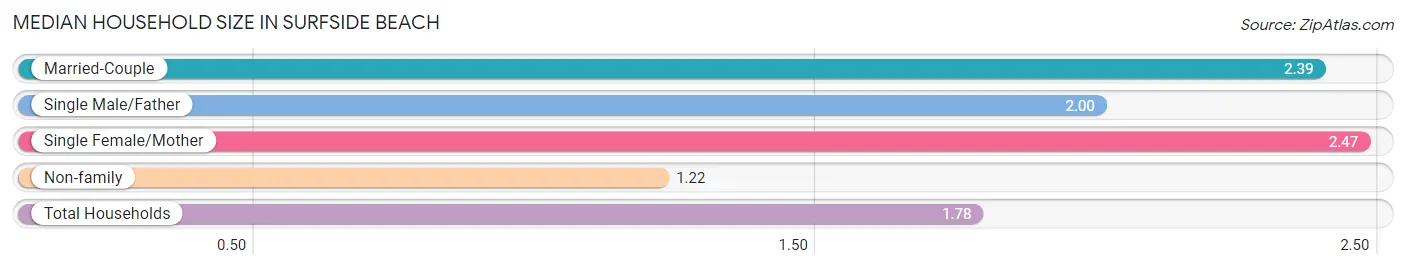
Median Household Size in Surfside Beach
The median household size in Surfside Beach is 1.78 persons per household, with single female/mother households (15 | 4.3%) accounting for the largest median household size of 2.47 persons per household. non-family households (179 | 51.6%) represent the smallest median household size with 1.22 persons per household.
| Household Type | # Households | Household Size |
| Married-Couple | 145 (41.8%) | 2.39 |
| Single Male/Father | 8 (2.3%) | 2.00 |
| Single Female/Mother | 15 (4.3%) | 2.47 |
| Non-family | 179 (51.6%) | 1.22 |
| Total Households | 347 (100.0%) | 1.78 |
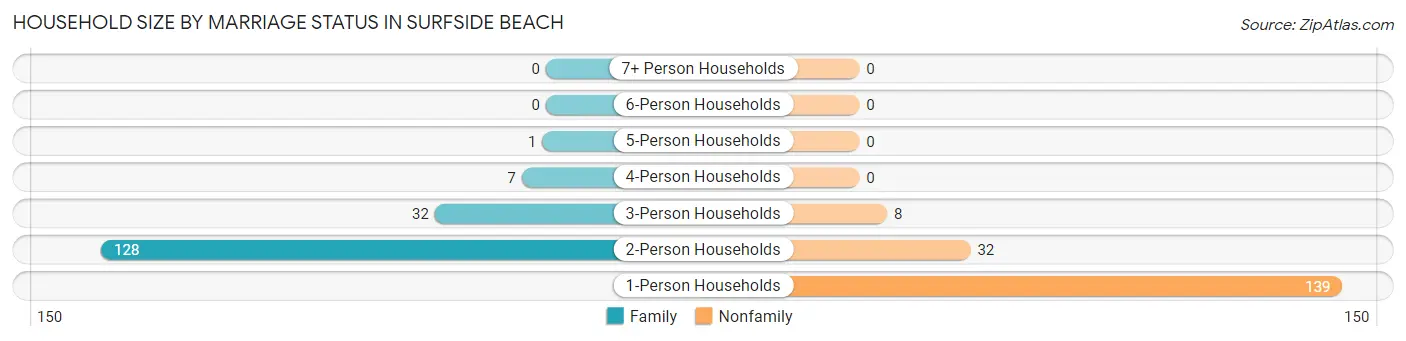
Household Size by Marriage Status in Surfside Beach
Out of a total of 347 households in Surfside Beach, 168 (48.4%) are family households, while 179 (51.6%) are nonfamily households. The most numerous type of family households are 2-person households, comprising 128, and the most common type of nonfamily households are 1-person households, comprising 139.
| Household Size | Family Households | Nonfamily Households |
| 1-Person Households | - | 139 (40.1%) |
| 2-Person Households | 128 (36.9%) | 32 (9.2%) |
| 3-Person Households | 32 (9.2%) | 8 (2.3%) |
| 4-Person Households | 7 (2.0%) | 0 (0.0%) |
| 5-Person Households | 1 (0.3%) | 0 (0.0%) |
| 6-Person Households | 0 (0.0%) | 0 (0.0%) |
| 7+ Person Households | 0 (0.0%) | 0 (0.0%) |
| Total | 168 (48.4%) | 179 (51.6%) |
Female Fertility in Surfside Beach
Fertility by Age in Surfside Beach
Average fertility rate in Surfside Beach is 174.0 births per 1,000 women. Women in the age bracket of 35 to 50 years have the highest fertility rate with 250.0 births per 1,000 women. Women in the age bracket of 35 to 50 years acount for 66.7% of all women with births.
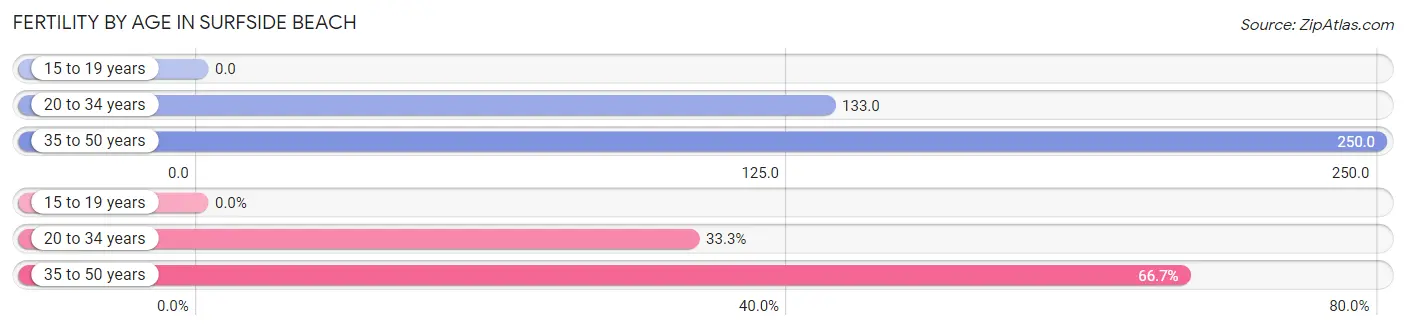
| Age Bracket | Women with Births | Births / 1,000 Women |
| 15 to 19 years | 0 (0.0%) | 0.0 |
| 20 to 34 years | 4 (33.3%) | 133.0 |
| 35 to 50 years | 8 (66.7%) | 250.0 |
| Total | 12 (100.0%) | 174.0 |
Fertility by Age by Marriage Status in Surfside Beach
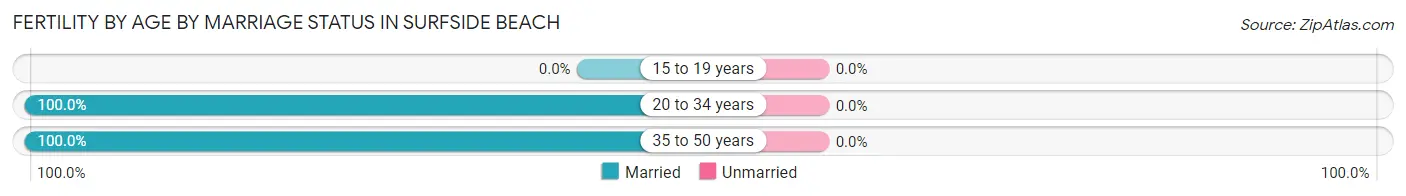
| Age Bracket | Married | Unmarried |
| 15 to 19 years | 0 (0.0%) | 0 (0.0%) |
| 20 to 34 years | 4 (100.0%) | 0 (0.0%) |
| 35 to 50 years | 8 (100.0%) | 0 (0.0%) |
| Total | 12 (100.0%) | 0 (0.0%) |
Fertility by Education in Surfside Beach
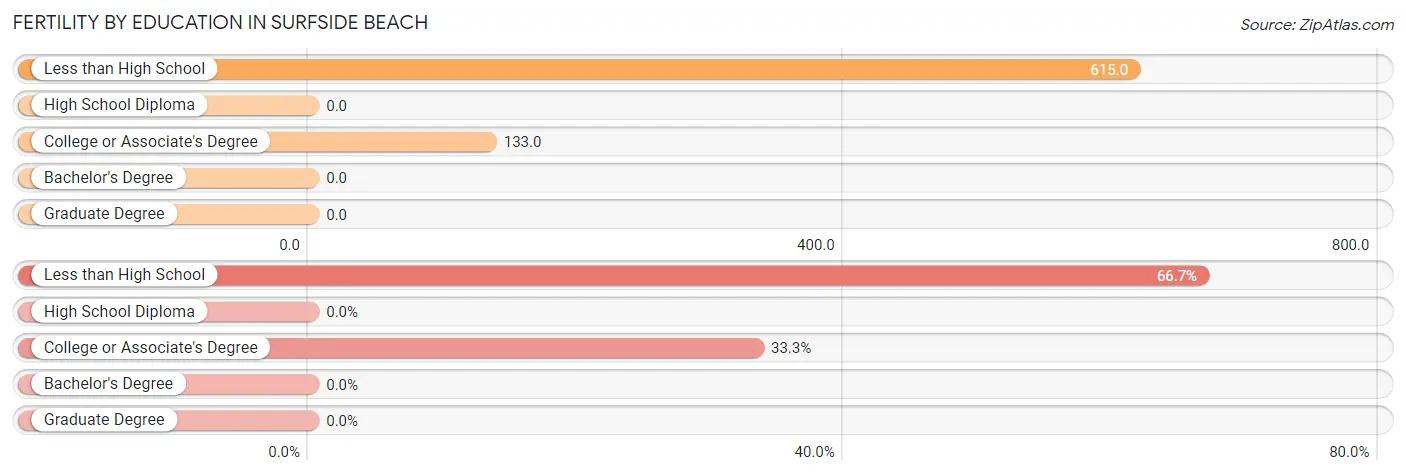
| Educational Attainment | Women with Births | Births / 1,000 Women |
| Less than High School | 8 (66.7%) | 615.0 |
| High School Diploma | 0 (0.0%) | 0.0 |
| College or Associate's Degree | 4 (33.3%) | 133.0 |
| Bachelor's Degree | 0 (0.0%) | 0.0 |
| Graduate Degree | 0 (0.0%) | 0.0 |
| Total | 12 (100.0%) | 174.0 |
Fertility by Education by Marriage Status in Surfside Beach
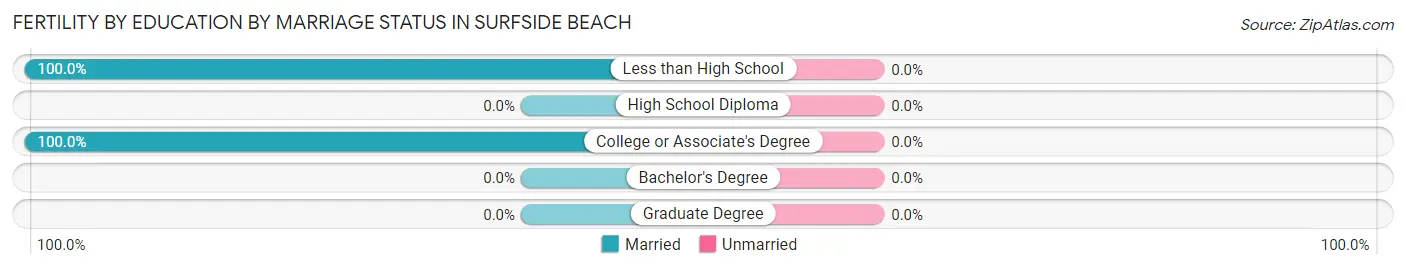
| Educational Attainment | Married | Unmarried |
| Less than High School | 8 (100.0%) | 0 (0.0%) |
| High School Diploma | 0 (0.0%) | 0 (0.0%) |
| College or Associate's Degree | 4 (100.0%) | 0 (0.0%) |
| Bachelor's Degree | 0 (0.0%) | 0 (0.0%) |
| Graduate Degree | 0 (0.0%) | 0 (0.0%) |
| Total | 12 (100.0%) | 0 (0.0%) |
Income in Surfside Beach
Income Overview in Surfside Beach
Per Capita Income in Surfside Beach is $50,717, while median incomes of families and households are $102,708 and $86,544 respectively.
| Characteristic | Number | Measure |
| Per Capita Income | 617 | $50,717 |
| Median Family Income | 168 | $102,708 |
| Mean Family Income | 168 | $116,493 |
| Median Household Income | 347 | $86,544 |
| Mean Household Income | 347 | $91,002 |
| Income Deficit | 168 | $0 |
| Wage / Income Gap (%) | 617 | 68.54% |
| Wage / Income Gap ($) | 617 | 31.46¢ per $1 |
| Gini / Inequality Index | 617 | 0.39 |
Earnings by Sex in Surfside Beach
Average Earnings in Surfside Beach are $42,813, $80,139 for men and $25,208 for women, a difference of 68.5%.
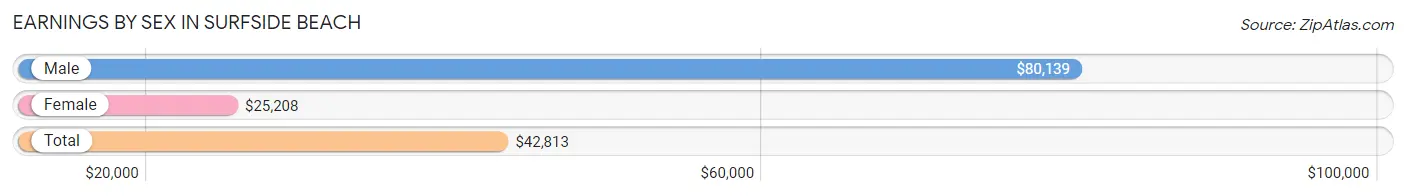
| Sex | Number | Average Earnings |
| Male | 217 (62.7%) | $80,139 |
| Female | 129 (37.3%) | $25,208 |
| Total | 346 (100.0%) | $42,813 |
Earnings by Sex by Income Bracket in Surfside Beach
The most common earnings brackets in Surfside Beach are $100,000+ for men (60 | 27.7%) and $2,499 or less for women (20 | 15.5%).
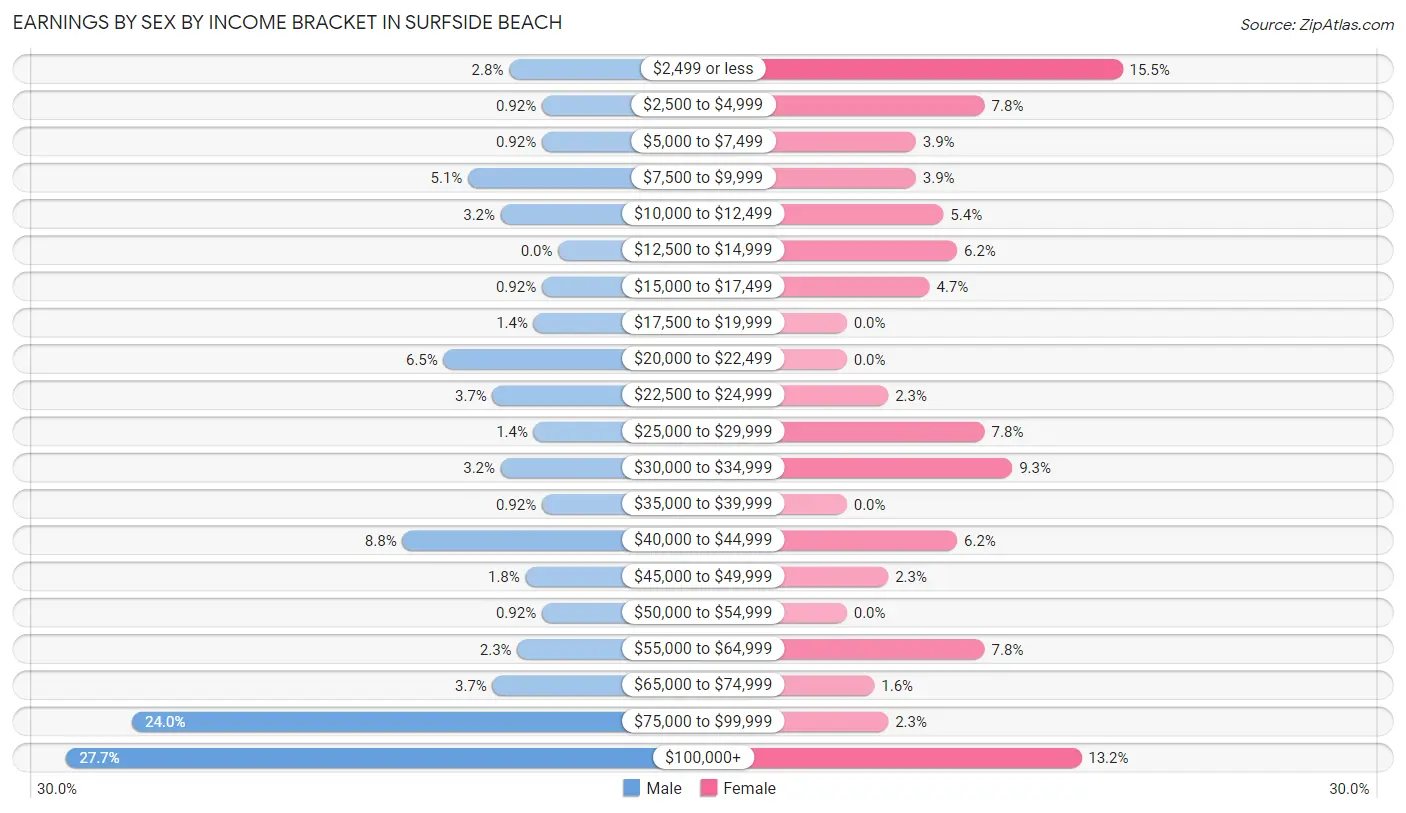
| Income | Male | Female |
| $2,499 or less | 6 (2.8%) | 20 (15.5%) |
| $2,500 to $4,999 | 2 (0.9%) | 10 (7.7%) |
| $5,000 to $7,499 | 2 (0.9%) | 5 (3.9%) |
| $7,500 to $9,999 | 11 (5.1%) | 5 (3.9%) |
| $10,000 to $12,499 | 7 (3.2%) | 7 (5.4%) |
| $12,500 to $14,999 | 0 (0.0%) | 8 (6.2%) |
| $15,000 to $17,499 | 2 (0.9%) | 6 (4.6%) |
| $17,500 to $19,999 | 3 (1.4%) | 0 (0.0%) |
| $20,000 to $22,499 | 14 (6.5%) | 0 (0.0%) |
| $22,500 to $24,999 | 8 (3.7%) | 3 (2.3%) |
| $25,000 to $29,999 | 3 (1.4%) | 10 (7.7%) |
| $30,000 to $34,999 | 7 (3.2%) | 12 (9.3%) |
| $35,000 to $39,999 | 2 (0.9%) | 0 (0.0%) |
| $40,000 to $44,999 | 19 (8.8%) | 8 (6.2%) |
| $45,000 to $49,999 | 4 (1.8%) | 3 (2.3%) |
| $50,000 to $54,999 | 2 (0.9%) | 0 (0.0%) |
| $55,000 to $64,999 | 5 (2.3%) | 10 (7.7%) |
| $65,000 to $74,999 | 8 (3.7%) | 2 (1.5%) |
| $75,000 to $99,999 | 52 (24.0%) | 3 (2.3%) |
| $100,000+ | 60 (27.7%) | 17 (13.2%) |
| Total | 217 (100.0%) | 129 (100.0%) |
Earnings by Sex by Educational Attainment in Surfside Beach
Average earnings in Surfside Beach are $82,361 for men and $25,417 for women, a difference of 69.1%. Men with an educational attainment of graduate degree enjoy the highest average annual earnings of $114,583, while those with less than high school education earn the least with $21,250. Women with an educational attainment of graduate degree earn the most with the average annual earnings of $42,083, while those with bachelor's degree education have the smallest earnings of $29,688.
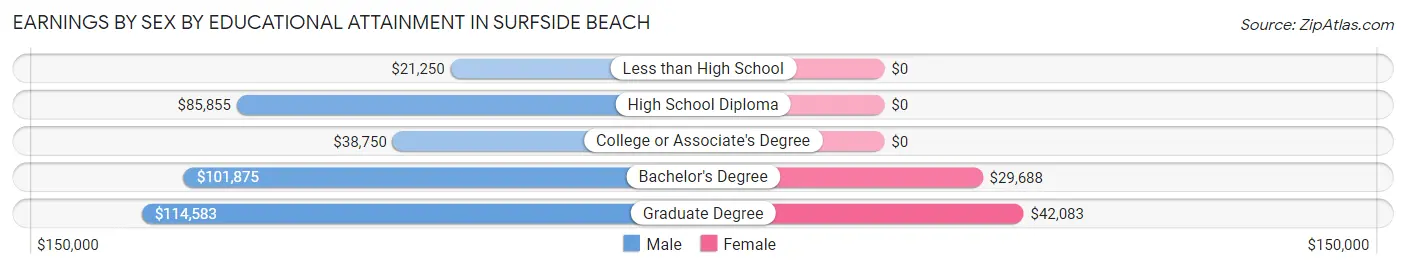
| Educational Attainment | Male Income | Female Income |
| Less than High School | $21,250 | $0 |
| High School Diploma | $85,855 | $0 |
| College or Associate's Degree | $38,750 | $0 |
| Bachelor's Degree | $101,875 | $29,688 |
| Graduate Degree | $114,583 | $42,083 |
| Total | $82,361 | $25,417 |
Family Income in Surfside Beach
Family Income Brackets in Surfside Beach
According to the Surfside Beach family income data, there are 54 families falling into the $100,000 to $149,999 income range, which is the most common income bracket and makes up 32.1% of all families.
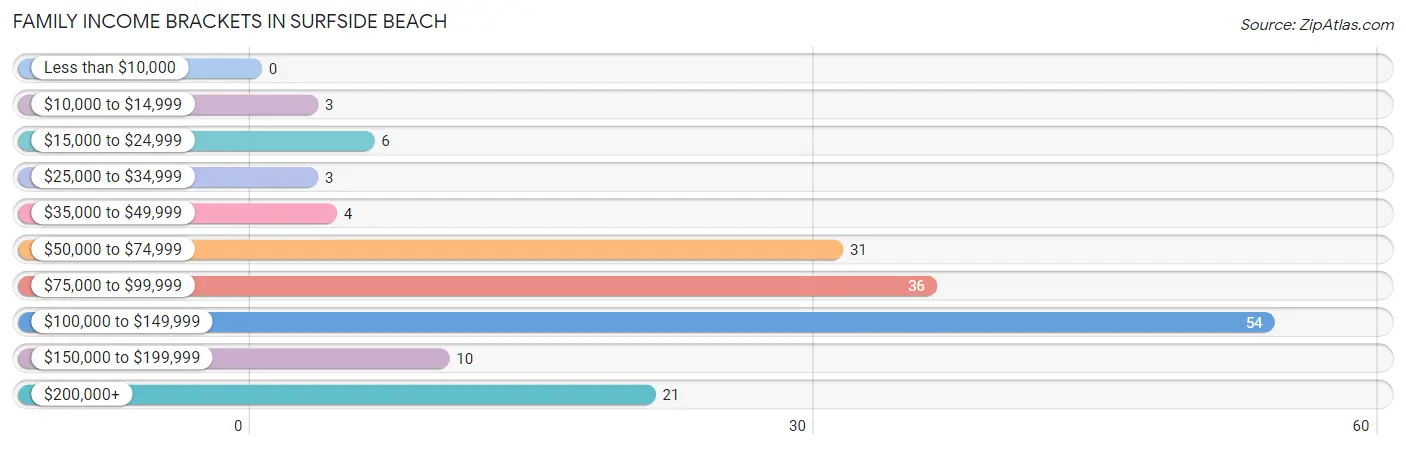
| Income Bracket | # Families | % Families |
| Less than $10,000 | 0 | 0.0% |
| $10,000 to $14,999 | 3 | 1.8% |
| $15,000 to $24,999 | 6 | 3.6% |
| $25,000 to $34,999 | 3 | 1.8% |
| $35,000 to $49,999 | 4 | 2.4% |
| $50,000 to $74,999 | 31 | 18.5% |
| $75,000 to $99,999 | 36 | 21.4% |
| $100,000 to $149,999 | 54 | 32.1% |
| $150,000 to $199,999 | 10 | 6.0% |
| $200,000+ | 21 | 12.5% |
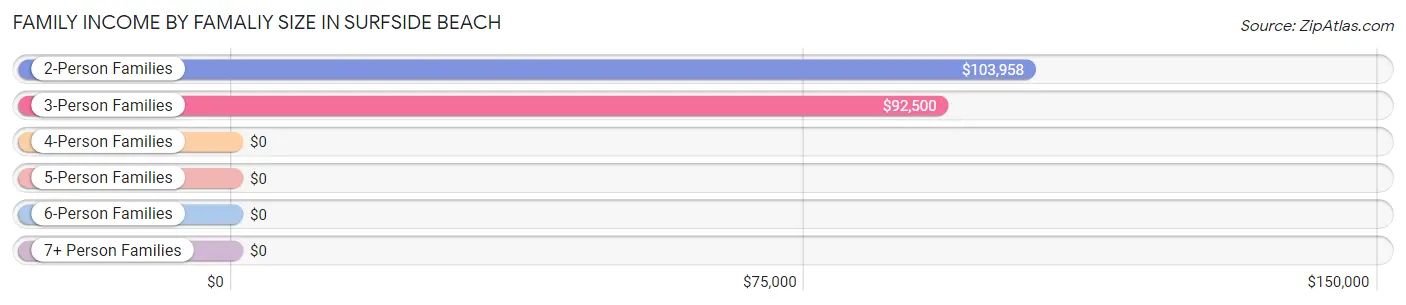
Family Income by Famaliy Size in Surfside Beach
2-person families (130 | 77.4%) account for the highest median family income in Surfside Beach with $103,958 per family, while 2-person families (130 | 77.4%) have the highest median income of $51,979 per family member.
| Income Bracket | # Families | Median Income |
| 2-Person Families | 130 (77.4%) | $103,958 |
| 3-Person Families | 32 (19.1%) | $92,500 |
| 4-Person Families | 6 (3.6%) | $0 |
| 5-Person Families | 0 (0.0%) | $0 |
| 6-Person Families | 0 (0.0%) | $0 |
| 7+ Person Families | 0 (0.0%) | $0 |
| Total | 168 (100.0%) | $102,708 |
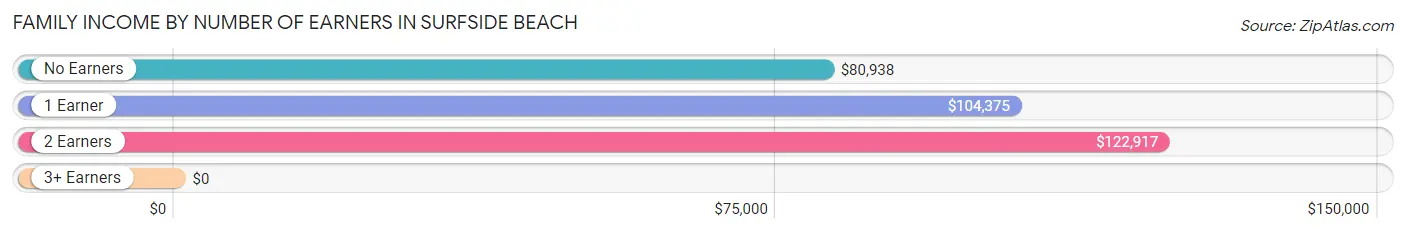
Family Income by Number of Earners in Surfside Beach
| Number of Earners | # Families | Median Income |
| No Earners | 55 (32.7%) | $80,938 |
| 1 Earner | 37 (22.0%) | $104,375 |
| 2 Earners | 70 (41.7%) | $122,917 |
| 3+ Earners | 6 (3.6%) | $0 |
| Total | 168 (100.0%) | $102,708 |
Household Income in Surfside Beach
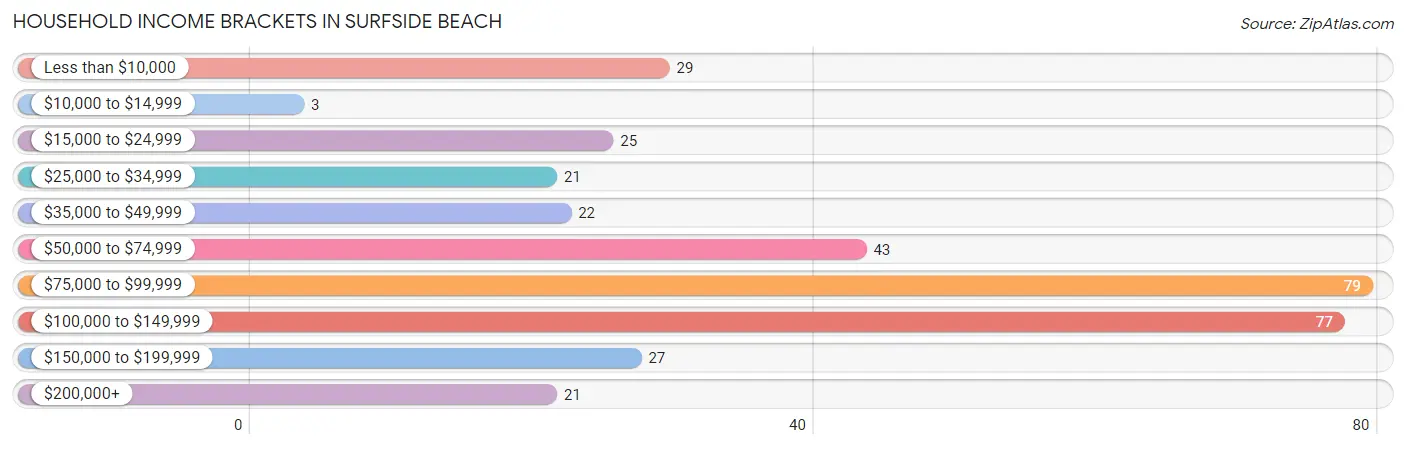
Household Income Brackets in Surfside Beach
With 79 households falling in the category, the $75,000 to $99,999 income range is the most frequent in Surfside Beach, accounting for 22.8% of all households. In contrast, only 3 households (0.9%) fall into the $10,000 to $14,999 income bracket, making it the least populous group.
| Income Bracket | # Households | % Households |
| Less than $10,000 | 29 | 8.4% |
| $10,000 to $14,999 | 3 | 0.9% |
| $15,000 to $24,999 | 25 | 7.2% |
| $25,000 to $34,999 | 21 | 6.1% |
| $35,000 to $49,999 | 22 | 6.3% |
| $50,000 to $74,999 | 43 | 12.4% |
| $75,000 to $99,999 | 79 | 22.8% |
| $100,000 to $149,999 | 77 | 22.2% |
| $150,000 to $199,999 | 27 | 7.8% |
| $200,000+ | 21 | 6.1% |
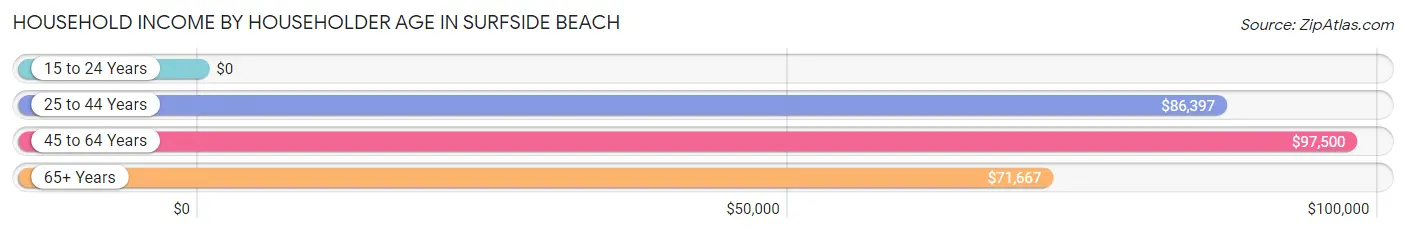
Household Income by Householder Age in Surfside Beach
The median household income in Surfside Beach is $86,544, with the highest median household income of $97,500 found in the 45 to 64 years age bracket for the primary householder. A total of 128 households (36.9%) fall into this category. Meanwhile, the 15 to 24 years age bracket for the primary householder has the lowest median household income of $0, with 4 households (1.1%) in this group.
| Income Bracket | # Households | Median Income |
| 15 to 24 Years | 4 (1.1%) | $0 |
| 25 to 44 Years | 67 (19.3%) | $86,397 |
| 45 to 64 Years | 128 (36.9%) | $97,500 |
| 65+ Years | 148 (42.6%) | $71,667 |
| Total | 347 (100.0%) | $86,544 |
Poverty in Surfside Beach
Income Below Poverty by Sex and Age in Surfside Beach
With 4.4% poverty level for males and 14.2% for females among the residents of Surfside Beach, 45 to 54 year old males and 35 to 44 year old females are the most vulnerable to poverty, with 3 males (21.4%) and 13 females (50.0%) in their respective age groups living below the poverty level.
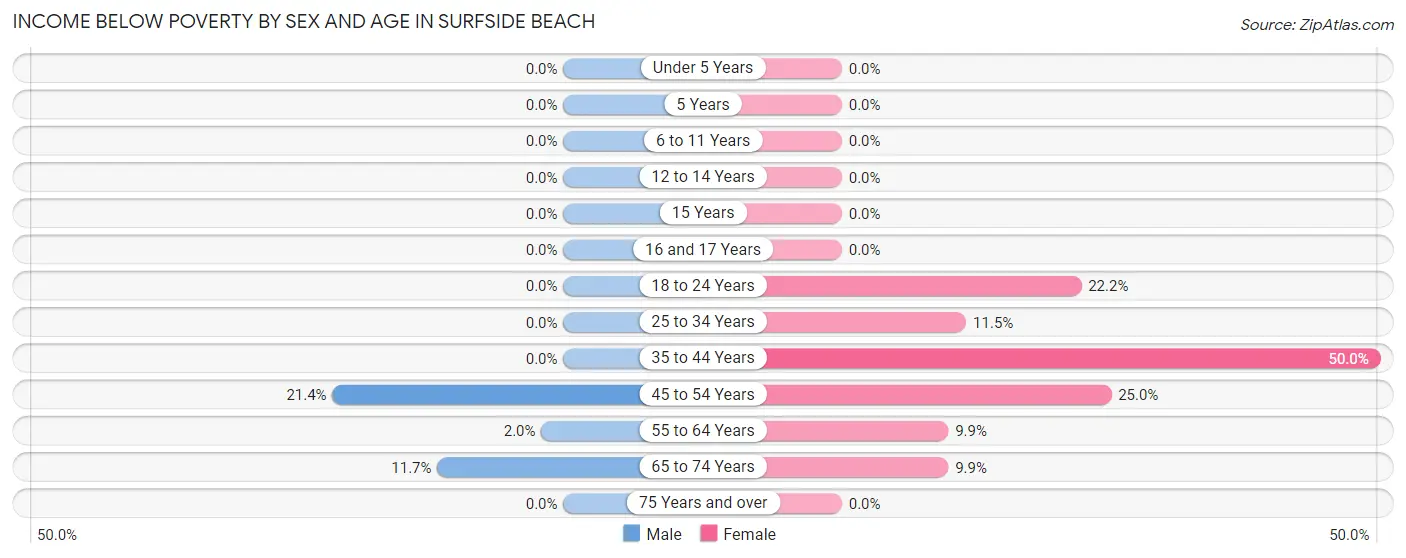
| Age Bracket | Male | Female |
| Under 5 Years | 0 (0.0%) | 0 (0.0%) |
| 5 Years | 0 (0.0%) | 0 (0.0%) |
| 6 to 11 Years | 0 (0.0%) | 0 (0.0%) |
| 12 to 14 Years | 0 (0.0%) | 0 (0.0%) |
| 15 Years | 0 (0.0%) | 0 (0.0%) |
| 16 and 17 Years | 0 (0.0%) | 0 (0.0%) |
| 18 to 24 Years | 0 (0.0%) | 2 (22.2%) |
| 25 to 34 Years | 0 (0.0%) | 3 (11.5%) |
| 35 to 44 Years | 0 (0.0%) | 13 (50.0%) |
| 45 to 54 Years | 3 (21.4%) | 7 (25.0%) |
| 55 to 64 Years | 2 (2.0%) | 8 (9.9%) |
| 65 to 74 Years | 9 (11.7%) | 8 (9.9%) |
| 75 Years and over | 0 (0.0%) | 0 (0.0%) |
| Total | 14 (4.4%) | 41 (14.2%) |
Income Above Poverty by Sex and Age in Surfside Beach
According to the poverty statistics in Surfside Beach, males aged under 5 years and females aged 6 to 11 years are the age groups that are most secure financially, with 100.0% of males and 100.0% of females in these age groups living above the poverty line.
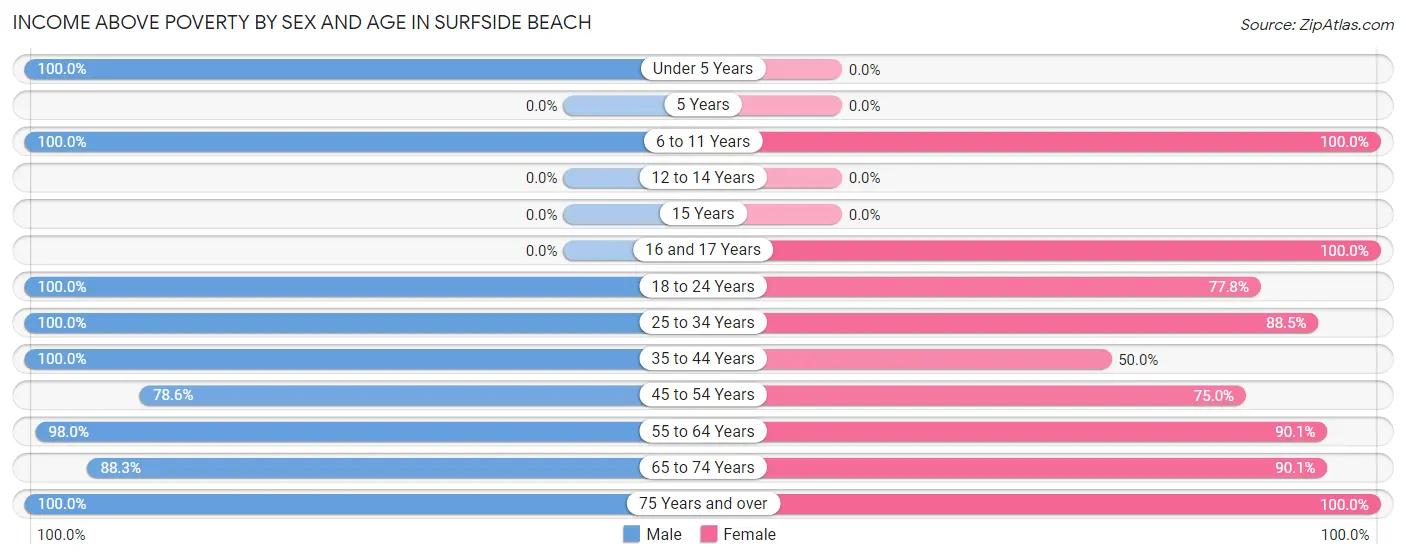
| Age Bracket | Male | Female |
| Under 5 Years | 8 (100.0%) | 0 (0.0%) |
| 5 Years | 0 (0.0%) | 0 (0.0%) |
| 6 to 11 Years | 8 (100.0%) | 5 (100.0%) |
| 12 to 14 Years | 0 (0.0%) | 0 (0.0%) |
| 15 Years | 0 (0.0%) | 0 (0.0%) |
| 16 and 17 Years | 0 (0.0%) | 2 (100.0%) |
| 18 to 24 Years | 16 (100.0%) | 7 (77.8%) |
| 25 to 34 Years | 55 (100.0%) | 23 (88.5%) |
| 35 to 44 Years | 19 (100.0%) | 13 (50.0%) |
| 45 to 54 Years | 11 (78.6%) | 21 (75.0%) |
| 55 to 64 Years | 96 (98.0%) | 73 (90.1%) |
| 65 to 74 Years | 68 (88.3%) | 73 (90.1%) |
| 75 Years and over | 26 (100.0%) | 31 (100.0%) |
| Total | 307 (95.6%) | 248 (85.8%) |
Income Below Poverty Among Married-Couple Families in Surfside Beach
The poverty statistics for married-couple families in Surfside Beach show that 2.1% or 3 of the total 145 families live below the poverty line. Families with no children have the highest poverty rate of 2.3%, comprising of 3 families. On the other hand, families with 1 or 2 children have the lowest poverty rate of 0.0%, which includes 0 families.
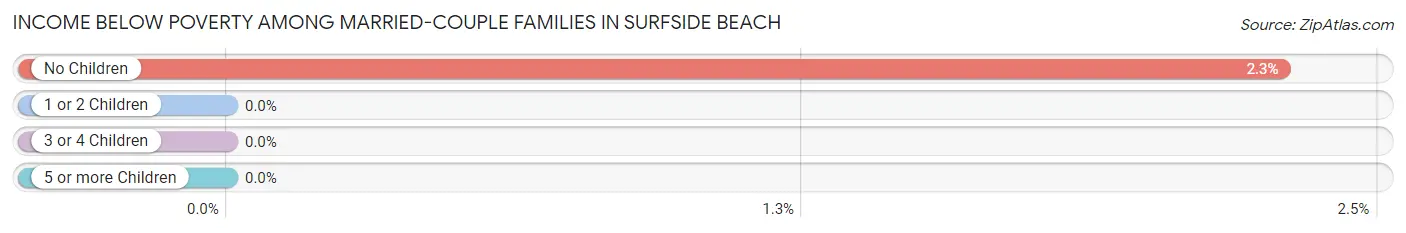
| Children | Above Poverty | Below Poverty |
| No Children | 128 (97.7%) | 3 (2.3%) |
| 1 or 2 Children | 14 (100.0%) | 0 (0.0%) |
| 3 or 4 Children | 0 (0.0%) | 0 (0.0%) |
| 5 or more Children | 0 (0.0%) | 0 (0.0%) |
| Total | 142 (97.9%) | 3 (2.1%) |
Income Below Poverty Among Single-Parent Households in Surfside Beach
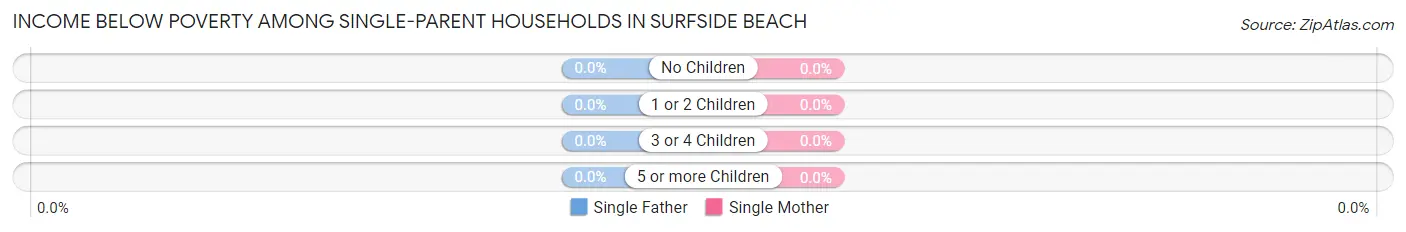
| Children | Single Father | Single Mother |
| No Children | 0 (0.0%) | 0 (0.0%) |
| 1 or 2 Children | 0 (0.0%) | 0 (0.0%) |
| 3 or 4 Children | 0 (0.0%) | 0 (0.0%) |
| 5 or more Children | 0 (0.0%) | 0 (0.0%) |
| Total | 0 (0.0%) | 0 (0.0%) |
Income Below Poverty Among Married-Couple vs Single-Parent Households in Surfside Beach
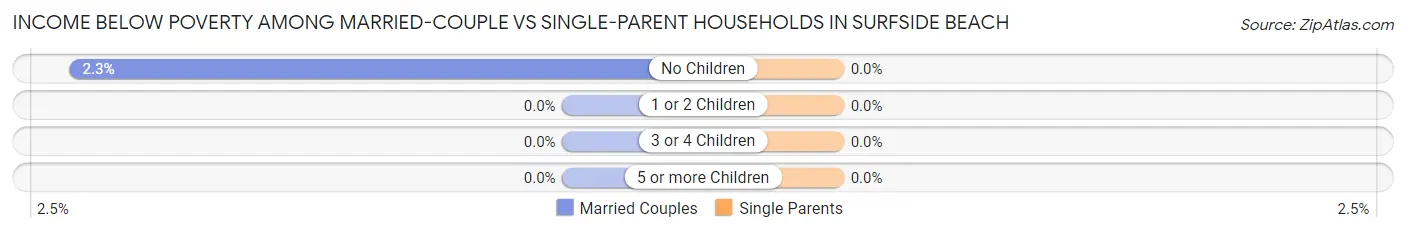
| Children | Married-Couple Families | Single-Parent Households |
| No Children | 3 (2.3%) | 0 (0.0%) |
| 1 or 2 Children | 0 (0.0%) | 0 (0.0%) |
| 3 or 4 Children | 0 (0.0%) | 0 (0.0%) |
| 5 or more Children | 0 (0.0%) | 0 (0.0%) |
| Total | 3 (2.1%) | 0 (0.0%) |
Employment Characteristics in Surfside Beach
Employment by Class of Employer in Surfside Beach
Among the 283 employed individuals in Surfside Beach, private company employees (191 | 67.5%), self-employed (not incorporated) (43 | 15.2%), and local government employees (22 | 7.8%) make up the most common classes of employment.
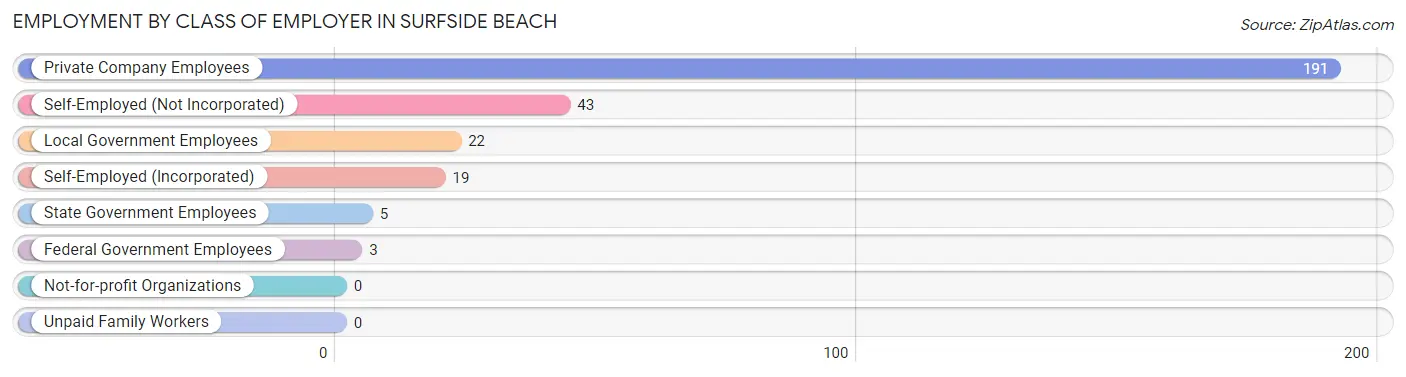
| Employer Class | # Employees | % Employees |
| Private Company Employees | 191 | 67.5% |
| Self-Employed (Incorporated) | 19 | 6.7% |
| Self-Employed (Not Incorporated) | 43 | 15.2% |
| Not-for-profit Organizations | 0 | 0.0% |
| Local Government Employees | 22 | 7.8% |
| State Government Employees | 5 | 1.8% |
| Federal Government Employees | 3 | 1.1% |
| Unpaid Family Workers | 0 | 0.0% |
| Total | 283 | 100.0% |
Employment Status by Age in Surfside Beach
According to the labor force statistics for Surfside Beach, out of the total population over 16 years of age (589), 51.6% or 304 individuals are in the labor force, with 5.9% or 18 of them unemployed. The age group with the highest labor force participation rate is 25 to 29 years, with 100.0% or 65 individuals in the labor force. Within the labor force, the 35 to 44 years age range has the highest percentage of unemployed individuals, with 46.4% or 13 of them being unemployed.
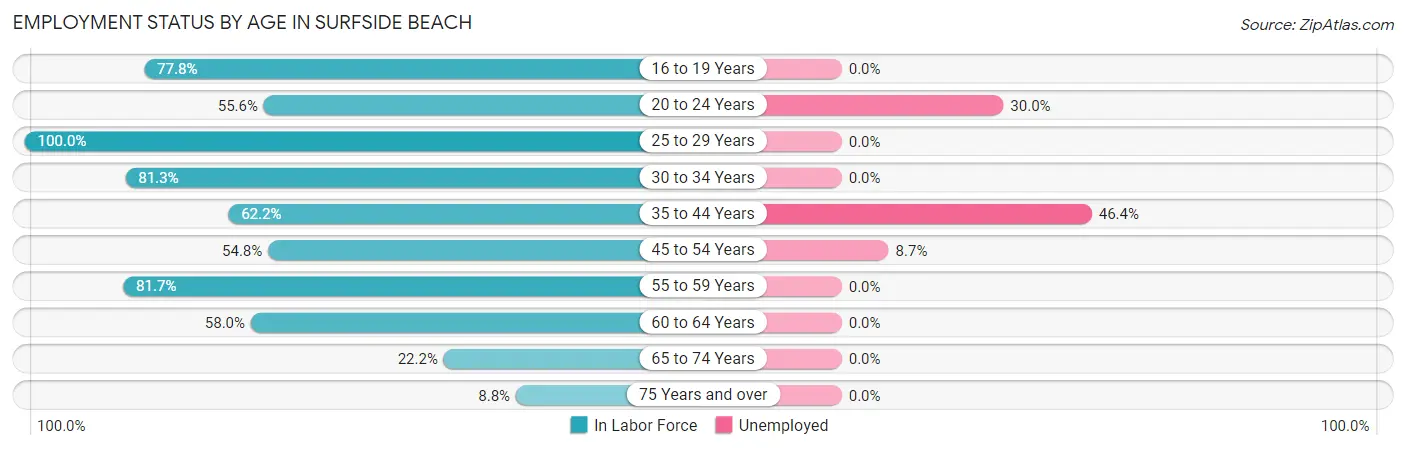
| Age Bracket | In Labor Force | Unemployed |
| 16 to 19 Years | 7 (77.8%) | 0 (0.0%) |
| 20 to 24 Years | 10 (55.6%) | 3 (30.0%) |
| 25 to 29 Years | 65 (100.0%) | 0 (0.0%) |
| 30 to 34 Years | 13 (81.3%) | 0 (0.0%) |
| 35 to 44 Years | 28 (62.2%) | 13 (46.4%) |
| 45 to 54 Years | 23 (54.8%) | 2 (8.7%) |
| 55 to 59 Years | 49 (81.7%) | 0 (0.0%) |
| 60 to 64 Years | 69 (58.0%) | 0 (0.0%) |
| 65 to 74 Years | 35 (22.2%) | 0 (0.0%) |
| 75 Years and over | 5 (8.8%) | 0 (0.0%) |
| Total | 304 (51.6%) | 18 (5.9%) |
Employment Status by Educational Attainment in Surfside Beach
According to labor force statistics for Surfside Beach, 71.2% of individuals (247) out of the total population between 25 and 64 years of age (347) are in the labor force, with 6.1% or 15 of them being unemployed. The group with the highest labor force participation rate are those with the educational attainment of bachelor's degree or higher, with 88.6% or 93 individuals in the labor force. Within the labor force, individuals with college / associate degree education have the highest percentage of unemployment, with 16.5% or 15 of them being unemployed.
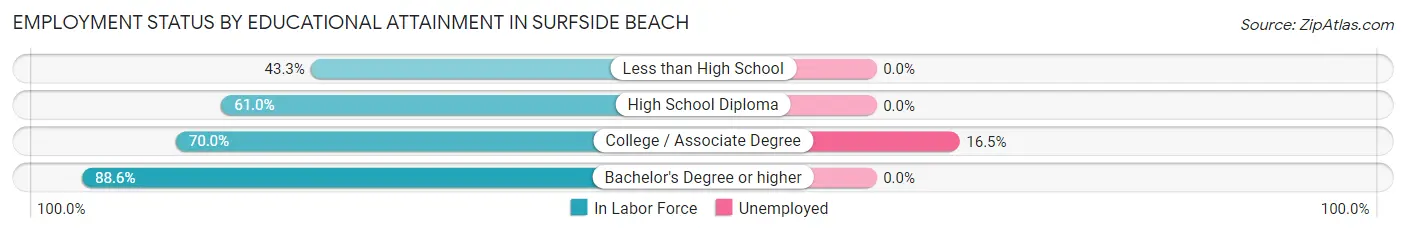
| Educational Attainment | In Labor Force | Unemployed |
| Less than High School | 13 (43.3%) | 0 (0.0%) |
| High School Diploma | 50 (61.0%) | 0 (0.0%) |
| College / Associate Degree | 91 (70.0%) | 21 (16.5%) |
| Bachelor's Degree or higher | 93 (88.6%) | 0 (0.0%) |
| Total | 247 (71.2%) | 21 (6.1%) |
Employment Occupations by Sex in Surfside Beach
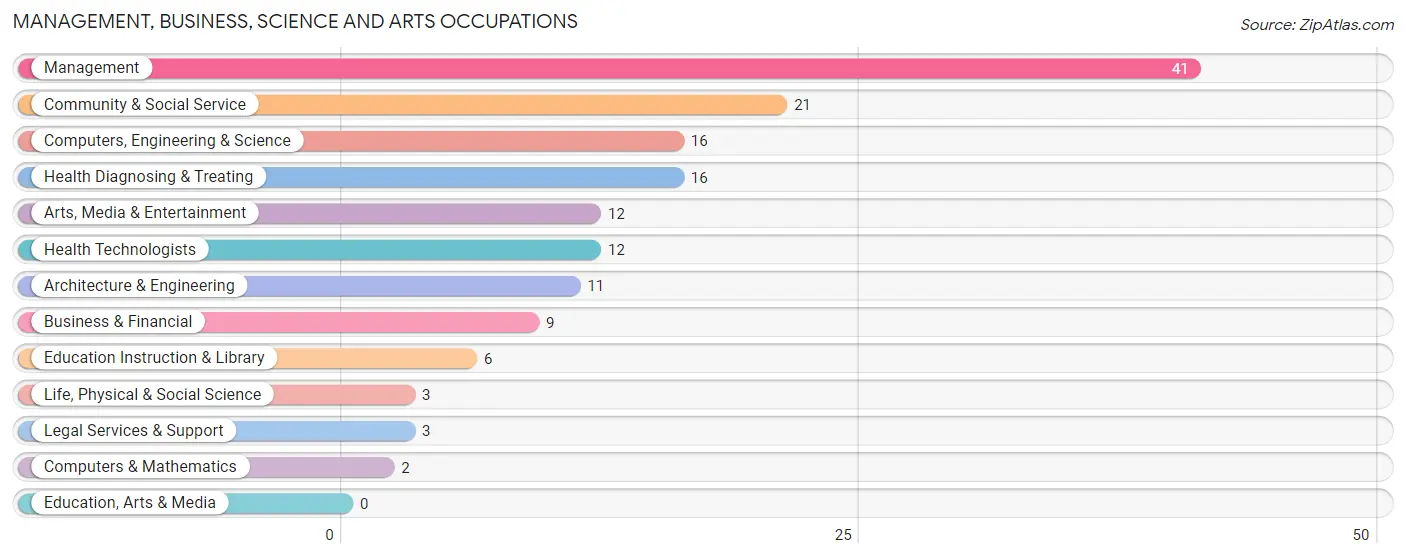
Management, Business, Science and Arts Occupations
The most common Management, Business, Science and Arts occupations in Surfside Beach are Management (41 | 14.3%), Community & Social Service (21 | 7.3%), Computers, Engineering & Science (16 | 5.6%), Health Diagnosing & Treating (16 | 5.6%), and Arts, Media & Entertainment (12 | 4.2%).
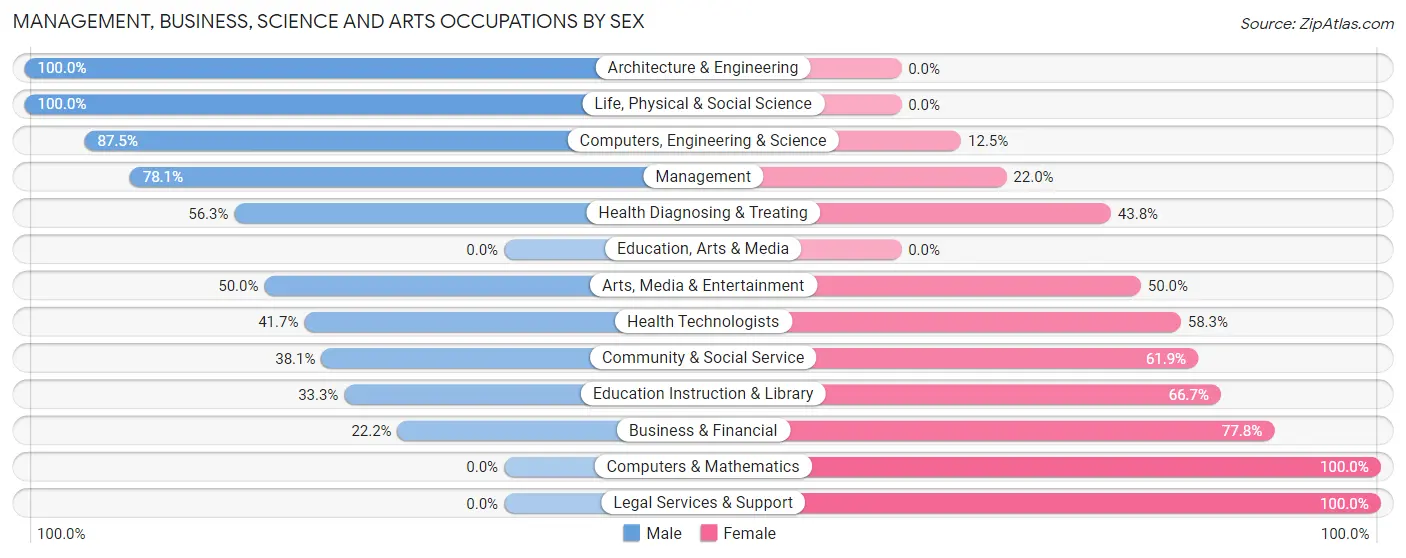
Management, Business, Science and Arts Occupations by Sex
Within the Management, Business, Science and Arts occupations in Surfside Beach, the most male-oriented occupations are Architecture & Engineering (100.0%), Life, Physical & Social Science (100.0%), and Computers, Engineering & Science (87.5%), while the most female-oriented occupations are Computers & Mathematics (100.0%), Legal Services & Support (100.0%), and Business & Financial (77.8%).
| Occupation | Male | Female |
| Management | 32 (78.0%) | 9 (22.0%) |
| Business & Financial | 2 (22.2%) | 7 (77.8%) |
| Computers, Engineering & Science | 14 (87.5%) | 2 (12.5%) |
| Computers & Mathematics | 0 (0.0%) | 2 (100.0%) |
| Architecture & Engineering | 11 (100.0%) | 0 (0.0%) |
| Life, Physical & Social Science | 3 (100.0%) | 0 (0.0%) |
| Community & Social Service | 8 (38.1%) | 13 (61.9%) |
| Education, Arts & Media | 0 (0.0%) | 0 (0.0%) |
| Legal Services & Support | 0 (0.0%) | 3 (100.0%) |
| Education Instruction & Library | 2 (33.3%) | 4 (66.7%) |
| Arts, Media & Entertainment | 6 (50.0%) | 6 (50.0%) |
| Health Diagnosing & Treating | 9 (56.2%) | 7 (43.8%) |
| Health Technologists | 5 (41.7%) | 7 (58.3%) |
| Total (Category) | 65 (63.1%) | 38 (36.9%) |
| Total (Overall) | 196 (68.5%) | 90 (31.5%) |
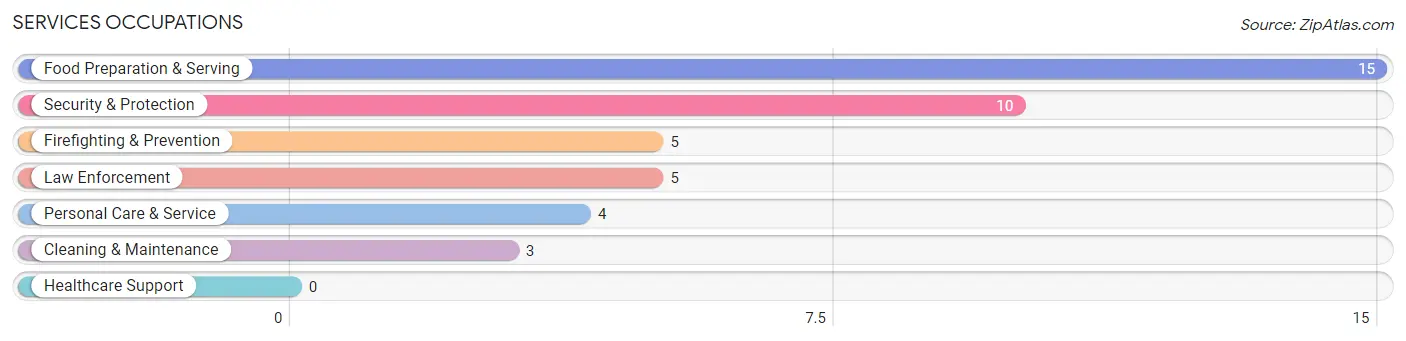
Services Occupations
The most common Services occupations in Surfside Beach are Food Preparation & Serving (15 | 5.2%), Security & Protection (10 | 3.5%), Firefighting & Prevention (5 | 1.8%), Law Enforcement (5 | 1.8%), and Personal Care & Service (4 | 1.4%).
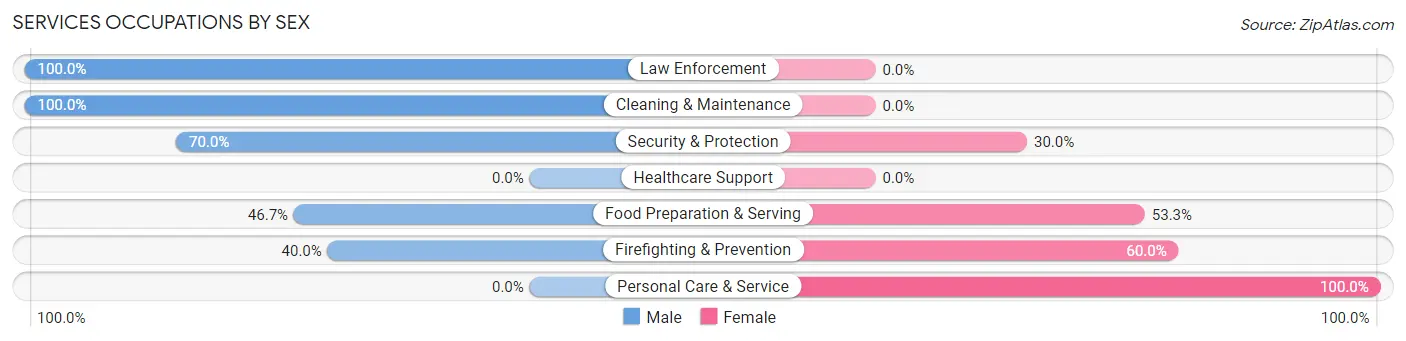
Services Occupations by Sex
Within the Services occupations in Surfside Beach, the most male-oriented occupations are Law Enforcement (100.0%), Cleaning & Maintenance (100.0%), and Security & Protection (70.0%), while the most female-oriented occupations are Personal Care & Service (100.0%), Firefighting & Prevention (60.0%), and Food Preparation & Serving (53.3%).
| Occupation | Male | Female |
| Healthcare Support | 0 (0.0%) | 0 (0.0%) |
| Security & Protection | 7 (70.0%) | 3 (30.0%) |
| Firefighting & Prevention | 2 (40.0%) | 3 (60.0%) |
| Law Enforcement | 5 (100.0%) | 0 (0.0%) |
| Food Preparation & Serving | 7 (46.7%) | 8 (53.3%) |
| Cleaning & Maintenance | 3 (100.0%) | 0 (0.0%) |
| Personal Care & Service | 0 (0.0%) | 4 (100.0%) |
| Total (Category) | 17 (53.1%) | 15 (46.9%) |
| Total (Overall) | 196 (68.5%) | 90 (31.5%) |
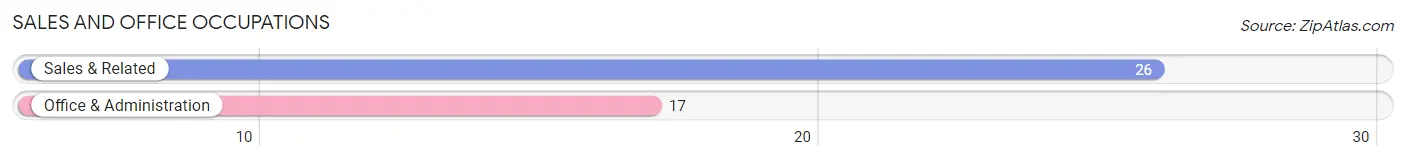
Sales and Office Occupations
The most common Sales and Office occupations in Surfside Beach are Sales & Related (26 | 9.1%), and Office & Administration (17 | 5.9%).
Sales and Office Occupations by Sex
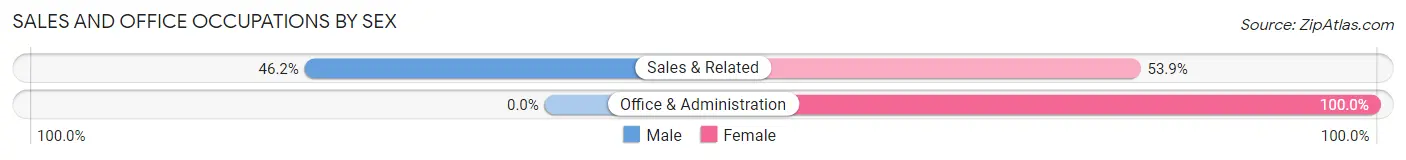
| Occupation | Male | Female |
| Sales & Related | 12 (46.2%) | 14 (53.8%) |
| Office & Administration | 0 (0.0%) | 17 (100.0%) |
| Total (Category) | 12 (27.9%) | 31 (72.1%) |
| Total (Overall) | 196 (68.5%) | 90 (31.5%) |
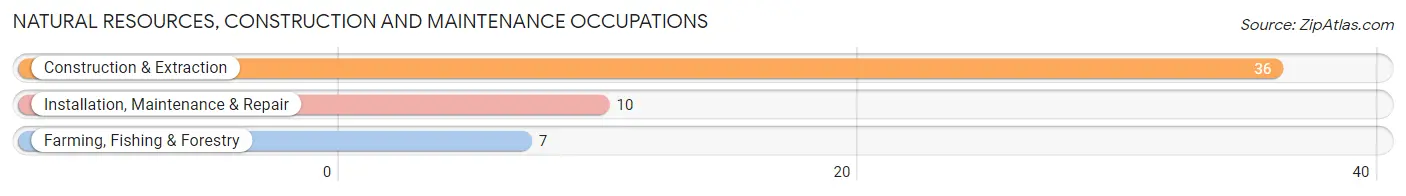
Natural Resources, Construction and Maintenance Occupations
The most common Natural Resources, Construction and Maintenance occupations in Surfside Beach are Construction & Extraction (36 | 12.6%), Installation, Maintenance & Repair (10 | 3.5%), and Farming, Fishing & Forestry (7 | 2.5%).
Natural Resources, Construction and Maintenance Occupations by Sex
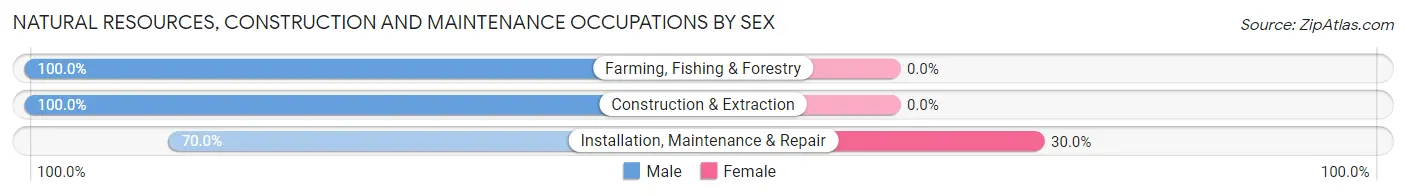
| Occupation | Male | Female |
| Farming, Fishing & Forestry | 7 (100.0%) | 0 (0.0%) |
| Construction & Extraction | 36 (100.0%) | 0 (0.0%) |
| Installation, Maintenance & Repair | 7 (70.0%) | 3 (30.0%) |
| Total (Category) | 50 (94.3%) | 3 (5.7%) |
| Total (Overall) | 196 (68.5%) | 90 (31.5%) |
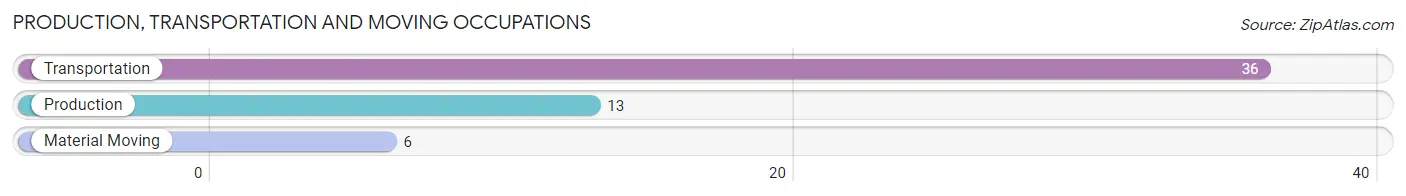
Production, Transportation and Moving Occupations
The most common Production, Transportation and Moving occupations in Surfside Beach are Transportation (36 | 12.6%), Production (13 | 4.5%), and Material Moving (6 | 2.1%).
Production, Transportation and Moving Occupations by Sex
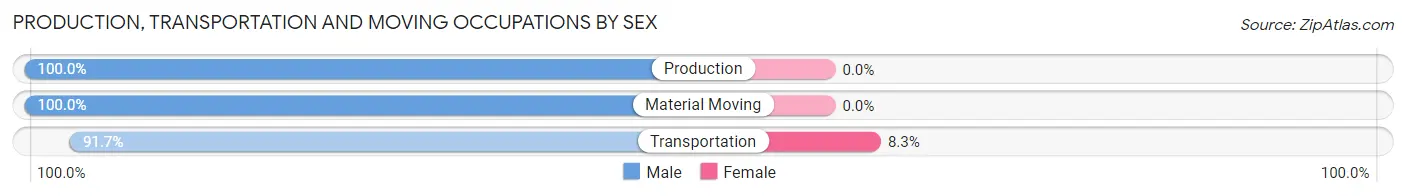
| Occupation | Male | Female |
| Production | 13 (100.0%) | 0 (0.0%) |
| Transportation | 33 (91.7%) | 3 (8.3%) |
| Material Moving | 6 (100.0%) | 0 (0.0%) |
| Total (Category) | 52 (94.6%) | 3 (5.4%) |
| Total (Overall) | 196 (68.5%) | 90 (31.5%) |
Employment Industries by Sex in Surfside Beach
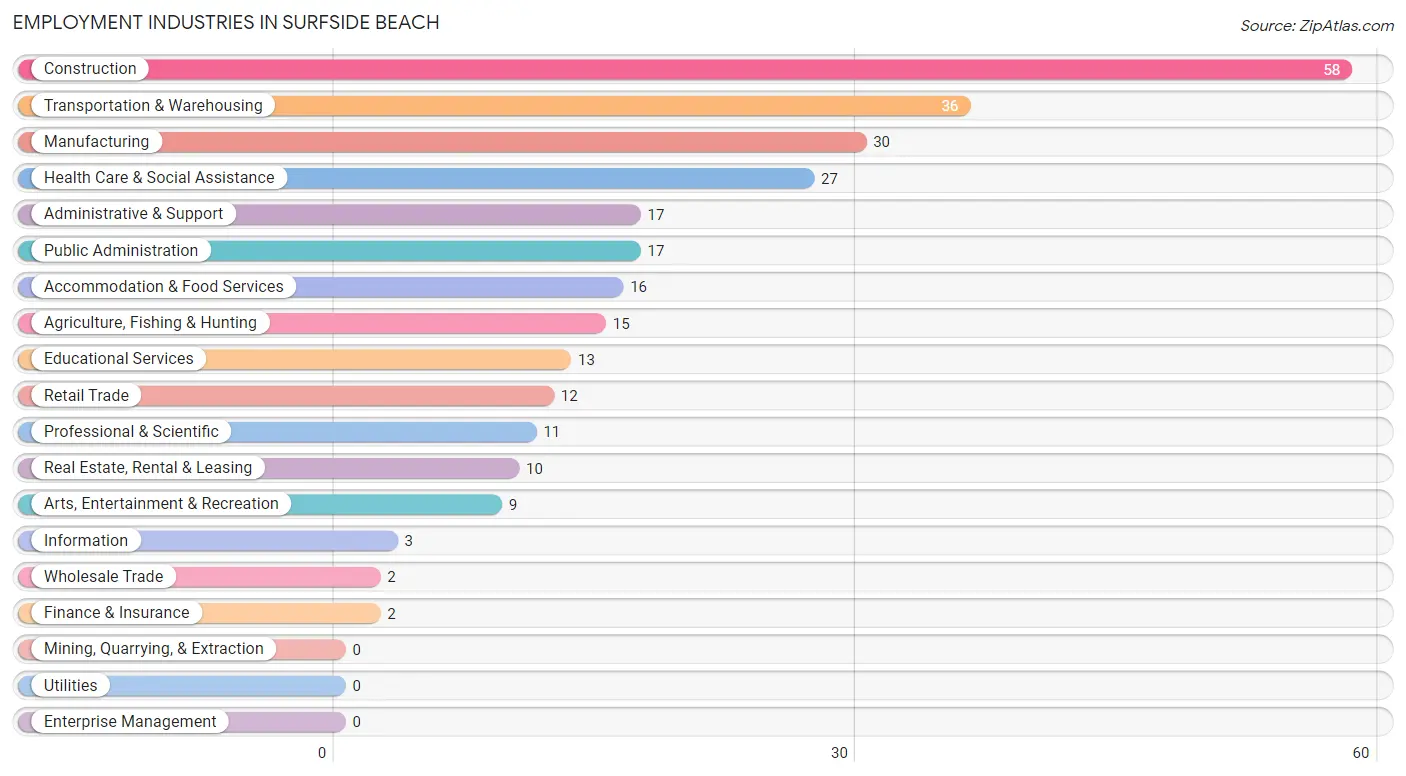
Employment Industries in Surfside Beach
The major employment industries in Surfside Beach include Construction (58 | 20.3%), Transportation & Warehousing (36 | 12.6%), Manufacturing (30 | 10.5%), Health Care & Social Assistance (27 | 9.4%), and Administrative & Support (17 | 5.9%).
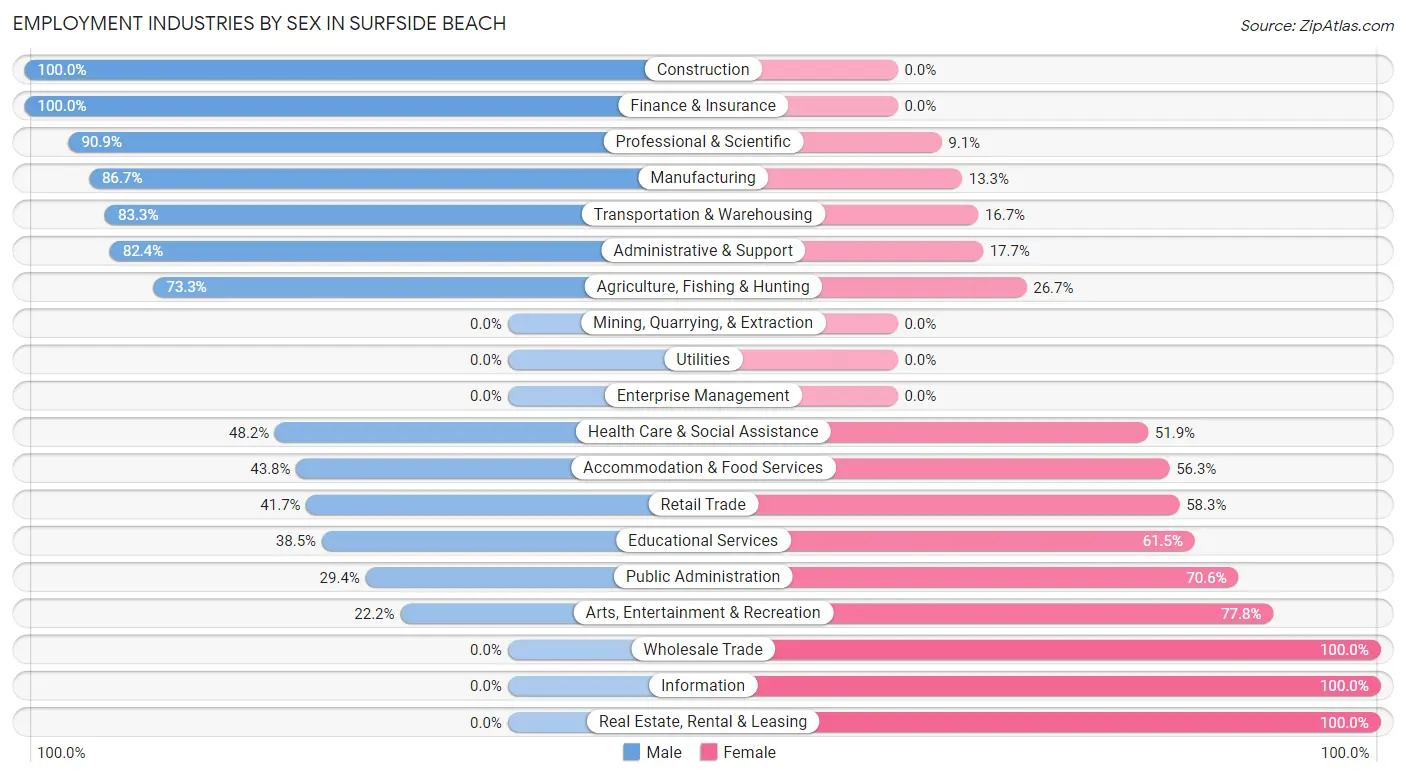
Employment Industries by Sex in Surfside Beach
The Surfside Beach industries that see more men than women are Construction (100.0%), Finance & Insurance (100.0%), and Professional & Scientific (90.9%), whereas the industries that tend to have a higher number of women are Wholesale Trade (100.0%), Information (100.0%), and Real Estate, Rental & Leasing (100.0%).
| Industry | Male | Female |
| Agriculture, Fishing & Hunting | 11 (73.3%) | 4 (26.7%) |
| Mining, Quarrying, & Extraction | 0 (0.0%) | 0 (0.0%) |
| Construction | 58 (100.0%) | 0 (0.0%) |
| Manufacturing | 26 (86.7%) | 4 (13.3%) |
| Wholesale Trade | 0 (0.0%) | 2 (100.0%) |
| Retail Trade | 5 (41.7%) | 7 (58.3%) |
| Transportation & Warehousing | 30 (83.3%) | 6 (16.7%) |
| Utilities | 0 (0.0%) | 0 (0.0%) |
| Information | 0 (0.0%) | 3 (100.0%) |
| Finance & Insurance | 2 (100.0%) | 0 (0.0%) |
| Real Estate, Rental & Leasing | 0 (0.0%) | 10 (100.0%) |
| Professional & Scientific | 10 (90.9%) | 1 (9.1%) |
| Enterprise Management | 0 (0.0%) | 0 (0.0%) |
| Administrative & Support | 14 (82.4%) | 3 (17.6%) |
| Educational Services | 5 (38.5%) | 8 (61.5%) |
| Health Care & Social Assistance | 13 (48.1%) | 14 (51.8%) |
| Arts, Entertainment & Recreation | 2 (22.2%) | 7 (77.8%) |
| Accommodation & Food Services | 7 (43.8%) | 9 (56.2%) |
| Public Administration | 5 (29.4%) | 12 (70.6%) |
| Total | 196 (68.5%) | 90 (31.5%) |
Education in Surfside Beach
School Enrollment in Surfside Beach
The most common levels of schooling among the 44 students in Surfside Beach are elementary school (15 | 34.1%), high school (7 | 15.9%), and graduate / professional (7 | 15.9%).
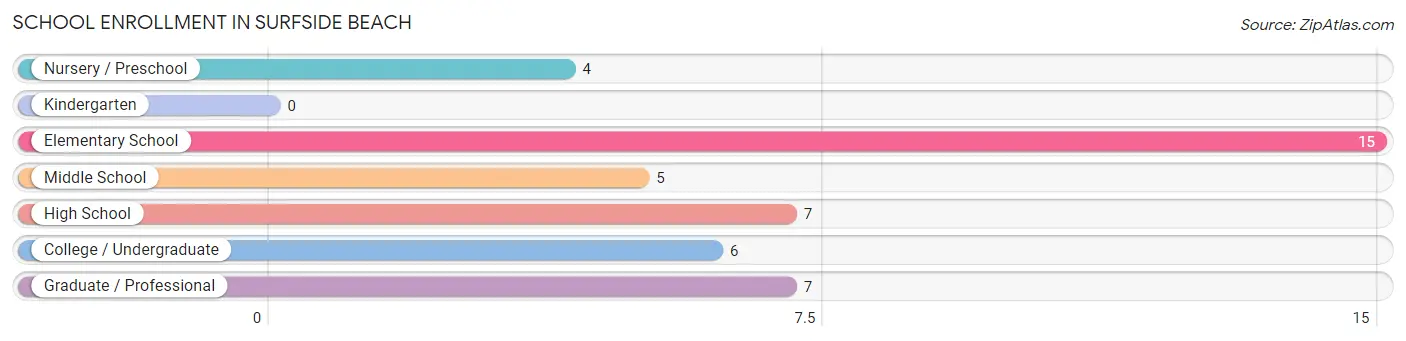
| School Level | # Students | % Students |
| Nursery / Preschool | 4 | 9.1% |
| Kindergarten | 0 | 0.0% |
| Elementary School | 15 | 34.1% |
| Middle School | 5 | 11.4% |
| High School | 7 | 15.9% |
| College / Undergraduate | 6 | 13.6% |
| Graduate / Professional | 7 | 15.9% |
| Total | 44 | 100.0% |
School Enrollment by Age by Funding Source in Surfside Beach
Out of a total of 44 students who are enrolled in schools in Surfside Beach, 6 (13.6%) attend a private institution, while the remaining 38 (86.4%) are enrolled in public schools. The age group of 3 to 4 year olds has the highest likelihood of being enrolled in private schools, with 4 (100.0% in the age bracket) enrolled. Conversely, the age group of 5 to 9 year old has the lowest likelihood of being enrolled in a private school, with 15 (100.0% in the age bracket) attending a public institution.
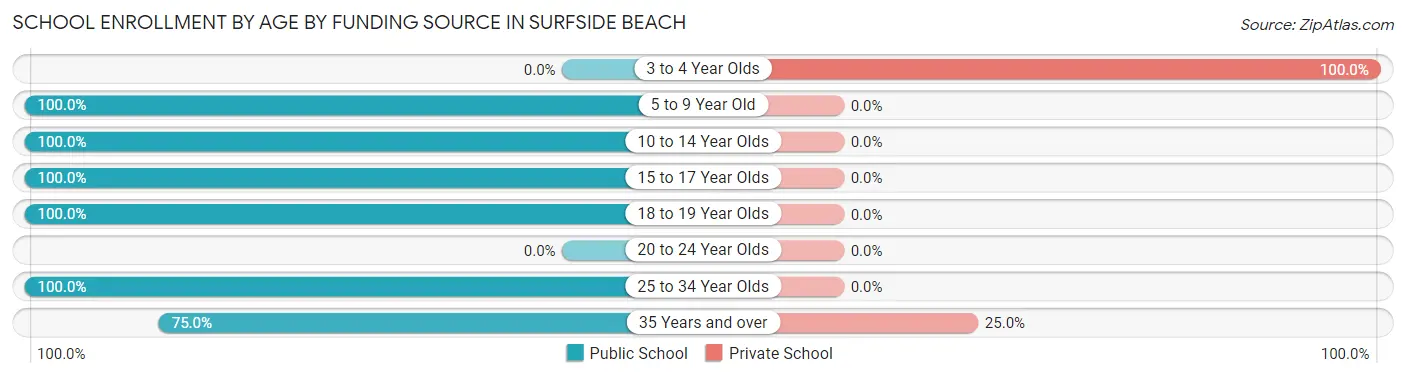
| Age Bracket | Public School | Private School |
| 3 to 4 Year Olds | 0 (0.0%) | 4 (100.0%) |
| 5 to 9 Year Old | 15 (100.0%) | 0 (0.0%) |
| 10 to 14 Year Olds | 5 (100.0%) | 0 (0.0%) |
| 15 to 17 Year Olds | 2 (100.0%) | 0 (0.0%) |
| 18 to 19 Year Olds | 5 (100.0%) | 0 (0.0%) |
| 20 to 24 Year Olds | 0 (0.0%) | 0 (0.0%) |
| 25 to 34 Year Olds | 5 (100.0%) | 0 (0.0%) |
| 35 Years and over | 6 (75.0%) | 2 (25.0%) |
| Total | 38 (86.4%) | 6 (13.6%) |
Educational Attainment by Field of Study in Surfside Beach
Business (49 | 24.4%), education (31 | 15.4%), engineering (23 | 11.4%), bio, nature & agricultural (21 | 10.4%), and science & technology (19 | 9.5%) are the most common fields of study among 201 individuals in Surfside Beach who have obtained a bachelor's degree or higher.
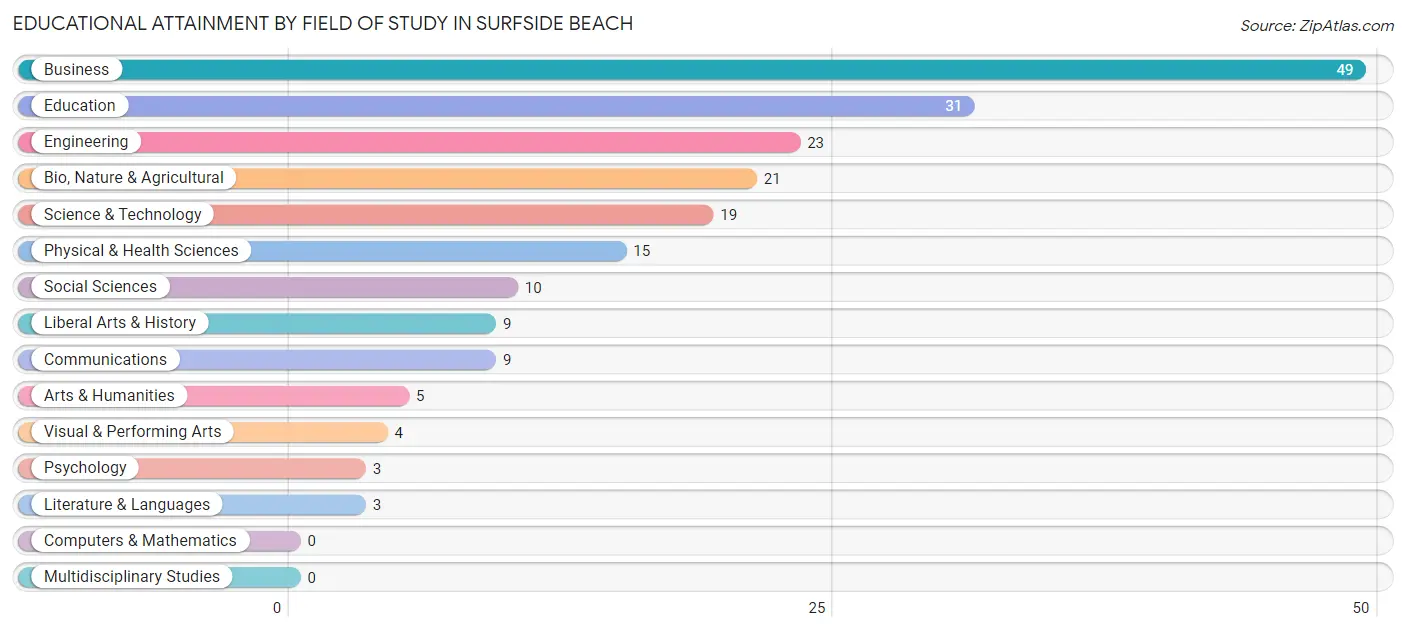
| Field of Study | # Graduates | % Graduates |
| Computers & Mathematics | 0 | 0.0% |
| Bio, Nature & Agricultural | 21 | 10.4% |
| Physical & Health Sciences | 15 | 7.5% |
| Psychology | 3 | 1.5% |
| Social Sciences | 10 | 5.0% |
| Engineering | 23 | 11.4% |
| Multidisciplinary Studies | 0 | 0.0% |
| Science & Technology | 19 | 9.5% |
| Business | 49 | 24.4% |
| Education | 31 | 15.4% |
| Literature & Languages | 3 | 1.5% |
| Liberal Arts & History | 9 | 4.5% |
| Visual & Performing Arts | 4 | 2.0% |
| Communications | 9 | 4.5% |
| Arts & Humanities | 5 | 2.5% |
| Total | 201 | 100.0% |
Transportation & Commute in Surfside Beach
Vehicle Availability by Sex in Surfside Beach
The most prevalent vehicle ownership categories in Surfside Beach are males with 2 vehicles (80, accounting for 40.8%) and females with 2 vehicles (44, making up 91.9%).
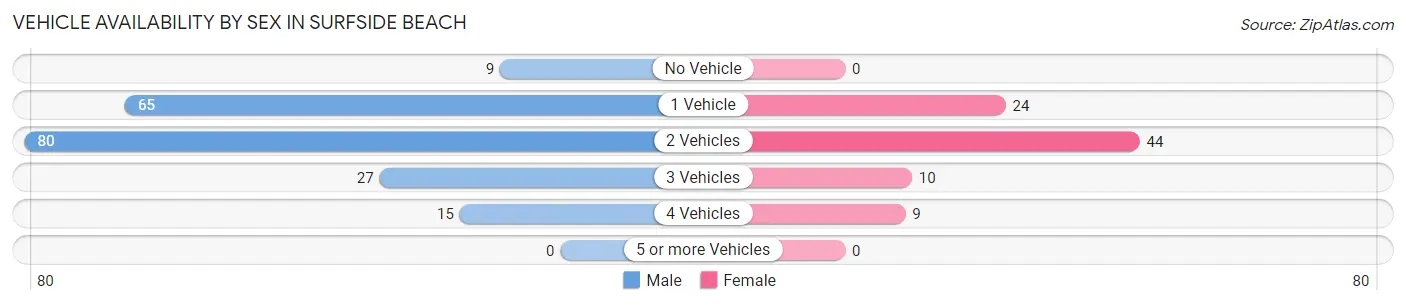
| Vehicles Available | Male | Female |
| No Vehicle | 9 (4.6%) | 0 (0.0%) |
| 1 Vehicle | 65 (33.2%) | 24 (27.6%) |
| 2 Vehicles | 80 (40.8%) | 44 (50.6%) |
| 3 Vehicles | 27 (13.8%) | 10 (11.5%) |
| 4 Vehicles | 15 (7.6%) | 9 (10.3%) |
| 5 or more Vehicles | 0 (0.0%) | 0 (0.0%) |
| Total | 196 (100.0%) | 87 (100.0%) |
Commute Time in Surfside Beach
The most frequently occuring commute durations in Surfside Beach are 15 to 19 minutes (43 commuters, 17.1%), 20 to 24 minutes (29 commuters, 11.5%), and 60 to 89 minutes (25 commuters, 9.9%).
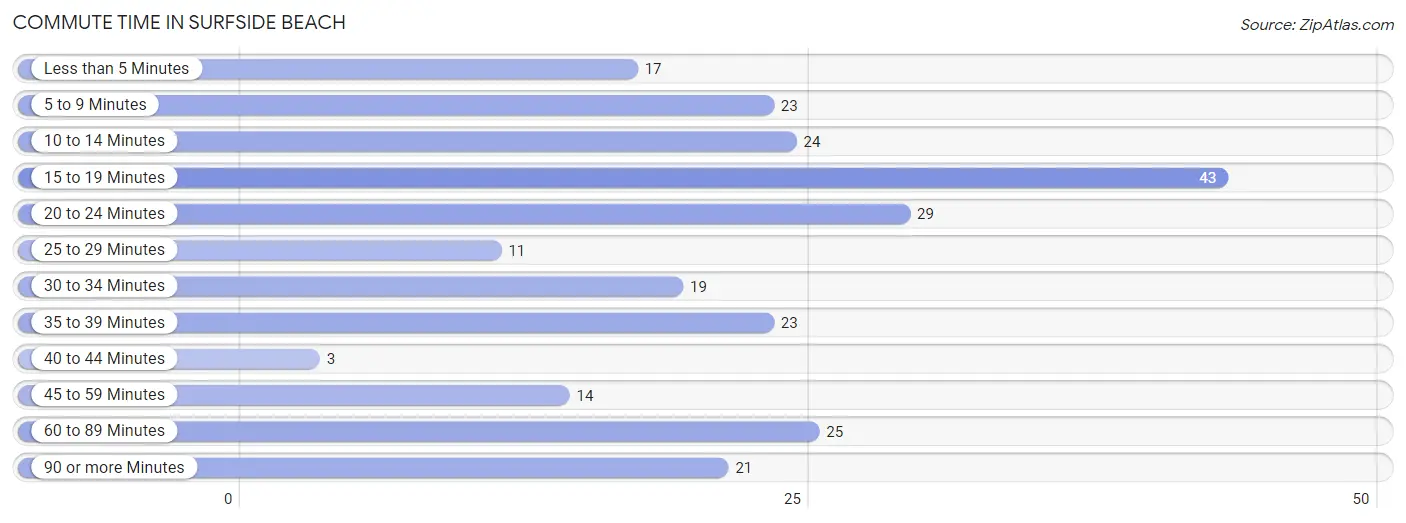
| Commute Time | # Commuters | % Commuters |
| Less than 5 Minutes | 17 | 6.8% |
| 5 to 9 Minutes | 23 | 9.1% |
| 10 to 14 Minutes | 24 | 9.5% |
| 15 to 19 Minutes | 43 | 17.1% |
| 20 to 24 Minutes | 29 | 11.5% |
| 25 to 29 Minutes | 11 | 4.4% |
| 30 to 34 Minutes | 19 | 7.5% |
| 35 to 39 Minutes | 23 | 9.1% |
| 40 to 44 Minutes | 3 | 1.2% |
| 45 to 59 Minutes | 14 | 5.6% |
| 60 to 89 Minutes | 25 | 9.9% |
| 90 or more Minutes | 21 | 8.3% |
Commute Time by Sex in Surfside Beach
The most common commute times in Surfside Beach are 15 to 19 minutes (29 commuters, 16.2%) for males and 5 to 9 minutes (16 commuters, 21.9%) for females.
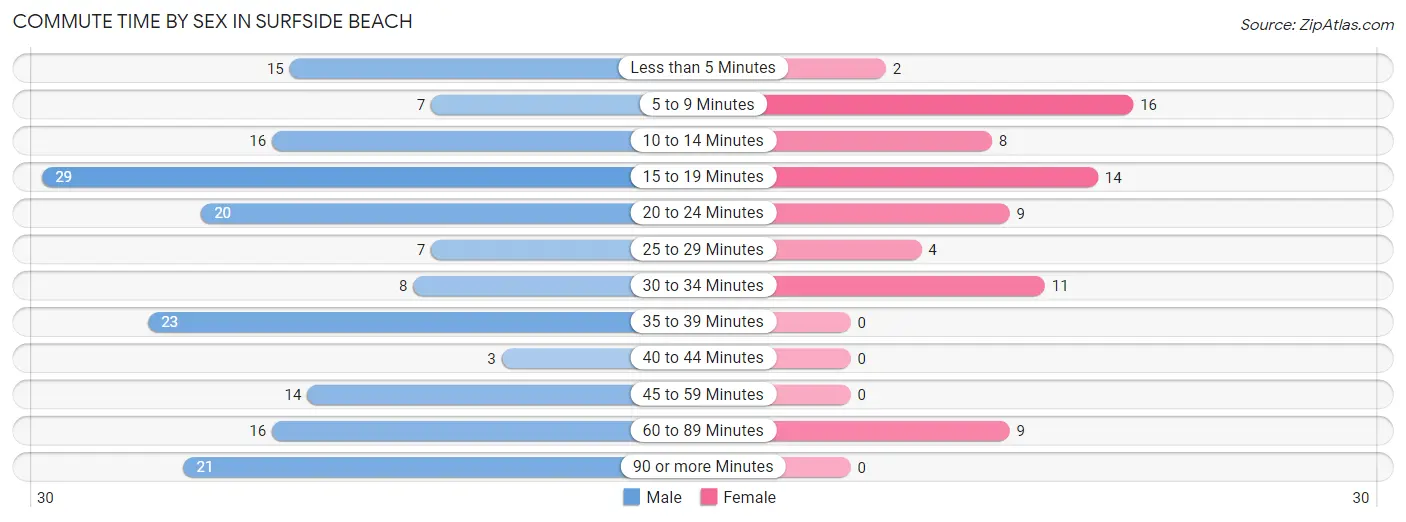
| Commute Time | Male | Female |
| Less than 5 Minutes | 15 (8.4%) | 2 (2.7%) |
| 5 to 9 Minutes | 7 (3.9%) | 16 (21.9%) |
| 10 to 14 Minutes | 16 (8.9%) | 8 (11.0%) |
| 15 to 19 Minutes | 29 (16.2%) | 14 (19.2%) |
| 20 to 24 Minutes | 20 (11.2%) | 9 (12.3%) |
| 25 to 29 Minutes | 7 (3.9%) | 4 (5.5%) |
| 30 to 34 Minutes | 8 (4.5%) | 11 (15.1%) |
| 35 to 39 Minutes | 23 (12.9%) | 0 (0.0%) |
| 40 to 44 Minutes | 3 (1.7%) | 0 (0.0%) |
| 45 to 59 Minutes | 14 (7.8%) | 0 (0.0%) |
| 60 to 89 Minutes | 16 (8.9%) | 9 (12.3%) |
| 90 or more Minutes | 21 (11.7%) | 0 (0.0%) |
Time of Departure to Work by Sex in Surfside Beach
The most frequent times of departure to work in Surfside Beach are 7:00 AM to 7:29 AM (33, 18.4%) for males and 6:00 AM to 6:29 AM (12, 16.4%) for females.
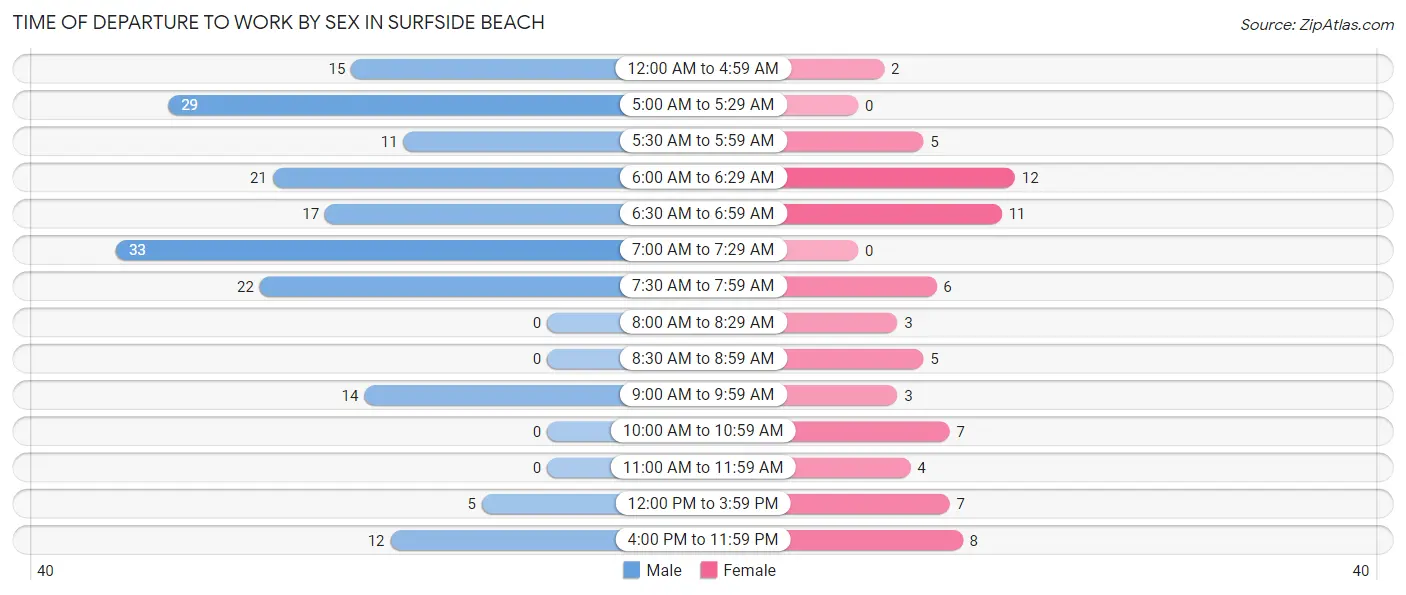
| Time of Departure | Male | Female |
| 12:00 AM to 4:59 AM | 15 (8.4%) | 2 (2.7%) |
| 5:00 AM to 5:29 AM | 29 (16.2%) | 0 (0.0%) |
| 5:30 AM to 5:59 AM | 11 (6.1%) | 5 (6.9%) |
| 6:00 AM to 6:29 AM | 21 (11.7%) | 12 (16.4%) |
| 6:30 AM to 6:59 AM | 17 (9.5%) | 11 (15.1%) |
| 7:00 AM to 7:29 AM | 33 (18.4%) | 0 (0.0%) |
| 7:30 AM to 7:59 AM | 22 (12.3%) | 6 (8.2%) |
| 8:00 AM to 8:29 AM | 0 (0.0%) | 3 (4.1%) |
| 8:30 AM to 8:59 AM | 0 (0.0%) | 5 (6.9%) |
| 9:00 AM to 9:59 AM | 14 (7.8%) | 3 (4.1%) |
| 10:00 AM to 10:59 AM | 0 (0.0%) | 7 (9.6%) |
| 11:00 AM to 11:59 AM | 0 (0.0%) | 4 (5.5%) |
| 12:00 PM to 3:59 PM | 5 (2.8%) | 7 (9.6%) |
| 4:00 PM to 11:59 PM | 12 (6.7%) | 8 (11.0%) |
| Total | 179 (100.0%) | 73 (100.0%) |
Housing Occupancy in Surfside Beach
Occupancy by Ownership in Surfside Beach
Of the total 347 dwellings in Surfside Beach, owner-occupied units account for 284 (81.8%), while renter-occupied units make up 63 (18.2%).
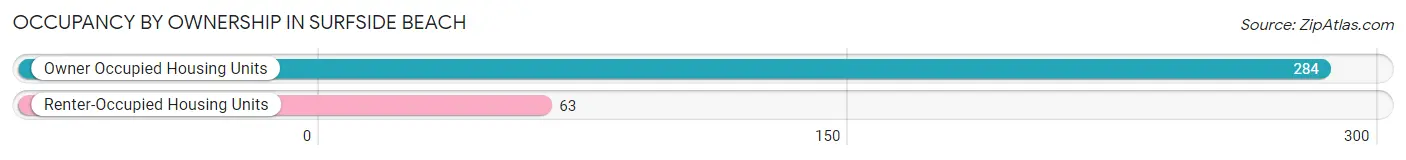
| Occupancy | # Housing Units | % Housing Units |
| Owner Occupied Housing Units | 284 | 81.8% |
| Renter-Occupied Housing Units | 63 | 18.2% |
| Total Occupied Housing Units | 347 | 100.0% |
Occupancy by Household Size in Surfside Beach
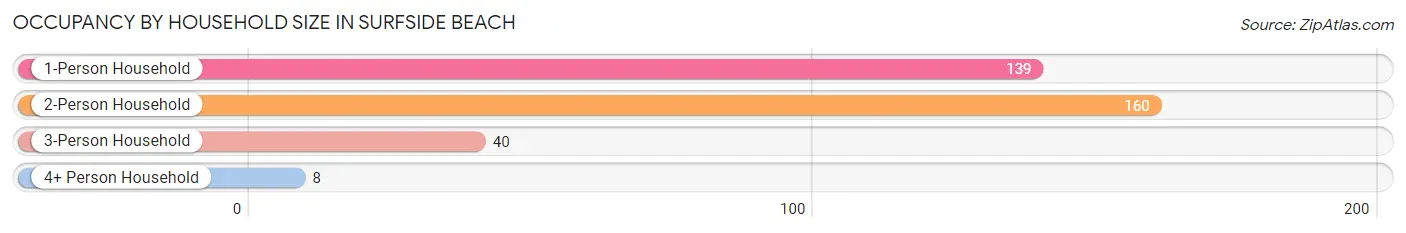
| Household Size | # Housing Units | % Housing Units |
| 1-Person Household | 139 | 40.1% |
| 2-Person Household | 160 | 46.1% |
| 3-Person Household | 40 | 11.5% |
| 4+ Person Household | 8 | 2.3% |
| Total Housing Units | 347 | 100.0% |
Occupancy by Ownership by Household Size in Surfside Beach
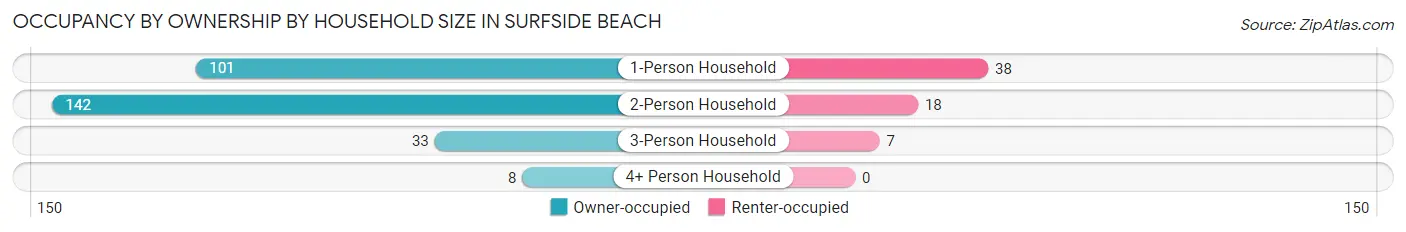
| Household Size | Owner-occupied | Renter-occupied |
| 1-Person Household | 101 (72.7%) | 38 (27.3%) |
| 2-Person Household | 142 (88.7%) | 18 (11.3%) |
| 3-Person Household | 33 (82.5%) | 7 (17.5%) |
| 4+ Person Household | 8 (100.0%) | 0 (0.0%) |
| Total Housing Units | 284 (81.8%) | 63 (18.2%) |
Occupancy by Educational Attainment in Surfside Beach
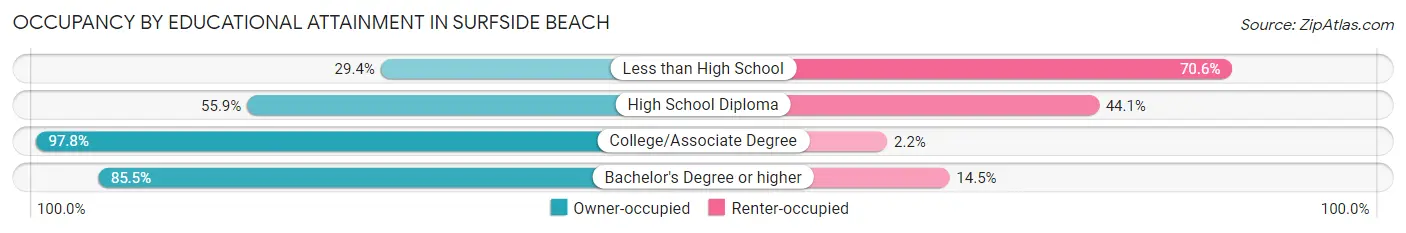
| Household Size | Owner-occupied | Renter-occupied |
| Less than High School | 5 (29.4%) | 12 (70.6%) |
| High School Diploma | 38 (55.9%) | 30 (44.1%) |
| College/Associate Degree | 135 (97.8%) | 3 (2.2%) |
| Bachelor's Degree or higher | 106 (85.5%) | 18 (14.5%) |
Occupancy by Age of Householder in Surfside Beach
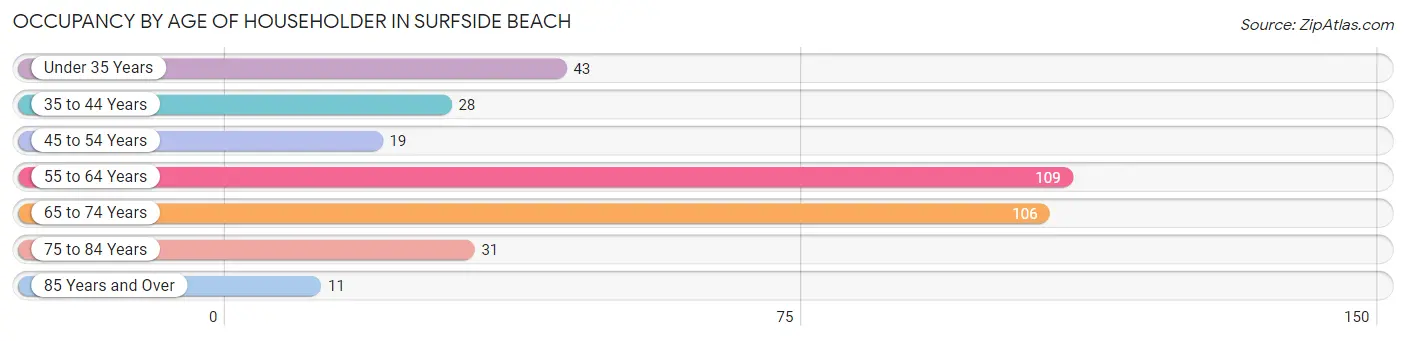
| Age Bracket | # Households | % Households |
| Under 35 Years | 43 | 12.4% |
| 35 to 44 Years | 28 | 8.1% |
| 45 to 54 Years | 19 | 5.5% |
| 55 to 64 Years | 109 | 31.4% |
| 65 to 74 Years | 106 | 30.5% |
| 75 to 84 Years | 31 | 8.9% |
| 85 Years and Over | 11 | 3.2% |
| Total | 347 | 100.0% |
Housing Finances in Surfside Beach
Median Income by Occupancy in Surfside Beach
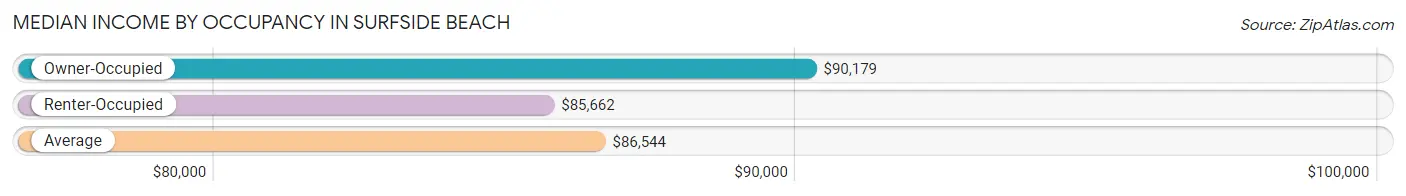
| Occupancy Type | # Households | Median Income |
| Owner-Occupied | 284 (81.8%) | $90,179 |
| Renter-Occupied | 63 (18.2%) | $85,662 |
| Average | 347 (100.0%) | $86,544 |
Occupancy by Householder Income Bracket in Surfside Beach
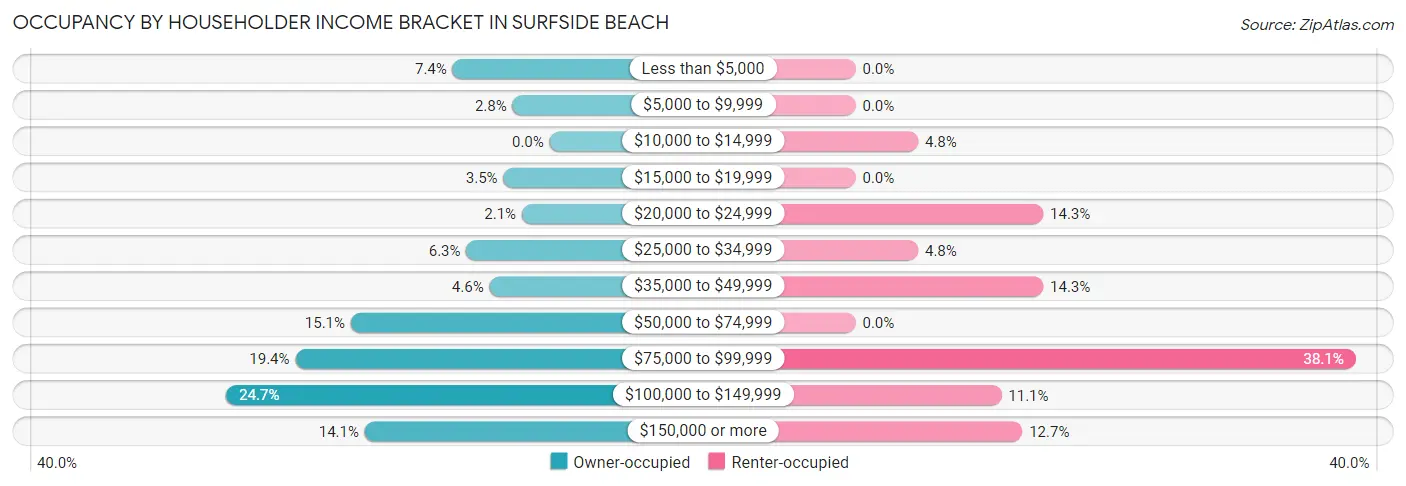
| Income Bracket | Owner-occupied | Renter-occupied |
| Less than $5,000 | 21 (7.4%) | 0 (0.0%) |
| $5,000 to $9,999 | 8 (2.8%) | 0 (0.0%) |
| $10,000 to $14,999 | 0 (0.0%) | 3 (4.8%) |
| $15,000 to $19,999 | 10 (3.5%) | 0 (0.0%) |
| $20,000 to $24,999 | 6 (2.1%) | 9 (14.3%) |
| $25,000 to $34,999 | 18 (6.3%) | 3 (4.8%) |
| $35,000 to $49,999 | 13 (4.6%) | 9 (14.3%) |
| $50,000 to $74,999 | 43 (15.1%) | 0 (0.0%) |
| $75,000 to $99,999 | 55 (19.4%) | 24 (38.1%) |
| $100,000 to $149,999 | 70 (24.6%) | 7 (11.1%) |
| $150,000 or more | 40 (14.1%) | 8 (12.7%) |
| Total | 284 (100.0%) | 63 (100.0%) |
Monthly Housing Cost Tiers in Surfside Beach
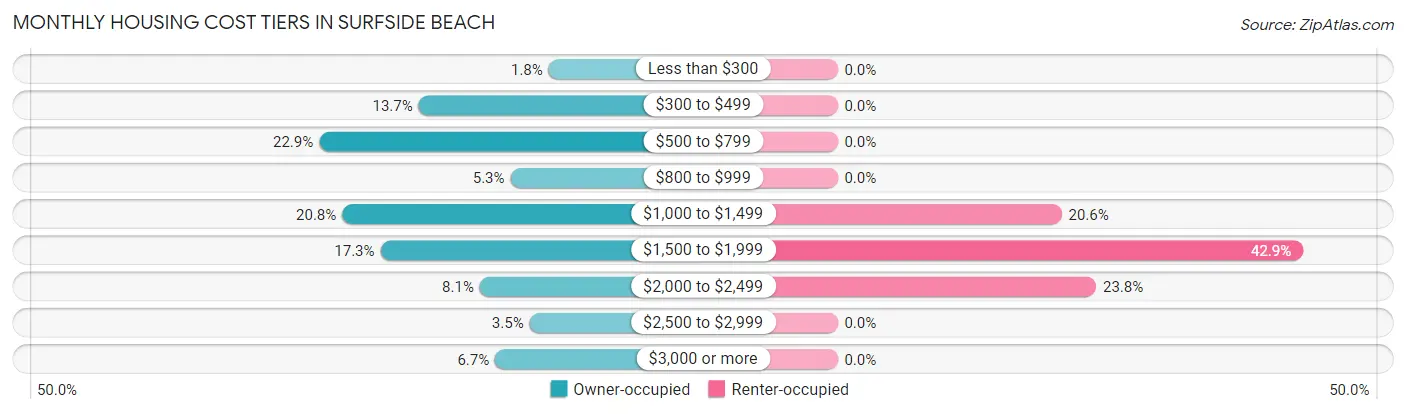
| Monthly Cost | Owner-occupied | Renter-occupied |
| Less than $300 | 5 (1.8%) | 0 (0.0%) |
| $300 to $499 | 39 (13.7%) | 0 (0.0%) |
| $500 to $799 | 65 (22.9%) | 0 (0.0%) |
| $800 to $999 | 15 (5.3%) | 0 (0.0%) |
| $1,000 to $1,499 | 59 (20.8%) | 13 (20.6%) |
| $1,500 to $1,999 | 49 (17.2%) | 27 (42.9%) |
| $2,000 to $2,499 | 23 (8.1%) | 15 (23.8%) |
| $2,500 to $2,999 | 10 (3.5%) | 0 (0.0%) |
| $3,000 or more | 19 (6.7%) | 0 (0.0%) |
| Total | 284 (100.0%) | 63 (100.0%) |
Physical Housing Characteristics in Surfside Beach
Housing Structures in Surfside Beach
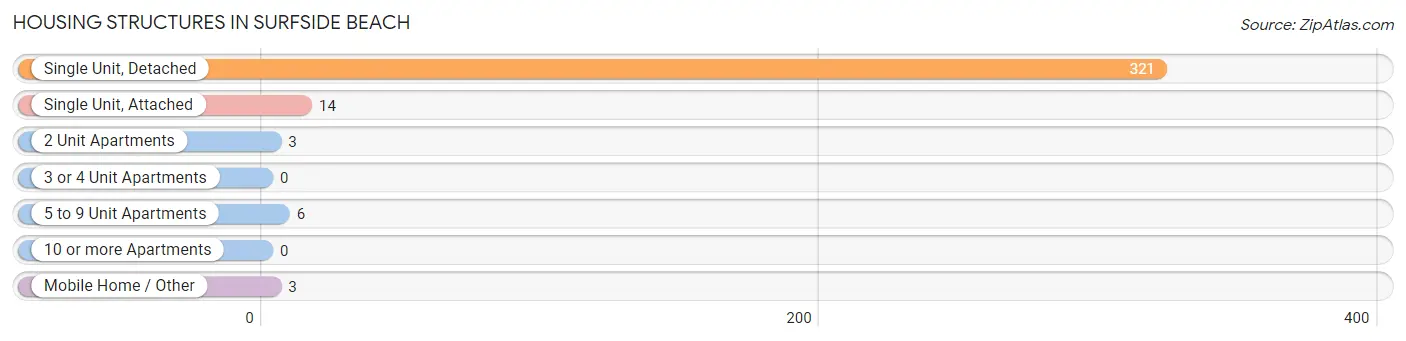
| Structure Type | # Housing Units | % Housing Units |
| Single Unit, Detached | 321 | 92.5% |
| Single Unit, Attached | 14 | 4.0% |
| 2 Unit Apartments | 3 | 0.9% |
| 3 or 4 Unit Apartments | 0 | 0.0% |
| 5 to 9 Unit Apartments | 6 | 1.7% |
| 10 or more Apartments | 0 | 0.0% |
| Mobile Home / Other | 3 | 0.9% |
| Total | 347 | 100.0% |
Housing Structures by Occupancy in Surfside Beach
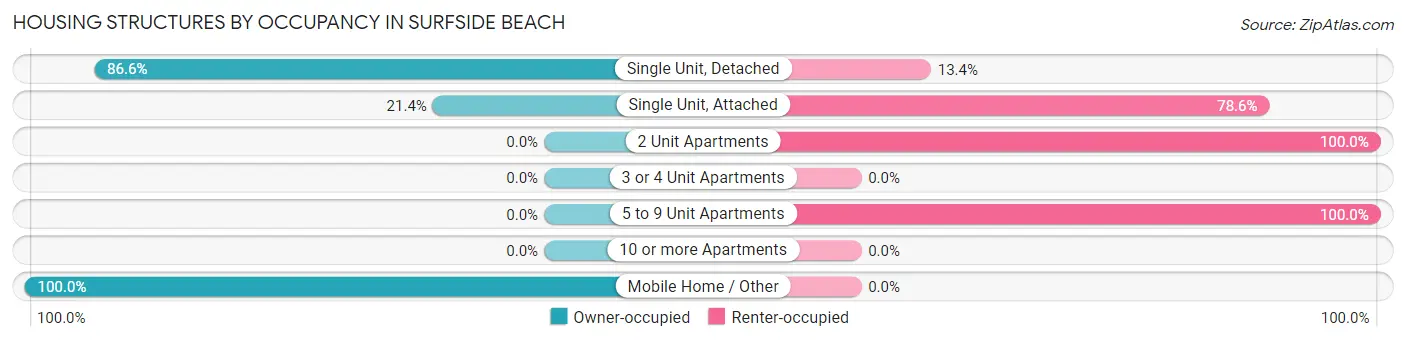
| Structure Type | Owner-occupied | Renter-occupied |
| Single Unit, Detached | 278 (86.6%) | 43 (13.4%) |
| Single Unit, Attached | 3 (21.4%) | 11 (78.6%) |
| 2 Unit Apartments | 0 (0.0%) | 3 (100.0%) |
| 3 or 4 Unit Apartments | 0 (0.0%) | 0 (0.0%) |
| 5 to 9 Unit Apartments | 0 (0.0%) | 6 (100.0%) |
| 10 or more Apartments | 0 (0.0%) | 0 (0.0%) |
| Mobile Home / Other | 3 (100.0%) | 0 (0.0%) |
| Total | 284 (81.8%) | 63 (18.2%) |
Housing Structures by Number of Rooms in Surfside Beach
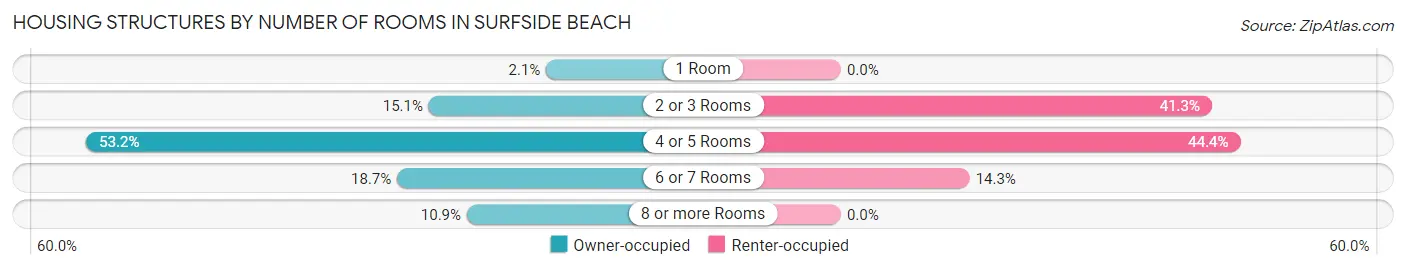
| Number of Rooms | Owner-occupied | Renter-occupied |
| 1 Room | 6 (2.1%) | 0 (0.0%) |
| 2 or 3 Rooms | 43 (15.1%) | 26 (41.3%) |
| 4 or 5 Rooms | 151 (53.2%) | 28 (44.4%) |
| 6 or 7 Rooms | 53 (18.7%) | 9 (14.3%) |
| 8 or more Rooms | 31 (10.9%) | 0 (0.0%) |
| Total | 284 (100.0%) | 63 (100.0%) |
Housing Structure by Heating Type in Surfside Beach
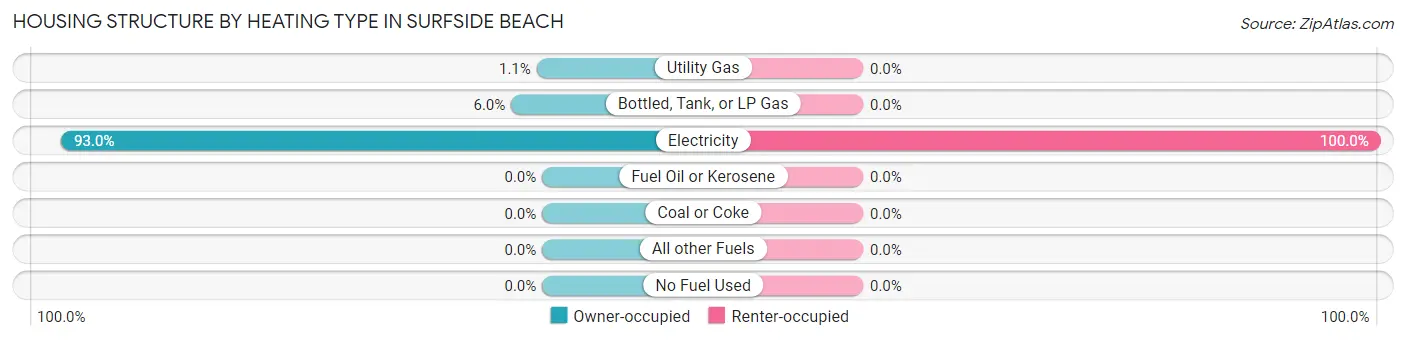
| Heating Type | Owner-occupied | Renter-occupied |
| Utility Gas | 3 (1.1%) | 0 (0.0%) |
| Bottled, Tank, or LP Gas | 17 (6.0%) | 0 (0.0%) |
| Electricity | 264 (93.0%) | 63 (100.0%) |
| Fuel Oil or Kerosene | 0 (0.0%) | 0 (0.0%) |
| Coal or Coke | 0 (0.0%) | 0 (0.0%) |
| All other Fuels | 0 (0.0%) | 0 (0.0%) |
| No Fuel Used | 0 (0.0%) | 0 (0.0%) |
| Total | 284 (100.0%) | 63 (100.0%) |
Household Vehicle Usage in Surfside Beach
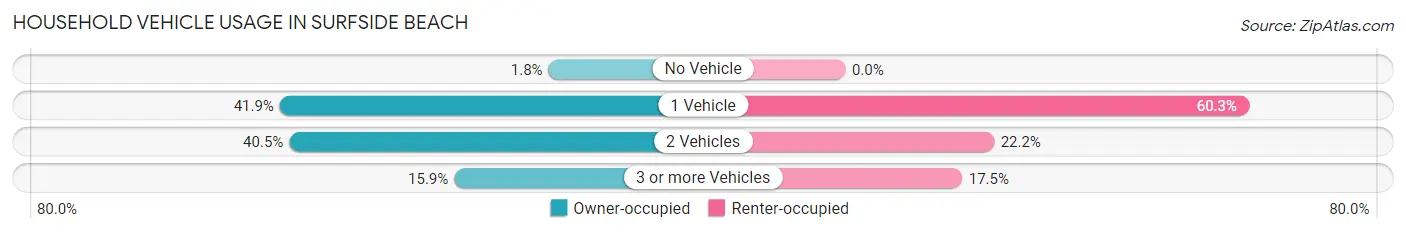
| Vehicles per Household | Owner-occupied | Renter-occupied |
| No Vehicle | 5 (1.8%) | 0 (0.0%) |
| 1 Vehicle | 119 (41.9%) | 38 (60.3%) |
| 2 Vehicles | 115 (40.5%) | 14 (22.2%) |
| 3 or more Vehicles | 45 (15.9%) | 11 (17.5%) |
| Total | 284 (100.0%) | 63 (100.0%) |
Real Estate & Mortgages in Surfside Beach
Real Estate and Mortgage Overview in Surfside Beach
| Characteristic | Without Mortgage | With Mortgage |
| Housing Units | 160 | 124 |
| Median Property Value | $271,700 | $228,300 |
| Median Household Income | $89,167 | $18 |
| Monthly Housing Costs | $671 | $11 |
| Real Estate Taxes | $2,796 | $0 |
Property Value by Mortgage Status in Surfside Beach
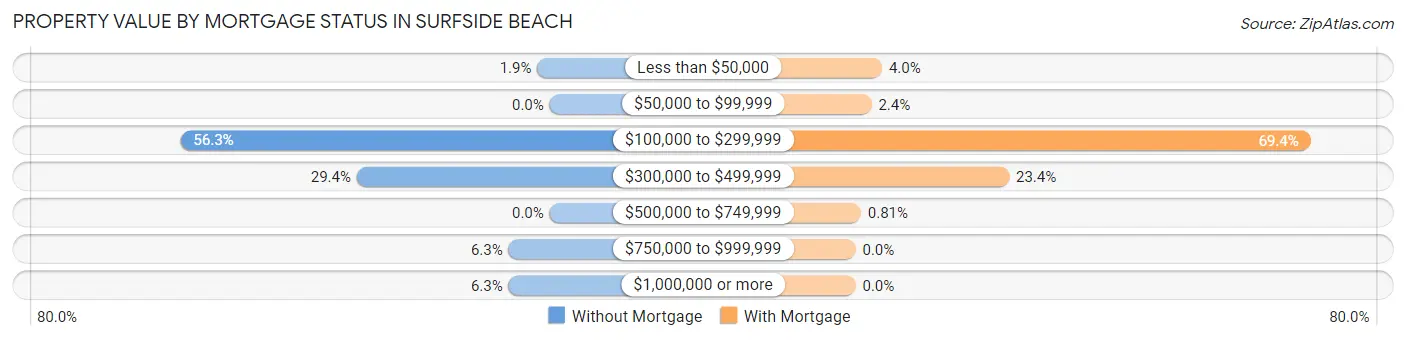
| Property Value | Without Mortgage | With Mortgage |
| Less than $50,000 | 3 (1.9%) | 5 (4.0%) |
| $50,000 to $99,999 | 0 (0.0%) | 3 (2.4%) |
| $100,000 to $299,999 | 90 (56.2%) | 86 (69.4%) |
| $300,000 to $499,999 | 47 (29.4%) | 29 (23.4%) |
| $500,000 to $749,999 | 0 (0.0%) | 1 (0.8%) |
| $750,000 to $999,999 | 10 (6.2%) | 0 (0.0%) |
| $1,000,000 or more | 10 (6.2%) | 0 (0.0%) |
| Total | 160 (100.0%) | 124 (100.0%) |
Household Income by Mortgage Status in Surfside Beach
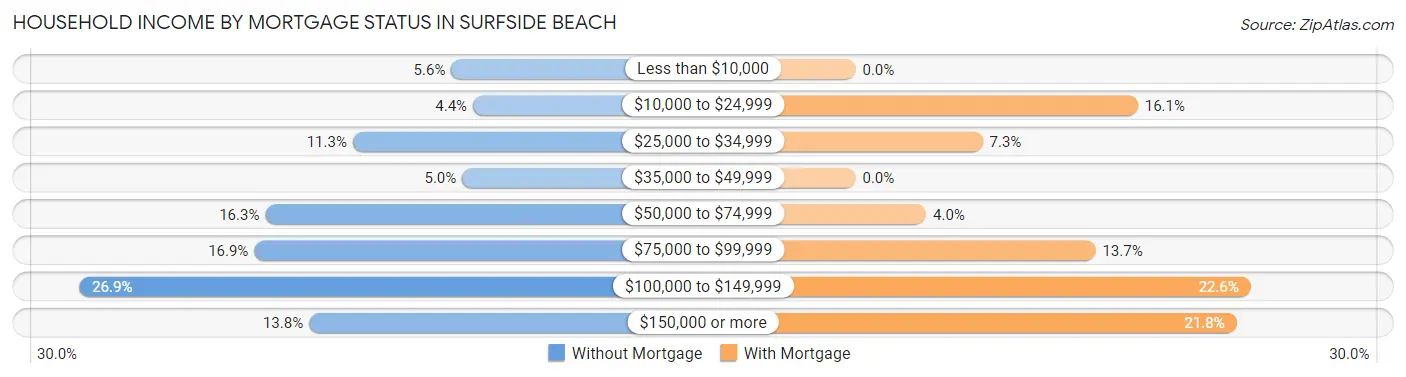
| Household Income | Without Mortgage | With Mortgage |
| Less than $10,000 | 9 (5.6%) | 0 (0.0%) |
| $10,000 to $24,999 | 7 (4.4%) | 20 (16.1%) |
| $25,000 to $34,999 | 18 (11.3%) | 9 (7.3%) |
| $35,000 to $49,999 | 8 (5.0%) | 0 (0.0%) |
| $50,000 to $74,999 | 26 (16.3%) | 5 (4.0%) |
| $75,000 to $99,999 | 27 (16.9%) | 17 (13.7%) |
| $100,000 to $149,999 | 43 (26.9%) | 28 (22.6%) |
| $150,000 or more | 22 (13.8%) | 27 (21.8%) |
| Total | 160 (100.0%) | 124 (100.0%) |
Property Value to Household Income Ratio in Surfside Beach
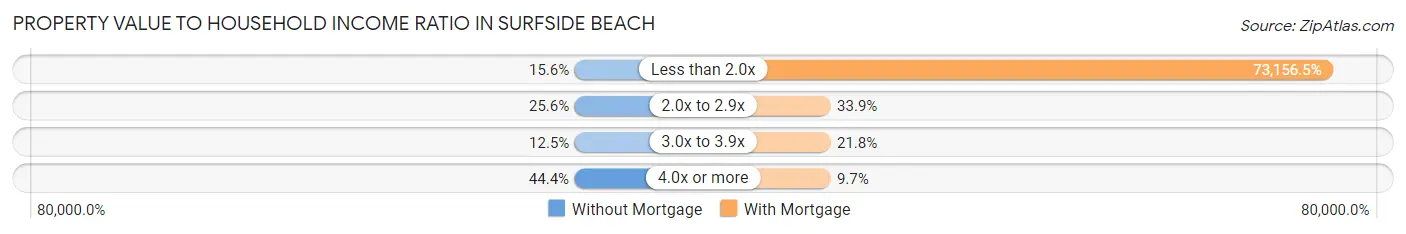
| Value-to-Income Ratio | Without Mortgage | With Mortgage |
| Less than 2.0x | 25 (15.6%) | 90,714 (73,156.4%) |
| 2.0x to 2.9x | 41 (25.6%) | 42 (33.9%) |
| 3.0x to 3.9x | 20 (12.5%) | 27 (21.8%) |
| 4.0x or more | 71 (44.4%) | 12 (9.7%) |
| Total | 160 (100.0%) | 124 (100.0%) |
Real Estate Taxes by Mortgage Status in Surfside Beach
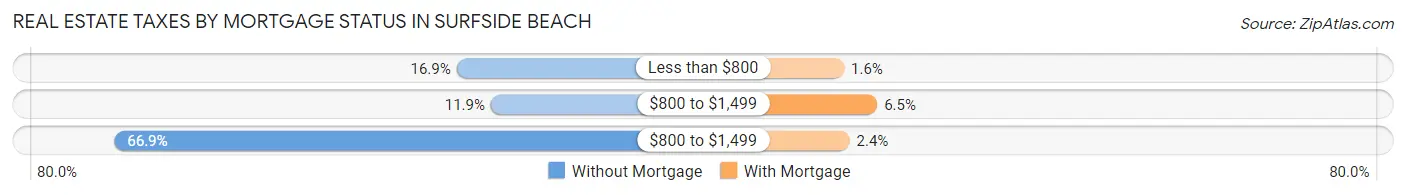
| Property Taxes | Without Mortgage | With Mortgage |
| Less than $800 | 27 (16.9%) | 2 (1.6%) |
| $800 to $1,499 | 19 (11.9%) | 8 (6.5%) |
| $800 to $1,499 | 107 (66.9%) | 3 (2.4%) |
| Total | 160 (100.0%) | 124 (100.0%) |
Health & Disability in Surfside Beach
Health Insurance Coverage by Age in Surfside Beach
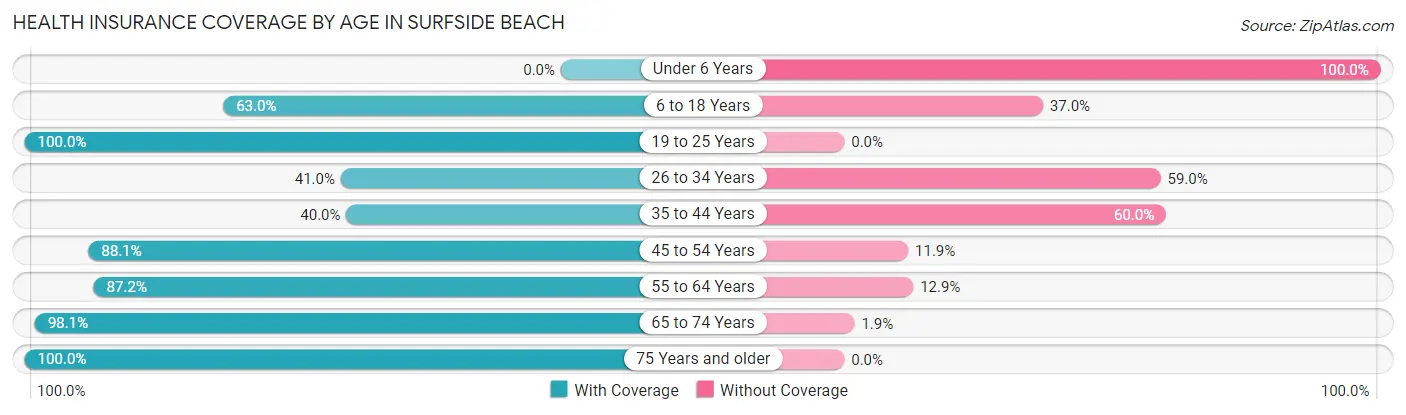
| Age Bracket | With Coverage | Without Coverage |
| Under 6 Years | 0 (0.0%) | 8 (100.0%) |
| 6 to 18 Years | 17 (63.0%) | 10 (37.0%) |
| 19 to 25 Years | 62 (100.0%) | 0 (0.0%) |
| 26 to 34 Years | 16 (41.0%) | 23 (59.0%) |
| 35 to 44 Years | 18 (40.0%) | 27 (60.0%) |
| 45 to 54 Years | 37 (88.1%) | 5 (11.9%) |
| 55 to 64 Years | 156 (87.2%) | 23 (12.9%) |
| 65 to 74 Years | 155 (98.1%) | 3 (1.9%) |
| 75 Years and older | 57 (100.0%) | 0 (0.0%) |
| Total | 518 (84.0%) | 99 (16.1%) |
Health Insurance Coverage by Citizenship Status in Surfside Beach
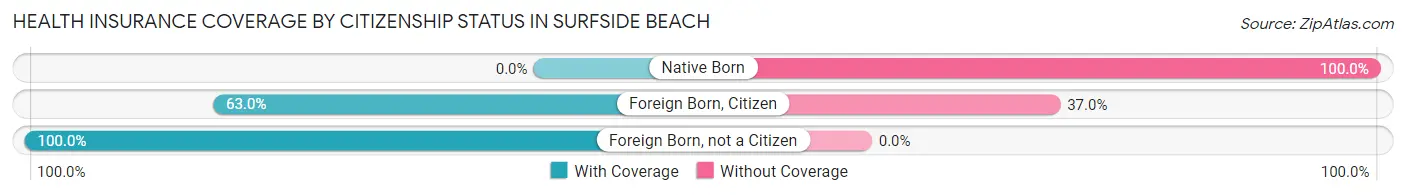
| Citizenship Status | With Coverage | Without Coverage |
| Native Born | 0 (0.0%) | 8 (100.0%) |
| Foreign Born, Citizen | 17 (63.0%) | 10 (37.0%) |
| Foreign Born, not a Citizen | 62 (100.0%) | 0 (0.0%) |
Health Insurance Coverage by Household Income in Surfside Beach
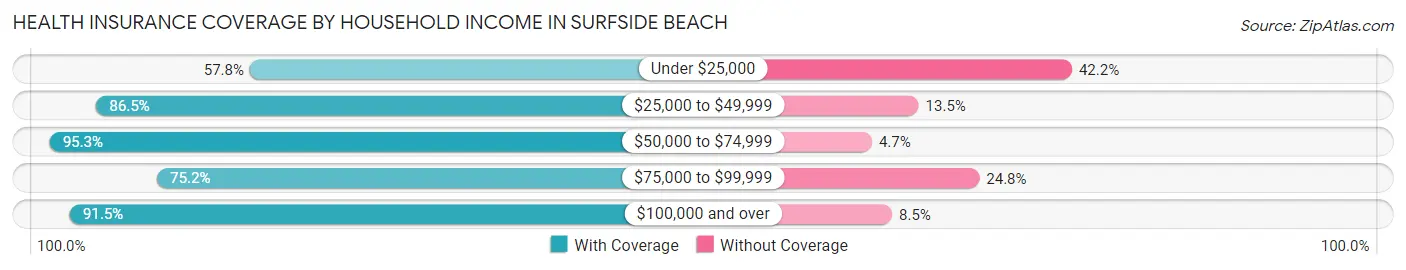
| Household Income | With Coverage | Without Coverage |
| Under $25,000 | 37 (57.8%) | 27 (42.2%) |
| $25,000 to $49,999 | 45 (86.5%) | 7 (13.5%) |
| $50,000 to $74,999 | 81 (95.3%) | 4 (4.7%) |
| $75,000 to $99,999 | 118 (75.2%) | 39 (24.8%) |
| $100,000 and over | 237 (91.5%) | 22 (8.5%) |
Public vs Private Health Insurance Coverage by Age in Surfside Beach
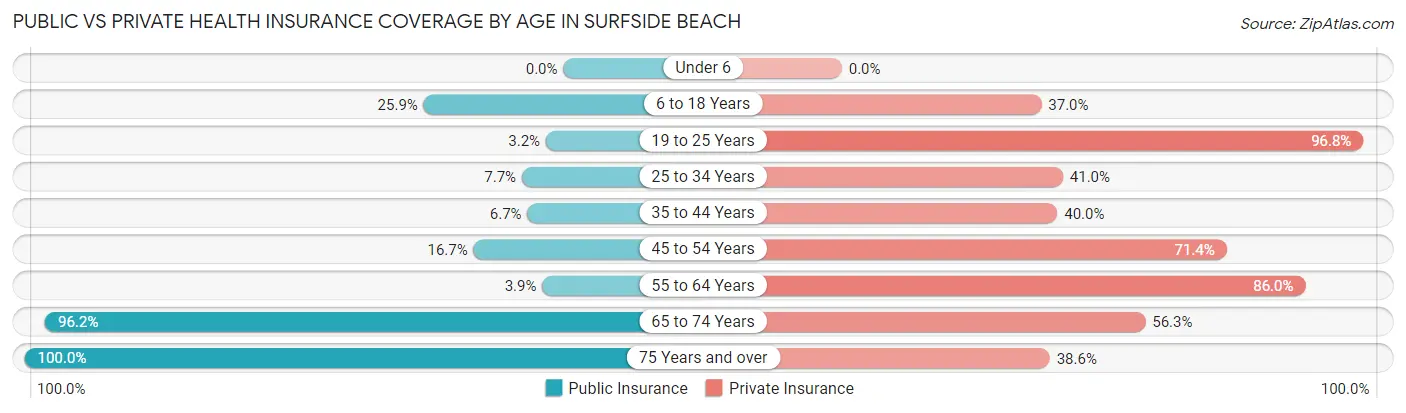
| Age Bracket | Public Insurance | Private Insurance |
| Under 6 | 0 (0.0%) | 0 (0.0%) |
| 6 to 18 Years | 7 (25.9%) | 10 (37.0%) |
| 19 to 25 Years | 2 (3.2%) | 60 (96.8%) |
| 25 to 34 Years | 3 (7.7%) | 16 (41.0%) |
| 35 to 44 Years | 3 (6.7%) | 18 (40.0%) |
| 45 to 54 Years | 7 (16.7%) | 30 (71.4%) |
| 55 to 64 Years | 7 (3.9%) | 154 (86.0%) |
| 65 to 74 Years | 152 (96.2%) | 89 (56.3%) |
| 75 Years and over | 57 (100.0%) | 22 (38.6%) |
| Total | 238 (38.6%) | 399 (64.7%) |
Disability Status by Sex by Age in Surfside Beach
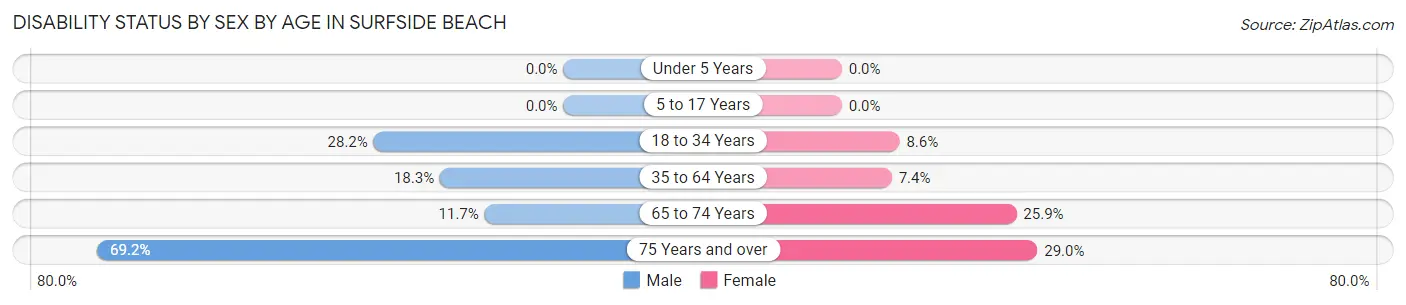
| Age Bracket | Male | Female |
| Under 5 Years | 0 (0.0%) | 0 (0.0%) |
| 5 to 17 Years | 0 (0.0%) | 0 (0.0%) |
| 18 to 34 Years | 20 (28.2%) | 3 (8.6%) |
| 35 to 64 Years | 24 (18.3%) | 10 (7.4%) |
| 65 to 74 Years | 9 (11.7%) | 21 (25.9%) |
| 75 Years and over | 18 (69.2%) | 9 (29.0%) |
Disability Class by Sex by Age in Surfside Beach
Disability Class: Hearing Difficulty
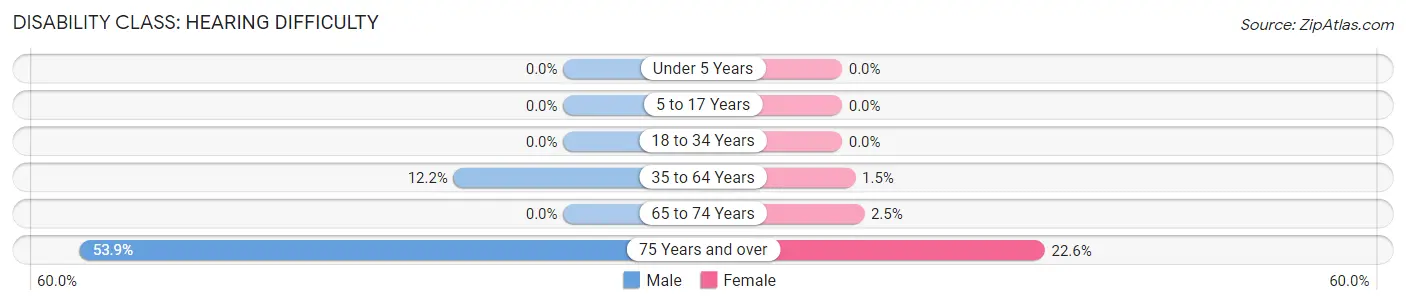
| Age Bracket | Male | Female |
| Under 5 Years | 0 (0.0%) | 0 (0.0%) |
| 5 to 17 Years | 0 (0.0%) | 0 (0.0%) |
| 18 to 34 Years | 0 (0.0%) | 0 (0.0%) |
| 35 to 64 Years | 16 (12.2%) | 2 (1.5%) |
| 65 to 74 Years | 0 (0.0%) | 2 (2.5%) |
| 75 Years and over | 14 (53.8%) | 7 (22.6%) |
Disability Class: Vision Difficulty
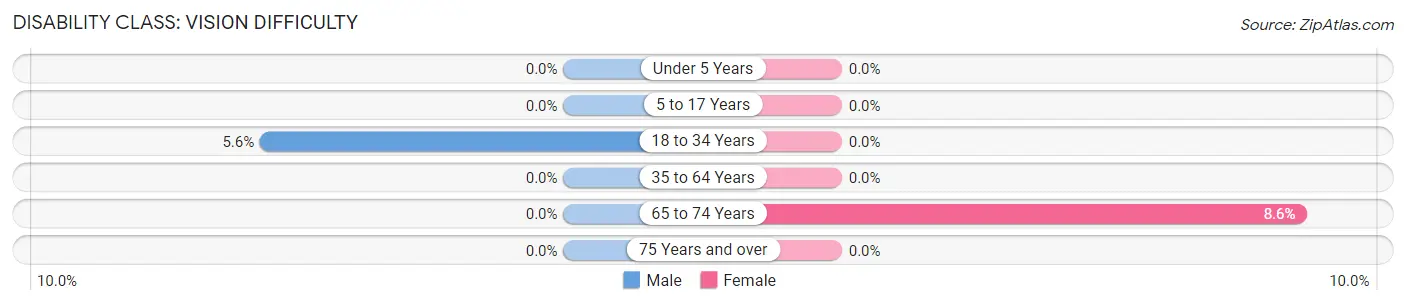
| Age Bracket | Male | Female |
| Under 5 Years | 0 (0.0%) | 0 (0.0%) |
| 5 to 17 Years | 0 (0.0%) | 0 (0.0%) |
| 18 to 34 Years | 4 (5.6%) | 0 (0.0%) |
| 35 to 64 Years | 0 (0.0%) | 0 (0.0%) |
| 65 to 74 Years | 0 (0.0%) | 7 (8.6%) |
| 75 Years and over | 0 (0.0%) | 0 (0.0%) |
Disability Class: Cognitive Difficulty
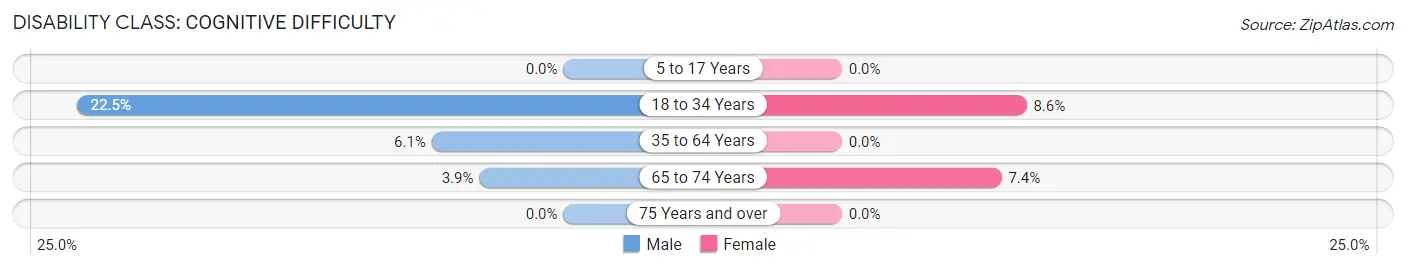
| Age Bracket | Male | Female |
| 5 to 17 Years | 0 (0.0%) | 0 (0.0%) |
| 18 to 34 Years | 16 (22.5%) | 3 (8.6%) |
| 35 to 64 Years | 8 (6.1%) | 0 (0.0%) |
| 65 to 74 Years | 3 (3.9%) | 6 (7.4%) |
| 75 Years and over | 0 (0.0%) | 0 (0.0%) |
Disability Class: Ambulatory Difficulty
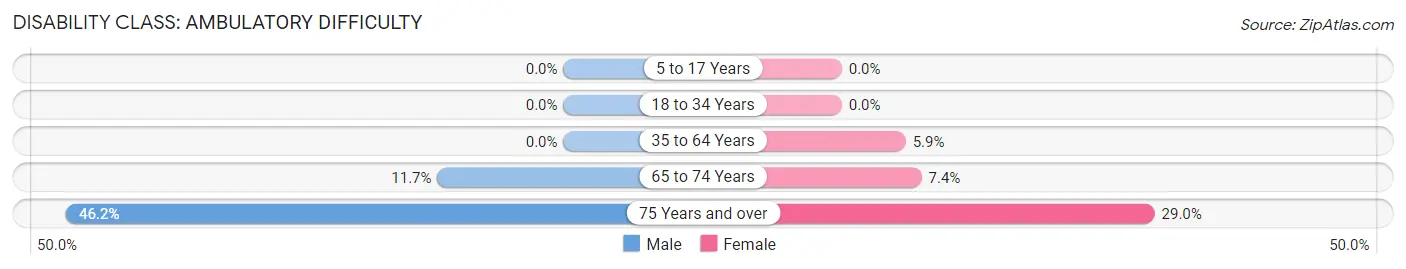
| Age Bracket | Male | Female |
| 5 to 17 Years | 0 (0.0%) | 0 (0.0%) |
| 18 to 34 Years | 0 (0.0%) | 0 (0.0%) |
| 35 to 64 Years | 0 (0.0%) | 8 (5.9%) |
| 65 to 74 Years | 9 (11.7%) | 6 (7.4%) |
| 75 Years and over | 12 (46.2%) | 9 (29.0%) |
Disability Class: Self-Care Difficulty
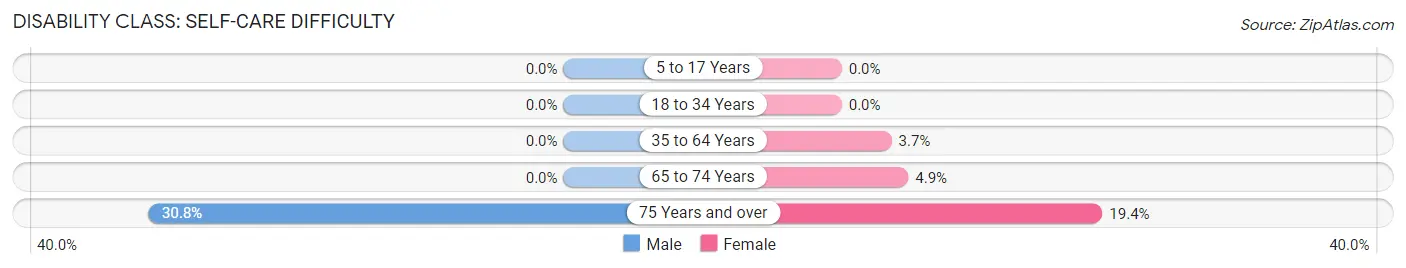
| Age Bracket | Male | Female |
| 5 to 17 Years | 0 (0.0%) | 0 (0.0%) |
| 18 to 34 Years | 0 (0.0%) | 0 (0.0%) |
| 35 to 64 Years | 0 (0.0%) | 5 (3.7%) |
| 65 to 74 Years | 0 (0.0%) | 4 (4.9%) |
| 75 Years and over | 8 (30.8%) | 6 (19.4%) |
Technology Access in Surfside Beach
Computing Device Access in Surfside Beach
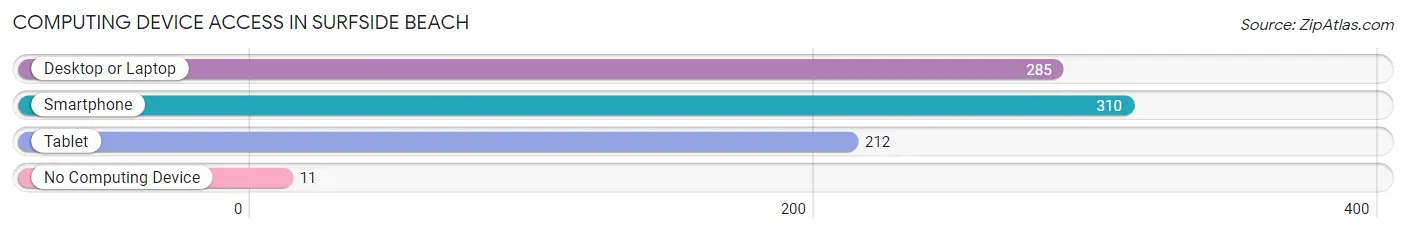
| Device Type | # Households | % Households |
| Desktop or Laptop | 285 | 82.1% |
| Smartphone | 310 | 89.3% |
| Tablet | 212 | 61.1% |
| No Computing Device | 11 | 3.2% |
| Total | 347 | 100.0% |
Internet Access in Surfside Beach
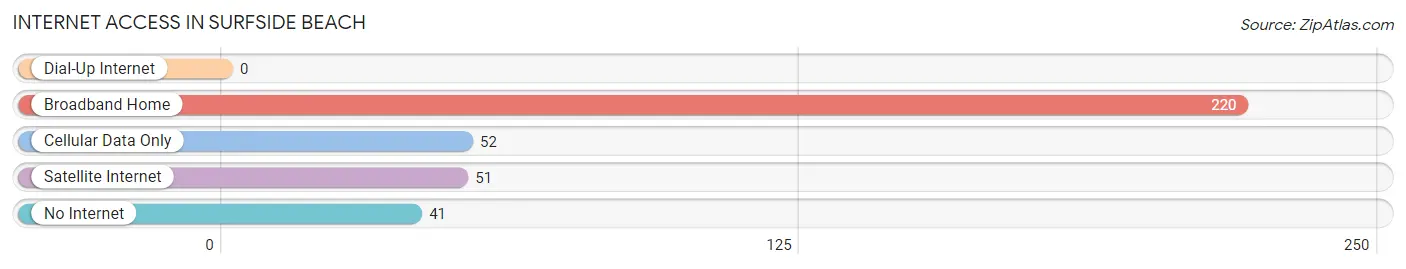
| Internet Type | # Households | % Households |
| Dial-Up Internet | 0 | 0.0% |
| Broadband Home | 220 | 63.4% |
| Cellular Data Only | 52 | 15.0% |
| Satellite Internet | 51 | 14.7% |
| No Internet | 41 | 11.8% |
| Total | 347 | 100.0% |
Surfside Beach Summary
Surfside Beach is a small town located in Brazoria County, Texas, United States. It is situated on the Gulf of Mexico, approximately 50 miles south of Houston. The town has a population of approximately 2,500 people and is a popular tourist destination due to its beautiful beaches and proximity to the city of Houston.
History
Surfside Beach was originally inhabited by the Karankawa Indians, who were known for their nomadic lifestyle and their use of dugout canoes. The first European settlers arrived in the area in the early 1800s, and the town was officially established in 1873. The town was named after the nearby Surfside Beach, which was a popular spot for swimming and fishing.
In the early 1900s, the town began to grow as a popular tourist destination. The first hotel was built in 1910, and the town was incorporated in 1911. The town was also home to a number of businesses, including a post office, a bank, and a movie theater.
In the 1950s, the town began to experience a decline in population as people moved away to larger cities. However, in the 1970s, the town began to experience a resurgence in popularity as a tourist destination. The town was also home to a number of popular restaurants and bars, which helped to attract visitors.
Geography
Surfside Beach is located on the Gulf of Mexico, approximately 50 miles south of Houston. The town is situated on a peninsula, which is bordered by the Gulf of Mexico to the east and the San Bernard River to the west. The town is also located near the Brazoria National Wildlife Refuge, which is home to a variety of wildlife, including alligators, turtles, and birds.
The town has a humid subtropical climate, with hot summers and mild winters. The average temperature in the summer is around 90 degrees Fahrenheit, and the average temperature in the winter is around 60 degrees Fahrenheit.
Economy
The economy of Surfside Beach is largely based on tourism. The town is home to a number of hotels, restaurants, and bars, which attract visitors from all over the world. The town is also home to a number of retail stores, which sell souvenirs and other items related to the beach.
The town is also home to a number of businesses, including a post office, a bank, and a movie theater. The town is also home to a number of fishing charters, which offer visitors the opportunity to go fishing in the Gulf of Mexico.
Demographics
As of the 2010 census, the population of Surfside Beach was 2,500. The town is predominantly white, with approximately 75% of the population being white. The town is also home to a small Hispanic population, with approximately 10% of the population being Hispanic. The town is also home to a small African American population, with approximately 5% of the population being African American.
The median household income in Surfside Beach is approximately $50,000, and the median home value is approximately $200,000. The town has a low unemployment rate, with approximately 4% of the population being unemployed. The town also has a low crime rate, with the majority of crimes being property crimes.
Common Questions
What is the Total Population of Surfside Beach?
Total Population of Surfside Beach is 617.
What is the Total Male Population of Surfside Beach?
Total Male Population of Surfside Beach is 328.
What is the Total Female Population of Surfside Beach?
Total Female Population of Surfside Beach is 289.
What is the Ratio of Males per 100 Females in Surfside Beach?
There are 113.49 Males per 100 Females in Surfside Beach.
What is the Ratio of Females per 100 Males in Surfside Beach?
There are 88.11 Females per 100 Males in Surfside Beach.
What is the Median Population Age in Surfside Beach?
Median Population Age in Surfside Beach is 62.1 Years.
What is the Average Family Size in Surfside Beach
Average Family Size in Surfside Beach is 2.3 People.
What is the Average Household Size in Surfside Beach
Average Household Size in Surfside Beach is 1.8 People.
What is Per Capita Income in Surfside Beach?
Per Capita income in Surfside Beach is $50,717.
What is the Median Family Income in Surfside Beach?
Median Family Income in Surfside Beach is $102,708.
What is the Median Household income in Surfside Beach?
Median Household Income in Surfside Beach is $86,544.
What is Income or Wage Gap in Surfside Beach?
Income or Wage Gap in Surfside Beach is 68.5%.
Women in Surfside Beach earn 31.5 cents for every dollar earned by a man.
What is Inequality or Gini Index in Surfside Beach?
Inequality or Gini Index in Surfside Beach is 0.39.
How Large is the Labor Force in Surfside Beach?
There are 304 People in the Labor Forcein in Surfside Beach.
What is the Percentage of People in the Labor Force in Surfside Beach?
51.6% of People are in the Labor Force in Surfside Beach.
What is the Unemployment Rate in Surfside Beach?
Unemployment Rate in Surfside Beach is 5.9%.