Briarcliff, TX
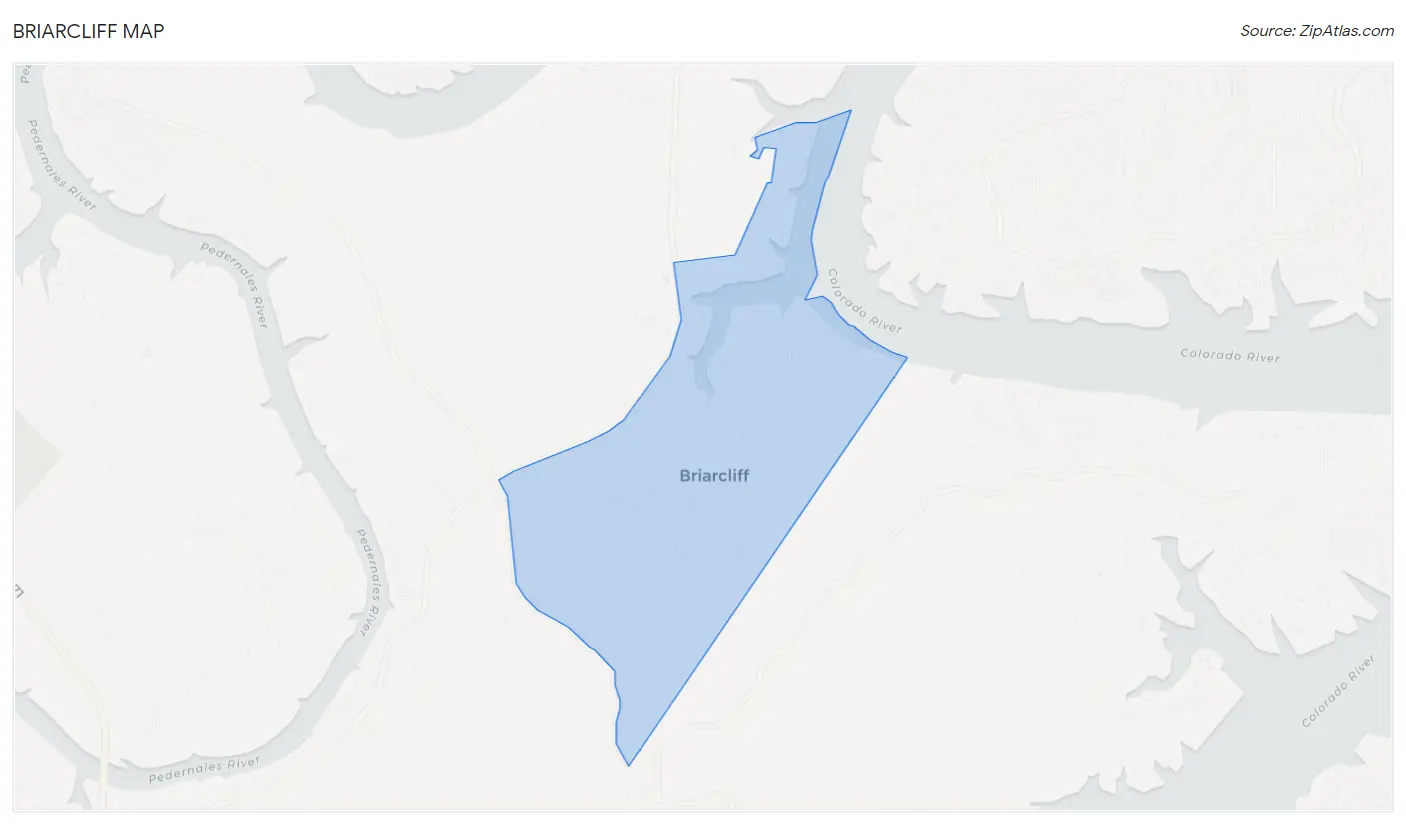
Briarcliff Map
Briarcliff Overview
2,273
TOTAL POPULATION
1,119
MALE POPULATION
1,154
FEMALE POPULATION
96.97
MALES / 100 FEMALES
103.13
FEMALES / 100 MALES
45.3
MEDIAN AGE
2.9
AVG FAMILY SIZE
2.6
AVG HOUSEHOLD SIZE
$52,635
PER CAPITA INCOME
$131,625
AVG FAMILY INCOME
$123,000
AVG HOUSEHOLD INCOME
14.7%
WAGE / INCOME GAP [ % ]
85.3¢/ $1
WAGE / INCOME GAP [ $ ]
0.34
INEQUALITY / GINI INDEX
1,140
LABOR FORCE [ PEOPLE ]
66.5%
PERCENT IN LABOR FORCE
2.0%
UNEMPLOYMENT RATE
Race in Briarcliff
The most populous races in Briarcliff are White / Caucasian (1,945 | 85.6%), Hispanic or Latino (452 | 19.9%), and Two or more Races (135 | 5.9%).
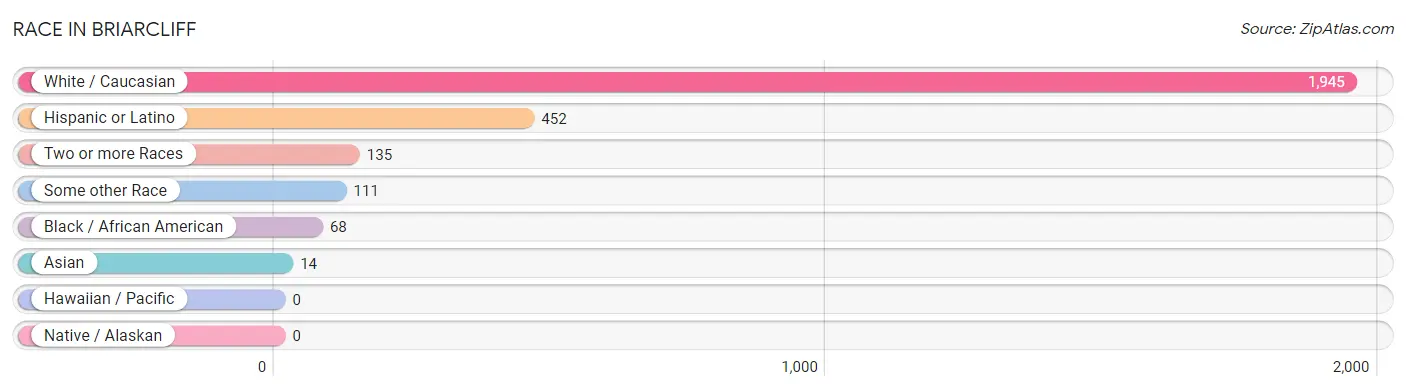
| Race | # Population | % Population |
| Asian | 14 | 0.6% |
| Black / African American | 68 | 3.0% |
| Hawaiian / Pacific | 0 | 0.0% |
| Hispanic or Latino | 452 | 19.9% |
| Native / Alaskan | 0 | 0.0% |
| White / Caucasian | 1,945 | 85.6% |
| Two or more Races | 135 | 5.9% |
| Some other Race | 111 | 4.9% |
| Total | 2,273 | 100.0% |
Ancestry in Briarcliff
The most populous ancestries reported in Briarcliff are English (508 | 22.4%), Mexican (424 | 18.6%), German (419 | 18.4%), Irish (312 | 13.7%), and Polish (133 | 5.9%), together accounting for 79.0% of all Briarcliff residents.
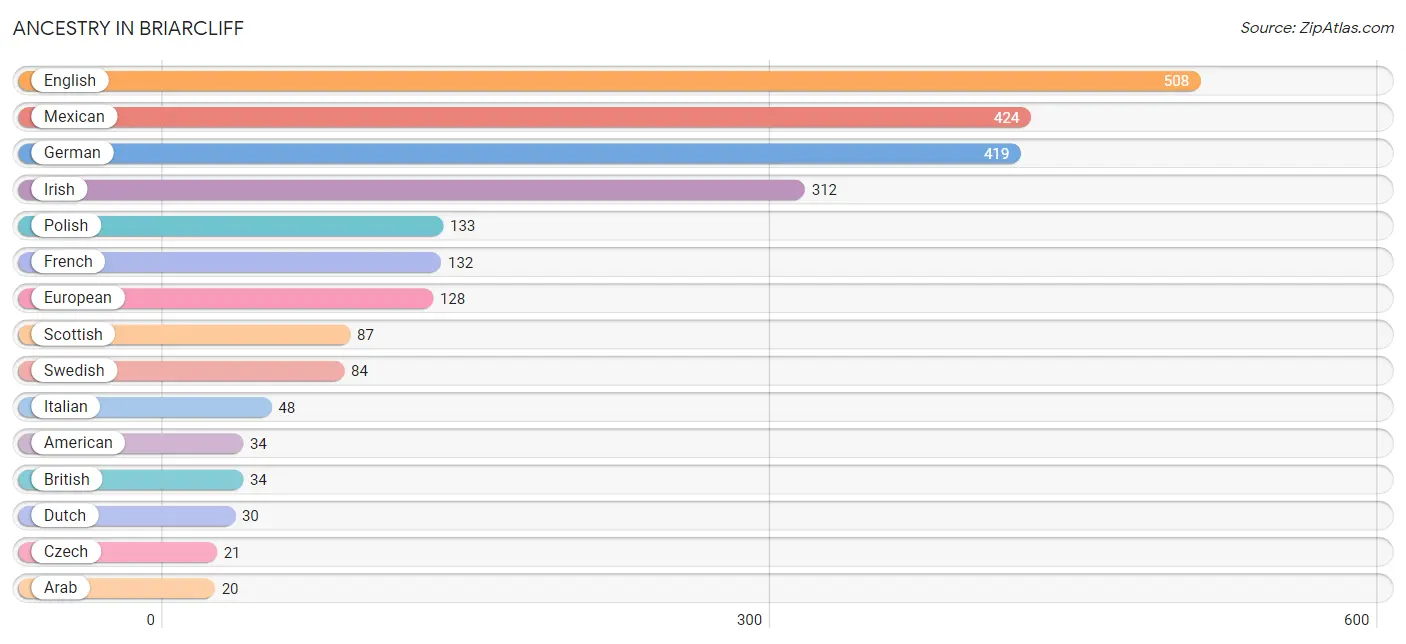
| Ancestry | # Population | % Population |
| American | 34 | 1.5% |
| Arab | 20 | 0.9% |
| Austrian | 11 | 0.5% |
| Bhutanese | 4 | 0.2% |
| British | 34 | 1.5% |
| Cajun | 8 | 0.4% |
| Canadian | 3 | 0.1% |
| Colombian | 13 | 0.6% |
| Czech | 21 | 0.9% |
| Czechoslovakian | 2 | 0.1% |
| Delaware | 4 | 0.2% |
| Dutch | 30 | 1.3% |
| English | 508 | 22.4% |
| European | 128 | 5.6% |
| French | 132 | 5.8% |
| French Canadian | 15 | 0.7% |
| German | 419 | 18.4% |
| Greek | 9 | 0.4% |
| Irish | 312 | 13.7% |
| Italian | 48 | 2.1% |
| Lebanese | 20 | 0.9% |
| Malaysian | 10 | 0.4% |
| Mexican | 424 | 18.6% |
| Norwegian | 19 | 0.8% |
| Polish | 133 | 5.9% |
| Portuguese | 3 | 0.1% |
| Russian | 9 | 0.4% |
| Scandinavian | 12 | 0.5% |
| Scotch-Irish | 13 | 0.6% |
| Scottish | 87 | 3.8% |
| South American | 13 | 0.6% |
| Spaniard | 15 | 0.7% |
| Swedish | 84 | 3.7% |
| Swiss | 5 | 0.2% | View All 34 Rows |
Immigrants in Briarcliff
The most numerous immigrant groups reported in Briarcliff came from Central America (63 | 2.8%), Latin America (63 | 2.8%), Mexico (63 | 2.8%), Europe (42 | 1.8%), and Eastern Europe (28 | 1.2%), together accounting for 11.4% of all Briarcliff residents.
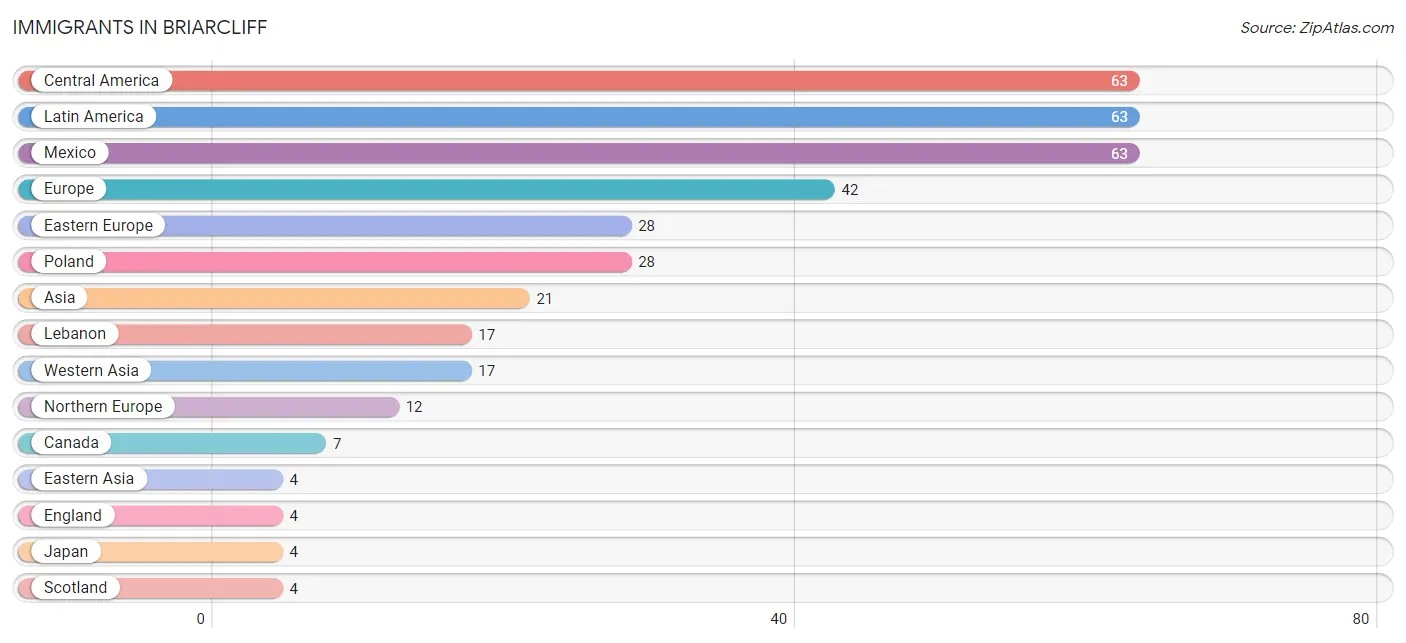
| Immigration Origin | # Population | % Population |
| Asia | 21 | 0.9% |
| Canada | 7 | 0.3% |
| Central America | 63 | 2.8% |
| Eastern Asia | 4 | 0.2% |
| Eastern Europe | 28 | 1.2% |
| England | 4 | 0.2% |
| Europe | 42 | 1.8% |
| Germany | 2 | 0.1% |
| Japan | 4 | 0.2% |
| Latin America | 63 | 2.8% |
| Lebanon | 17 | 0.7% |
| Mexico | 63 | 2.8% |
| Northern Europe | 12 | 0.5% |
| Poland | 28 | 1.2% |
| Scotland | 4 | 0.2% |
| Western Asia | 17 | 0.7% |
| Western Europe | 2 | 0.1% | View All 17 Rows |
Sex and Age in Briarcliff
Sex and Age in Briarcliff
The most populous age groups in Briarcliff are 60 to 64 Years (172 | 15.4%) for men and 60 to 64 Years (140 | 12.1%) for women.
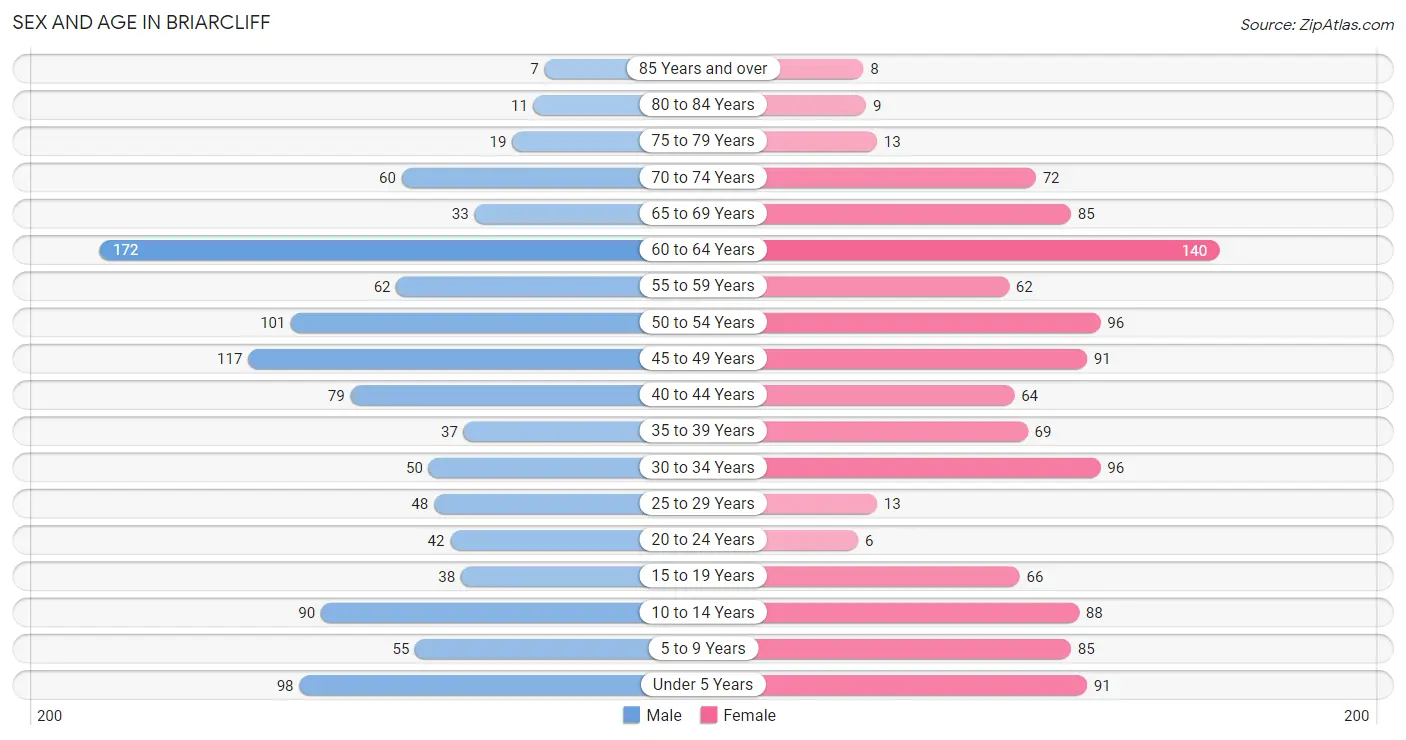
| Age Bracket | Male | Female |
| Under 5 Years | 98 (8.8%) | 91 (7.9%) |
| 5 to 9 Years | 55 (4.9%) | 85 (7.4%) |
| 10 to 14 Years | 90 (8.0%) | 88 (7.6%) |
| 15 to 19 Years | 38 (3.4%) | 66 (5.7%) |
| 20 to 24 Years | 42 (3.7%) | 6 (0.5%) |
| 25 to 29 Years | 48 (4.3%) | 13 (1.1%) |
| 30 to 34 Years | 50 (4.5%) | 96 (8.3%) |
| 35 to 39 Years | 37 (3.3%) | 69 (6.0%) |
| 40 to 44 Years | 79 (7.1%) | 64 (5.6%) |
| 45 to 49 Years | 117 (10.5%) | 91 (7.9%) |
| 50 to 54 Years | 101 (9.0%) | 96 (8.3%) |
| 55 to 59 Years | 62 (5.5%) | 62 (5.4%) |
| 60 to 64 Years | 172 (15.4%) | 140 (12.1%) |
| 65 to 69 Years | 33 (2.9%) | 85 (7.4%) |
| 70 to 74 Years | 60 (5.4%) | 72 (6.2%) |
| 75 to 79 Years | 19 (1.7%) | 13 (1.1%) |
| 80 to 84 Years | 11 (1.0%) | 9 (0.8%) |
| 85 Years and over | 7 (0.6%) | 8 (0.7%) |
| Total | 1,119 (100.0%) | 1,154 (100.0%) |
Families and Households in Briarcliff
Median Family Size in Briarcliff
The median family size in Briarcliff is 2.90 persons per family, with married-couple families (552 | 80.3%) accounting for the largest median family size of 2.99 persons per family. On the other hand, single male/father families (31 | 4.5%) represent the smallest median family size with 2.06 persons per family.
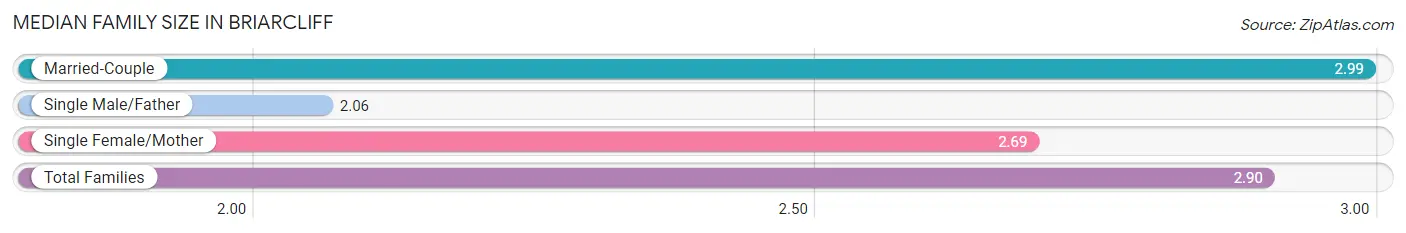
| Family Type | # Families | Family Size |
| Married-Couple | 552 (80.3%) | 2.99 |
| Single Male/Father | 31 (4.5%) | 2.06 |
| Single Female/Mother | 104 (15.1%) | 2.69 |
| Total Families | 687 (100.0%) | 2.90 |
Median Household Size in Briarcliff
The median household size in Briarcliff is 2.59 persons per household, with single female/mother households (104 | 11.9%) accounting for the largest median household size of 3.02 persons per household. non-family households (189 | 21.6%) represent the smallest median household size with 1.31 persons per household.
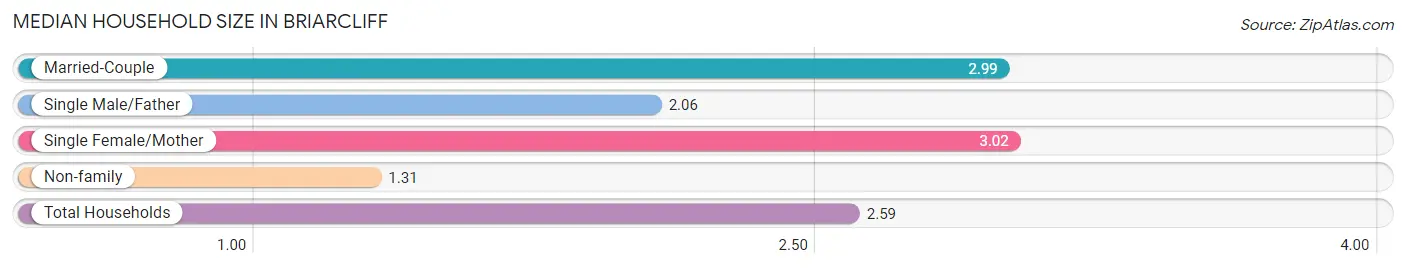
| Household Type | # Households | Household Size |
| Married-Couple | 552 (63.0%) | 2.99 |
| Single Male/Father | 31 (3.5%) | 2.06 |
| Single Female/Mother | 104 (11.9%) | 3.02 |
| Non-family | 189 (21.6%) | 1.31 |
| Total Households | 876 (100.0%) | 2.59 |
Household Size by Marriage Status in Briarcliff
Out of a total of 876 households in Briarcliff, 687 (78.4%) are family households, while 189 (21.6%) are nonfamily households. The most numerous type of family households are 2-person households, comprising 338, and the most common type of nonfamily households are 1-person households, comprising 138.
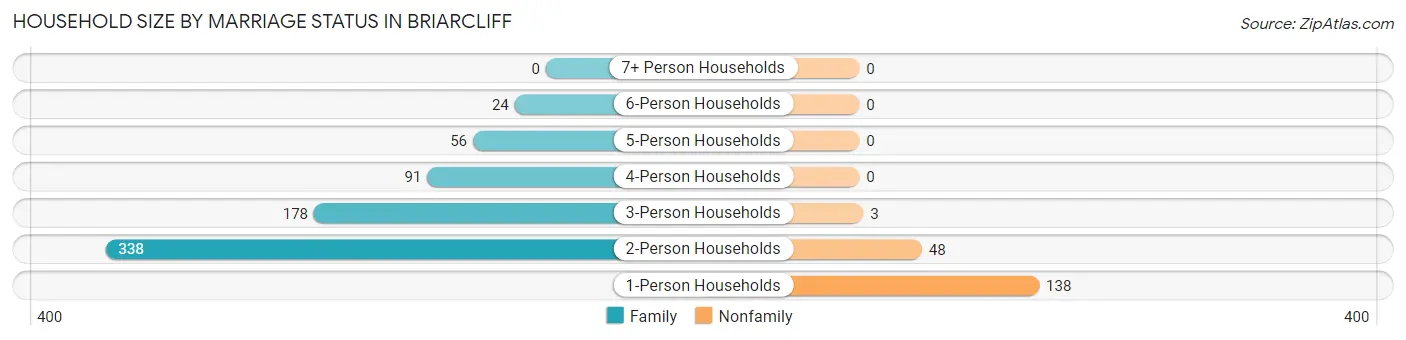
| Household Size | Family Households | Nonfamily Households |
| 1-Person Households | - | 138 (15.8%) |
| 2-Person Households | 338 (38.6%) | 48 (5.5%) |
| 3-Person Households | 178 (20.3%) | 3 (0.3%) |
| 4-Person Households | 91 (10.4%) | 0 (0.0%) |
| 5-Person Households | 56 (6.4%) | 0 (0.0%) |
| 6-Person Households | 24 (2.7%) | 0 (0.0%) |
| 7+ Person Households | 0 (0.0%) | 0 (0.0%) |
| Total | 687 (78.4%) | 189 (21.6%) |
Female Fertility in Briarcliff
Fertility by Age in Briarcliff
Average fertility rate in Briarcliff is 139.0 births per 1,000 women. Women in the age bracket of 35 to 50 years have the highest fertility rate with 202.0 births per 1,000 women. Women in the age bracket of 35 to 50 years acount for 83.1% of all women with births.
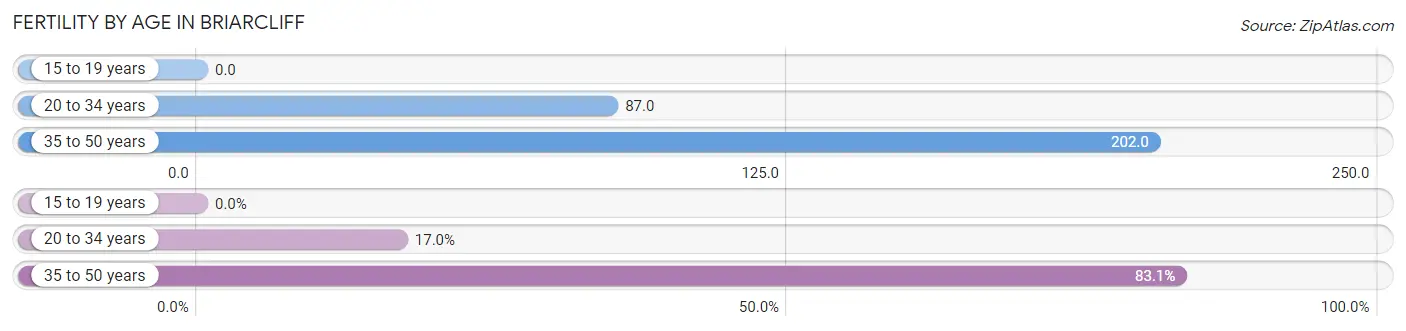
| Age Bracket | Women with Births | Births / 1,000 Women |
| 15 to 19 years | 0 (0.0%) | 0.0 |
| 20 to 34 years | 10 (17.0%) | 87.0 |
| 35 to 50 years | 49 (83.1%) | 202.0 |
| Total | 59 (100.0%) | 139.0 |
Fertility by Age by Marriage Status in Briarcliff
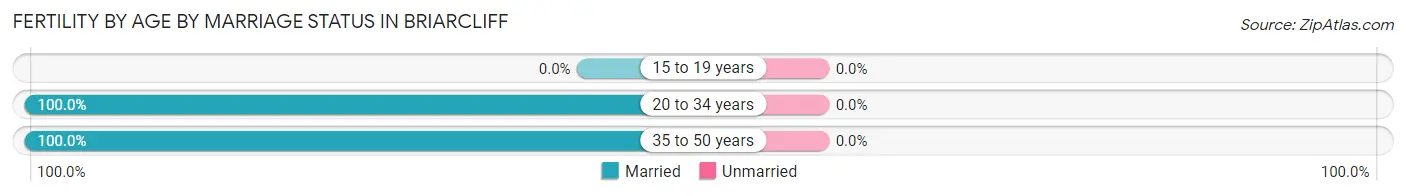
| Age Bracket | Married | Unmarried |
| 15 to 19 years | 0 (0.0%) | 0 (0.0%) |
| 20 to 34 years | 10 (100.0%) | 0 (0.0%) |
| 35 to 50 years | 49 (100.0%) | 0 (0.0%) |
| Total | 59 (100.0%) | 0 (0.0%) |
Fertility by Education in Briarcliff
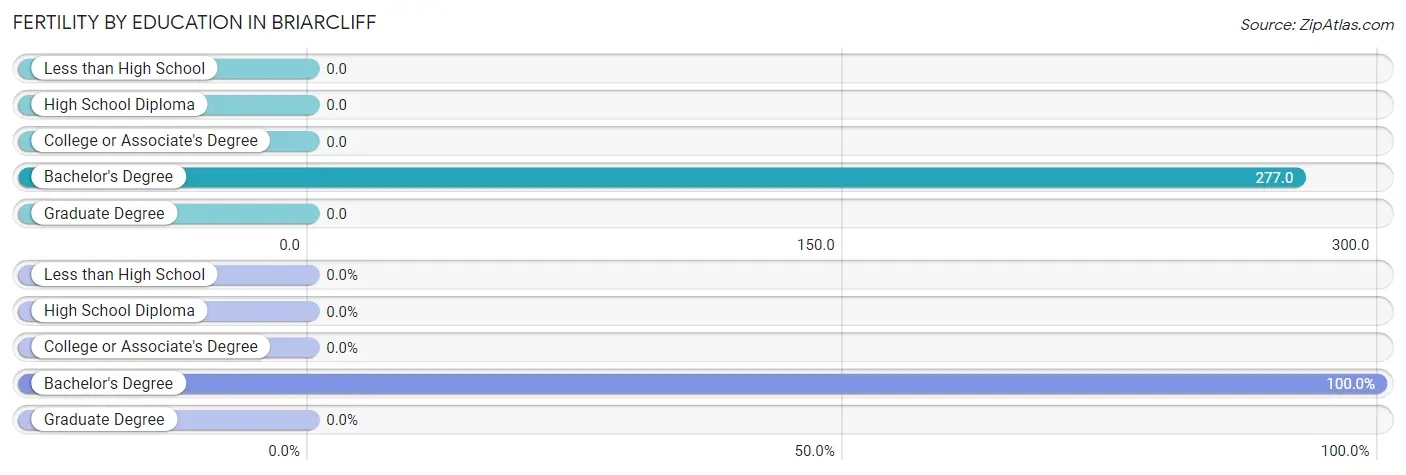
| Educational Attainment | Women with Births | Births / 1,000 Women |
| Less than High School | 0 (0.0%) | 0.0 |
| High School Diploma | 0 (0.0%) | 0.0 |
| College or Associate's Degree | 0 (0.0%) | 0.0 |
| Bachelor's Degree | 59 (100.0%) | 277.0 |
| Graduate Degree | 0 (0.0%) | 0.0 |
| Total | 59 (100.0%) | 139.0 |
Fertility by Education by Marriage Status in Briarcliff
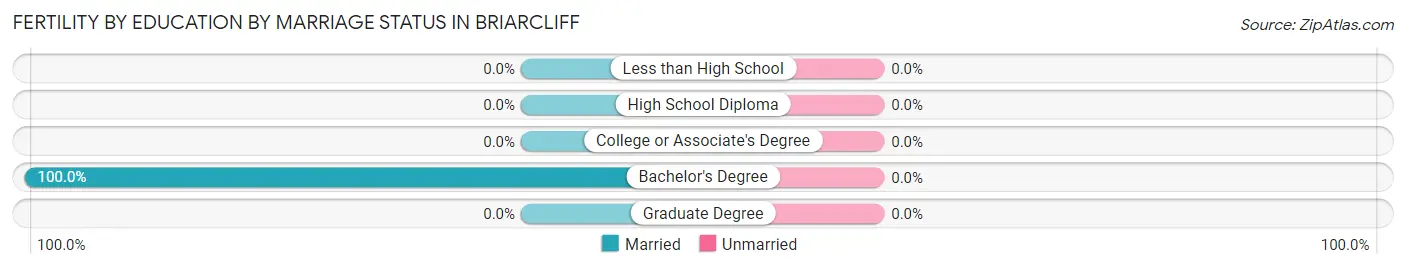
| Educational Attainment | Married | Unmarried |
| Less than High School | 0 (0.0%) | 0 (0.0%) |
| High School Diploma | 0 (0.0%) | 0 (0.0%) |
| College or Associate's Degree | 0 (0.0%) | 0 (0.0%) |
| Bachelor's Degree | 59 (100.0%) | 0 (0.0%) |
| Graduate Degree | 0 (0.0%) | 0 (0.0%) |
| Total | 59 (100.0%) | 0 (0.0%) |
Income in Briarcliff
Income Overview in Briarcliff
Per Capita Income in Briarcliff is $52,635, while median incomes of families and households are $131,625 and $123,000 respectively.
| Characteristic | Number | Measure |
| Per Capita Income | 2,273 | $52,635 |
| Median Family Income | 687 | $131,625 |
| Mean Family Income | 687 | $142,349 |
| Median Household Income | 876 | $123,000 |
| Mean Household Income | 876 | $133,770 |
| Income Deficit | 687 | $0 |
| Wage / Income Gap (%) | 2,273 | 14.74% |
| Wage / Income Gap ($) | 2,273 | 85.26¢ per $1 |
| Gini / Inequality Index | 2,273 | 0.34 |
Earnings by Sex in Briarcliff
Average Earnings in Briarcliff are $68,092, $70,000 for men and $59,683 for women, a difference of 14.7%.
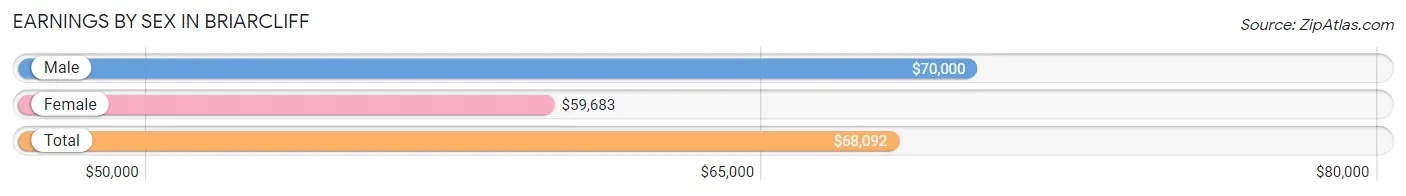
| Sex | Number | Average Earnings |
| Male | 628 (51.4%) | $70,000 |
| Female | 594 (48.6%) | $59,683 |
| Total | 1,222 (100.0%) | $68,092 |
Earnings by Sex by Income Bracket in Briarcliff
The most common earnings brackets in Briarcliff are $100,000+ for men (192 | 30.6%) and $100,000+ for women (125 | 21.0%).
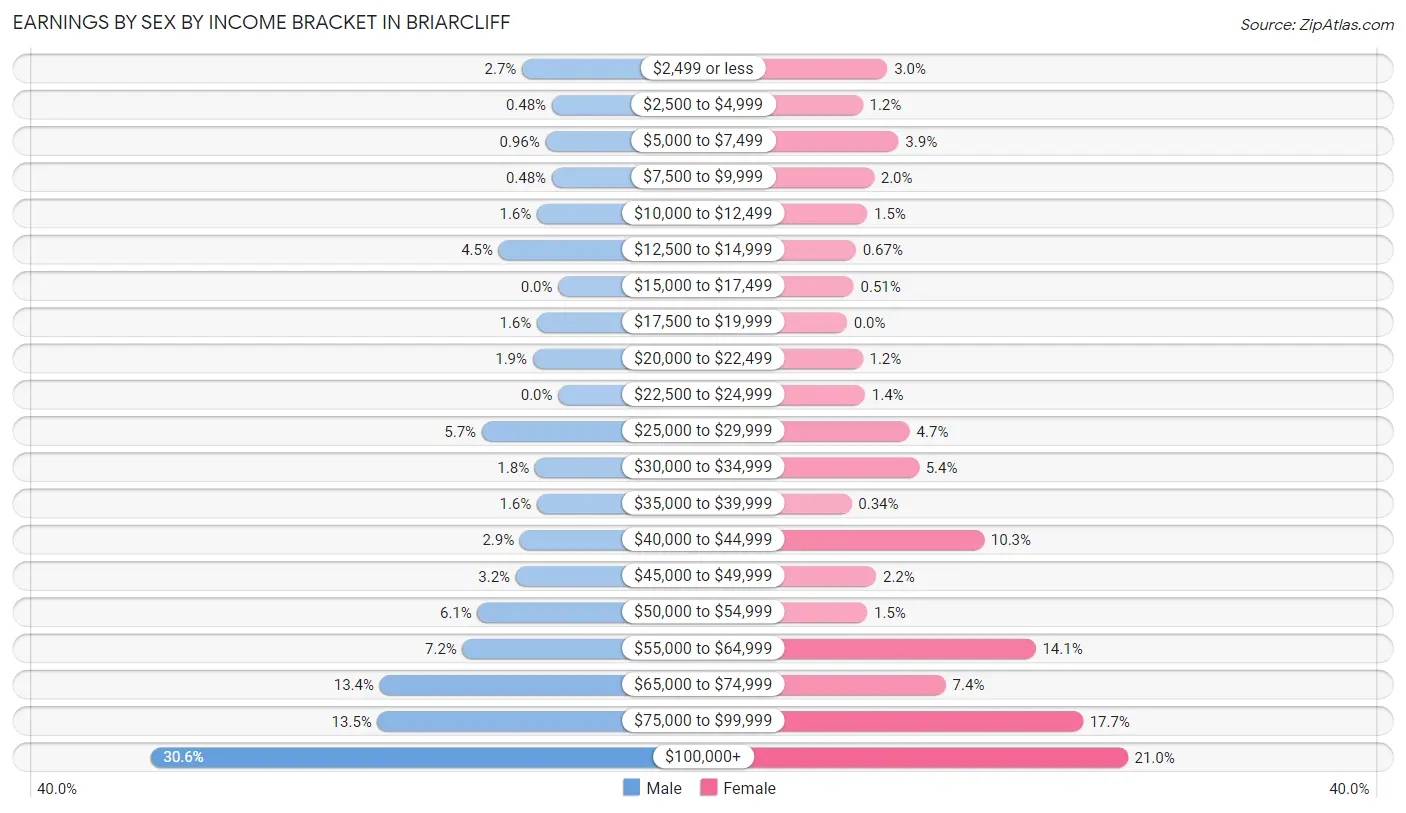
| Income | Male | Female |
| $2,499 or less | 17 (2.7%) | 18 (3.0%) |
| $2,500 to $4,999 | 3 (0.5%) | 7 (1.2%) |
| $5,000 to $7,499 | 6 (1.0%) | 23 (3.9%) |
| $7,500 to $9,999 | 3 (0.5%) | 12 (2.0%) |
| $10,000 to $12,499 | 10 (1.6%) | 9 (1.5%) |
| $12,500 to $14,999 | 28 (4.5%) | 4 (0.7%) |
| $15,000 to $17,499 | 0 (0.0%) | 3 (0.5%) |
| $17,500 to $19,999 | 10 (1.6%) | 0 (0.0%) |
| $20,000 to $22,499 | 12 (1.9%) | 7 (1.2%) |
| $22,500 to $24,999 | 0 (0.0%) | 8 (1.3%) |
| $25,000 to $29,999 | 36 (5.7%) | 28 (4.7%) |
| $30,000 to $34,999 | 11 (1.8%) | 32 (5.4%) |
| $35,000 to $39,999 | 10 (1.6%) | 2 (0.3%) |
| $40,000 to $44,999 | 18 (2.9%) | 61 (10.3%) |
| $45,000 to $49,999 | 20 (3.2%) | 13 (2.2%) |
| $50,000 to $54,999 | 38 (6.0%) | 9 (1.5%) |
| $55,000 to $64,999 | 45 (7.2%) | 84 (14.1%) |
| $65,000 to $74,999 | 84 (13.4%) | 44 (7.4%) |
| $75,000 to $99,999 | 85 (13.5%) | 105 (17.7%) |
| $100,000+ | 192 (30.6%) | 125 (21.0%) |
| Total | 628 (100.0%) | 594 (100.0%) |
Earnings by Sex by Educational Attainment in Briarcliff
Average earnings in Briarcliff are $73,939 for men and $63,833 for women, a difference of 13.7%. Men with an educational attainment of graduate degree enjoy the highest average annual earnings of $119,113, while those with high school diploma education earn the least with $52,016. Women with an educational attainment of bachelor's degree earn the most with the average annual earnings of $88,523, while those with high school diploma education have the smallest earnings of $33,125.
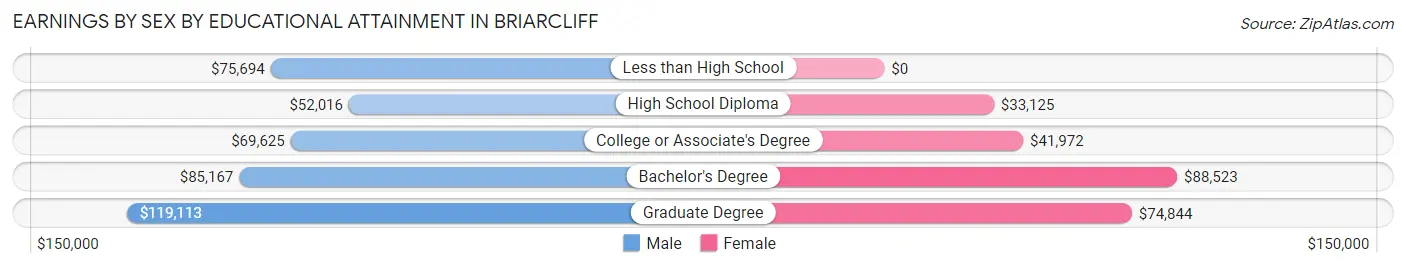
| Educational Attainment | Male Income | Female Income |
| Less than High School | $75,694 | $0 |
| High School Diploma | $52,016 | $33,125 |
| College or Associate's Degree | $69,625 | $41,972 |
| Bachelor's Degree | $85,167 | $88,523 |
| Graduate Degree | $119,113 | $74,844 |
| Total | $73,939 | $63,833 |
Family Income in Briarcliff
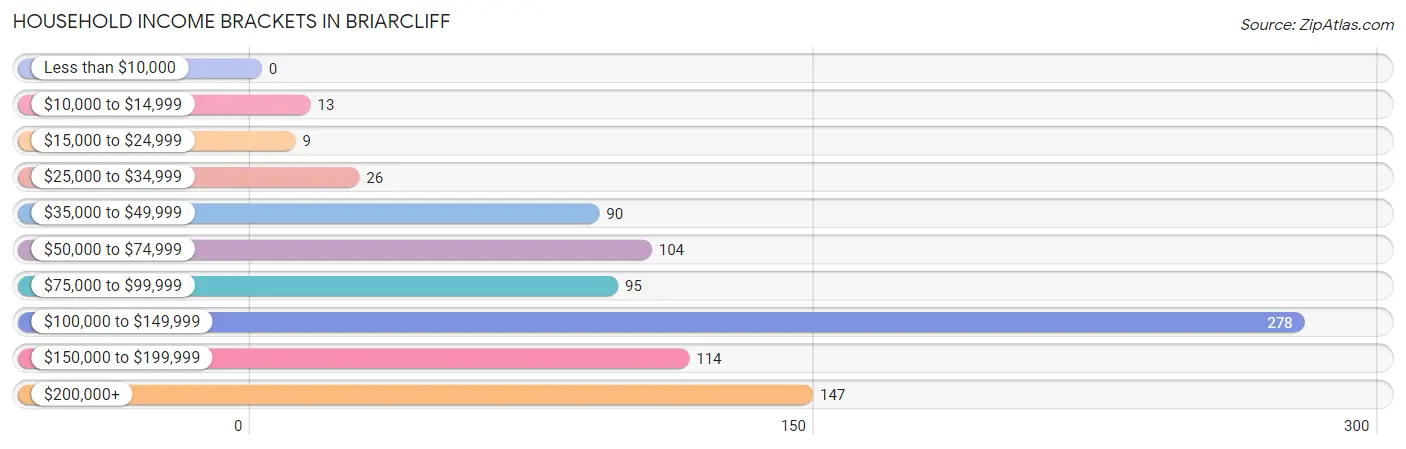
Family Income Brackets in Briarcliff
According to the Briarcliff family income data, there are 252 families falling into the $100,000 to $149,999 income range, which is the most common income bracket and makes up 36.7% of all families.
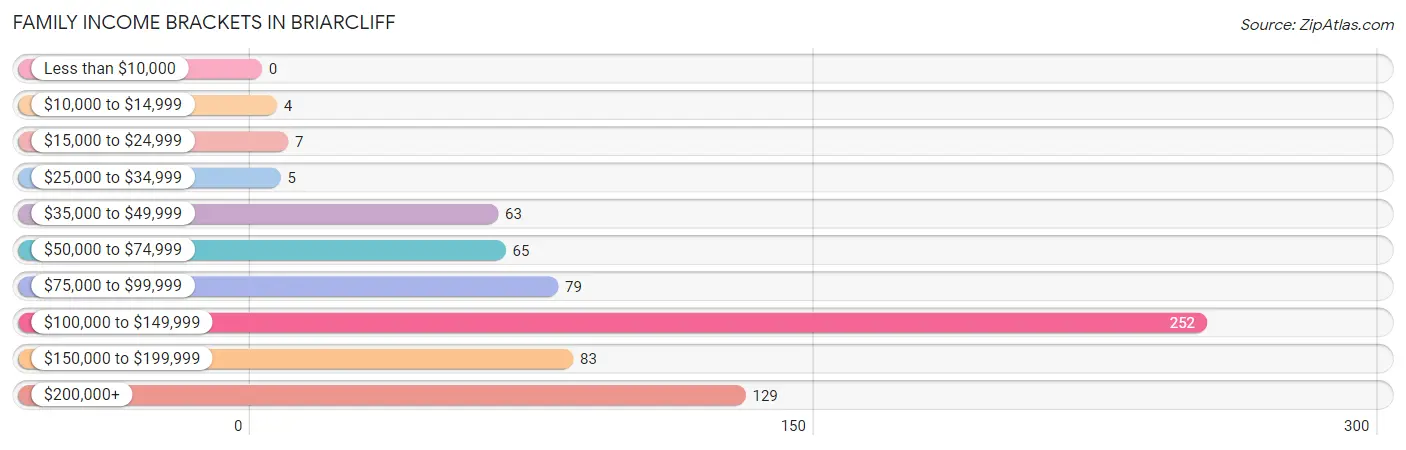
| Income Bracket | # Families | % Families |
| Less than $10,000 | 0 | 0.0% |
| $10,000 to $14,999 | 4 | 0.6% |
| $15,000 to $24,999 | 7 | 1.0% |
| $25,000 to $34,999 | 5 | 0.7% |
| $35,000 to $49,999 | 63 | 9.2% |
| $50,000 to $74,999 | 65 | 9.5% |
| $75,000 to $99,999 | 79 | 11.5% |
| $100,000 to $149,999 | 252 | 36.7% |
| $150,000 to $199,999 | 83 | 12.1% |
| $200,000+ | 129 | 18.8% |
Family Income by Famaliy Size in Briarcliff
5-person families (56 | 8.2%) account for the highest median family income in Briarcliff with $178,306 per family, while 2-person families (358 | 52.1%) have the highest median income of $62,678 per family member.
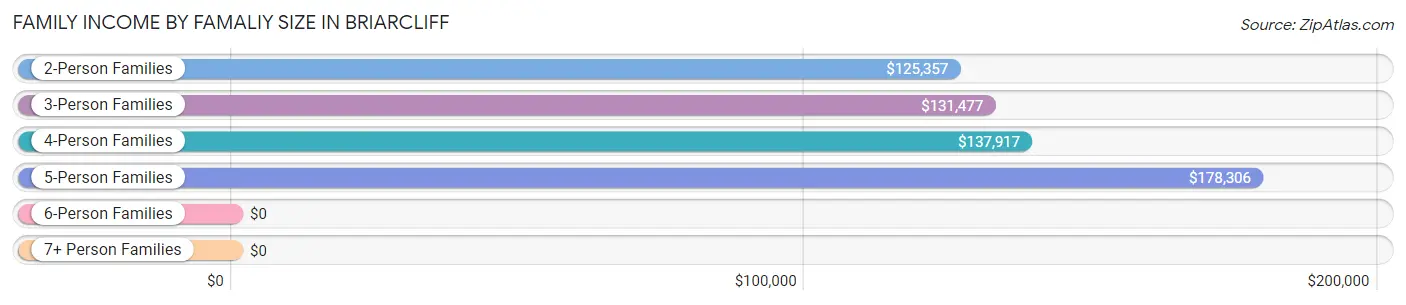
| Income Bracket | # Families | Median Income |
| 2-Person Families | 358 (52.1%) | $125,357 |
| 3-Person Families | 170 (24.7%) | $131,477 |
| 4-Person Families | 79 (11.5%) | $137,917 |
| 5-Person Families | 56 (8.2%) | $178,306 |
| 6-Person Families | 24 (3.5%) | $0 |
| 7+ Person Families | 0 (0.0%) | $0 |
| Total | 687 (100.0%) | $131,625 |
Family Income by Number of Earners in Briarcliff
The median family income in Briarcliff is $131,625, with families comprising 3+ earners (25) having the highest median family income of $250,001, while families with 1 earner (273) have the lowest median family income of $102,132, accounting for 3.6% and 39.7% of families, respectively.
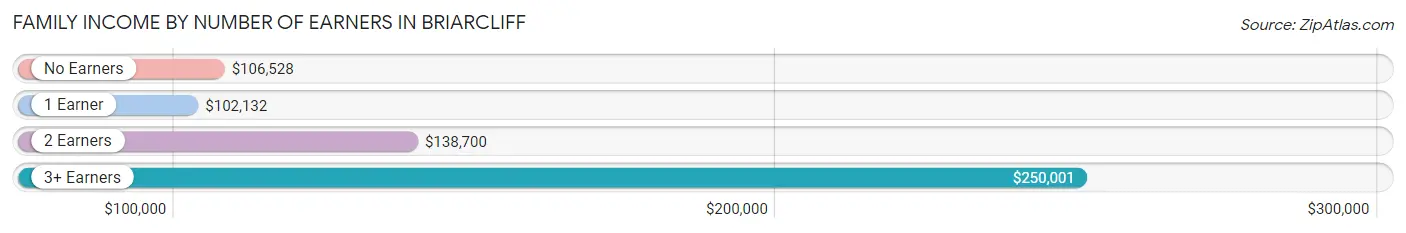
| Number of Earners | # Families | Median Income |
| No Earners | 61 (8.9%) | $106,528 |
| 1 Earner | 273 (39.7%) | $102,132 |
| 2 Earners | 328 (47.7%) | $138,700 |
| 3+ Earners | 25 (3.6%) | $250,001 |
| Total | 687 (100.0%) | $131,625 |
Household Income in Briarcliff
Household Income Brackets in Briarcliff
With 278 households falling in the category, the $100,000 to $149,999 income range is the most frequent in Briarcliff, accounting for 31.7% of all households.
| Income Bracket | # Households | % Households |
| Less than $10,000 | 0 | 0.0% |
| $10,000 to $14,999 | 13 | 1.5% |
| $15,000 to $24,999 | 9 | 1.0% |
| $25,000 to $34,999 | 26 | 3.0% |
| $35,000 to $49,999 | 90 | 10.3% |
| $50,000 to $74,999 | 104 | 11.9% |
| $75,000 to $99,999 | 95 | 10.8% |
| $100,000 to $149,999 | 278 | 31.7% |
| $150,000 to $199,999 | 114 | 13.0% |
| $200,000+ | 147 | 16.8% |
Household Income by Householder Age in Briarcliff
The median household income in Briarcliff is $123,000, with the highest median household income of $135,440 found in the 45 to 64 years age bracket for the primary householder. A total of 459 households (52.4%) fall into this category.
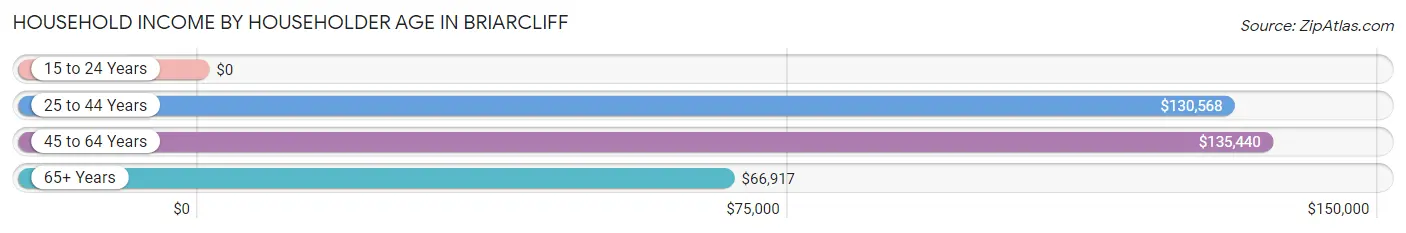
| Income Bracket | # Households | Median Income |
| 15 to 24 Years | 0 (0.0%) | $0 |
| 25 to 44 Years | 216 (24.7%) | $130,568 |
| 45 to 64 Years | 459 (52.4%) | $135,440 |
| 65+ Years | 201 (23.0%) | $66,917 |
| Total | 876 (100.0%) | $123,000 |
Poverty in Briarcliff
Income Below Poverty by Sex and Age in Briarcliff
With 4.1% poverty level for males and 2.7% for females among the residents of Briarcliff, 18 to 24 year old males and 16 and 17 year old females are the most vulnerable to poverty, with 13 males (25.5%) and 5 females (45.5%) in their respective age groups living below the poverty level.
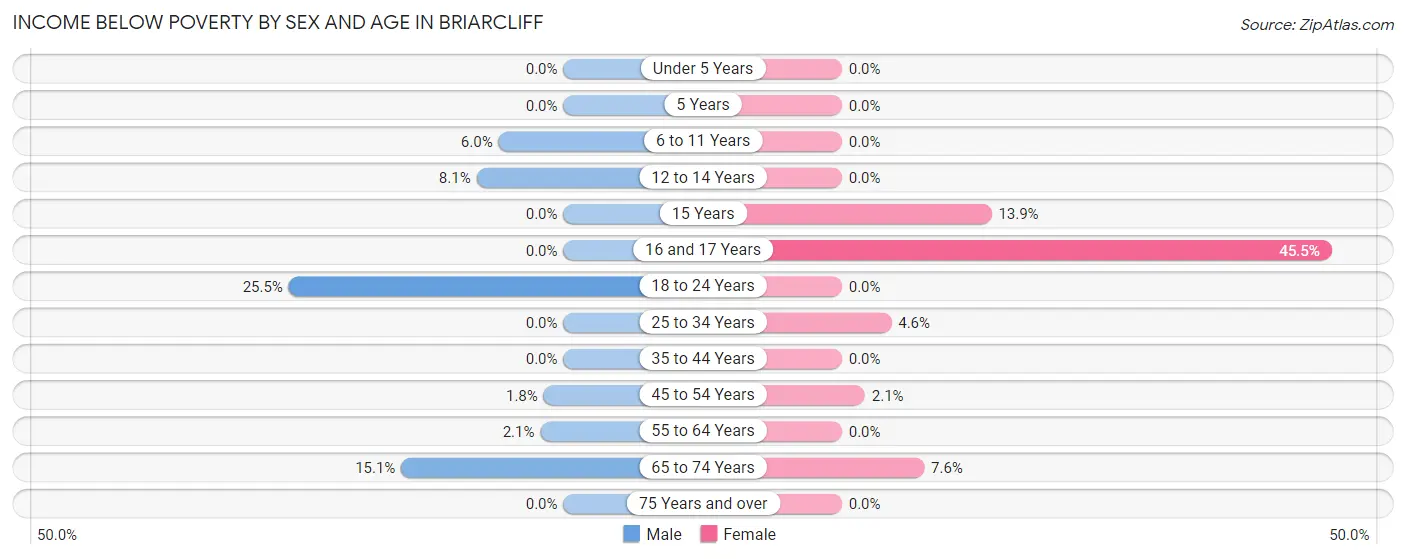
| Age Bracket | Male | Female |
| Under 5 Years | 0 (0.0%) | 0 (0.0%) |
| 5 Years | 0 (0.0%) | 0 (0.0%) |
| 6 to 11 Years | 5 (6.0%) | 0 (0.0%) |
| 12 to 14 Years | 5 (8.1%) | 0 (0.0%) |
| 15 Years | 0 (0.0%) | 5 (13.9%) |
| 16 and 17 Years | 0 (0.0%) | 5 (45.5%) |
| 18 to 24 Years | 13 (25.5%) | 0 (0.0%) |
| 25 to 34 Years | 0 (0.0%) | 5 (4.6%) |
| 35 to 44 Years | 0 (0.0%) | 0 (0.0%) |
| 45 to 54 Years | 4 (1.8%) | 4 (2.1%) |
| 55 to 64 Years | 5 (2.1%) | 0 (0.0%) |
| 65 to 74 Years | 14 (15.0%) | 12 (7.6%) |
| 75 Years and over | 0 (0.0%) | 0 (0.0%) |
| Total | 46 (4.1%) | 31 (2.7%) |
Income Above Poverty by Sex and Age in Briarcliff
According to the poverty statistics in Briarcliff, males aged under 5 years and females aged under 5 years are the age groups that are most secure financially, with 100.0% of males and 100.0% of females in these age groups living above the poverty line.
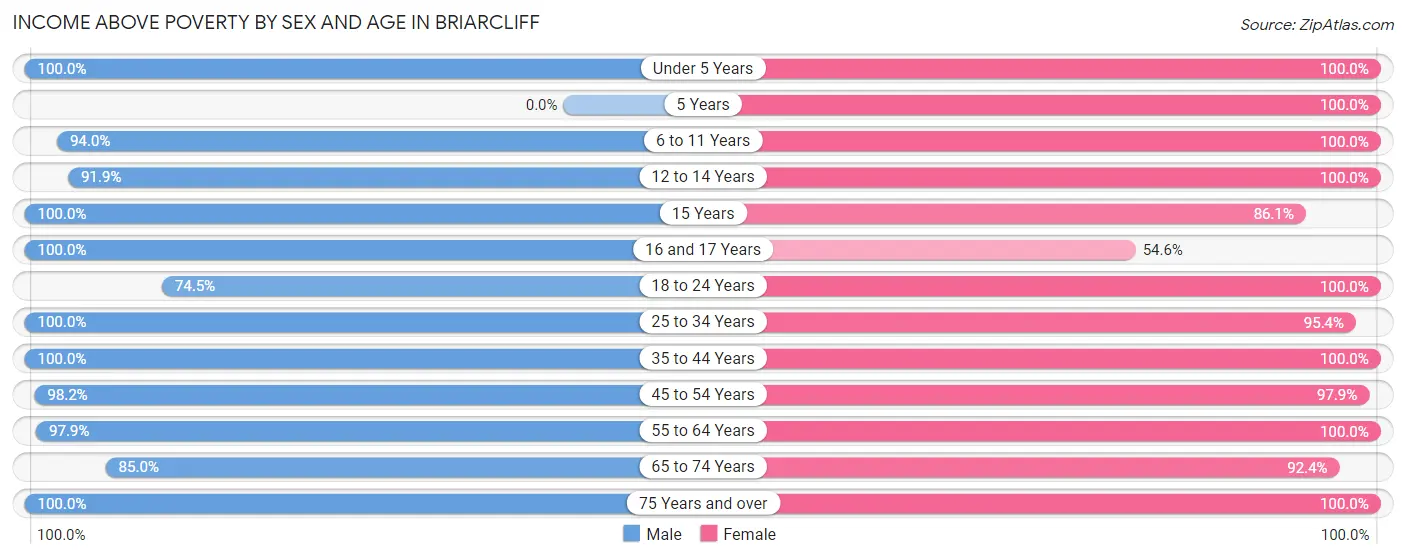
| Age Bracket | Male | Female |
| Under 5 Years | 98 (100.0%) | 91 (100.0%) |
| 5 Years | 0 (0.0%) | 13 (100.0%) |
| 6 to 11 Years | 78 (94.0%) | 96 (100.0%) |
| 12 to 14 Years | 57 (91.9%) | 64 (100.0%) |
| 15 Years | 16 (100.0%) | 31 (86.1%) |
| 16 and 17 Years | 13 (100.0%) | 6 (54.5%) |
| 18 to 24 Years | 38 (74.5%) | 25 (100.0%) |
| 25 to 34 Years | 98 (100.0%) | 104 (95.4%) |
| 35 to 44 Years | 116 (100.0%) | 133 (100.0%) |
| 45 to 54 Years | 214 (98.2%) | 183 (97.9%) |
| 55 to 64 Years | 229 (97.9%) | 202 (100.0%) |
| 65 to 74 Years | 79 (85.0%) | 145 (92.4%) |
| 75 Years and over | 37 (100.0%) | 30 (100.0%) |
| Total | 1,073 (95.9%) | 1,123 (97.3%) |
Income Below Poverty Among Married-Couple Families in Briarcliff
The poverty statistics for married-couple families in Briarcliff show that 1.5% or 8 of the total 552 families live below the poverty line. Families with no children have the highest poverty rate of 2.4%, comprising of 8 families. On the other hand, families with 1 or 2 children have the lowest poverty rate of 0.0%, which includes 0 families.
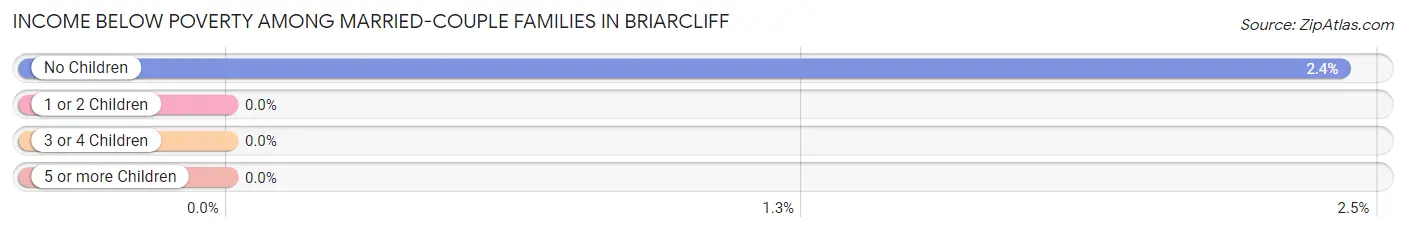
| Children | Above Poverty | Below Poverty |
| No Children | 323 (97.6%) | 8 (2.4%) |
| 1 or 2 Children | 149 (100.0%) | 0 (0.0%) |
| 3 or 4 Children | 72 (100.0%) | 0 (0.0%) |
| 5 or more Children | 0 (0.0%) | 0 (0.0%) |
| Total | 544 (98.6%) | 8 (1.5%) |
Income Below Poverty Among Single-Parent Households in Briarcliff
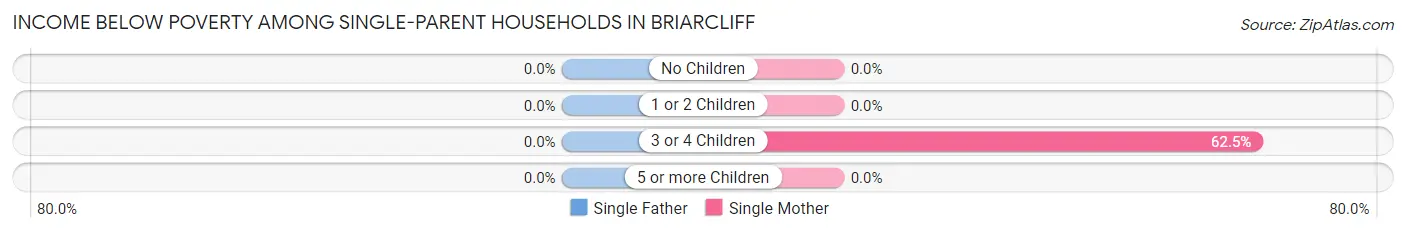
| Children | Single Father | Single Mother |
| No Children | 0 (0.0%) | 0 (0.0%) |
| 1 or 2 Children | 0 (0.0%) | 0 (0.0%) |
| 3 or 4 Children | 0 (0.0%) | 5 (62.5%) |
| 5 or more Children | 0 (0.0%) | 0 (0.0%) |
| Total | 0 (0.0%) | 5 (4.8%) |
Income Below Poverty Among Married-Couple vs Single-Parent Households in Briarcliff
The poverty data for Briarcliff shows that 8 of the married-couple family households (1.5%) and 5 of the single-parent households (3.7%) are living below the poverty level. Within the married-couple family households, those with no children have the highest poverty rate, with 8 households (2.4%) falling below the poverty line. Among the single-parent households, those with 3 or 4 children have the highest poverty rate, with 5 household (62.5%) living below poverty.
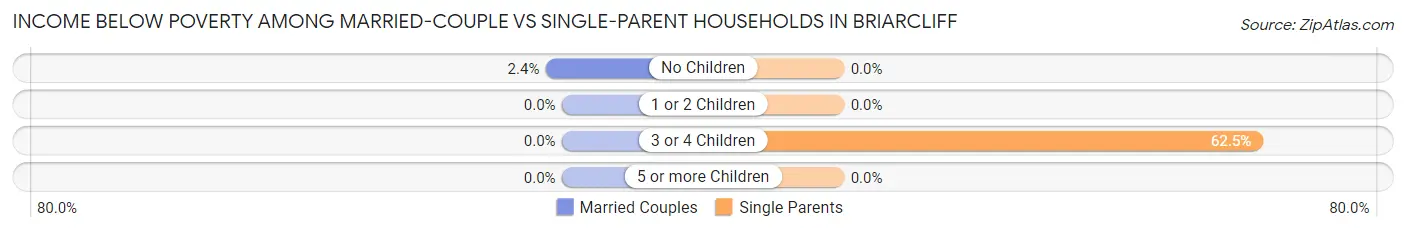
| Children | Married-Couple Families | Single-Parent Households |
| No Children | 8 (2.4%) | 0 (0.0%) |
| 1 or 2 Children | 0 (0.0%) | 0 (0.0%) |
| 3 or 4 Children | 0 (0.0%) | 5 (62.5%) |
| 5 or more Children | 0 (0.0%) | 0 (0.0%) |
| Total | 8 (1.5%) | 5 (3.7%) |
Employment Characteristics in Briarcliff
Employment by Class of Employer in Briarcliff
Among the 1,109 employed individuals in Briarcliff, private company employees (720 | 64.9%), local government employees (117 | 10.5%), and self-employed (not incorporated) (91 | 8.2%) make up the most common classes of employment.
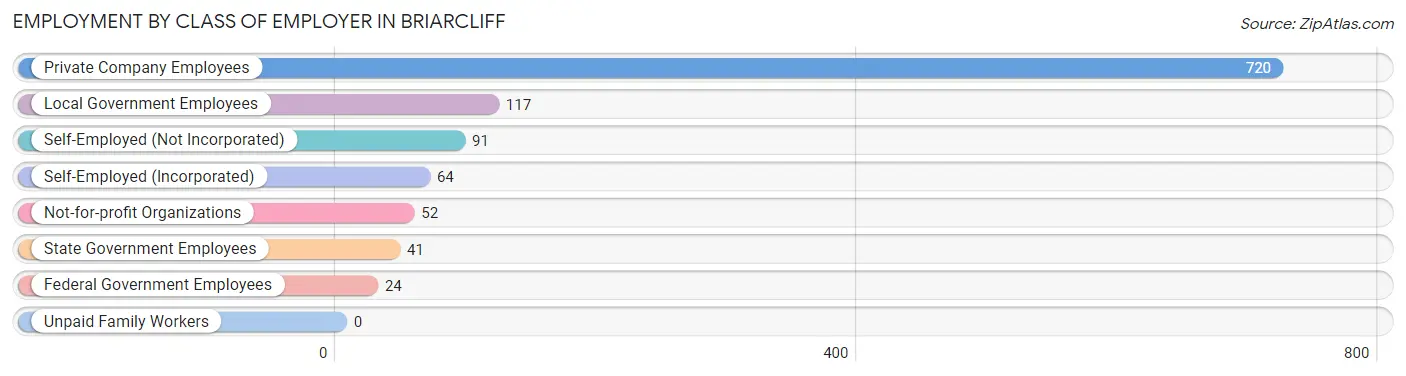
| Employer Class | # Employees | % Employees |
| Private Company Employees | 720 | 64.9% |
| Self-Employed (Incorporated) | 64 | 5.8% |
| Self-Employed (Not Incorporated) | 91 | 8.2% |
| Not-for-profit Organizations | 52 | 4.7% |
| Local Government Employees | 117 | 10.5% |
| State Government Employees | 41 | 3.7% |
| Federal Government Employees | 24 | 2.2% |
| Unpaid Family Workers | 0 | 0.0% |
| Total | 1,109 | 100.0% |
Employment Status by Age in Briarcliff
According to the labor force statistics for Briarcliff, out of the total population over 16 years of age (1,714), 66.5% or 1,140 individuals are in the labor force, with 2.0% or 23 of them unemployed. The age group with the highest labor force participation rate is 25 to 29 years, with 100.0% or 61 individuals in the labor force. Within the labor force, the 25 to 29 years age range has the highest percentage of unemployed individuals, with 14.8% or 9 of them being unemployed.
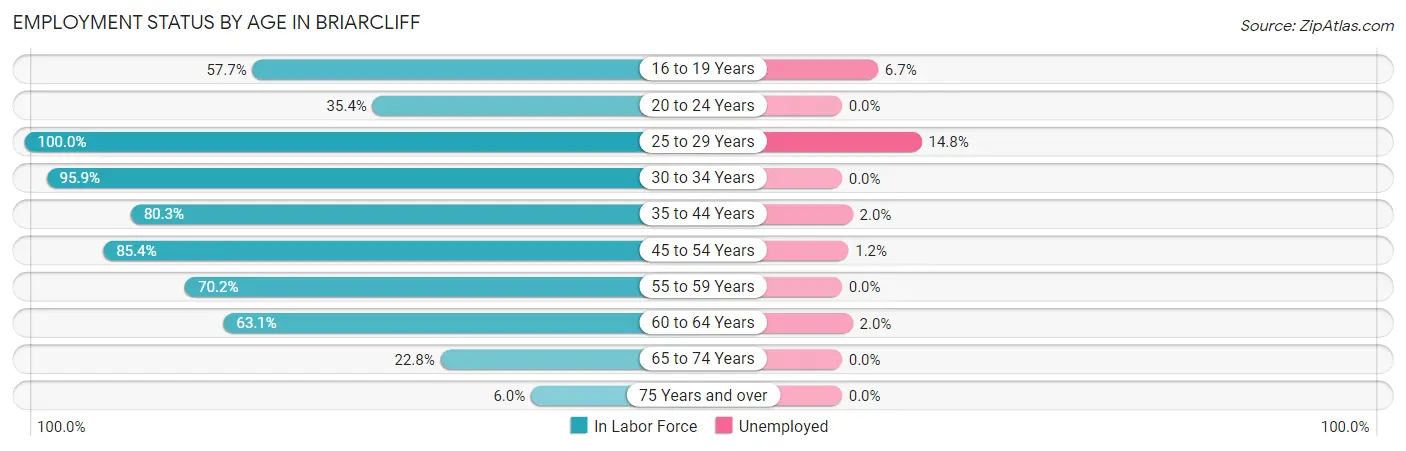
| Age Bracket | In Labor Force | Unemployed |
| 16 to 19 Years | 30 (57.7%) | 2 (6.7%) |
| 20 to 24 Years | 17 (35.4%) | 0 (0.0%) |
| 25 to 29 Years | 61 (100.0%) | 9 (14.8%) |
| 30 to 34 Years | 140 (95.9%) | 0 (0.0%) |
| 35 to 44 Years | 200 (80.3%) | 4 (2.0%) |
| 45 to 54 Years | 346 (85.4%) | 4 (1.2%) |
| 55 to 59 Years | 87 (70.2%) | 0 (0.0%) |
| 60 to 64 Years | 197 (63.1%) | 4 (2.0%) |
| 65 to 74 Years | 57 (22.8%) | 0 (0.0%) |
| 75 Years and over | 4 (6.0%) | 0 (0.0%) |
| Total | 1,140 (66.5%) | 23 (2.0%) |
Employment Status by Educational Attainment in Briarcliff
According to labor force statistics for Briarcliff, 79.5% of individuals (1,031) out of the total population between 25 and 64 years of age (1,297) are in the labor force, with 2.0% or 21 of them being unemployed. The group with the highest labor force participation rate are those with the educational attainment of less than high school, with 100.0% or 17 individuals in the labor force. Within the labor force, individuals with bachelor's degree or higher education have the highest percentage of unemployment, with 2.8% or 17 of them being unemployed.
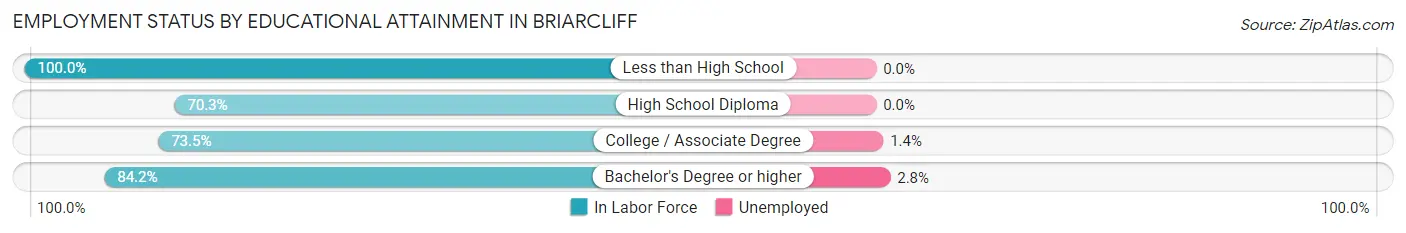
| Educational Attainment | In Labor Force | Unemployed |
| Less than High School | 17 (100.0%) | 0 (0.0%) |
| High School Diploma | 121 (70.3%) | 0 (0.0%) |
| College / Associate Degree | 278 (73.5%) | 5 (1.4%) |
| Bachelor's Degree or higher | 615 (84.2%) | 20 (2.8%) |
| Total | 1,031 (79.5%) | 26 (2.0%) |
Employment Occupations by Sex in Briarcliff
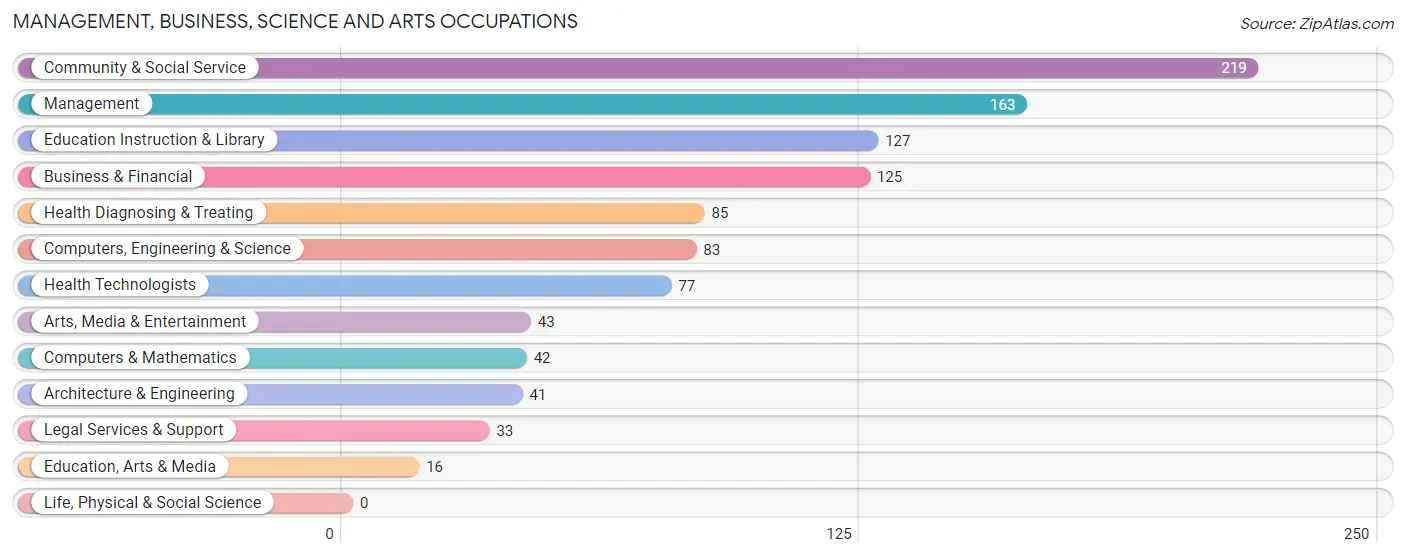
Management, Business, Science and Arts Occupations
The most common Management, Business, Science and Arts occupations in Briarcliff are Community & Social Service (219 | 19.6%), Management (163 | 14.6%), Education Instruction & Library (127 | 11.4%), Business & Financial (125 | 11.2%), and Health Diagnosing & Treating (85 | 7.6%).
Management, Business, Science and Arts Occupations by Sex
Within the Management, Business, Science and Arts occupations in Briarcliff, the most male-oriented occupations are Architecture & Engineering (95.1%), Computers, Engineering & Science (84.3%), and Arts, Media & Entertainment (76.7%), while the most female-oriented occupations are Health Technologists (80.5%), Education Instruction & Library (79.5%), and Health Diagnosing & Treating (72.9%).
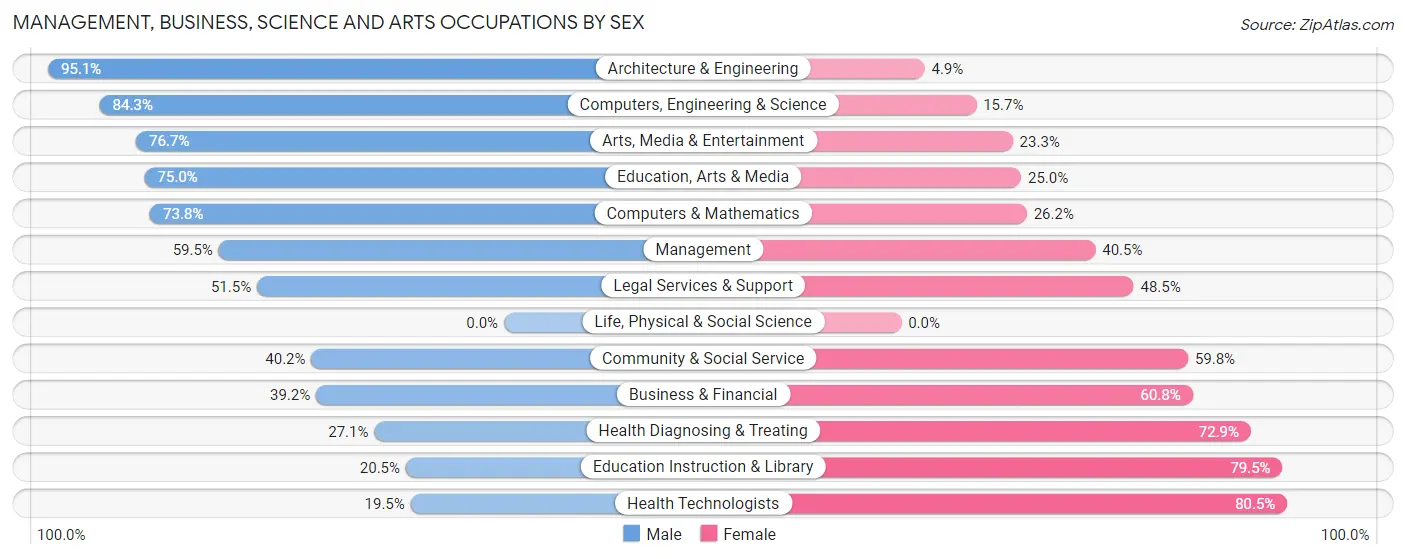
| Occupation | Male | Female |
| Management | 97 (59.5%) | 66 (40.5%) |
| Business & Financial | 49 (39.2%) | 76 (60.8%) |
| Computers, Engineering & Science | 70 (84.3%) | 13 (15.7%) |
| Computers & Mathematics | 31 (73.8%) | 11 (26.2%) |
| Architecture & Engineering | 39 (95.1%) | 2 (4.9%) |
| Life, Physical & Social Science | 0 (0.0%) | 0 (0.0%) |
| Community & Social Service | 88 (40.2%) | 131 (59.8%) |
| Education, Arts & Media | 12 (75.0%) | 4 (25.0%) |
| Legal Services & Support | 17 (51.5%) | 16 (48.5%) |
| Education Instruction & Library | 26 (20.5%) | 101 (79.5%) |
| Arts, Media & Entertainment | 33 (76.7%) | 10 (23.3%) |
| Health Diagnosing & Treating | 23 (27.1%) | 62 (72.9%) |
| Health Technologists | 15 (19.5%) | 62 (80.5%) |
| Total (Category) | 327 (48.4%) | 348 (51.6%) |
| Total (Overall) | 564 (50.5%) | 552 (49.5%) |
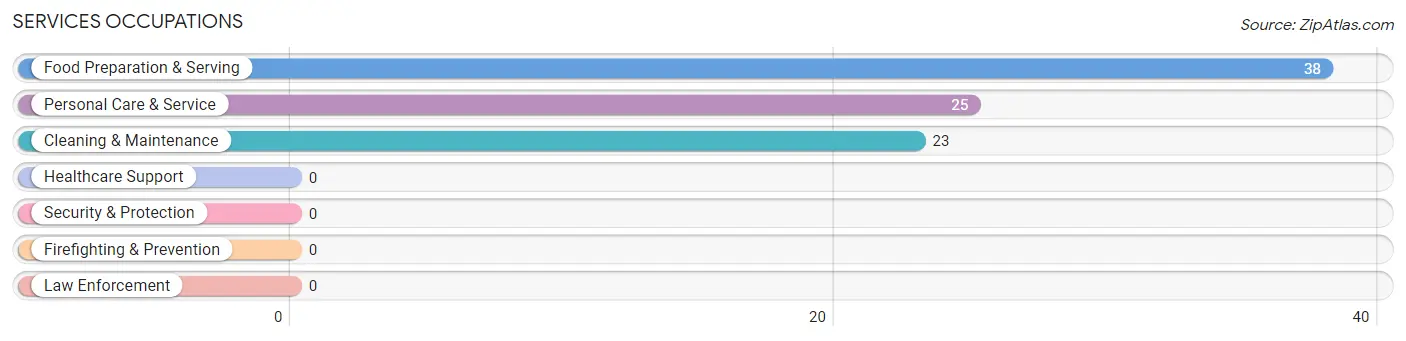
Services Occupations
The most common Services occupations in Briarcliff are Food Preparation & Serving (38 | 3.4%), Personal Care & Service (25 | 2.2%), and Cleaning & Maintenance (23 | 2.1%).
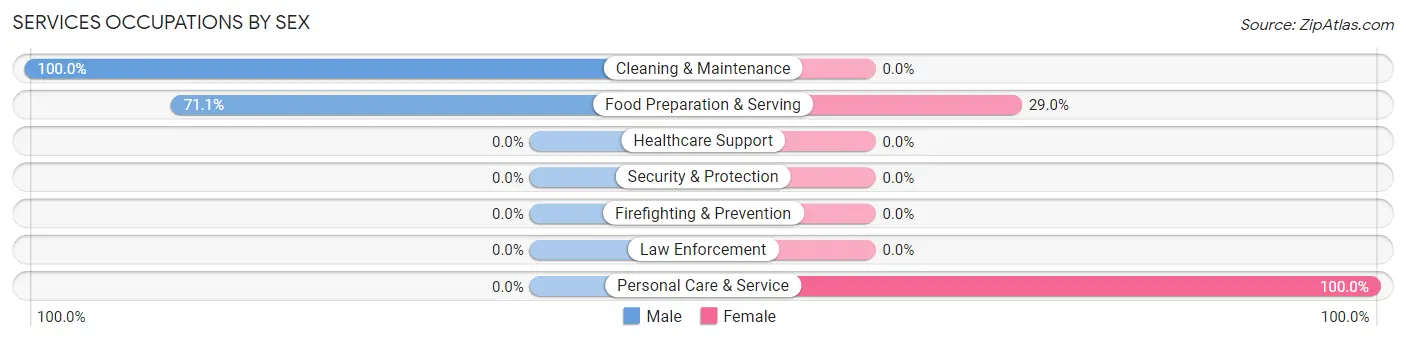
Services Occupations by Sex
Within the Services occupations in Briarcliff, the most male-oriented occupations are Cleaning & Maintenance (100.0%), and Food Preparation & Serving (71.1%), while the most female-oriented occupations are Personal Care & Service (100.0%), and Food Preparation & Serving (28.9%).
| Occupation | Male | Female |
| Healthcare Support | 0 (0.0%) | 0 (0.0%) |
| Security & Protection | 0 (0.0%) | 0 (0.0%) |
| Firefighting & Prevention | 0 (0.0%) | 0 (0.0%) |
| Law Enforcement | 0 (0.0%) | 0 (0.0%) |
| Food Preparation & Serving | 27 (71.1%) | 11 (28.9%) |
| Cleaning & Maintenance | 23 (100.0%) | 0 (0.0%) |
| Personal Care & Service | 0 (0.0%) | 25 (100.0%) |
| Total (Category) | 50 (58.1%) | 36 (41.9%) |
| Total (Overall) | 564 (50.5%) | 552 (49.5%) |
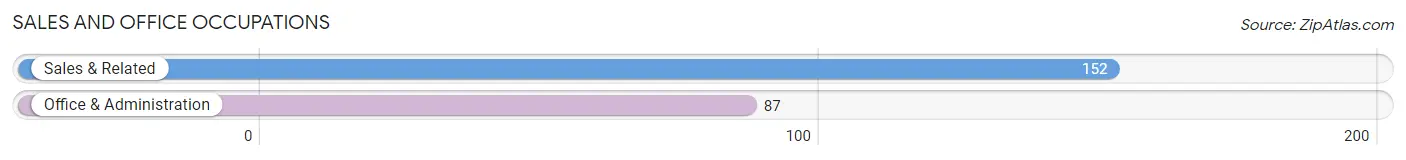
Sales and Office Occupations
The most common Sales and Office occupations in Briarcliff are Sales & Related (152 | 13.6%), and Office & Administration (87 | 7.8%).
Sales and Office Occupations by Sex
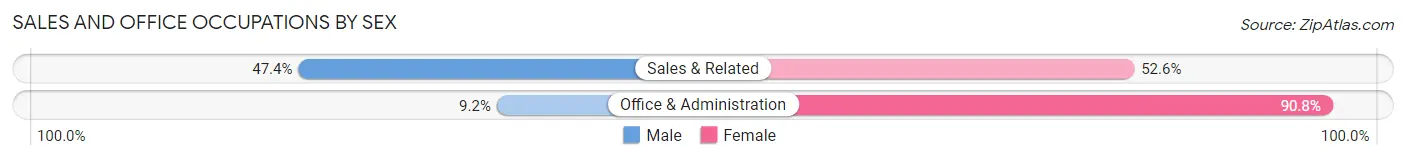
| Occupation | Male | Female |
| Sales & Related | 72 (47.4%) | 80 (52.6%) |
| Office & Administration | 8 (9.2%) | 79 (90.8%) |
| Total (Category) | 80 (33.5%) | 159 (66.5%) |
| Total (Overall) | 564 (50.5%) | 552 (49.5%) |
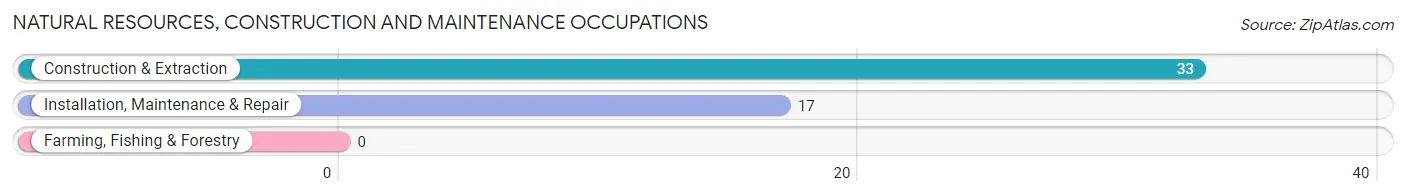
Natural Resources, Construction and Maintenance Occupations
The most common Natural Resources, Construction and Maintenance occupations in Briarcliff are Construction & Extraction (33 | 3.0%), and Installation, Maintenance & Repair (17 | 1.5%).
Natural Resources, Construction and Maintenance Occupations by Sex
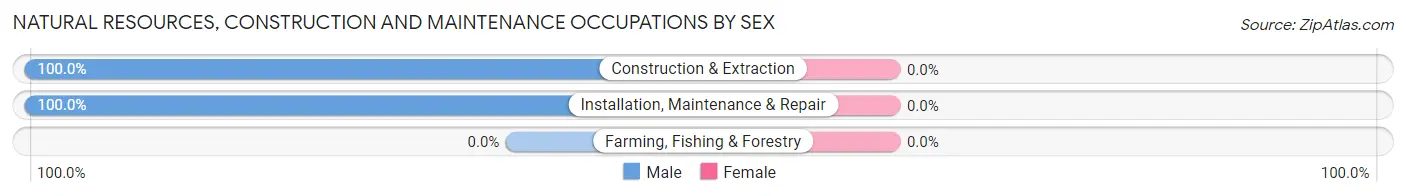
| Occupation | Male | Female |
| Farming, Fishing & Forestry | 0 (0.0%) | 0 (0.0%) |
| Construction & Extraction | 33 (100.0%) | 0 (0.0%) |
| Installation, Maintenance & Repair | 17 (100.0%) | 0 (0.0%) |
| Total (Category) | 50 (100.0%) | 0 (0.0%) |
| Total (Overall) | 564 (50.5%) | 552 (49.5%) |
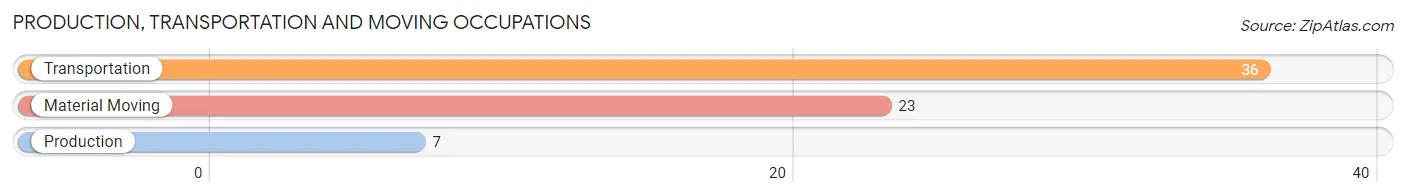
Production, Transportation and Moving Occupations
The most common Production, Transportation and Moving occupations in Briarcliff are Transportation (36 | 3.2%), Material Moving (23 | 2.1%), and Production (7 | 0.6%).
Production, Transportation and Moving Occupations by Sex
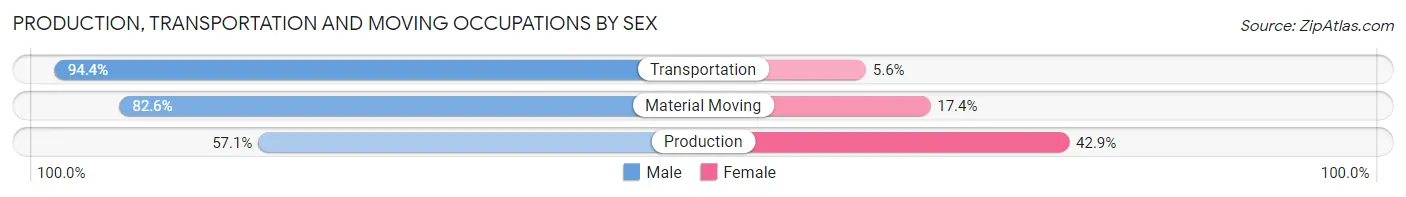
| Occupation | Male | Female |
| Production | 4 (57.1%) | 3 (42.9%) |
| Transportation | 34 (94.4%) | 2 (5.6%) |
| Material Moving | 19 (82.6%) | 4 (17.4%) |
| Total (Category) | 57 (86.4%) | 9 (13.6%) |
| Total (Overall) | 564 (50.5%) | 552 (49.5%) |
Employment Industries by Sex in Briarcliff
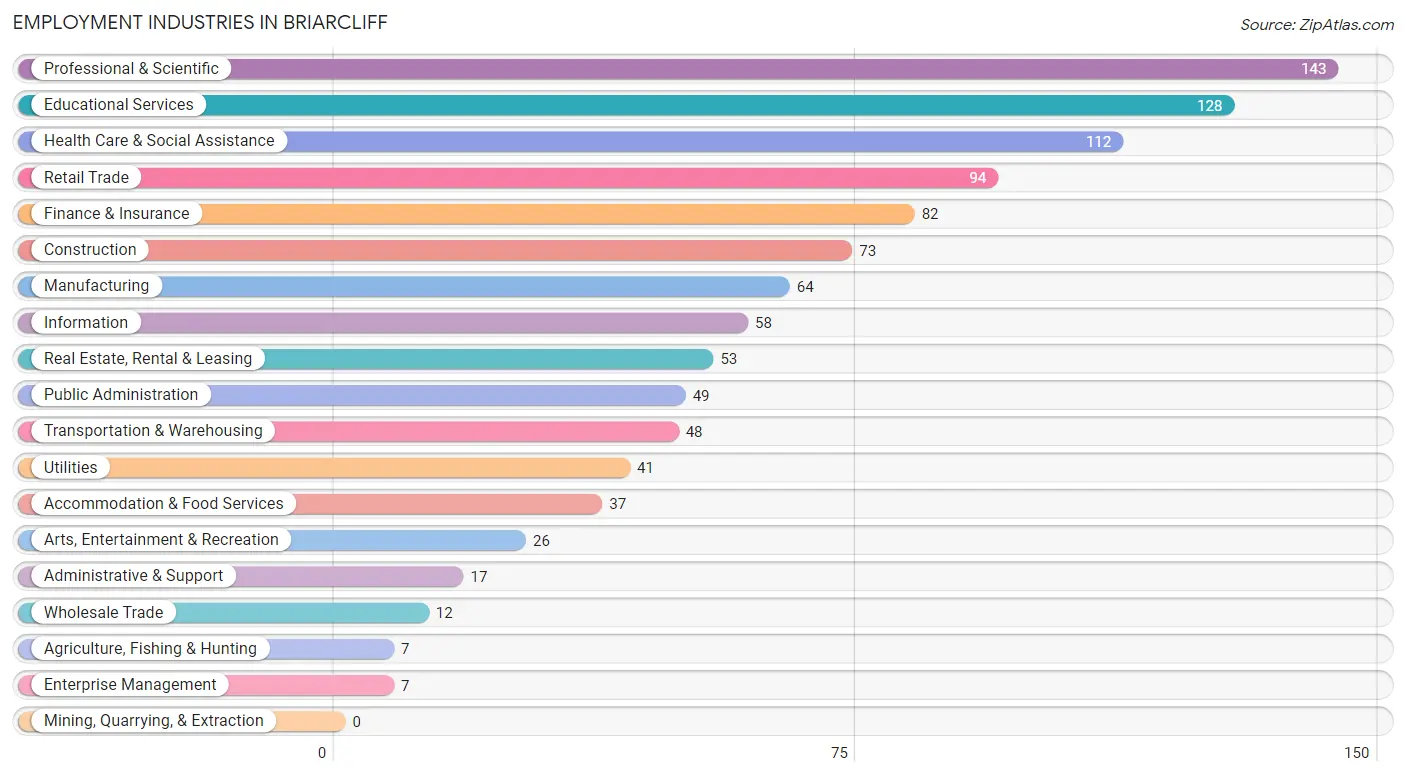
Employment Industries in Briarcliff
The major employment industries in Briarcliff include Professional & Scientific (143 | 12.8%), Educational Services (128 | 11.5%), Health Care & Social Assistance (112 | 10.0%), Retail Trade (94 | 8.4%), and Finance & Insurance (82 | 7.3%).
Employment Industries by Sex in Briarcliff
The Briarcliff industries that see more men than women are Agriculture, Fishing & Hunting (100.0%), Transportation & Warehousing (100.0%), and Utilities (100.0%), whereas the industries that tend to have a higher number of women are Enterprise Management (100.0%), Health Care & Social Assistance (81.2%), and Finance & Insurance (80.5%).
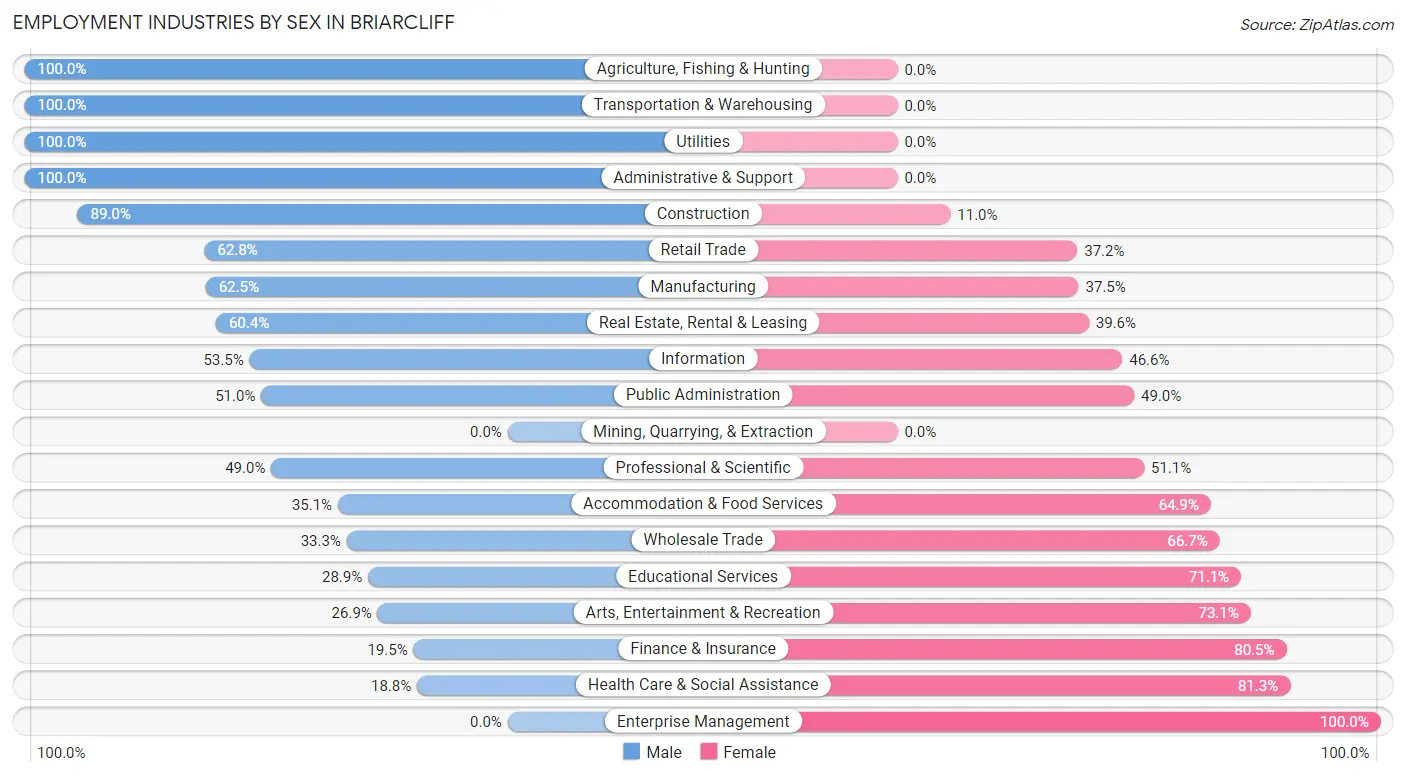
| Industry | Male | Female |
| Agriculture, Fishing & Hunting | 7 (100.0%) | 0 (0.0%) |
| Mining, Quarrying, & Extraction | 0 (0.0%) | 0 (0.0%) |
| Construction | 65 (89.0%) | 8 (11.0%) |
| Manufacturing | 40 (62.5%) | 24 (37.5%) |
| Wholesale Trade | 4 (33.3%) | 8 (66.7%) |
| Retail Trade | 59 (62.8%) | 35 (37.2%) |
| Transportation & Warehousing | 48 (100.0%) | 0 (0.0%) |
| Utilities | 41 (100.0%) | 0 (0.0%) |
| Information | 31 (53.4%) | 27 (46.6%) |
| Finance & Insurance | 16 (19.5%) | 66 (80.5%) |
| Real Estate, Rental & Leasing | 32 (60.4%) | 21 (39.6%) |
| Professional & Scientific | 70 (48.9%) | 73 (51.0%) |
| Enterprise Management | 0 (0.0%) | 7 (100.0%) |
| Administrative & Support | 17 (100.0%) | 0 (0.0%) |
| Educational Services | 37 (28.9%) | 91 (71.1%) |
| Health Care & Social Assistance | 21 (18.8%) | 91 (81.2%) |
| Arts, Entertainment & Recreation | 7 (26.9%) | 19 (73.1%) |
| Accommodation & Food Services | 13 (35.1%) | 24 (64.9%) |
| Public Administration | 25 (51.0%) | 24 (49.0%) |
| Total | 564 (50.5%) | 552 (49.5%) |
Education in Briarcliff
School Enrollment in Briarcliff
The most common levels of schooling among the 479 students in Briarcliff are high school (124 | 25.9%), middle school (115 | 24.0%), and elementary school (106 | 22.1%).
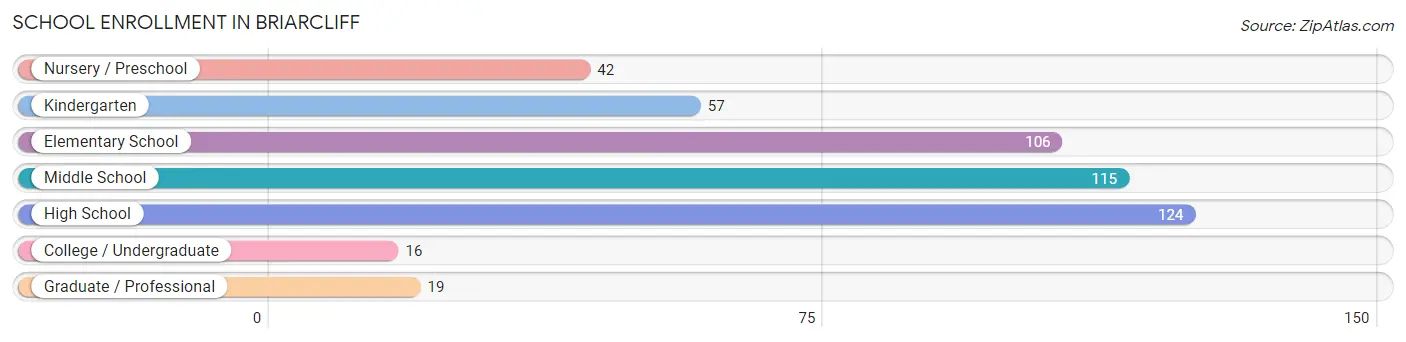
| School Level | # Students | % Students |
| Nursery / Preschool | 42 | 8.8% |
| Kindergarten | 57 | 11.9% |
| Elementary School | 106 | 22.1% |
| Middle School | 115 | 24.0% |
| High School | 124 | 25.9% |
| College / Undergraduate | 16 | 3.3% |
| Graduate / Professional | 19 | 4.0% |
| Total | 479 | 100.0% |
School Enrollment by Age by Funding Source in Briarcliff
Out of a total of 479 students who are enrolled in schools in Briarcliff, 30 (6.3%) attend a private institution, while the remaining 449 (93.7%) are enrolled in public schools. The age group of 35 years and over has the highest likelihood of being enrolled in private schools, with 12 (80.0% in the age bracket) enrolled. Conversely, the age group of 5 to 9 year old has the lowest likelihood of being enrolled in a private school, with 137 (100.0% in the age bracket) attending a public institution.
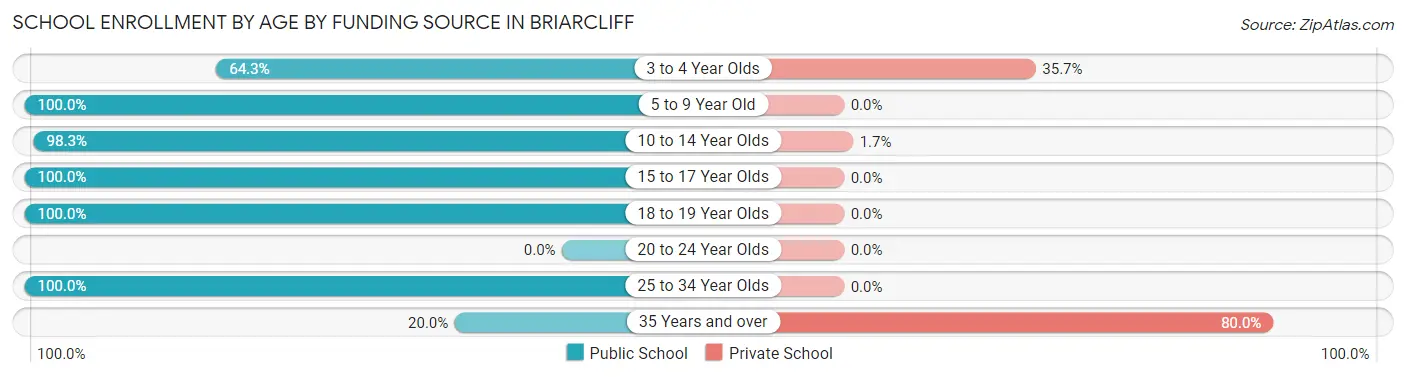
| Age Bracket | Public School | Private School |
| 3 to 4 Year Olds | 27 (64.3%) | 15 (35.7%) |
| 5 to 9 Year Old | 137 (100.0%) | 0 (0.0%) |
| 10 to 14 Year Olds | 175 (98.3%) | 3 (1.7%) |
| 15 to 17 Year Olds | 72 (100.0%) | 0 (0.0%) |
| 18 to 19 Year Olds | 28 (100.0%) | 0 (0.0%) |
| 20 to 24 Year Olds | 0 (0.0%) | 0 (0.0%) |
| 25 to 34 Year Olds | 7 (100.0%) | 0 (0.0%) |
| 35 Years and over | 3 (20.0%) | 12 (80.0%) |
| Total | 449 (93.7%) | 30 (6.3%) |
Educational Attainment by Field of Study in Briarcliff
Business (178 | 19.7%), engineering (98 | 10.8%), science & technology (91 | 10.0%), social sciences (87 | 9.6%), and psychology (86 | 9.5%) are the most common fields of study among 906 individuals in Briarcliff who have obtained a bachelor's degree or higher.
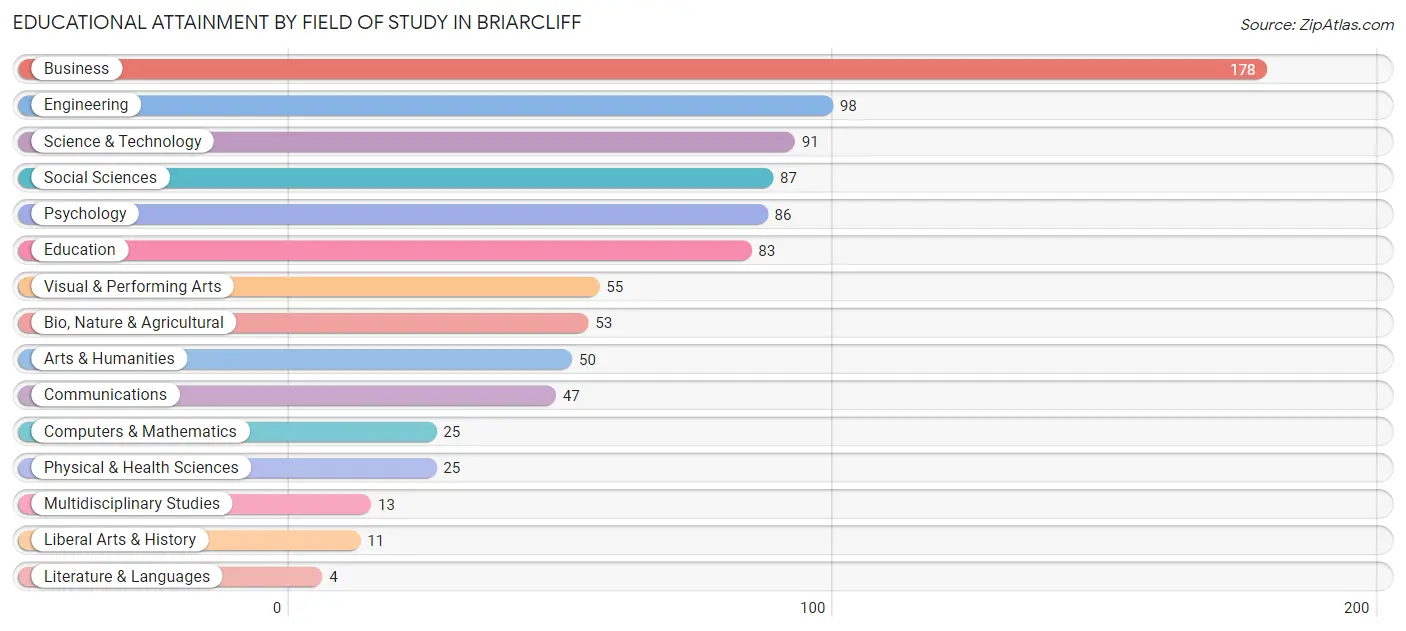
| Field of Study | # Graduates | % Graduates |
| Computers & Mathematics | 25 | 2.8% |
| Bio, Nature & Agricultural | 53 | 5.9% |
| Physical & Health Sciences | 25 | 2.8% |
| Psychology | 86 | 9.5% |
| Social Sciences | 87 | 9.6% |
| Engineering | 98 | 10.8% |
| Multidisciplinary Studies | 13 | 1.4% |
| Science & Technology | 91 | 10.0% |
| Business | 178 | 19.7% |
| Education | 83 | 9.2% |
| Literature & Languages | 4 | 0.4% |
| Liberal Arts & History | 11 | 1.2% |
| Visual & Performing Arts | 55 | 6.1% |
| Communications | 47 | 5.2% |
| Arts & Humanities | 50 | 5.5% |
| Total | 906 | 100.0% |
Transportation & Commute in Briarcliff
Vehicle Availability by Sex in Briarcliff
The most prevalent vehicle ownership categories in Briarcliff are males with 2 vehicles (338, accounting for 60.7%) and females with 2 vehicles (223, making up 61.2%).
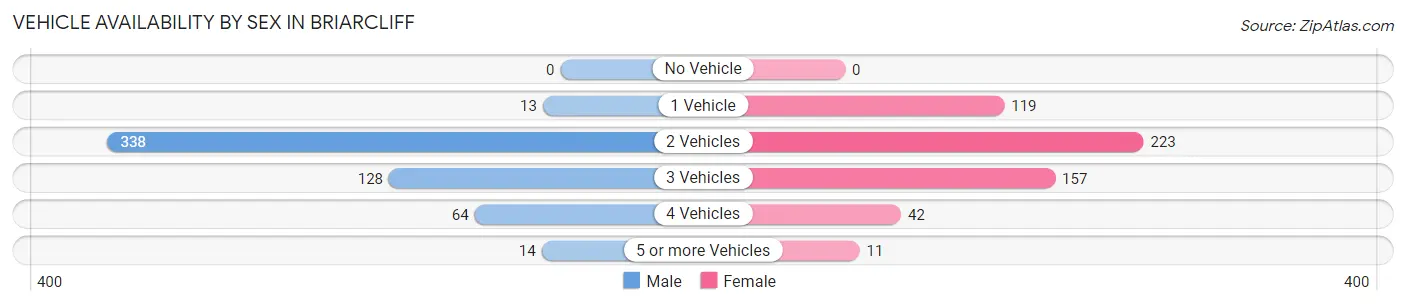
| Vehicles Available | Male | Female |
| No Vehicle | 0 (0.0%) | 0 (0.0%) |
| 1 Vehicle | 13 (2.3%) | 119 (21.6%) |
| 2 Vehicles | 338 (60.7%) | 223 (40.4%) |
| 3 Vehicles | 128 (23.0%) | 157 (28.4%) |
| 4 Vehicles | 64 (11.5%) | 42 (7.6%) |
| 5 or more Vehicles | 14 (2.5%) | 11 (2.0%) |
| Total | 557 (100.0%) | 552 (100.0%) |
Commute Time in Briarcliff
The most frequently occuring commute durations in Briarcliff are 45 to 59 minutes (147 commuters, 18.8%), 20 to 24 minutes (101 commuters, 12.9%), and 35 to 39 minutes (94 commuters, 12.0%).
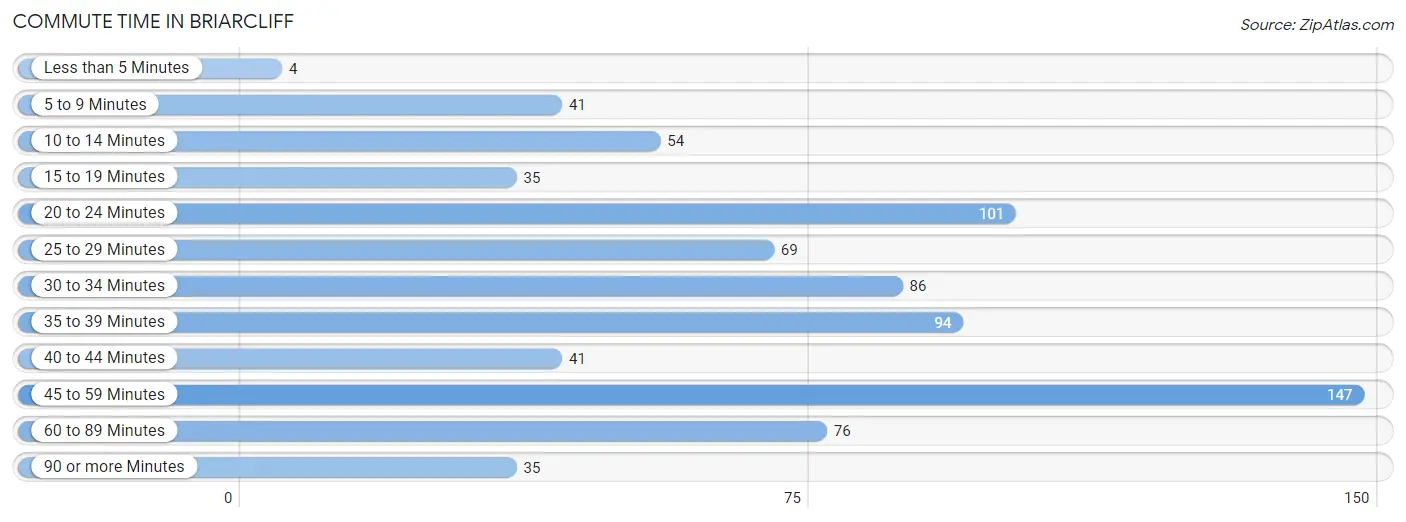
| Commute Time | # Commuters | % Commuters |
| Less than 5 Minutes | 4 | 0.5% |
| 5 to 9 Minutes | 41 | 5.2% |
| 10 to 14 Minutes | 54 | 6.9% |
| 15 to 19 Minutes | 35 | 4.5% |
| 20 to 24 Minutes | 101 | 12.9% |
| 25 to 29 Minutes | 69 | 8.8% |
| 30 to 34 Minutes | 86 | 11.0% |
| 35 to 39 Minutes | 94 | 12.0% |
| 40 to 44 Minutes | 41 | 5.2% |
| 45 to 59 Minutes | 147 | 18.8% |
| 60 to 89 Minutes | 76 | 9.7% |
| 90 or more Minutes | 35 | 4.5% |
Commute Time by Sex in Briarcliff
The most common commute times in Briarcliff are 45 to 59 minutes (89 commuters, 21.6%) for males and 35 to 39 minutes (83 commuters, 22.4%) for females.
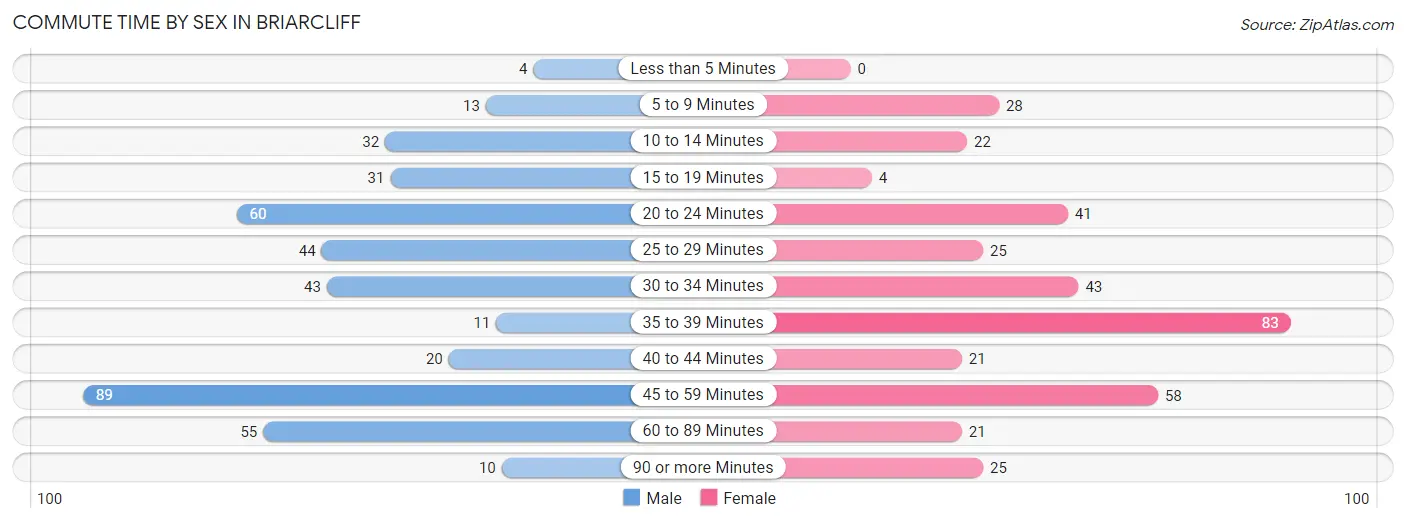
| Commute Time | Male | Female |
| Less than 5 Minutes | 4 (1.0%) | 0 (0.0%) |
| 5 to 9 Minutes | 13 (3.2%) | 28 (7.5%) |
| 10 to 14 Minutes | 32 (7.8%) | 22 (5.9%) |
| 15 to 19 Minutes | 31 (7.5%) | 4 (1.1%) |
| 20 to 24 Minutes | 60 (14.6%) | 41 (11.1%) |
| 25 to 29 Minutes | 44 (10.7%) | 25 (6.7%) |
| 30 to 34 Minutes | 43 (10.4%) | 43 (11.6%) |
| 35 to 39 Minutes | 11 (2.7%) | 83 (22.4%) |
| 40 to 44 Minutes | 20 (4.9%) | 21 (5.7%) |
| 45 to 59 Minutes | 89 (21.6%) | 58 (15.6%) |
| 60 to 89 Minutes | 55 (13.4%) | 21 (5.7%) |
| 90 or more Minutes | 10 (2.4%) | 25 (6.7%) |
Time of Departure to Work by Sex in Briarcliff
The most frequent times of departure to work in Briarcliff are 9:00 AM to 9:59 AM (60, 14.6%) for males and 8:00 AM to 8:29 AM (62, 16.7%) for females.
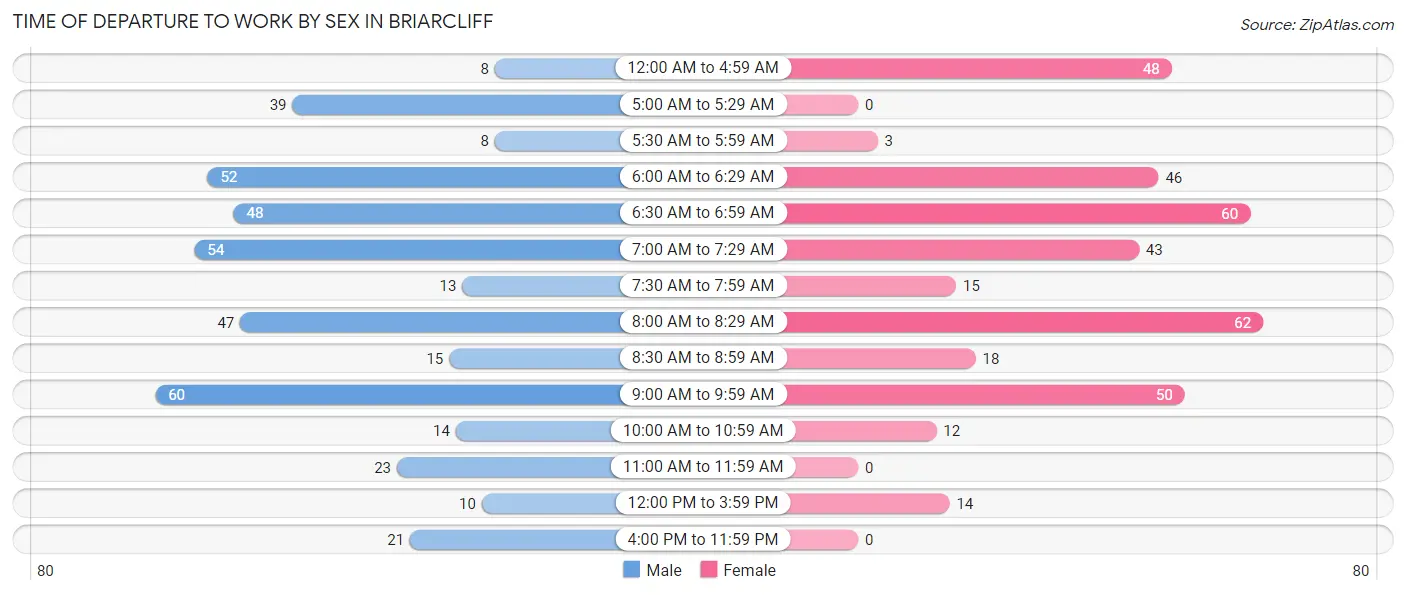
| Time of Departure | Male | Female |
| 12:00 AM to 4:59 AM | 8 (1.9%) | 48 (12.9%) |
| 5:00 AM to 5:29 AM | 39 (9.5%) | 0 (0.0%) |
| 5:30 AM to 5:59 AM | 8 (1.9%) | 3 (0.8%) |
| 6:00 AM to 6:29 AM | 52 (12.6%) | 46 (12.4%) |
| 6:30 AM to 6:59 AM | 48 (11.7%) | 60 (16.2%) |
| 7:00 AM to 7:29 AM | 54 (13.1%) | 43 (11.6%) |
| 7:30 AM to 7:59 AM | 13 (3.2%) | 15 (4.0%) |
| 8:00 AM to 8:29 AM | 47 (11.4%) | 62 (16.7%) |
| 8:30 AM to 8:59 AM | 15 (3.6%) | 18 (4.9%) |
| 9:00 AM to 9:59 AM | 60 (14.6%) | 50 (13.5%) |
| 10:00 AM to 10:59 AM | 14 (3.4%) | 12 (3.2%) |
| 11:00 AM to 11:59 AM | 23 (5.6%) | 0 (0.0%) |
| 12:00 PM to 3:59 PM | 10 (2.4%) | 14 (3.8%) |
| 4:00 PM to 11:59 PM | 21 (5.1%) | 0 (0.0%) |
| Total | 412 (100.0%) | 371 (100.0%) |
Housing Occupancy in Briarcliff
Occupancy by Ownership in Briarcliff
Of the total 876 dwellings in Briarcliff, owner-occupied units account for 764 (87.2%), while renter-occupied units make up 112 (12.8%).
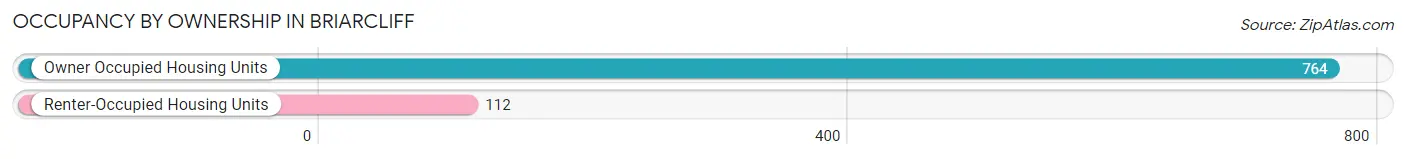
| Occupancy | # Housing Units | % Housing Units |
| Owner Occupied Housing Units | 764 | 87.2% |
| Renter-Occupied Housing Units | 112 | 12.8% |
| Total Occupied Housing Units | 876 | 100.0% |
Occupancy by Household Size in Briarcliff
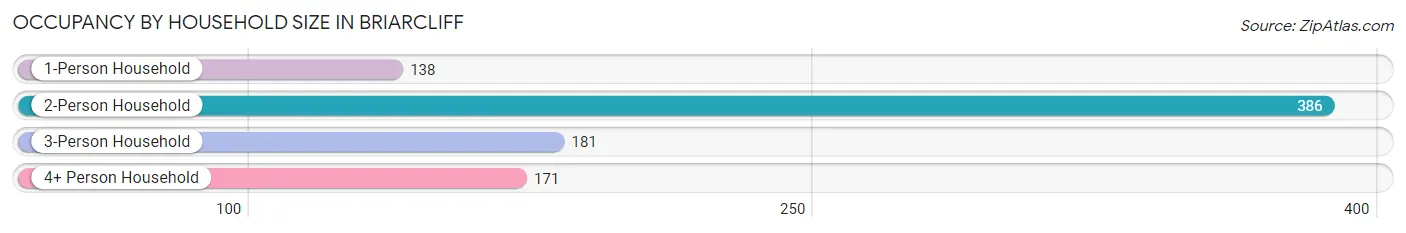
| Household Size | # Housing Units | % Housing Units |
| 1-Person Household | 138 | 15.8% |
| 2-Person Household | 386 | 44.1% |
| 3-Person Household | 181 | 20.7% |
| 4+ Person Household | 171 | 19.5% |
| Total Housing Units | 876 | 100.0% |
Occupancy by Ownership by Household Size in Briarcliff
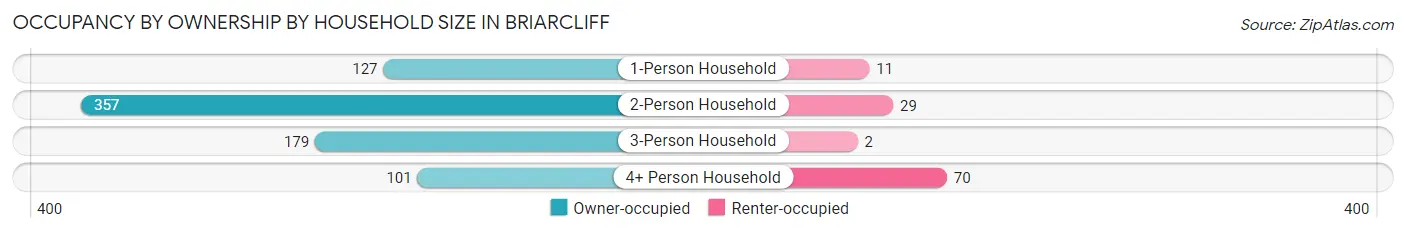
| Household Size | Owner-occupied | Renter-occupied |
| 1-Person Household | 127 (92.0%) | 11 (8.0%) |
| 2-Person Household | 357 (92.5%) | 29 (7.5%) |
| 3-Person Household | 179 (98.9%) | 2 (1.1%) |
| 4+ Person Household | 101 (59.1%) | 70 (40.9%) |
| Total Housing Units | 764 (87.2%) | 112 (12.8%) |
Occupancy by Educational Attainment in Briarcliff
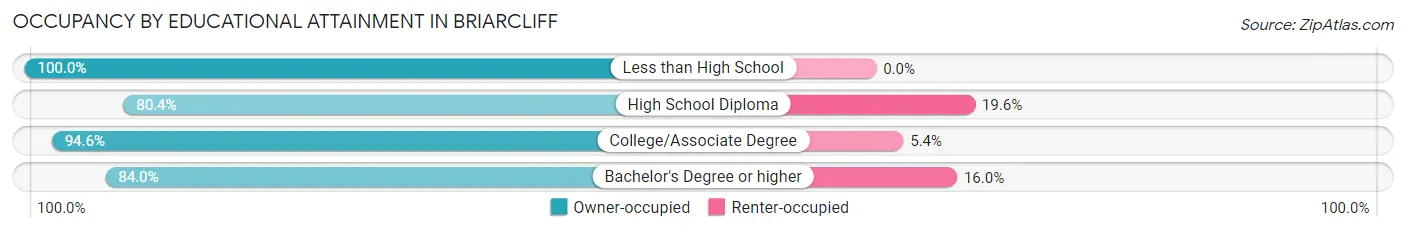
| Household Size | Owner-occupied | Renter-occupied |
| Less than High School | 13 (100.0%) | 0 (0.0%) |
| High School Diploma | 78 (80.4%) | 19 (19.6%) |
| College/Associate Degree | 264 (94.6%) | 15 (5.4%) |
| Bachelor's Degree or higher | 409 (84.0%) | 78 (16.0%) |
Occupancy by Age of Householder in Briarcliff
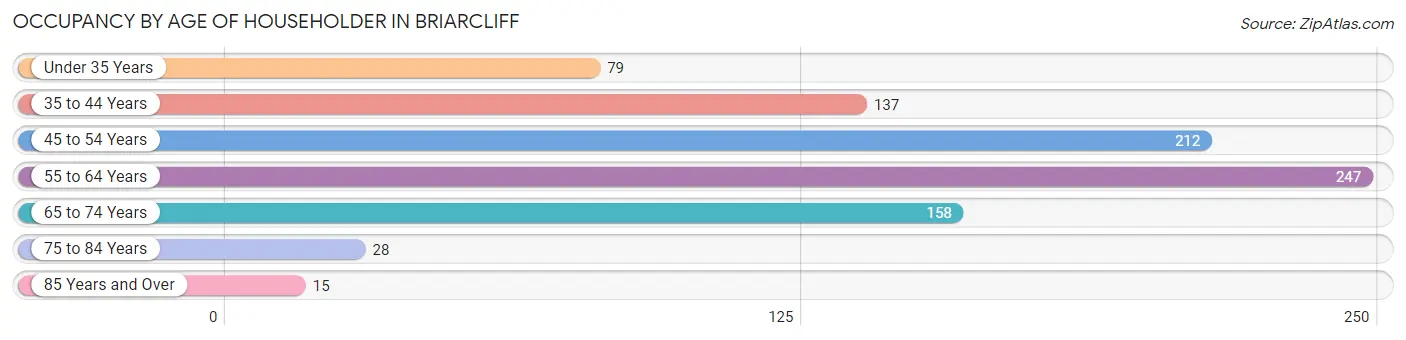
| Age Bracket | # Households | % Households |
| Under 35 Years | 79 | 9.0% |
| 35 to 44 Years | 137 | 15.6% |
| 45 to 54 Years | 212 | 24.2% |
| 55 to 64 Years | 247 | 28.2% |
| 65 to 74 Years | 158 | 18.0% |
| 75 to 84 Years | 28 | 3.2% |
| 85 Years and Over | 15 | 1.7% |
| Total | 876 | 100.0% |
Housing Finances in Briarcliff
Median Income by Occupancy in Briarcliff
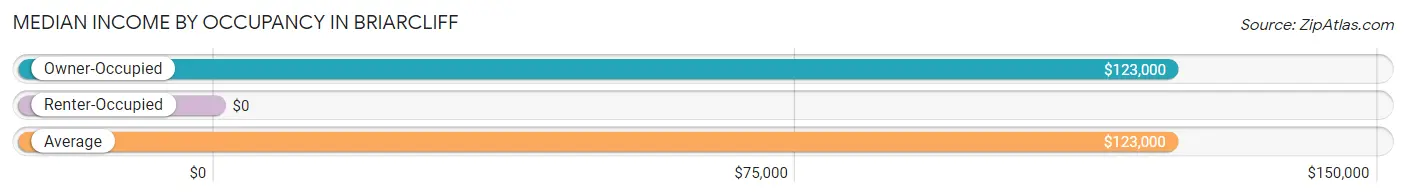
| Occupancy Type | # Households | Median Income |
| Owner-Occupied | 764 (87.2%) | $123,000 |
| Renter-Occupied | 112 (12.8%) | $0 |
| Average | 876 (100.0%) | $123,000 |
Occupancy by Householder Income Bracket in Briarcliff
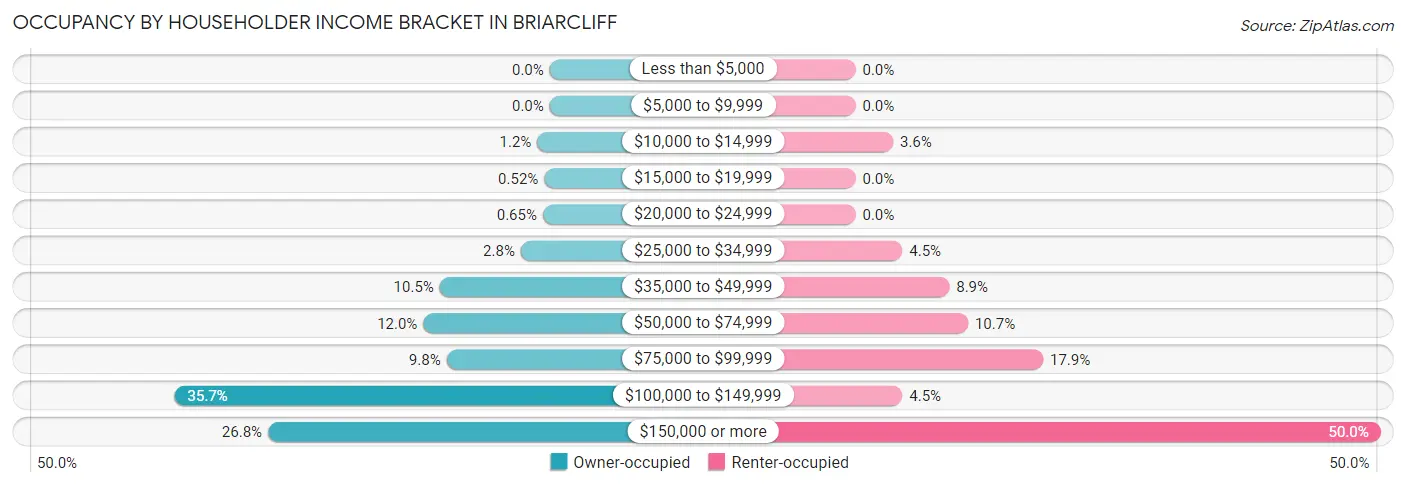
| Income Bracket | Owner-occupied | Renter-occupied |
| Less than $5,000 | 0 (0.0%) | 0 (0.0%) |
| $5,000 to $9,999 | 0 (0.0%) | 0 (0.0%) |
| $10,000 to $14,999 | 9 (1.2%) | 4 (3.6%) |
| $15,000 to $19,999 | 4 (0.5%) | 0 (0.0%) |
| $20,000 to $24,999 | 5 (0.6%) | 0 (0.0%) |
| $25,000 to $34,999 | 21 (2.8%) | 5 (4.5%) |
| $35,000 to $49,999 | 80 (10.5%) | 10 (8.9%) |
| $50,000 to $74,999 | 92 (12.0%) | 12 (10.7%) |
| $75,000 to $99,999 | 75 (9.8%) | 20 (17.9%) |
| $100,000 to $149,999 | 273 (35.7%) | 5 (4.5%) |
| $150,000 or more | 205 (26.8%) | 56 (50.0%) |
| Total | 764 (100.0%) | 112 (100.0%) |
Monthly Housing Cost Tiers in Briarcliff
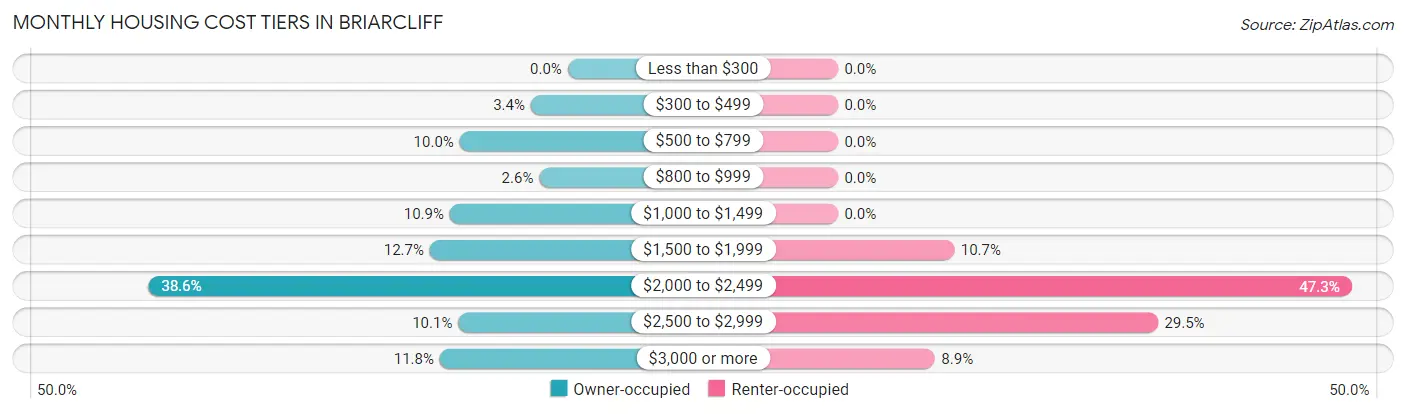
| Monthly Cost | Owner-occupied | Renter-occupied |
| Less than $300 | 0 (0.0%) | 0 (0.0%) |
| $300 to $499 | 26 (3.4%) | 0 (0.0%) |
| $500 to $799 | 76 (10.0%) | 0 (0.0%) |
| $800 to $999 | 20 (2.6%) | 0 (0.0%) |
| $1,000 to $1,499 | 83 (10.9%) | 0 (0.0%) |
| $1,500 to $1,999 | 97 (12.7%) | 12 (10.7%) |
| $2,000 to $2,499 | 295 (38.6%) | 53 (47.3%) |
| $2,500 to $2,999 | 77 (10.1%) | 33 (29.5%) |
| $3,000 or more | 90 (11.8%) | 10 (8.9%) |
| Total | 764 (100.0%) | 112 (100.0%) |
Physical Housing Characteristics in Briarcliff
Housing Structures in Briarcliff
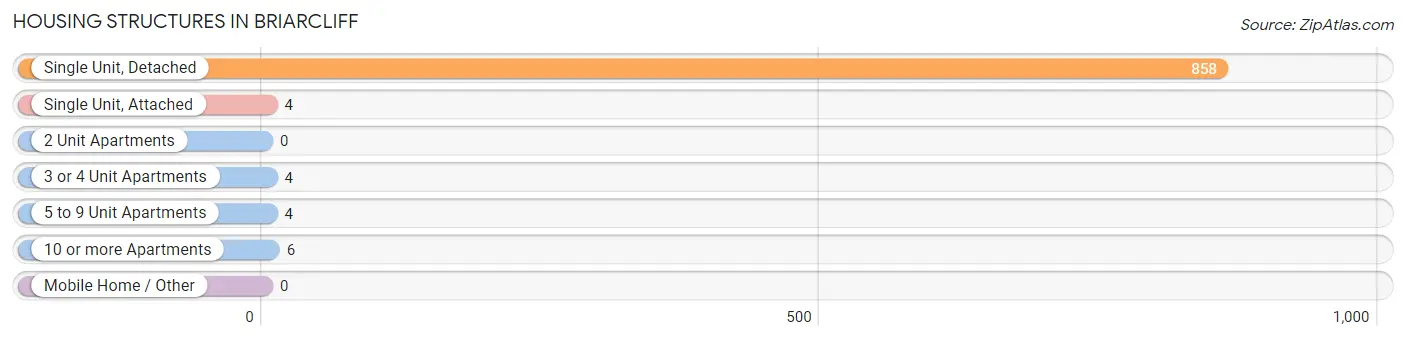
| Structure Type | # Housing Units | % Housing Units |
| Single Unit, Detached | 858 | 98.0% |
| Single Unit, Attached | 4 | 0.5% |
| 2 Unit Apartments | 0 | 0.0% |
| 3 or 4 Unit Apartments | 4 | 0.5% |
| 5 to 9 Unit Apartments | 4 | 0.5% |
| 10 or more Apartments | 6 | 0.7% |
| Mobile Home / Other | 0 | 0.0% |
| Total | 876 | 100.0% |
Housing Structures by Occupancy in Briarcliff
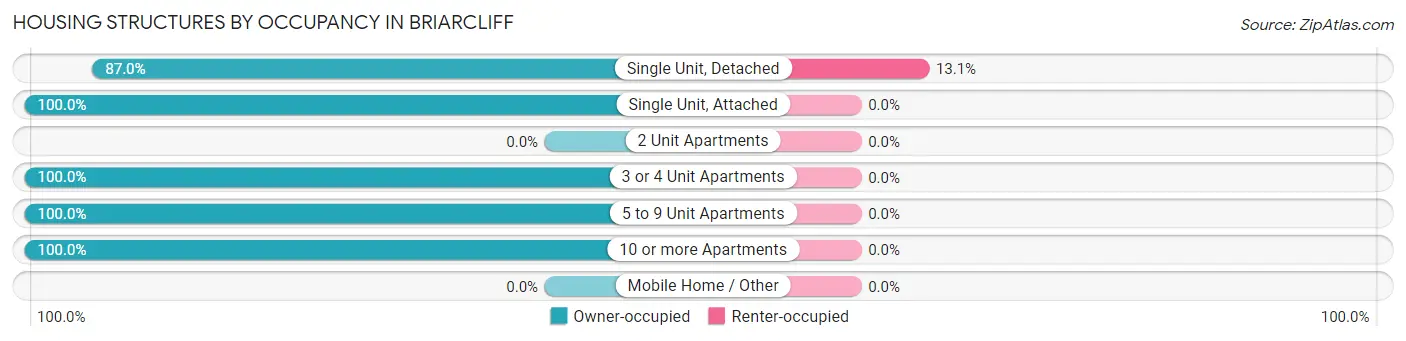
| Structure Type | Owner-occupied | Renter-occupied |
| Single Unit, Detached | 746 (87.0%) | 112 (13.1%) |
| Single Unit, Attached | 4 (100.0%) | 0 (0.0%) |
| 2 Unit Apartments | 0 (0.0%) | 0 (0.0%) |
| 3 or 4 Unit Apartments | 4 (100.0%) | 0 (0.0%) |
| 5 to 9 Unit Apartments | 4 (100.0%) | 0 (0.0%) |
| 10 or more Apartments | 6 (100.0%) | 0 (0.0%) |
| Mobile Home / Other | 0 (0.0%) | 0 (0.0%) |
| Total | 764 (87.2%) | 112 (12.8%) |
Housing Structures by Number of Rooms in Briarcliff
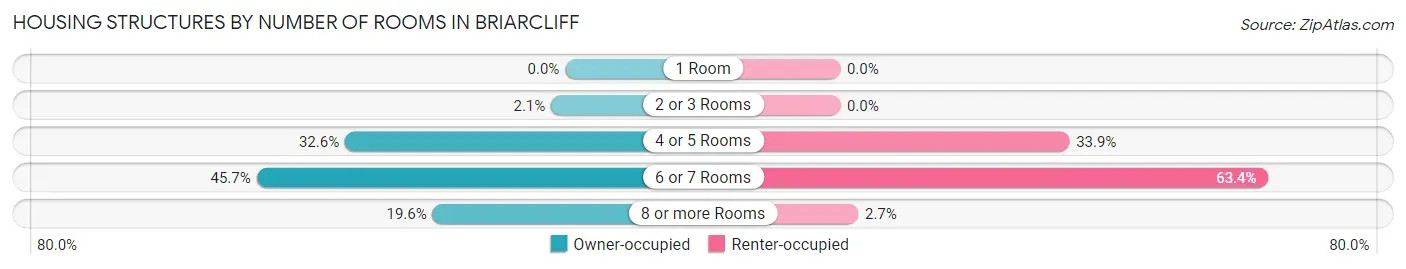
| Number of Rooms | Owner-occupied | Renter-occupied |
| 1 Room | 0 (0.0%) | 0 (0.0%) |
| 2 or 3 Rooms | 16 (2.1%) | 0 (0.0%) |
| 4 or 5 Rooms | 249 (32.6%) | 38 (33.9%) |
| 6 or 7 Rooms | 349 (45.7%) | 71 (63.4%) |
| 8 or more Rooms | 150 (19.6%) | 3 (2.7%) |
| Total | 764 (100.0%) | 112 (100.0%) |
Housing Structure by Heating Type in Briarcliff
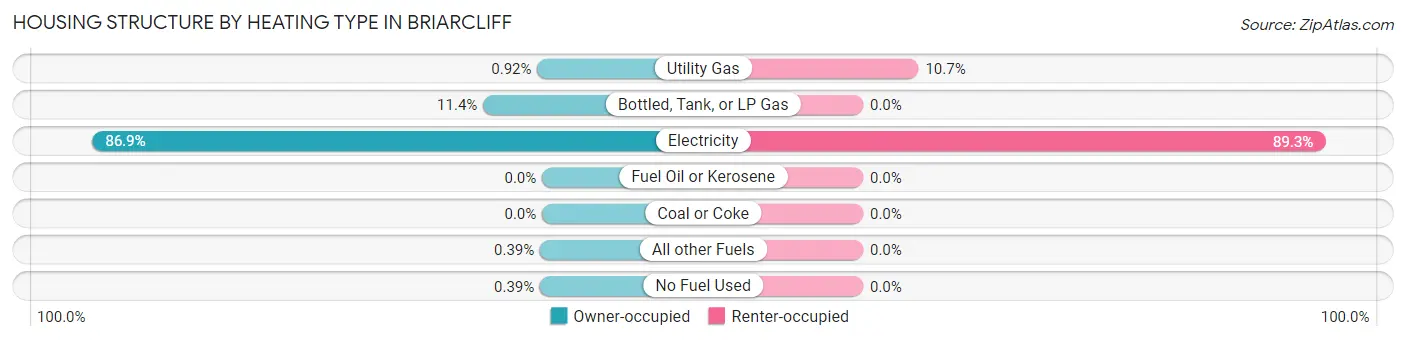
| Heating Type | Owner-occupied | Renter-occupied |
| Utility Gas | 7 (0.9%) | 12 (10.7%) |
| Bottled, Tank, or LP Gas | 87 (11.4%) | 0 (0.0%) |
| Electricity | 664 (86.9%) | 100 (89.3%) |
| Fuel Oil or Kerosene | 0 (0.0%) | 0 (0.0%) |
| Coal or Coke | 0 (0.0%) | 0 (0.0%) |
| All other Fuels | 3 (0.4%) | 0 (0.0%) |
| No Fuel Used | 3 (0.4%) | 0 (0.0%) |
| Total | 764 (100.0%) | 112 (100.0%) |
Household Vehicle Usage in Briarcliff
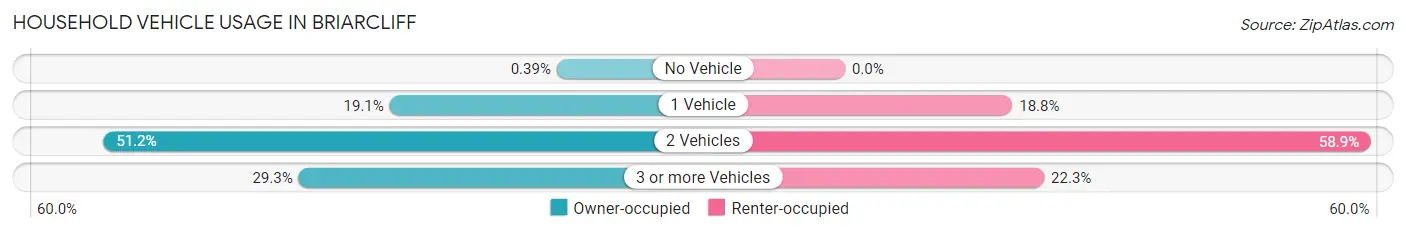
| Vehicles per Household | Owner-occupied | Renter-occupied |
| No Vehicle | 3 (0.4%) | 0 (0.0%) |
| 1 Vehicle | 146 (19.1%) | 21 (18.8%) |
| 2 Vehicles | 391 (51.2%) | 66 (58.9%) |
| 3 or more Vehicles | 224 (29.3%) | 25 (22.3%) |
| Total | 764 (100.0%) | 112 (100.0%) |
Real Estate & Mortgages in Briarcliff
Real Estate and Mortgage Overview in Briarcliff
| Characteristic | Without Mortgage | With Mortgage |
| Housing Units | 157 | 607 |
| Median Property Value | $416,700 | $426,000 |
| Median Household Income | $65,583 | $185 |
| Monthly Housing Costs | $749 | $90 |
| Real Estate Taxes | $5,717 | $0 |
Property Value by Mortgage Status in Briarcliff
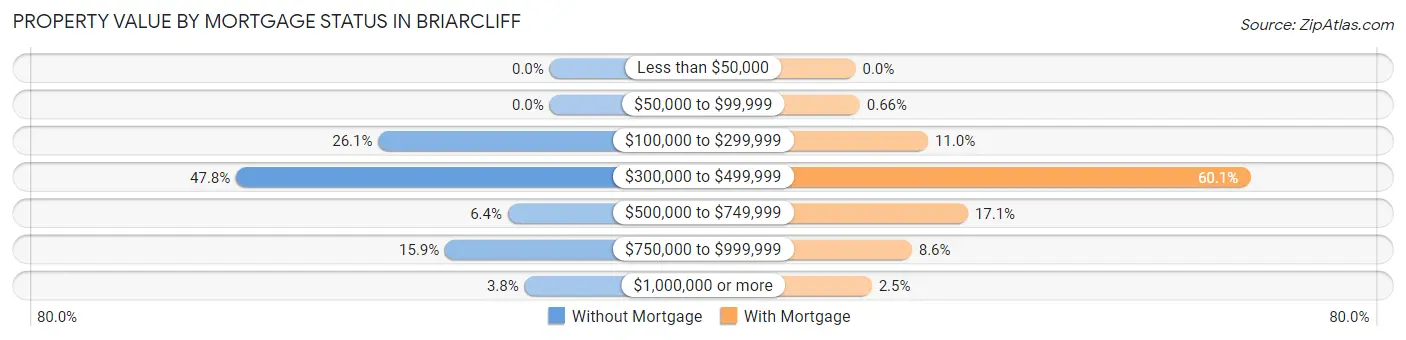
| Property Value | Without Mortgage | With Mortgage |
| Less than $50,000 | 0 (0.0%) | 0 (0.0%) |
| $50,000 to $99,999 | 0 (0.0%) | 4 (0.7%) |
| $100,000 to $299,999 | 41 (26.1%) | 67 (11.0%) |
| $300,000 to $499,999 | 75 (47.8%) | 365 (60.1%) |
| $500,000 to $749,999 | 10 (6.4%) | 104 (17.1%) |
| $750,000 to $999,999 | 25 (15.9%) | 52 (8.6%) |
| $1,000,000 or more | 6 (3.8%) | 15 (2.5%) |
| Total | 157 (100.0%) | 607 (100.0%) |
Household Income by Mortgage Status in Briarcliff
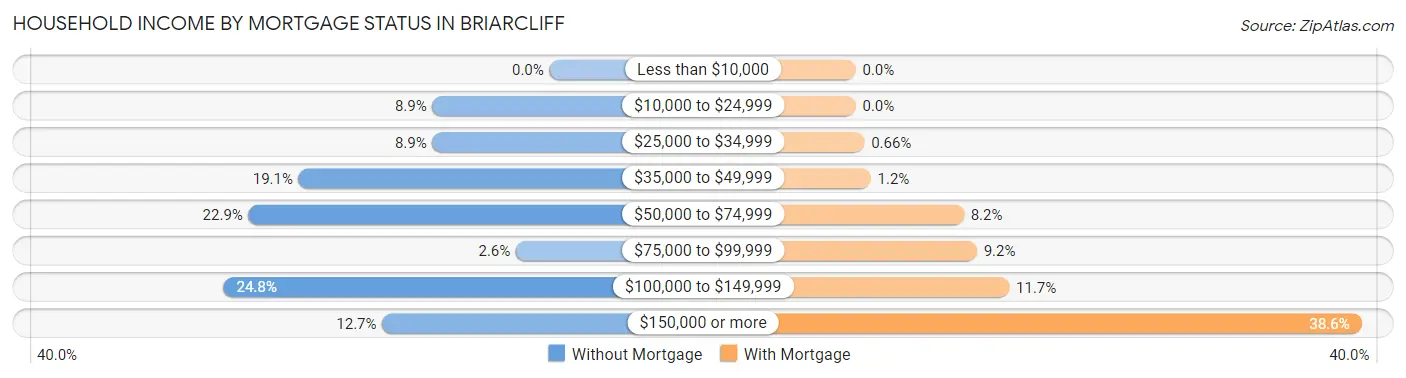
| Household Income | Without Mortgage | With Mortgage |
| Less than $10,000 | 0 (0.0%) | 0 (0.0%) |
| $10,000 to $24,999 | 14 (8.9%) | 0 (0.0%) |
| $25,000 to $34,999 | 14 (8.9%) | 4 (0.7%) |
| $35,000 to $49,999 | 30 (19.1%) | 7 (1.1%) |
| $50,000 to $74,999 | 36 (22.9%) | 50 (8.2%) |
| $75,000 to $99,999 | 4 (2.5%) | 56 (9.2%) |
| $100,000 to $149,999 | 39 (24.8%) | 71 (11.7%) |
| $150,000 or more | 20 (12.7%) | 234 (38.6%) |
| Total | 157 (100.0%) | 607 (100.0%) |
Property Value to Household Income Ratio in Briarcliff
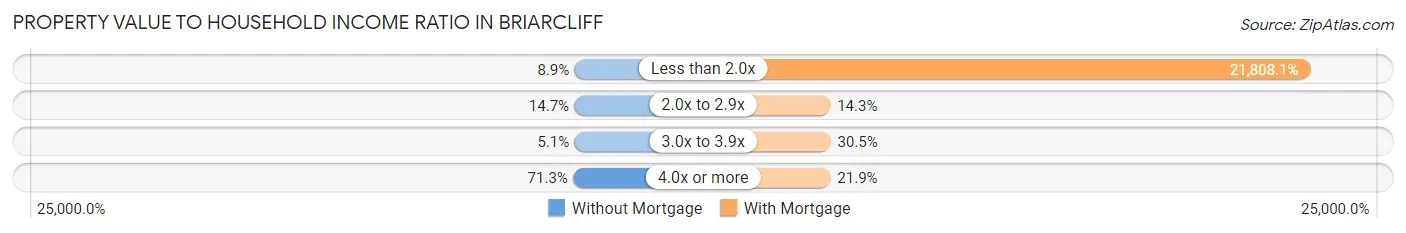
| Value-to-Income Ratio | Without Mortgage | With Mortgage |
| Less than 2.0x | 14 (8.9%) | 132,375 (21,808.1%) |
| 2.0x to 2.9x | 23 (14.6%) | 87 (14.3%) |
| 3.0x to 3.9x | 8 (5.1%) | 185 (30.5%) |
| 4.0x or more | 112 (71.3%) | 133 (21.9%) |
| Total | 157 (100.0%) | 607 (100.0%) |
Real Estate Taxes by Mortgage Status in Briarcliff
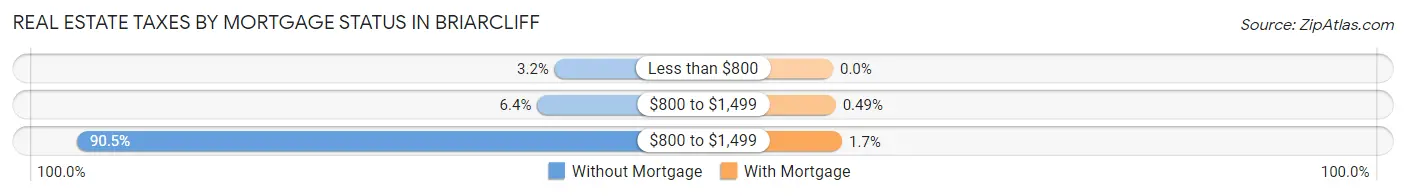
| Property Taxes | Without Mortgage | With Mortgage |
| Less than $800 | 5 (3.2%) | 0 (0.0%) |
| $800 to $1,499 | 10 (6.4%) | 3 (0.5%) |
| $800 to $1,499 | 142 (90.4%) | 10 (1.7%) |
| Total | 157 (100.0%) | 607 (100.0%) |
Health & Disability in Briarcliff
Health Insurance Coverage by Age in Briarcliff
| Age Bracket | With Coverage | Without Coverage |
| Under 6 Years | 202 (100.0%) | 0 (0.0%) |
| 6 to 18 Years | 368 (92.9%) | 28 (7.1%) |
| 19 to 25 Years | 71 (88.7%) | 9 (11.3%) |
| 26 to 34 Years | 176 (93.6%) | 12 (6.4%) |
| 35 to 44 Years | 222 (89.2%) | 27 (10.8%) |
| 45 to 54 Years | 388 (95.8%) | 17 (4.2%) |
| 55 to 64 Years | 400 (91.7%) | 36 (8.3%) |
| 65 to 74 Years | 243 (97.2%) | 7 (2.8%) |
| 75 Years and older | 67 (100.0%) | 0 (0.0%) |
| Total | 2,137 (94.0%) | 136 (6.0%) |
Health Insurance Coverage by Citizenship Status in Briarcliff
| Citizenship Status | With Coverage | Without Coverage |
| Native Born | 202 (100.0%) | 0 (0.0%) |
| Foreign Born, Citizen | 368 (92.9%) | 28 (7.1%) |
| Foreign Born, not a Citizen | 71 (88.7%) | 9 (11.3%) |
Health Insurance Coverage by Household Income in Briarcliff
| Household Income | With Coverage | Without Coverage |
| Under $25,000 | 26 (78.8%) | 7 (21.2%) |
| $25,000 to $49,999 | 210 (92.1%) | 18 (7.9%) |
| $50,000 to $74,999 | 223 (82.0%) | 49 (18.0%) |
| $75,000 to $99,999 | 241 (97.6%) | 6 (2.4%) |
| $100,000 and over | 1,437 (96.3%) | 56 (3.7%) |
Public vs Private Health Insurance Coverage by Age in Briarcliff
| Age Bracket | Public Insurance | Private Insurance |
| Under 6 | 0 (0.0%) | 202 (100.0%) |
| 6 to 18 Years | 14 (3.5%) | 359 (90.7%) |
| 19 to 25 Years | 11 (13.8%) | 71 (88.7%) |
| 25 to 34 Years | 0 (0.0%) | 176 (93.6%) |
| 35 to 44 Years | 10 (4.0%) | 212 (85.1%) |
| 45 to 54 Years | 19 (4.7%) | 373 (92.1%) |
| 55 to 64 Years | 7 (1.6%) | 396 (90.8%) |
| 65 to 74 Years | 243 (97.2%) | 151 (60.4%) |
| 75 Years and over | 67 (100.0%) | 38 (56.7%) |
| Total | 371 (16.3%) | 1,978 (87.0%) |
Disability Status by Sex by Age in Briarcliff
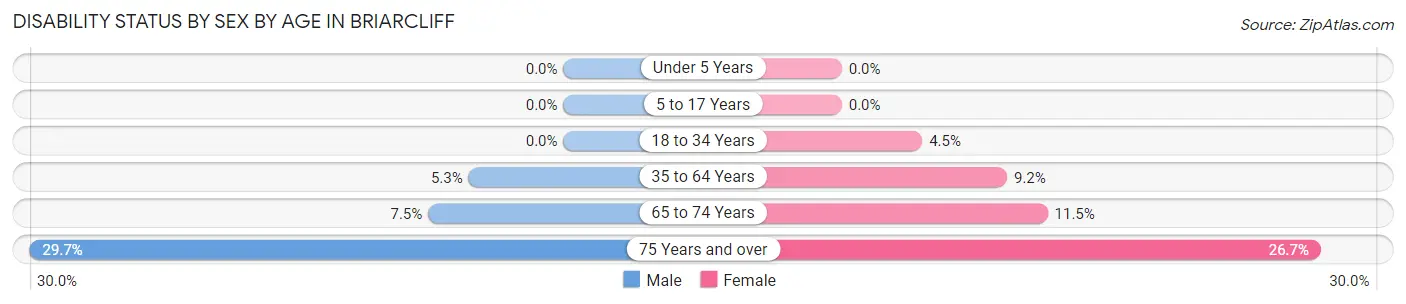
| Age Bracket | Male | Female |
| Under 5 Years | 0 (0.0%) | 0 (0.0%) |
| 5 to 17 Years | 0 (0.0%) | 0 (0.0%) |
| 18 to 34 Years | 0 (0.0%) | 6 (4.5%) |
| 35 to 64 Years | 30 (5.3%) | 48 (9.2%) |
| 65 to 74 Years | 7 (7.5%) | 18 (11.5%) |
| 75 Years and over | 11 (29.7%) | 8 (26.7%) |
Disability Class by Sex by Age in Briarcliff
Disability Class: Hearing Difficulty
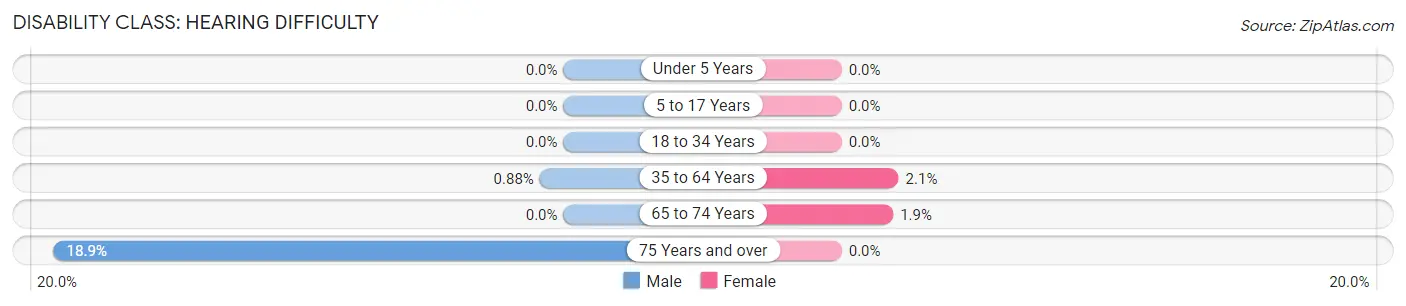
| Age Bracket | Male | Female |
| Under 5 Years | 0 (0.0%) | 0 (0.0%) |
| 5 to 17 Years | 0 (0.0%) | 0 (0.0%) |
| 18 to 34 Years | 0 (0.0%) | 0 (0.0%) |
| 35 to 64 Years | 5 (0.9%) | 11 (2.1%) |
| 65 to 74 Years | 0 (0.0%) | 3 (1.9%) |
| 75 Years and over | 7 (18.9%) | 0 (0.0%) |
Disability Class: Vision Difficulty
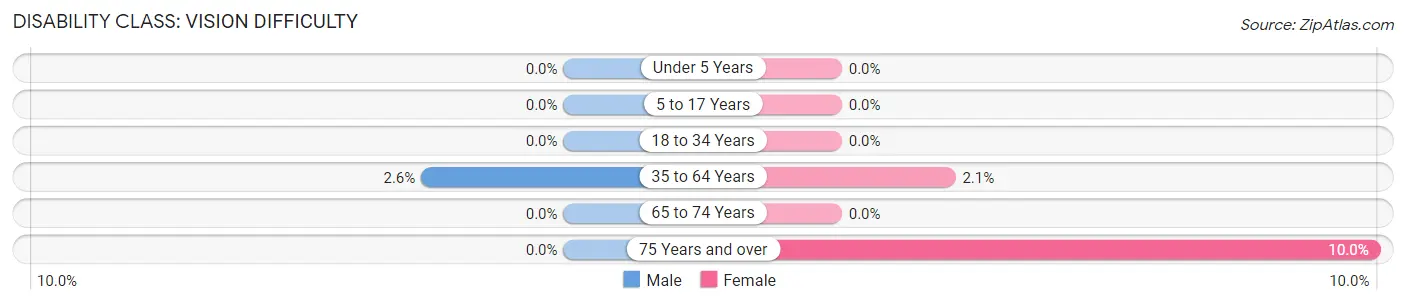
| Age Bracket | Male | Female |
| Under 5 Years | 0 (0.0%) | 0 (0.0%) |
| 5 to 17 Years | 0 (0.0%) | 0 (0.0%) |
| 18 to 34 Years | 0 (0.0%) | 0 (0.0%) |
| 35 to 64 Years | 15 (2.6%) | 11 (2.1%) |
| 65 to 74 Years | 0 (0.0%) | 0 (0.0%) |
| 75 Years and over | 0 (0.0%) | 3 (10.0%) |
Disability Class: Cognitive Difficulty
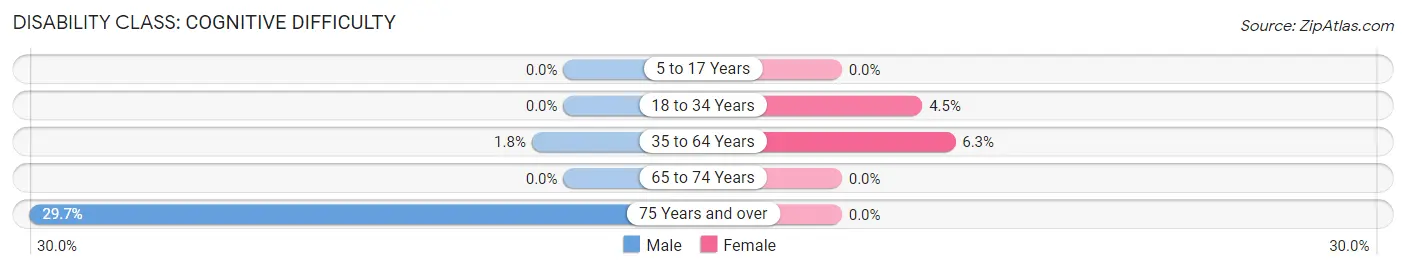
| Age Bracket | Male | Female |
| 5 to 17 Years | 0 (0.0%) | 0 (0.0%) |
| 18 to 34 Years | 0 (0.0%) | 6 (4.5%) |
| 35 to 64 Years | 10 (1.8%) | 33 (6.3%) |
| 65 to 74 Years | 0 (0.0%) | 0 (0.0%) |
| 75 Years and over | 11 (29.7%) | 0 (0.0%) |
Disability Class: Ambulatory Difficulty
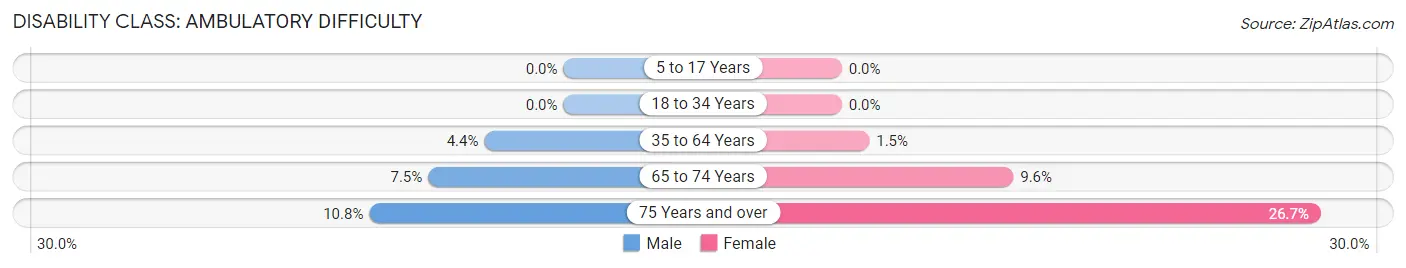
| Age Bracket | Male | Female |
| 5 to 17 Years | 0 (0.0%) | 0 (0.0%) |
| 18 to 34 Years | 0 (0.0%) | 0 (0.0%) |
| 35 to 64 Years | 25 (4.4%) | 8 (1.5%) |
| 65 to 74 Years | 7 (7.5%) | 15 (9.6%) |
| 75 Years and over | 4 (10.8%) | 8 (26.7%) |
Disability Class: Self-Care Difficulty
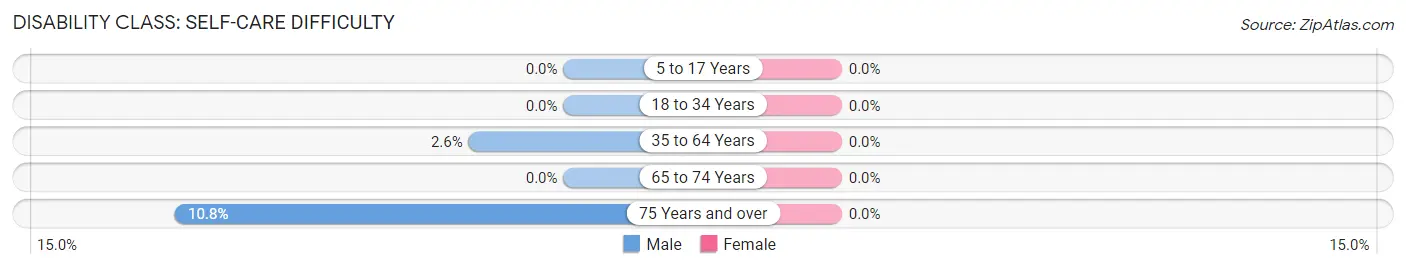
| Age Bracket | Male | Female |
| 5 to 17 Years | 0 (0.0%) | 0 (0.0%) |
| 18 to 34 Years | 0 (0.0%) | 0 (0.0%) |
| 35 to 64 Years | 15 (2.6%) | 0 (0.0%) |
| 65 to 74 Years | 0 (0.0%) | 0 (0.0%) |
| 75 Years and over | 4 (10.8%) | 0 (0.0%) |
Technology Access in Briarcliff
Computing Device Access in Briarcliff
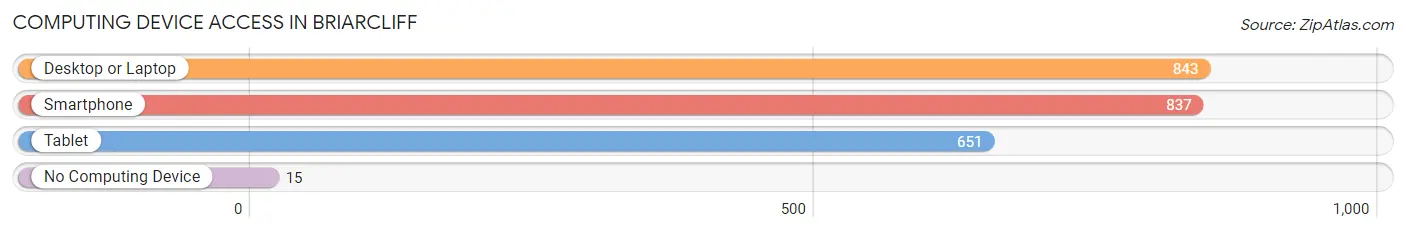
| Device Type | # Households | % Households |
| Desktop or Laptop | 843 | 96.2% |
| Smartphone | 837 | 95.6% |
| Tablet | 651 | 74.3% |
| No Computing Device | 15 | 1.7% |
| Total | 876 | 100.0% |
Internet Access in Briarcliff
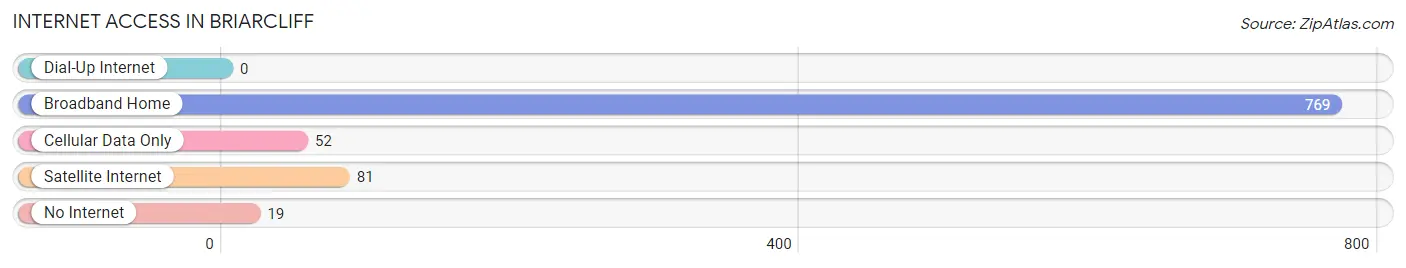
| Internet Type | # Households | % Households |
| Dial-Up Internet | 0 | 0.0% |
| Broadband Home | 769 | 87.8% |
| Cellular Data Only | 52 | 5.9% |
| Satellite Internet | 81 | 9.2% |
| No Internet | 19 | 2.2% |
| Total | 876 | 100.0% |
Briarcliff Summary
Briarcliff is a small unincorporated community located in Travis County, Texas, United States. It is situated on the western edge of Lake Travis, approximately 25 miles northwest of Austin. The community is part of the Austin–Round Rock–San Marcos metropolitan area.
History
The area that is now Briarcliff was first settled in the late 1800s by German immigrants. The community was originally known as “Briarcliff” after the local creek, which was named for the abundance of briar bushes in the area. The first post office was established in 1891, and the community was officially incorporated in 1895.
In the early 1900s, the area was a popular destination for vacationers, who would come to enjoy the lake and the surrounding hills. The community was home to several resorts, including the Briarcliff Hotel, which was built in 1906 and was the largest hotel in the area.
In the 1950s, the area began to experience rapid growth as the city of Austin expanded. The population of Briarcliff increased from just over 200 in 1950 to over 1,000 by 1960.
Geography
Briarcliff is located in western Travis County, approximately 25 miles northwest of Austin. The community is situated on the western edge of Lake Travis, which is part of the Colorado River system. The terrain is hilly and the area is heavily wooded.
The climate in Briarcliff is humid subtropical, with hot summers and mild winters. The average annual temperature is 68°F, and the average annual precipitation is 33 inches.
Economy
The economy of Briarcliff is largely based on tourism and recreation. The area is home to several resorts and marinas, as well as a number of restaurants and other businesses catering to visitors.
The community is also home to several small businesses, including a winery, a brewery, and a distillery.
Demographics
As of the 2010 census, the population of Briarcliff was 1,845. The racial makeup of the community was 87.3% White, 5.2% Hispanic or Latino, 3.2% African American, and 2.3% Asian.
The median household income in Briarcliff was $68,750, and the median family income was $77,500. The per capita income was $35,000.
Conclusion
Briarcliff is a small unincorporated community located in Travis County, Texas, United States. It is situated on the western edge of Lake Travis, approximately 25 miles northwest of Austin. The community is part of the Austin–Round Rock–San Marcos metropolitan area. The area was first settled in the late 1800s by German immigrants, and the population has grown steadily since then. The economy of Briarcliff is largely based on tourism and recreation, and the community is home to several resorts, restaurants, and other businesses catering to visitors. As of the 2010 census, the population of Briarcliff was 1,845. The racial makeup of the community was 87.3% White, 5.2% Hispanic or Latino, 3.2% African American, and 2.3% Asian. The median household income in Briarcliff was $68,750, and the median family income was $77,500.
Common Questions
What is the Total Population of Briarcliff?
Total Population of Briarcliff is 2,273.
What is the Total Male Population of Briarcliff?
Total Male Population of Briarcliff is 1,119.
What is the Total Female Population of Briarcliff?
Total Female Population of Briarcliff is 1,154.
What is the Ratio of Males per 100 Females in Briarcliff?
There are 96.97 Males per 100 Females in Briarcliff.
What is the Ratio of Females per 100 Males in Briarcliff?
There are 103.13 Females per 100 Males in Briarcliff.
What is the Median Population Age in Briarcliff?
Median Population Age in Briarcliff is 45.3 Years.
What is the Average Family Size in Briarcliff
Average Family Size in Briarcliff is 2.9 People.
What is the Average Household Size in Briarcliff
Average Household Size in Briarcliff is 2.6 People.
What is Per Capita Income in Briarcliff?
Per Capita income in Briarcliff is $52,635.
What is the Median Family Income in Briarcliff?
Median Family Income in Briarcliff is $131,625.
What is the Median Household income in Briarcliff?
Median Household Income in Briarcliff is $123,000.
What is Income or Wage Gap in Briarcliff?
Income or Wage Gap in Briarcliff is 14.7%.
Women in Briarcliff earn 85.3 cents for every dollar earned by a man.
What is Inequality or Gini Index in Briarcliff?
Inequality or Gini Index in Briarcliff is 0.34.
How Large is the Labor Force in Briarcliff?
There are 1,140 People in the Labor Forcein in Briarcliff.
What is the Percentage of People in the Labor Force in Briarcliff?
66.5% of People are in the Labor Force in Briarcliff.
What is the Unemployment Rate in Briarcliff?
Unemployment Rate in Briarcliff is 2.0%.