Beach City, TX
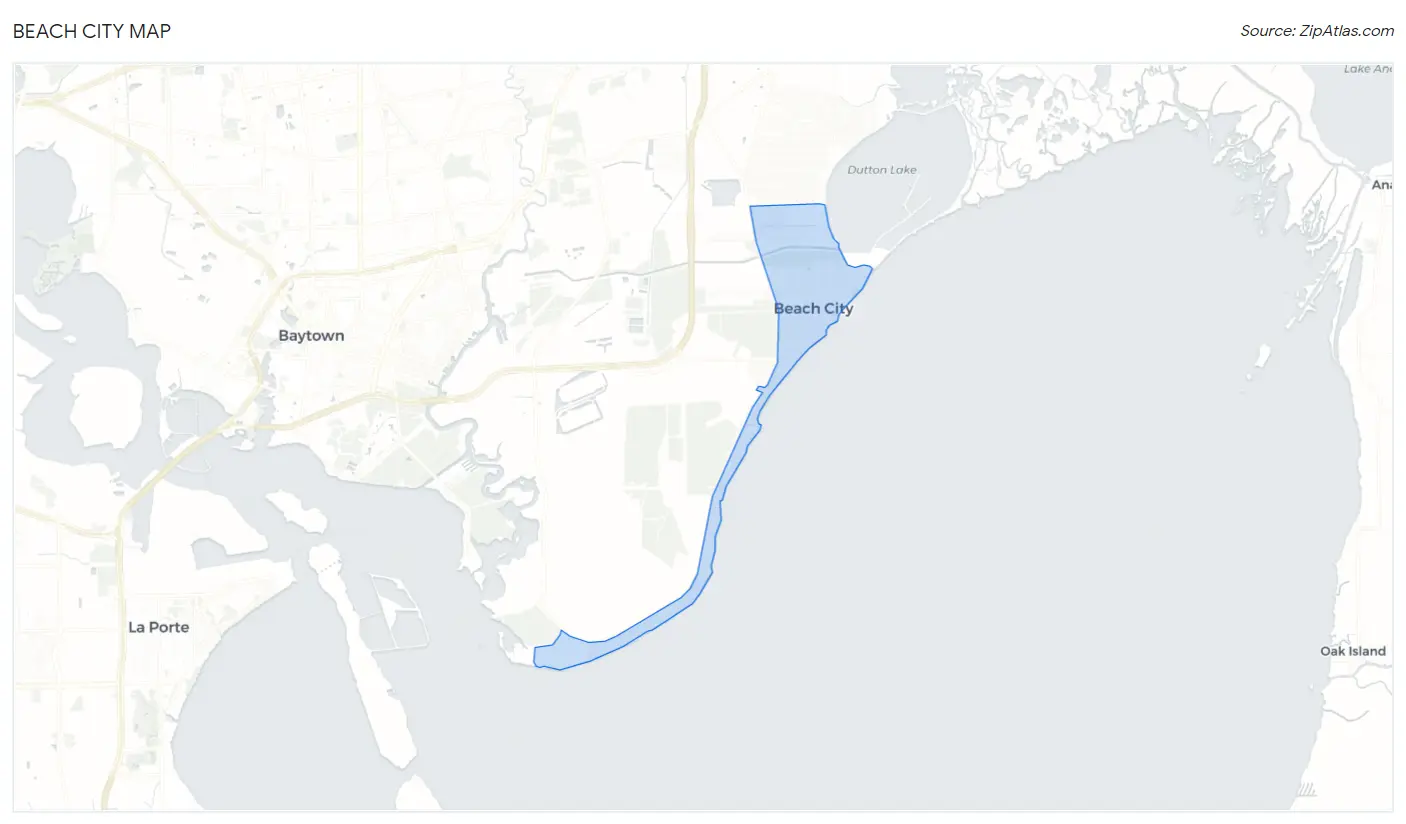
Beach City Map
Beach City Overview
3,126
TOTAL POPULATION
1,763
MALE POPULATION
1,363
FEMALE POPULATION
129.35
MALES / 100 FEMALES
77.31
FEMALES / 100 MALES
45.1
MEDIAN AGE
2.8
AVG FAMILY SIZE
2.6
AVG HOUSEHOLD SIZE
$67,816
PER CAPITA INCOME
$176,672
AVG FAMILY INCOME
$169,570
AVG HOUSEHOLD INCOME
3.8%
WAGE / INCOME GAP [ % ]
96.2¢/ $1
WAGE / INCOME GAP [ $ ]
0.47
INEQUALITY / GINI INDEX
1,942
LABOR FORCE [ PEOPLE ]
71.5%
PERCENT IN LABOR FORCE
4.0%
UNEMPLOYMENT RATE
Race in Beach City
The most populous races in Beach City are White / Caucasian (2,559 | 81.9%), Hispanic or Latino (388 | 12.4%), and Some other Race (306 | 9.8%).
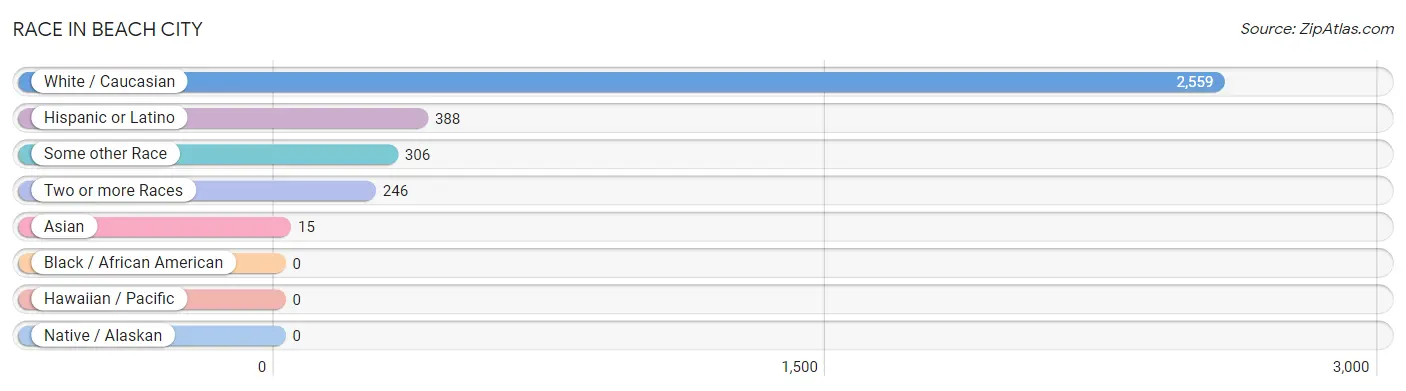
| Race | # Population | % Population |
| Asian | 15 | 0.5% |
| Black / African American | 0 | 0.0% |
| Hawaiian / Pacific | 0 | 0.0% |
| Hispanic or Latino | 388 | 12.4% |
| Native / Alaskan | 0 | 0.0% |
| White / Caucasian | 2,559 | 81.9% |
| Two or more Races | 246 | 7.9% |
| Some other Race | 306 | 9.8% |
| Total | 3,126 | 100.0% |
Ancestry in Beach City
The most populous ancestries reported in Beach City are English (576 | 18.4%), German (449 | 14.4%), Irish (346 | 11.1%), Mexican (244 | 7.8%), and Central American (144 | 4.6%), together accounting for 56.3% of all Beach City residents.
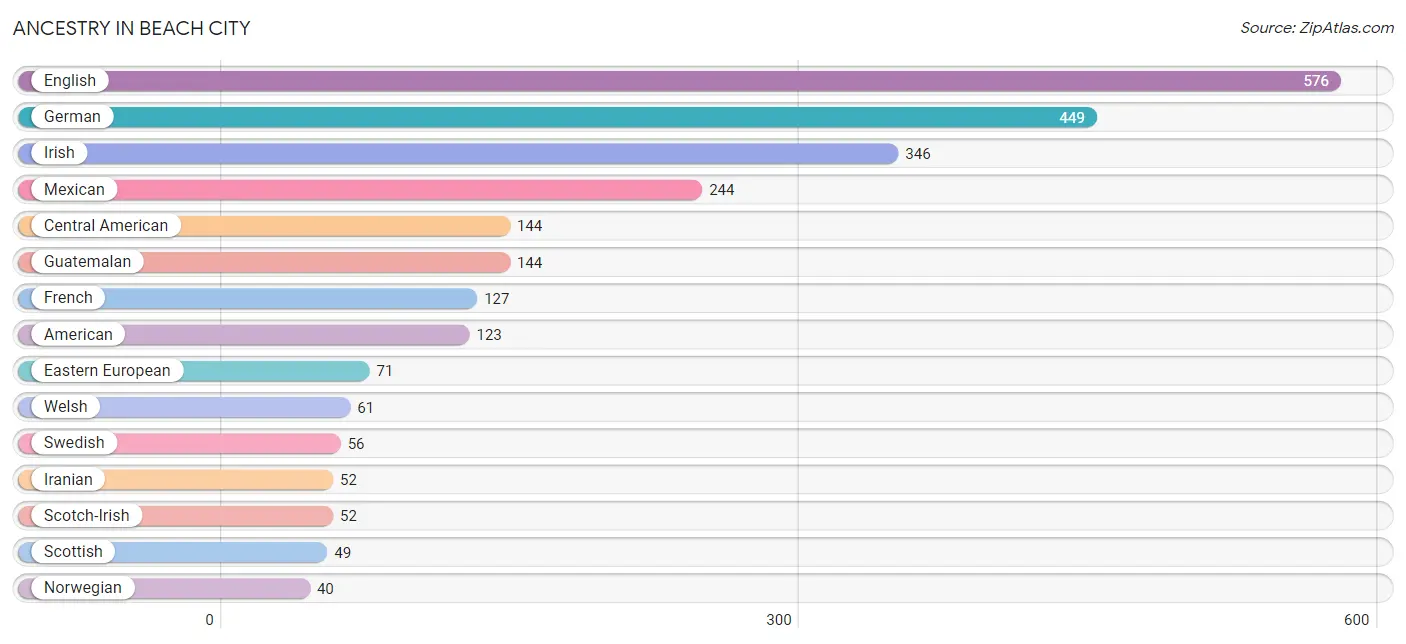
| Ancestry | # Population | % Population |
| American | 123 | 3.9% |
| Austrian | 15 | 0.5% |
| British | 17 | 0.5% |
| Central American | 144 | 4.6% |
| Cherokee | 16 | 0.5% |
| Czech | 11 | 0.4% |
| Danish | 31 | 1.0% |
| Dutch | 24 | 0.8% |
| Eastern European | 71 | 2.3% |
| English | 576 | 18.4% |
| European | 5 | 0.2% |
| Finnish | 6 | 0.2% |
| French | 127 | 4.1% |
| French Canadian | 3 | 0.1% |
| German | 449 | 14.4% |
| Guatemalan | 144 | 4.6% |
| Hungarian | 10 | 0.3% |
| Iranian | 52 | 1.7% |
| Irish | 346 | 11.1% |
| Italian | 35 | 1.1% |
| Korean | 15 | 0.5% |
| Latvian | 20 | 0.6% |
| Mexican | 244 | 7.8% |
| Norwegian | 40 | 1.3% |
| Polish | 31 | 1.0% |
| Scotch-Irish | 52 | 1.7% |
| Scottish | 49 | 1.6% |
| Slovene | 5 | 0.2% |
| Swedish | 56 | 1.8% |
| Welsh | 61 | 1.9% | View All 30 Rows |
Immigrants in Beach City
The most numerous immigrant groups reported in Beach City came from Central America (166 | 5.3%), Latin America (166 | 5.3%), Mexico (91 | 2.9%), Guatemala (75 | 2.4%), and Asia (67 | 2.1%), together accounting for 18.1% of all Beach City residents.
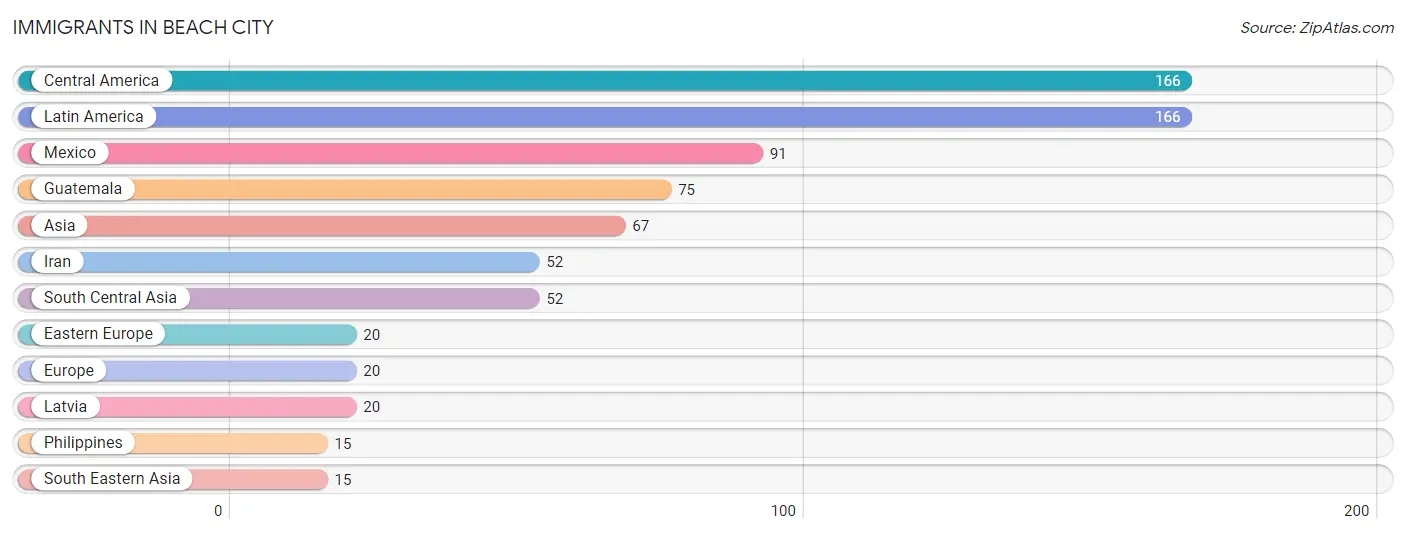
| Immigration Origin | # Population | % Population |
| Asia | 67 | 2.1% |
| Central America | 166 | 5.3% |
| Eastern Europe | 20 | 0.6% |
| Europe | 20 | 0.6% |
| Guatemala | 75 | 2.4% |
| Iran | 52 | 1.7% |
| Latin America | 166 | 5.3% |
| Latvia | 20 | 0.6% |
| Mexico | 91 | 2.9% |
| Philippines | 15 | 0.5% |
| South Central Asia | 52 | 1.7% |
| South Eastern Asia | 15 | 0.5% | View All 12 Rows |
Sex and Age in Beach City
Sex and Age in Beach City
The most populous age groups in Beach City are 25 to 29 Years (234 | 13.3%) for men and 50 to 54 Years (216 | 15.9%) for women.
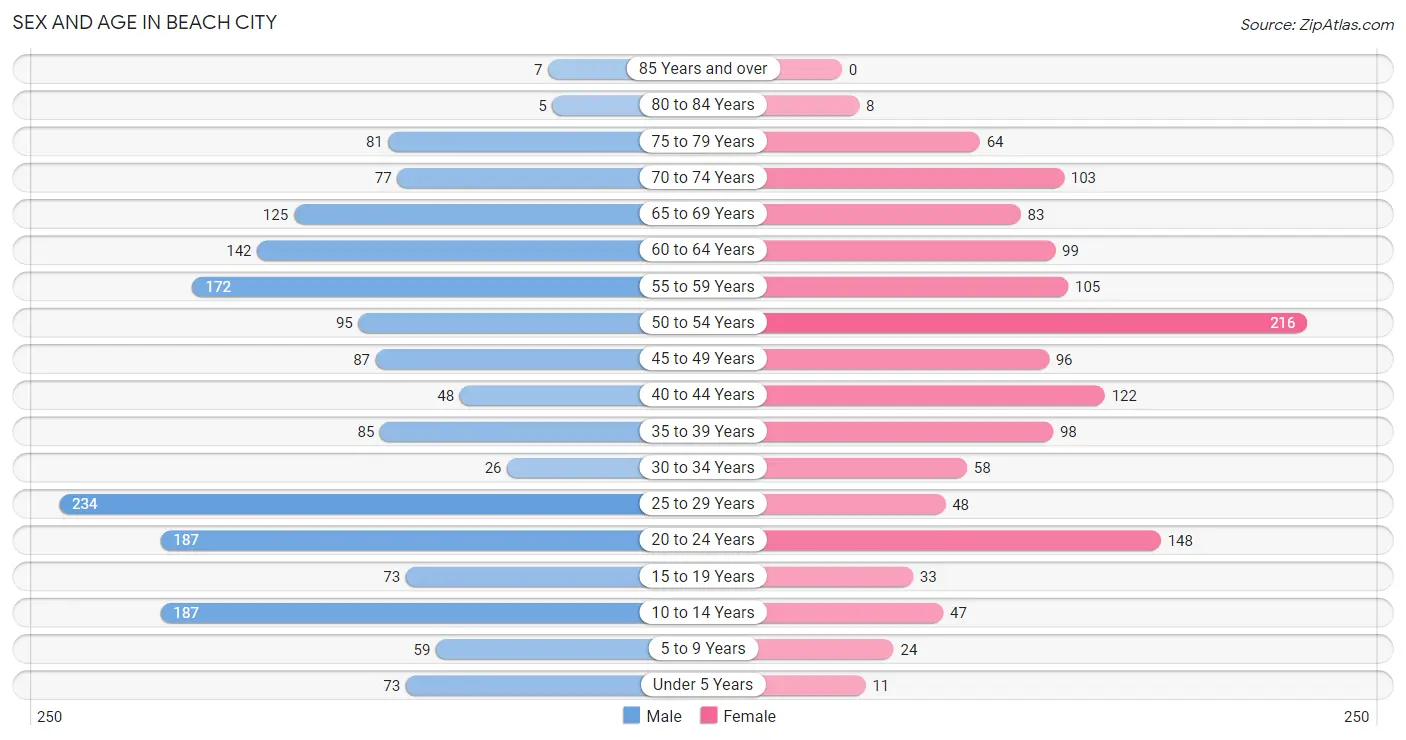
| Age Bracket | Male | Female |
| Under 5 Years | 73 (4.1%) | 11 (0.8%) |
| 5 to 9 Years | 59 (3.4%) | 24 (1.8%) |
| 10 to 14 Years | 187 (10.6%) | 47 (3.5%) |
| 15 to 19 Years | 73 (4.1%) | 33 (2.4%) |
| 20 to 24 Years | 187 (10.6%) | 148 (10.9%) |
| 25 to 29 Years | 234 (13.3%) | 48 (3.5%) |
| 30 to 34 Years | 26 (1.5%) | 58 (4.3%) |
| 35 to 39 Years | 85 (4.8%) | 98 (7.2%) |
| 40 to 44 Years | 48 (2.7%) | 122 (8.9%) |
| 45 to 49 Years | 87 (4.9%) | 96 (7.0%) |
| 50 to 54 Years | 95 (5.4%) | 216 (15.9%) |
| 55 to 59 Years | 172 (9.8%) | 105 (7.7%) |
| 60 to 64 Years | 142 (8.1%) | 99 (7.3%) |
| 65 to 69 Years | 125 (7.1%) | 83 (6.1%) |
| 70 to 74 Years | 77 (4.4%) | 103 (7.6%) |
| 75 to 79 Years | 81 (4.6%) | 64 (4.7%) |
| 80 to 84 Years | 5 (0.3%) | 8 (0.6%) |
| 85 Years and over | 7 (0.4%) | 0 (0.0%) |
| Total | 1,763 (100.0%) | 1,363 (100.0%) |
Families and Households in Beach City
Median Family Size in Beach City
The median family size in Beach City is 2.84 persons per family, with married-couple families (891 | 92.3%) accounting for the largest median family size of 2.91 persons per family. On the other hand, single male/father families (59 | 6.1%) represent the smallest median family size with 1.76 persons per family.
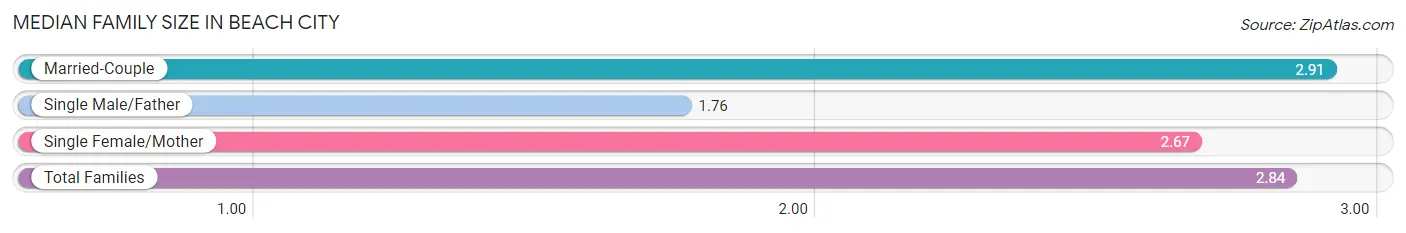
| Family Type | # Families | Family Size |
| Married-Couple | 891 (92.3%) | 2.91 |
| Single Male/Father | 59 (6.1%) | 1.76 |
| Single Female/Mother | 15 (1.5%) | 2.67 |
| Total Families | 965 (100.0%) | 2.84 |
Median Household Size in Beach City
The median household size in Beach City is 2.64 persons per household, with single female/mother households (15 | 1.3%) accounting for the largest median household size of 3.4 persons per household. non-family households (218 | 18.4%) represent the smallest median household size with 1.07 persons per household.
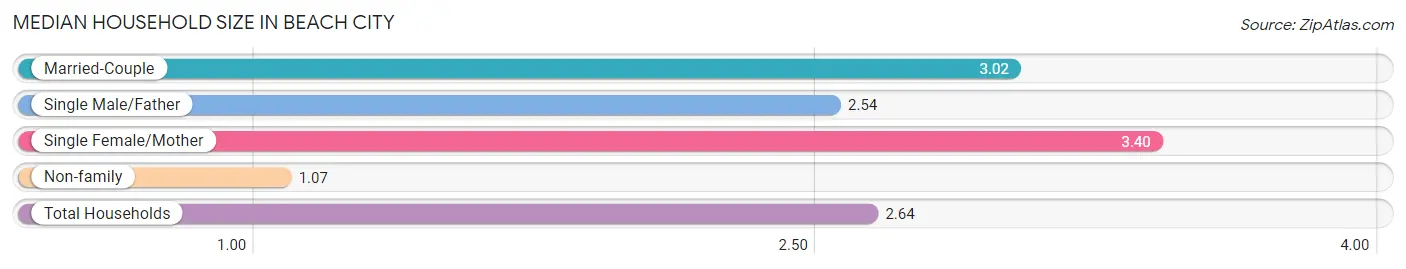
| Household Type | # Households | Household Size |
| Married-Couple | 891 (75.3%) | 3.02 |
| Single Male/Father | 59 (5.0%) | 2.54 |
| Single Female/Mother | 15 (1.3%) | 3.40 |
| Non-family | 218 (18.4%) | 1.07 |
| Total Households | 1,183 (100.0%) | 2.64 |
Household Size by Marriage Status in Beach City
Out of a total of 1,183 households in Beach City, 965 (81.6%) are family households, while 218 (18.4%) are nonfamily households. The most numerous type of family households are 2-person households, comprising 392, and the most common type of nonfamily households are 1-person households, comprising 205.
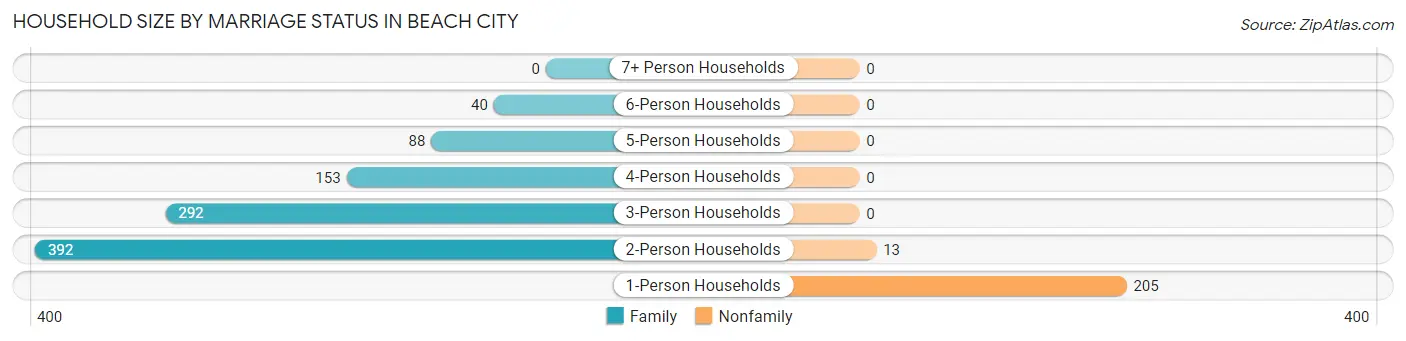
| Household Size | Family Households | Nonfamily Households |
| 1-Person Households | - | 205 (17.3%) |
| 2-Person Households | 392 (33.1%) | 13 (1.1%) |
| 3-Person Households | 292 (24.7%) | 0 (0.0%) |
| 4-Person Households | 153 (12.9%) | 0 (0.0%) |
| 5-Person Households | 88 (7.4%) | 0 (0.0%) |
| 6-Person Households | 40 (3.4%) | 0 (0.0%) |
| 7+ Person Households | 0 (0.0%) | 0 (0.0%) |
| Total | 965 (81.6%) | 218 (18.4%) |
Female Fertility in Beach City
Fertility by Age in Beach City
Average fertility rate in Beach City is 24.0 births per 1,000 women. Women in the age bracket of 20 to 34 years have the highest fertility rate with 35.0 births per 1,000 women. Women in the age bracket of 20 to 34 years acount for 60.0% of all women with births.
| Age Bracket | Women with Births | Births / 1,000 Women |
| 15 to 19 years | 0 (0.0%) | 0.0 |
| 20 to 34 years | 9 (60.0%) | 35.0 |
| 35 to 50 years | 6 (40.0%) | 18.0 |
| Total | 15 (100.0%) | 24.0 |
Fertility by Age by Marriage Status in Beach City
| Age Bracket | Married | Unmarried |
| 15 to 19 years | 0 (0.0%) | 0 (0.0%) |
| 20 to 34 years | 9 (100.0%) | 0 (0.0%) |
| 35 to 50 years | 6 (100.0%) | 0 (0.0%) |
| Total | 15 (100.0%) | 0 (0.0%) |
Fertility by Education in Beach City
| Educational Attainment | Women with Births | Births / 1,000 Women |
| Less than High School | 0 (0.0%) | 0.0 |
| High School Diploma | 6 (40.0%) | 43.0 |
| College or Associate's Degree | 0 (0.0%) | 0.0 |
| Bachelor's Degree | 9 (60.0%) | 57.0 |
| Graduate Degree | 0 (0.0%) | 0.0 |
| Total | 15 (100.0%) | 24.0 |
Fertility by Education by Marriage Status in Beach City
| Educational Attainment | Married | Unmarried |
| Less than High School | 0 (0.0%) | 0 (0.0%) |
| High School Diploma | 6 (100.0%) | 0 (0.0%) |
| College or Associate's Degree | 0 (0.0%) | 0 (0.0%) |
| Bachelor's Degree | 9 (100.0%) | 0 (0.0%) |
| Graduate Degree | 0 (0.0%) | 0 (0.0%) |
| Total | 15 (100.0%) | 0 (0.0%) |
Income in Beach City
Income Overview in Beach City
Per Capita Income in Beach City is $67,816, while median incomes of families and households are $176,672 and $169,570 respectively.
| Characteristic | Number | Measure |
| Per Capita Income | 3,126 | $67,816 |
| Median Family Income | 965 | $176,672 |
| Mean Family Income | 965 | $233,859 |
| Median Household Income | 1,183 | $169,570 |
| Mean Household Income | 1,183 | $201,570 |
| Income Deficit | 965 | $0 |
| Wage / Income Gap (%) | 3,126 | 3.79% |
| Wage / Income Gap ($) | 3,126 | 96.21¢ per $1 |
| Gini / Inequality Index | 3,126 | 0.47 |
Earnings by Sex in Beach City
Average Earnings in Beach City are $56,888, $54,833 for men and $56,995 for women, a difference of 3.8%.
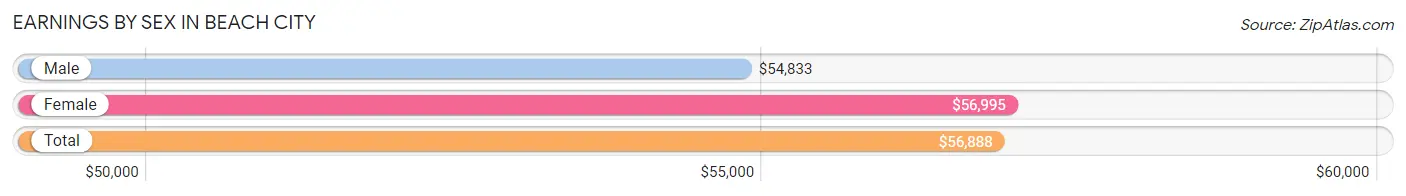
| Sex | Number | Average Earnings |
| Male | 1,032 (52.1%) | $54,833 |
| Female | 947 (47.8%) | $56,995 |
| Total | 1,979 (100.0%) | $56,888 |
Earnings by Sex by Income Bracket in Beach City
The most common earnings brackets in Beach City are $100,000+ for men (369 | 35.8%) and $75,000 to $99,999 for women (152 | 16.1%).
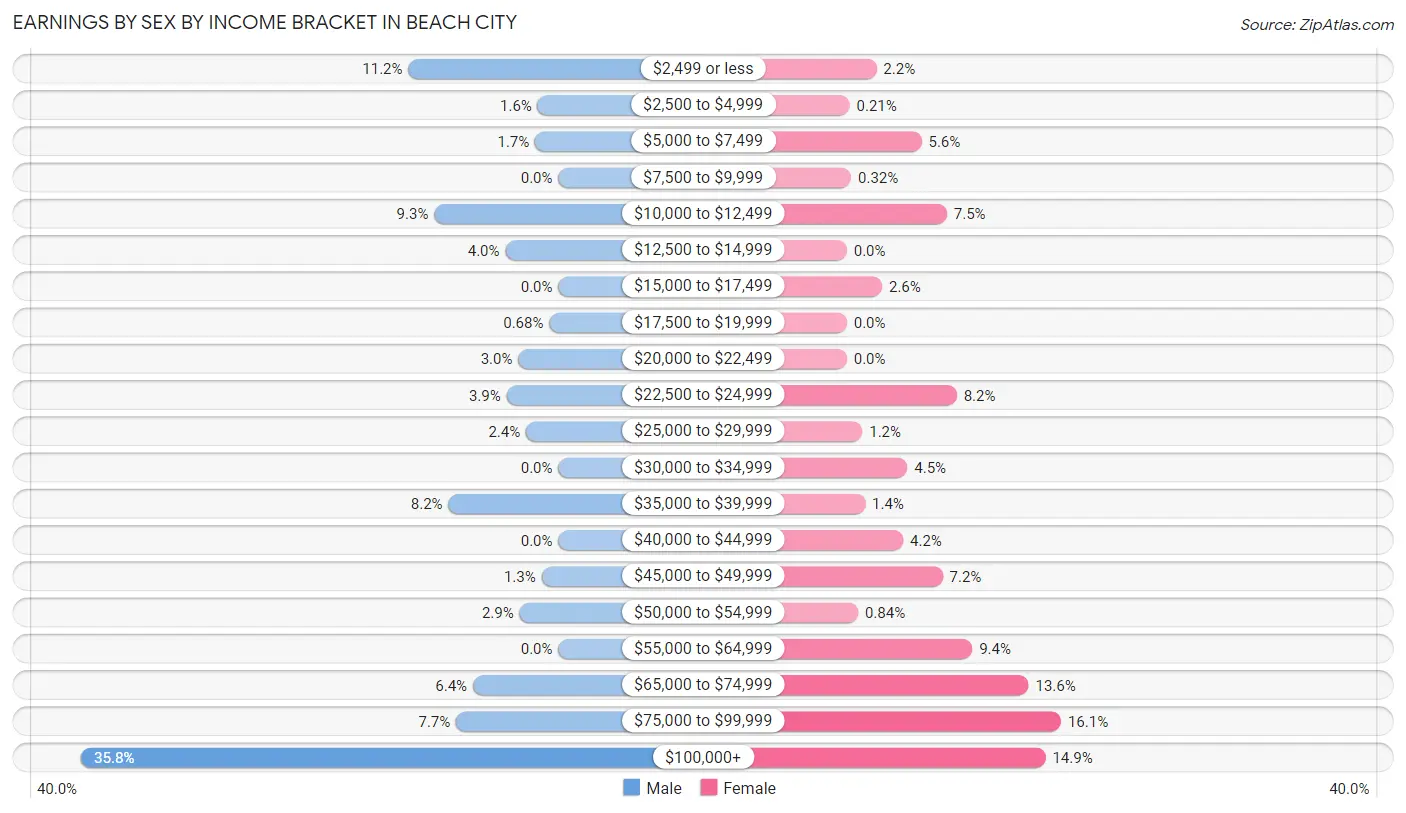
| Income | Male | Female |
| $2,499 or less | 116 (11.2%) | 21 (2.2%) |
| $2,500 to $4,999 | 16 (1.5%) | 2 (0.2%) |
| $5,000 to $7,499 | 18 (1.7%) | 53 (5.6%) |
| $7,500 to $9,999 | 0 (0.0%) | 3 (0.3%) |
| $10,000 to $12,499 | 96 (9.3%) | 71 (7.5%) |
| $12,500 to $14,999 | 41 (4.0%) | 0 (0.0%) |
| $15,000 to $17,499 | 0 (0.0%) | 25 (2.6%) |
| $17,500 to $19,999 | 7 (0.7%) | 0 (0.0%) |
| $20,000 to $22,499 | 31 (3.0%) | 0 (0.0%) |
| $22,500 to $24,999 | 40 (3.9%) | 78 (8.2%) |
| $25,000 to $29,999 | 25 (2.4%) | 11 (1.2%) |
| $30,000 to $34,999 | 0 (0.0%) | 43 (4.5%) |
| $35,000 to $39,999 | 85 (8.2%) | 13 (1.4%) |
| $40,000 to $44,999 | 0 (0.0%) | 40 (4.2%) |
| $45,000 to $49,999 | 13 (1.3%) | 68 (7.2%) |
| $50,000 to $54,999 | 30 (2.9%) | 8 (0.8%) |
| $55,000 to $64,999 | 0 (0.0%) | 89 (9.4%) |
| $65,000 to $74,999 | 66 (6.4%) | 129 (13.6%) |
| $75,000 to $99,999 | 79 (7.7%) | 152 (16.1%) |
| $100,000+ | 369 (35.8%) | 141 (14.9%) |
| Total | 1,032 (100.0%) | 947 (100.0%) |
Earnings by Sex by Educational Attainment in Beach City
Average earnings in Beach City are $83,867 for men and $72,906 for women, a difference of 13.1%. Men with an educational attainment of high school diploma enjoy the highest average annual earnings of $136,094, while those with college or associate's degree education earn the least with $84,336. Women with an educational attainment of graduate degree earn the most with the average annual earnings of $165,125, while those with high school diploma education have the smallest earnings of $24,317.
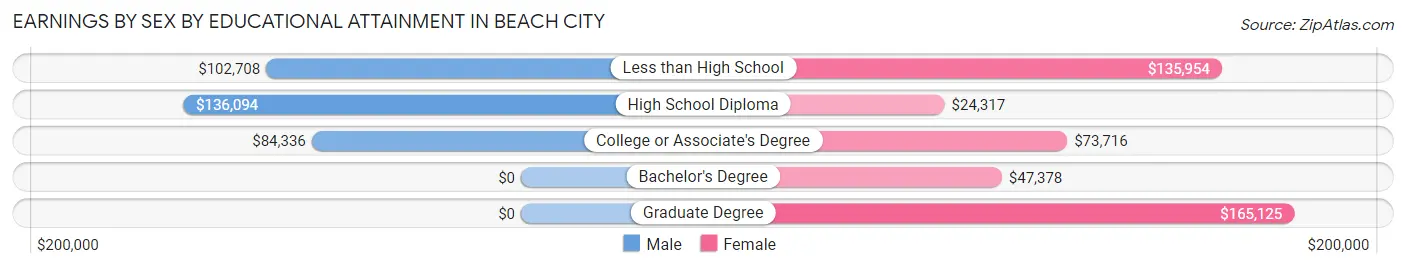
| Educational Attainment | Male Income | Female Income |
| Less than High School | $102,708 | $135,954 |
| High School Diploma | $136,094 | $24,317 |
| College or Associate's Degree | $84,336 | $73,716 |
| Bachelor's Degree | - | - |
| Graduate Degree | - | - |
| Total | $83,867 | $72,906 |
Family Income in Beach City
Family Income Brackets in Beach City
According to the Beach City family income data, there are 383 families falling into the $200,000+ income range, which is the most common income bracket and makes up 39.7% of all families.
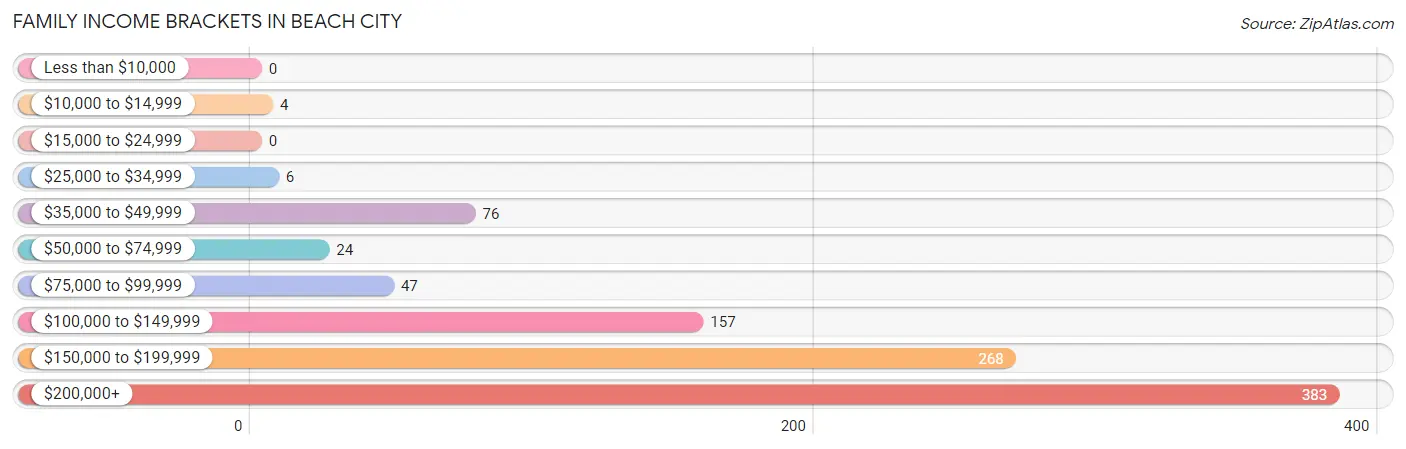
| Income Bracket | # Families | % Families |
| Less than $10,000 | 0 | 0.0% |
| $10,000 to $14,999 | 4 | 0.4% |
| $15,000 to $24,999 | 0 | 0.0% |
| $25,000 to $34,999 | 6 | 0.6% |
| $35,000 to $49,999 | 76 | 7.9% |
| $50,000 to $74,999 | 24 | 2.5% |
| $75,000 to $99,999 | 47 | 4.9% |
| $100,000 to $149,999 | 157 | 16.3% |
| $150,000 to $199,999 | 268 | 27.8% |
| $200,000+ | 383 | 39.7% |
Family Income by Famaliy Size in Beach City
5-person families (53 | 5.5%) account for the highest median family income in Beach City with $243,388 per family, while 2-person families (455 | 47.1%) have the highest median income of $84,785 per family member.
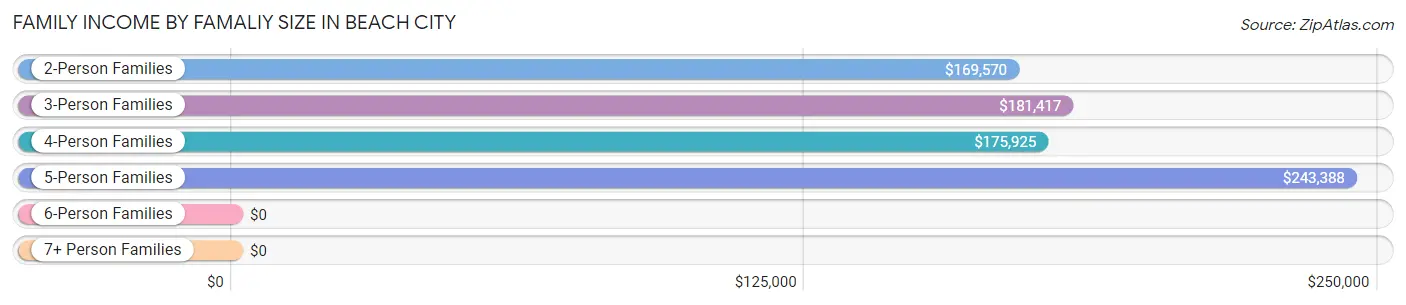
| Income Bracket | # Families | Median Income |
| 2-Person Families | 455 (47.1%) | $169,570 |
| 3-Person Families | 231 (23.9%) | $181,417 |
| 4-Person Families | 224 (23.2%) | $175,925 |
| 5-Person Families | 53 (5.5%) | $243,388 |
| 6-Person Families | 2 (0.2%) | $0 |
| 7+ Person Families | 0 (0.0%) | $0 |
| Total | 965 (100.0%) | $176,672 |
Family Income by Number of Earners in Beach City
The median family income in Beach City is $176,672, with families comprising 3+ earners (229) having the highest median family income of $212,656, while families with 1 earner (203) have the lowest median family income of $95,208, accounting for 23.7% and 21.0% of families, respectively.
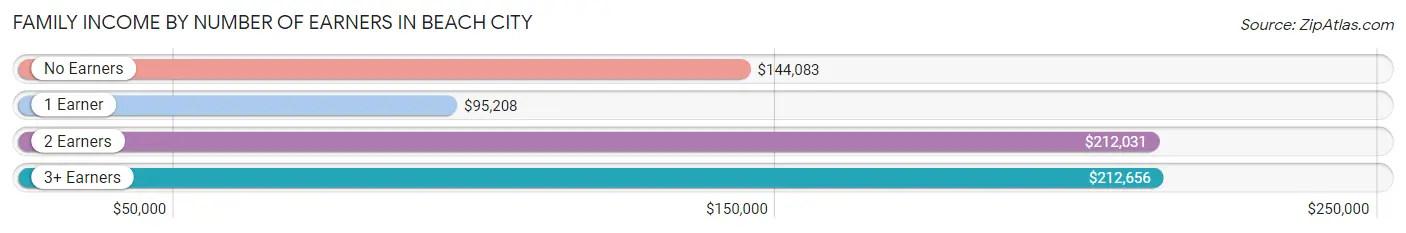
| Number of Earners | # Families | Median Income |
| No Earners | 175 (18.1%) | $144,083 |
| 1 Earner | 203 (21.0%) | $95,208 |
| 2 Earners | 358 (37.1%) | $212,031 |
| 3+ Earners | 229 (23.7%) | $212,656 |
| Total | 965 (100.0%) | $176,672 |
Household Income in Beach City
Household Income Brackets in Beach City
With 390 households falling in the category, the $200,000+ income range is the most frequent in Beach City, accounting for 33.0% of all households. In contrast, only 13 households (1.1%) fall into the $25,000 to $34,999 income bracket, making it the least populous group.
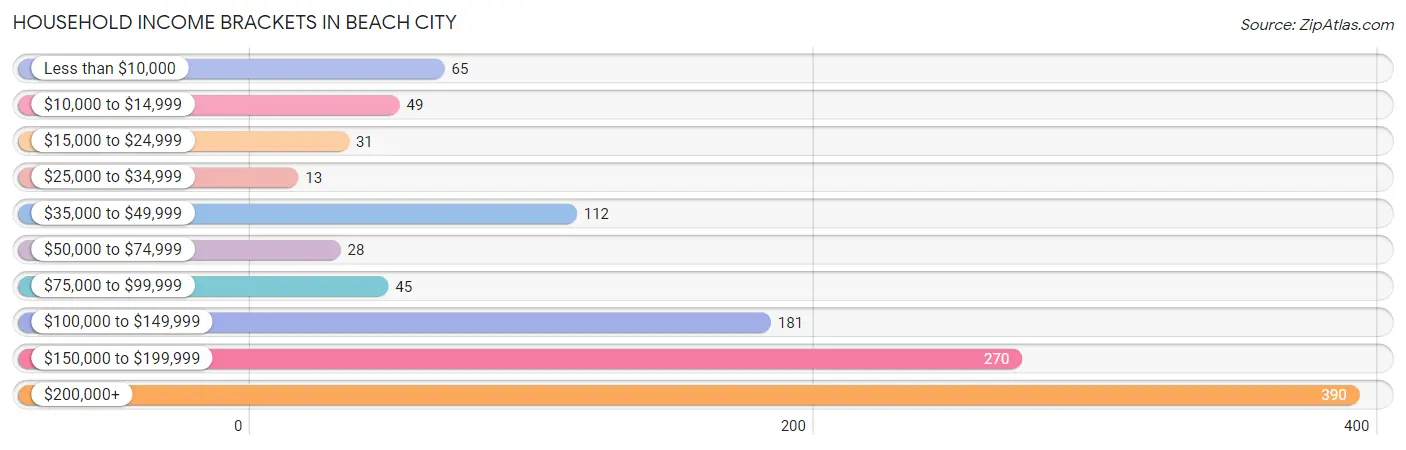
| Income Bracket | # Households | % Households |
| Less than $10,000 | 65 | 5.5% |
| $10,000 to $14,999 | 49 | 4.1% |
| $15,000 to $24,999 | 31 | 2.6% |
| $25,000 to $34,999 | 13 | 1.1% |
| $35,000 to $49,999 | 112 | 9.5% |
| $50,000 to $74,999 | 28 | 2.4% |
| $75,000 to $99,999 | 45 | 3.8% |
| $100,000 to $149,999 | 181 | 15.3% |
| $150,000 to $199,999 | 270 | 22.8% |
| $200,000+ | 390 | 33.0% |
Household Income by Householder Age in Beach City
The median household income in Beach City is $169,570, with the highest median household income of $177,791 found in the 25 to 44 years age bracket for the primary householder. A total of 311 households (26.3%) fall into this category.
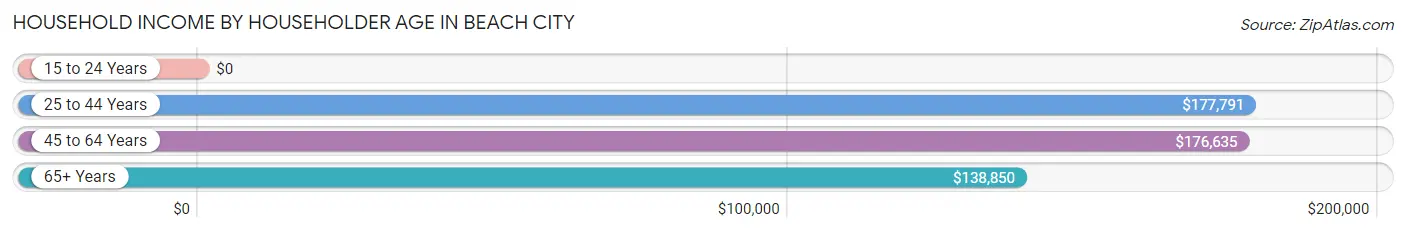
| Income Bracket | # Households | Median Income |
| 15 to 24 Years | 0 (0.0%) | $0 |
| 25 to 44 Years | 311 (26.3%) | $177,791 |
| 45 to 64 Years | 531 (44.9%) | $176,635 |
| 65+ Years | 341 (28.8%) | $138,850 |
| Total | 1,183 (100.0%) | $169,570 |
Poverty in Beach City
Income Below Poverty by Sex and Age in Beach City
With 6.0% poverty level for males and 2.9% for females among the residents of Beach City, 65 to 74 year old males and 55 to 64 year old females are the most vulnerable to poverty, with 52 males (25.7%) and 18 females (8.8%) in their respective age groups living below the poverty level.
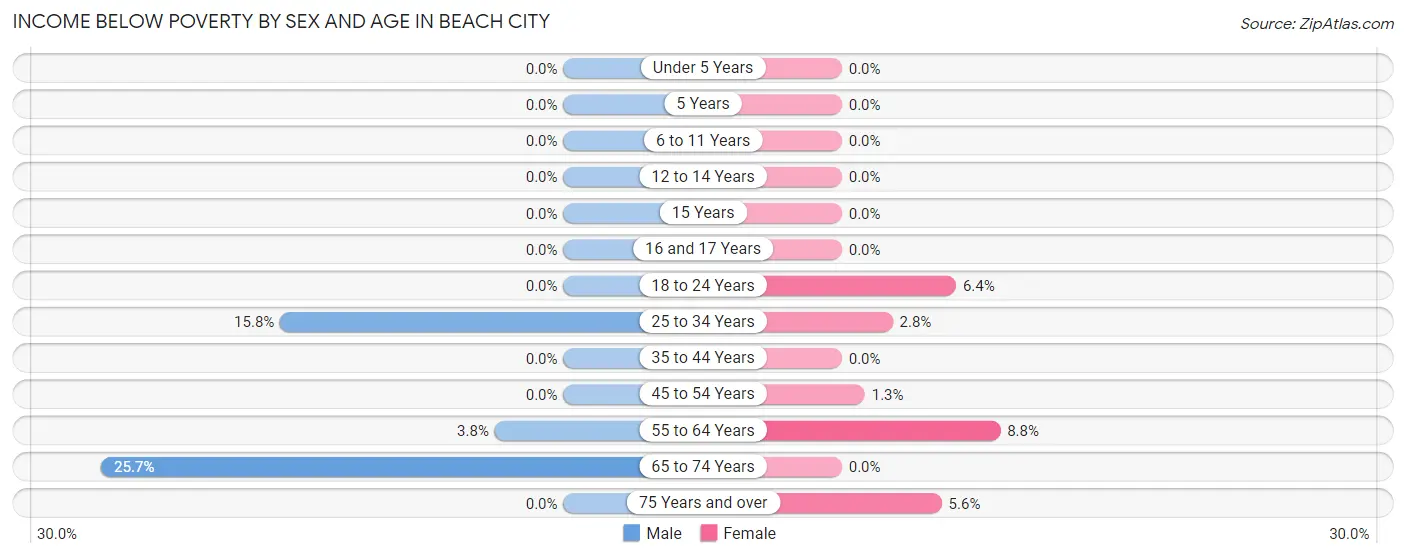
| Age Bracket | Male | Female |
| Under 5 Years | 0 (0.0%) | 0 (0.0%) |
| 5 Years | 0 (0.0%) | 0 (0.0%) |
| 6 to 11 Years | 0 (0.0%) | 0 (0.0%) |
| 12 to 14 Years | 0 (0.0%) | 0 (0.0%) |
| 15 Years | 0 (0.0%) | 0 (0.0%) |
| 16 and 17 Years | 0 (0.0%) | 0 (0.0%) |
| 18 to 24 Years | 0 (0.0%) | 11 (6.4%) |
| 25 to 34 Years | 41 (15.8%) | 3 (2.8%) |
| 35 to 44 Years | 0 (0.0%) | 0 (0.0%) |
| 45 to 54 Years | 0 (0.0%) | 4 (1.3%) |
| 55 to 64 Years | 12 (3.8%) | 18 (8.8%) |
| 65 to 74 Years | 52 (25.7%) | 0 (0.0%) |
| 75 Years and over | 0 (0.0%) | 4 (5.6%) |
| Total | 105 (6.0%) | 40 (2.9%) |
Income Above Poverty by Sex and Age in Beach City
According to the poverty statistics in Beach City, males aged under 5 years and females aged under 5 years are the age groups that are most secure financially, with 100.0% of males and 100.0% of females in these age groups living above the poverty line.
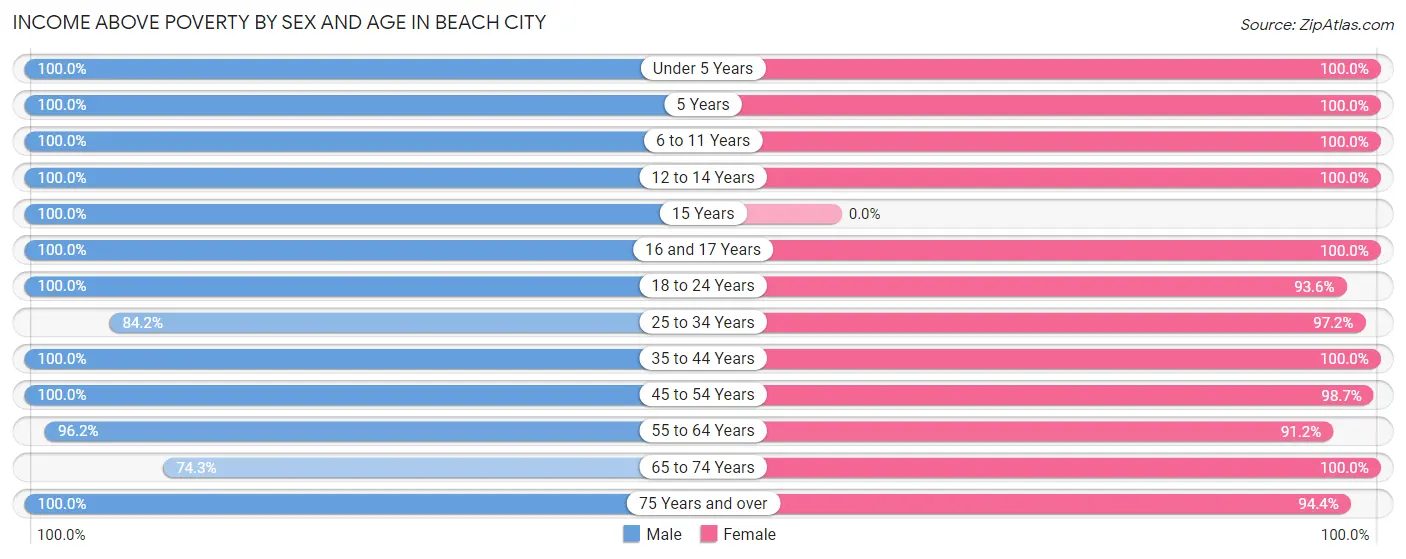
| Age Bracket | Male | Female |
| Under 5 Years | 73 (100.0%) | 11 (100.0%) |
| 5 Years | 46 (100.0%) | 1 (100.0%) |
| 6 to 11 Years | 104 (100.0%) | 30 (100.0%) |
| 12 to 14 Years | 96 (100.0%) | 40 (100.0%) |
| 15 Years | 9 (100.0%) | 0 (0.0%) |
| 16 and 17 Years | 29 (100.0%) | 8 (100.0%) |
| 18 to 24 Years | 222 (100.0%) | 162 (93.6%) |
| 25 to 34 Years | 219 (84.2%) | 103 (97.2%) |
| 35 to 44 Years | 133 (100.0%) | 220 (100.0%) |
| 45 to 54 Years | 182 (100.0%) | 308 (98.7%) |
| 55 to 64 Years | 302 (96.2%) | 186 (91.2%) |
| 65 to 74 Years | 150 (74.3%) | 186 (100.0%) |
| 75 Years and over | 93 (100.0%) | 68 (94.4%) |
| Total | 1,658 (94.0%) | 1,323 (97.1%) |
Income Below Poverty Among Married-Couple Families in Beach City
The poverty statistics for married-couple families in Beach City show that 0.4% or 4 of the total 891 families live below the poverty line. Families with no children have the highest poverty rate of 0.7%, comprising of 4 families. On the other hand, families with 1 or 2 children have the lowest poverty rate of 0.0%, which includes 0 families.
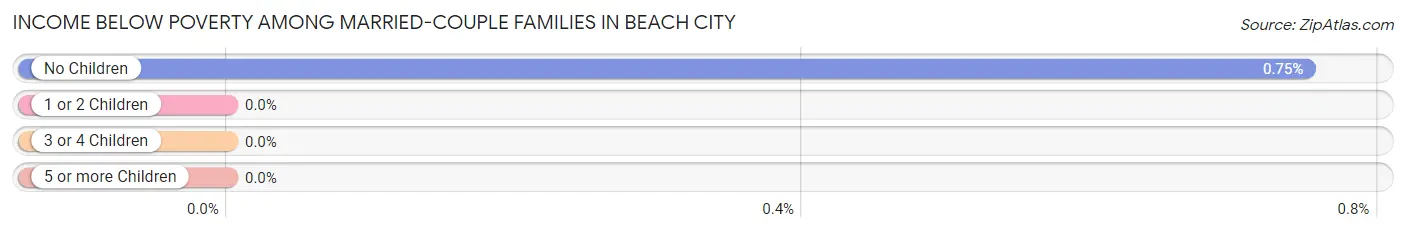
| Children | Above Poverty | Below Poverty |
| No Children | 528 (99.3%) | 4 (0.7%) |
| 1 or 2 Children | 352 (100.0%) | 0 (0.0%) |
| 3 or 4 Children | 7 (100.0%) | 0 (0.0%) |
| 5 or more Children | 0 (0.0%) | 0 (0.0%) |
| Total | 887 (99.6%) | 4 (0.4%) |
Income Below Poverty Among Single-Parent Households in Beach City

| Children | Single Father | Single Mother |
| No Children | 0 (0.0%) | 0 (0.0%) |
| 1 or 2 Children | 0 (0.0%) | 0 (0.0%) |
| 3 or 4 Children | 0 (0.0%) | 0 (0.0%) |
| 5 or more Children | 0 (0.0%) | 0 (0.0%) |
| Total | 0 (0.0%) | 0 (0.0%) |
Income Below Poverty Among Married-Couple vs Single-Parent Households in Beach City
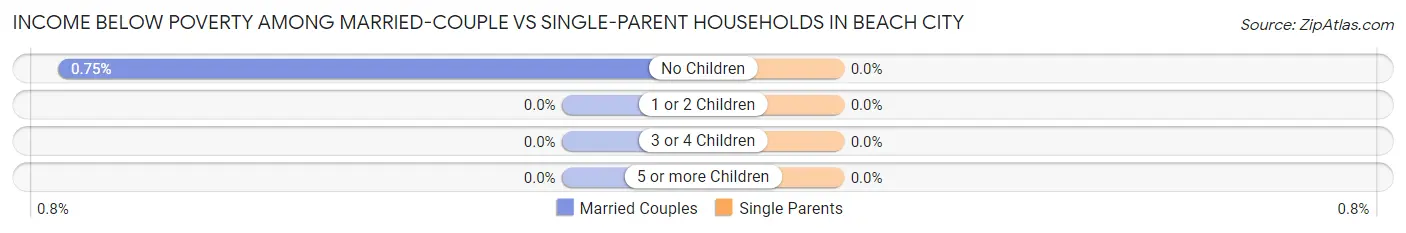
| Children | Married-Couple Families | Single-Parent Households |
| No Children | 4 (0.7%) | 0 (0.0%) |
| 1 or 2 Children | 0 (0.0%) | 0 (0.0%) |
| 3 or 4 Children | 0 (0.0%) | 0 (0.0%) |
| 5 or more Children | 0 (0.0%) | 0 (0.0%) |
| Total | 4 (0.4%) | 0 (0.0%) |
Employment Characteristics in Beach City
Employment by Class of Employer in Beach City
Among the 1,856 employed individuals in Beach City, private company employees (1,397 | 75.3%), local government employees (174 | 9.4%), and self-employed (not incorporated) (144 | 7.8%) make up the most common classes of employment.
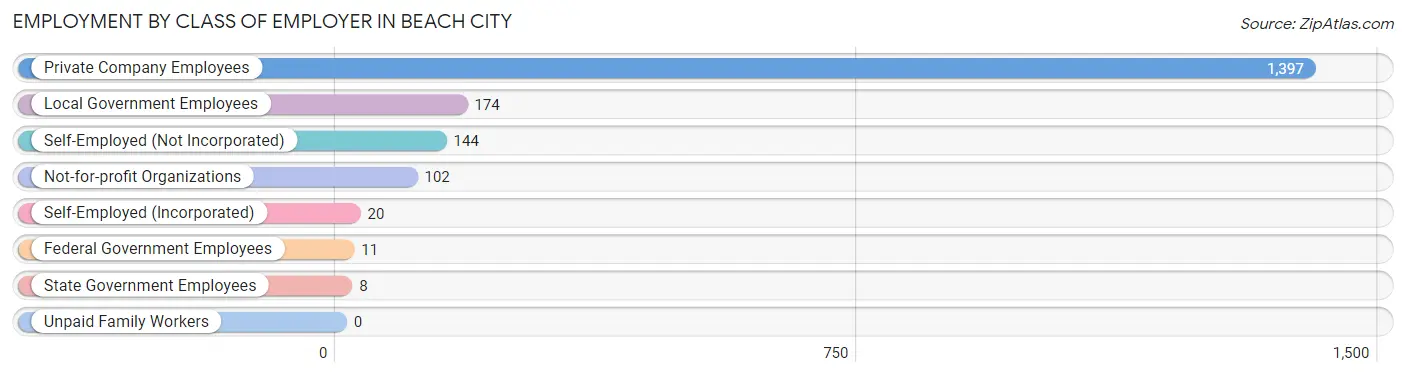
| Employer Class | # Employees | % Employees |
| Private Company Employees | 1,397 | 75.3% |
| Self-Employed (Incorporated) | 20 | 1.1% |
| Self-Employed (Not Incorporated) | 144 | 7.8% |
| Not-for-profit Organizations | 102 | 5.5% |
| Local Government Employees | 174 | 9.4% |
| State Government Employees | 8 | 0.4% |
| Federal Government Employees | 11 | 0.6% |
| Unpaid Family Workers | 0 | 0.0% |
| Total | 1,856 | 100.0% |
Employment Status by Age in Beach City
According to the labor force statistics for Beach City, out of the total population over 16 years of age (2,716), 71.5% or 1,942 individuals are in the labor force, with 4.0% or 78 of them unemployed. The age group with the highest labor force participation rate is 25 to 29 years, with 100.0% or 282 individuals in the labor force. Within the labor force, the 55 to 59 years age range has the highest percentage of unemployed individuals, with 10.8% or 26 of them being unemployed.
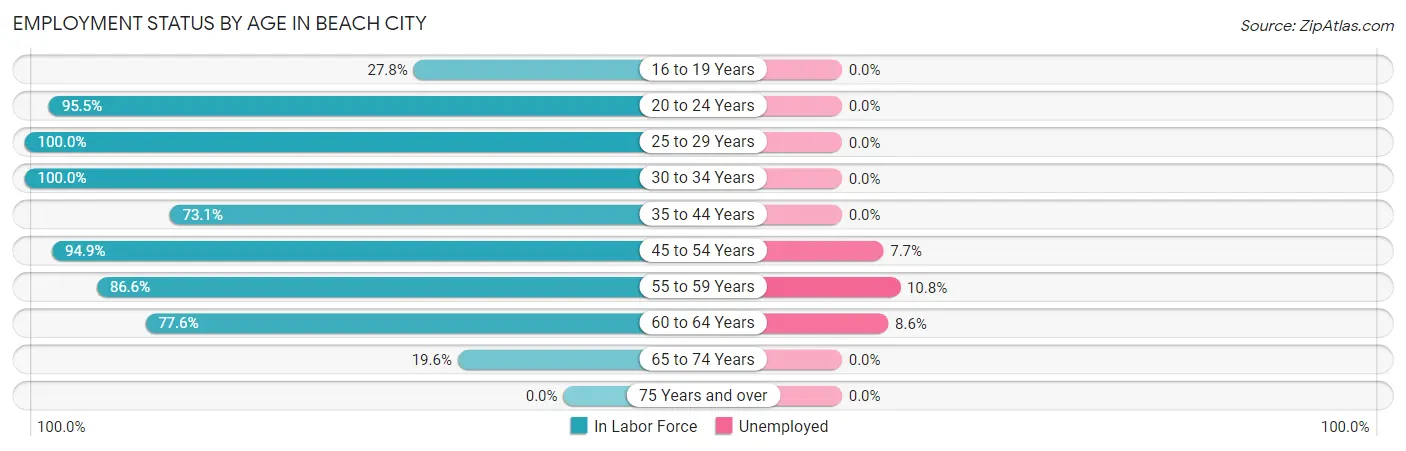
| Age Bracket | In Labor Force | Unemployed |
| 16 to 19 Years | 27 (27.8%) | 0 (0.0%) |
| 20 to 24 Years | 320 (95.5%) | 0 (0.0%) |
| 25 to 29 Years | 282 (100.0%) | 0 (0.0%) |
| 30 to 34 Years | 84 (100.0%) | 0 (0.0%) |
| 35 to 44 Years | 258 (73.1%) | 0 (0.0%) |
| 45 to 54 Years | 469 (94.9%) | 36 (7.7%) |
| 55 to 59 Years | 240 (86.6%) | 26 (10.8%) |
| 60 to 64 Years | 187 (77.6%) | 16 (8.6%) |
| 65 to 74 Years | 76 (19.6%) | 0 (0.0%) |
| 75 Years and over | 0 (0.0%) | 0 (0.0%) |
| Total | 1,942 (71.5%) | 78 (4.0%) |
Employment Status by Educational Attainment in Beach City
According to labor force statistics for Beach City, 87.8% of individuals (1,520) out of the total population between 25 and 64 years of age (1,731) are in the labor force, with 5.1% or 78 of them being unemployed. The group with the highest labor force participation rate are those with the educational attainment of less than high school, with 95.7% or 88 individuals in the labor force. Within the labor force, individuals with bachelor's degree or higher education have the highest percentage of unemployment, with 8.7% or 46 of them being unemployed.
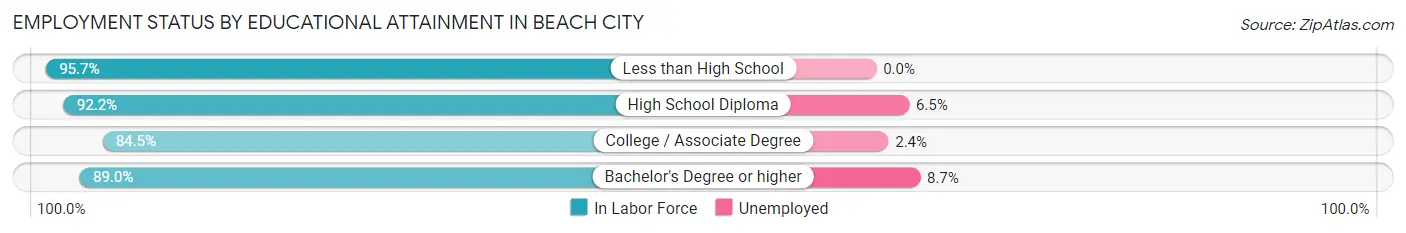
| Educational Attainment | In Labor Force | Unemployed |
| Less than High School | 88 (95.7%) | 0 (0.0%) |
| High School Diploma | 247 (92.2%) | 17 (6.5%) |
| College / Associate Degree | 658 (84.5%) | 19 (2.4%) |
| Bachelor's Degree or higher | 527 (89.0%) | 52 (8.7%) |
| Total | 1,520 (87.8%) | 88 (5.1%) |
Employment Occupations by Sex in Beach City
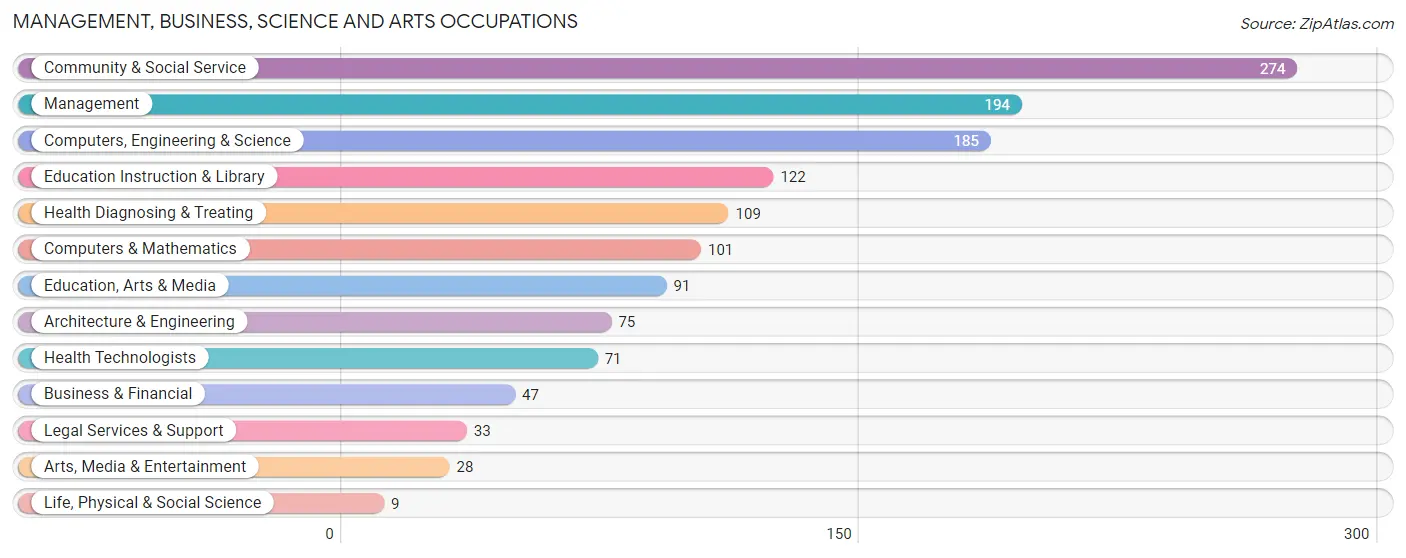
Management, Business, Science and Arts Occupations
The most common Management, Business, Science and Arts occupations in Beach City are Community & Social Service (274 | 14.7%), Management (194 | 10.4%), Computers, Engineering & Science (185 | 9.9%), Education Instruction & Library (122 | 6.5%), and Health Diagnosing & Treating (109 | 5.8%).
Management, Business, Science and Arts Occupations by Sex
Within the Management, Business, Science and Arts occupations in Beach City, the most male-oriented occupations are Architecture & Engineering (100.0%), Life, Physical & Social Science (100.0%), and Education, Arts & Media (87.9%), while the most female-oriented occupations are Legal Services & Support (100.0%), Education Instruction & Library (100.0%), and Arts, Media & Entertainment (100.0%).
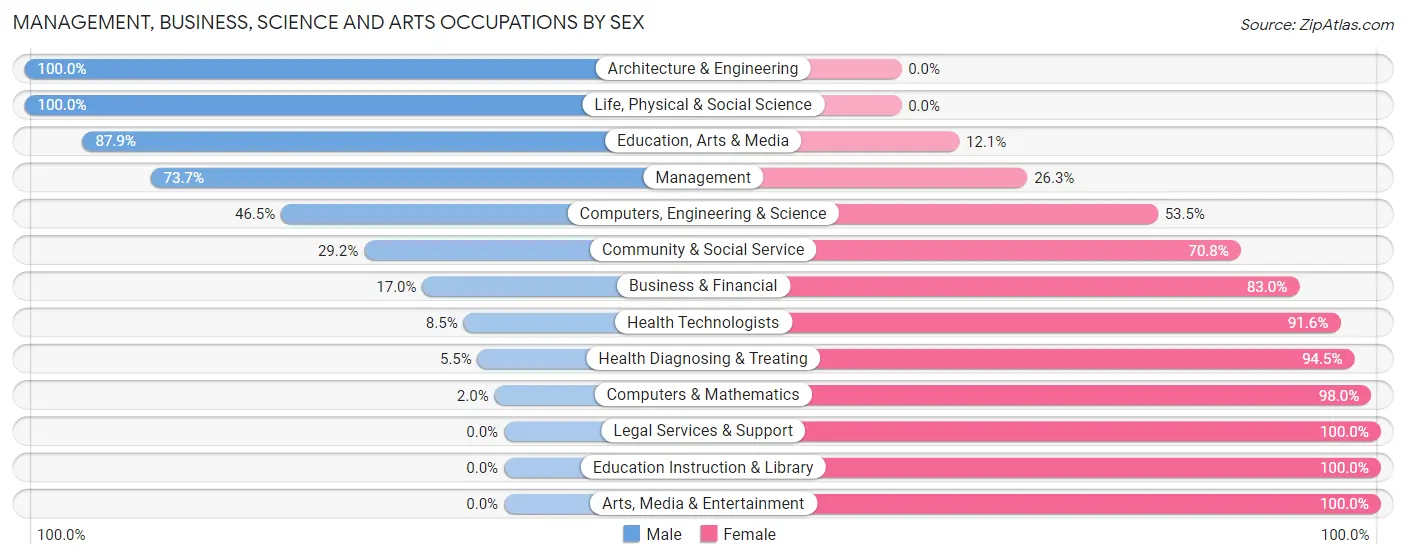
| Occupation | Male | Female |
| Management | 143 (73.7%) | 51 (26.3%) |
| Business & Financial | 8 (17.0%) | 39 (83.0%) |
| Computers, Engineering & Science | 86 (46.5%) | 99 (53.5%) |
| Computers & Mathematics | 2 (2.0%) | 99 (98.0%) |
| Architecture & Engineering | 75 (100.0%) | 0 (0.0%) |
| Life, Physical & Social Science | 9 (100.0%) | 0 (0.0%) |
| Community & Social Service | 80 (29.2%) | 194 (70.8%) |
| Education, Arts & Media | 80 (87.9%) | 11 (12.1%) |
| Legal Services & Support | 0 (0.0%) | 33 (100.0%) |
| Education Instruction & Library | 0 (0.0%) | 122 (100.0%) |
| Arts, Media & Entertainment | 0 (0.0%) | 28 (100.0%) |
| Health Diagnosing & Treating | 6 (5.5%) | 103 (94.5%) |
| Health Technologists | 6 (8.5%) | 65 (91.5%) |
| Total (Category) | 323 (39.9%) | 486 (60.1%) |
| Total (Overall) | 961 (51.5%) | 904 (48.5%) |
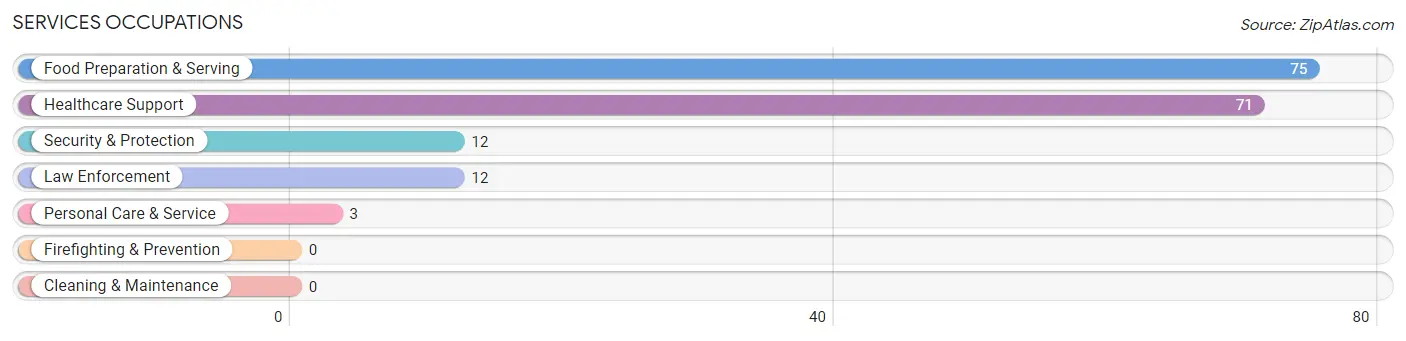
Services Occupations
The most common Services occupations in Beach City are Food Preparation & Serving (75 | 4.0%), Healthcare Support (71 | 3.8%), Security & Protection (12 | 0.6%), Law Enforcement (12 | 0.6%), and Personal Care & Service (3 | 0.2%).
Services Occupations by Sex
Within the Services occupations in Beach City, the most male-oriented occupations are Healthcare Support (46.5%), Security & Protection (33.3%), and Law Enforcement (33.3%), while the most female-oriented occupations are Food Preparation & Serving (100.0%), Personal Care & Service (100.0%), and Security & Protection (66.7%).
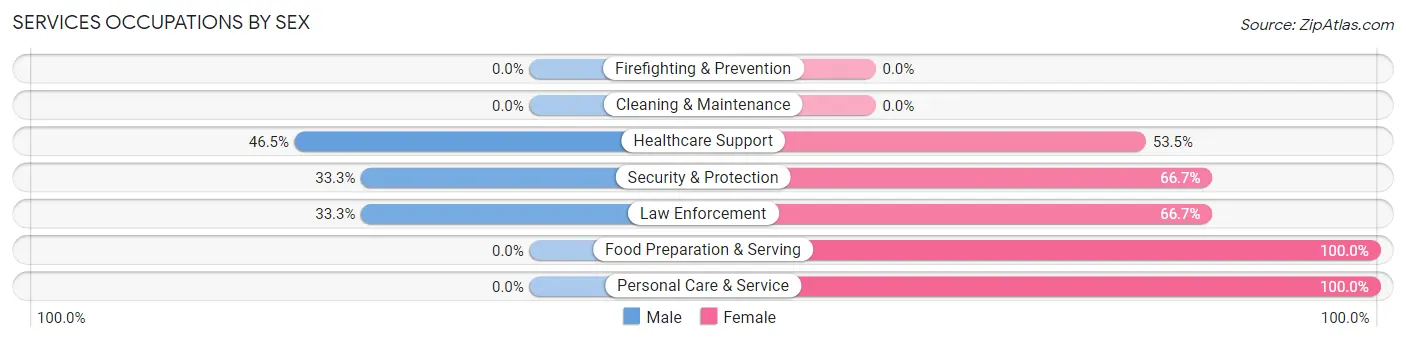
| Occupation | Male | Female |
| Healthcare Support | 33 (46.5%) | 38 (53.5%) |
| Security & Protection | 4 (33.3%) | 8 (66.7%) |
| Firefighting & Prevention | 0 (0.0%) | 0 (0.0%) |
| Law Enforcement | 4 (33.3%) | 8 (66.7%) |
| Food Preparation & Serving | 0 (0.0%) | 75 (100.0%) |
| Cleaning & Maintenance | 0 (0.0%) | 0 (0.0%) |
| Personal Care & Service | 0 (0.0%) | 3 (100.0%) |
| Total (Category) | 37 (23.0%) | 124 (77.0%) |
| Total (Overall) | 961 (51.5%) | 904 (48.5%) |
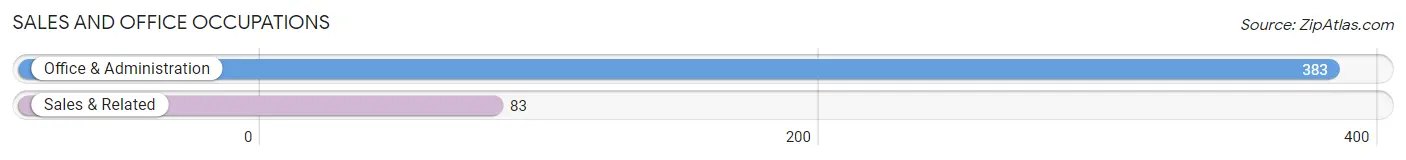
Sales and Office Occupations
The most common Sales and Office occupations in Beach City are Office & Administration (383 | 20.5%), and Sales & Related (83 | 4.4%).
Sales and Office Occupations by Sex
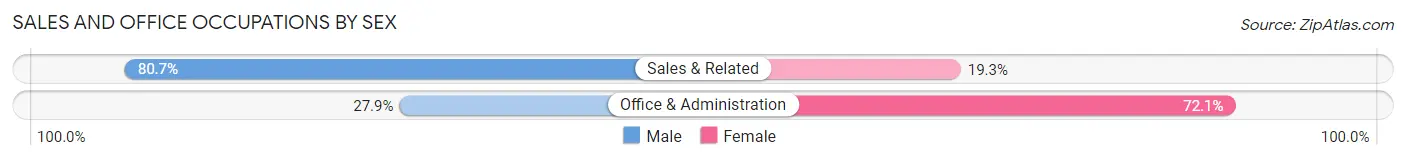
| Occupation | Male | Female |
| Sales & Related | 67 (80.7%) | 16 (19.3%) |
| Office & Administration | 107 (27.9%) | 276 (72.1%) |
| Total (Category) | 174 (37.3%) | 292 (62.7%) |
| Total (Overall) | 961 (51.5%) | 904 (48.5%) |
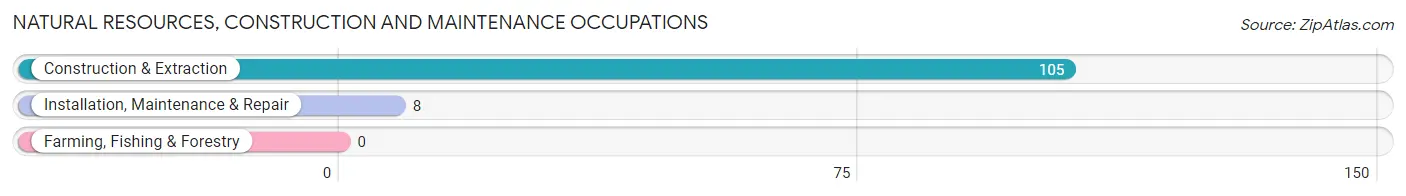
Natural Resources, Construction and Maintenance Occupations
The most common Natural Resources, Construction and Maintenance occupations in Beach City are Construction & Extraction (105 | 5.6%), and Installation, Maintenance & Repair (8 | 0.4%).
Natural Resources, Construction and Maintenance Occupations by Sex
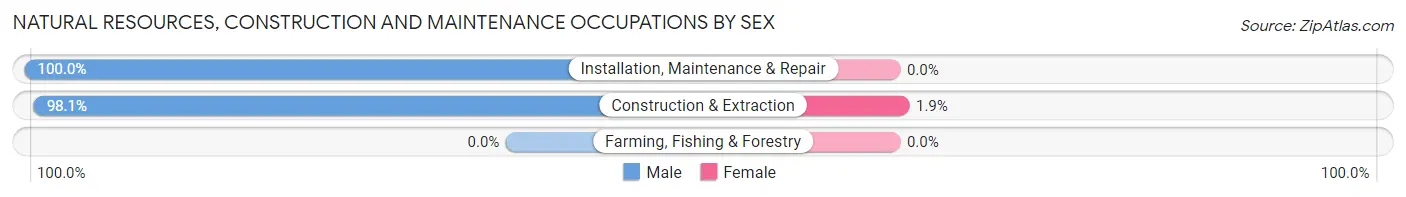
| Occupation | Male | Female |
| Farming, Fishing & Forestry | 0 (0.0%) | 0 (0.0%) |
| Construction & Extraction | 103 (98.1%) | 2 (1.9%) |
| Installation, Maintenance & Repair | 8 (100.0%) | 0 (0.0%) |
| Total (Category) | 111 (98.2%) | 2 (1.8%) |
| Total (Overall) | 961 (51.5%) | 904 (48.5%) |
Production, Transportation and Moving Occupations
The most common Production, Transportation and Moving occupations in Beach City are Transportation (115 | 6.2%), Production (110 | 5.9%), and Material Moving (91 | 4.9%).
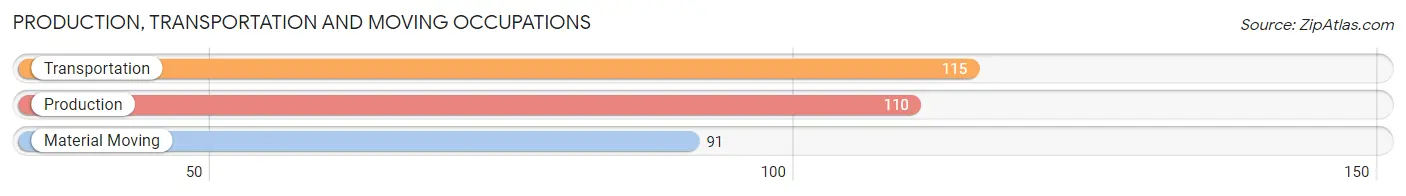
Production, Transportation and Moving Occupations by Sex
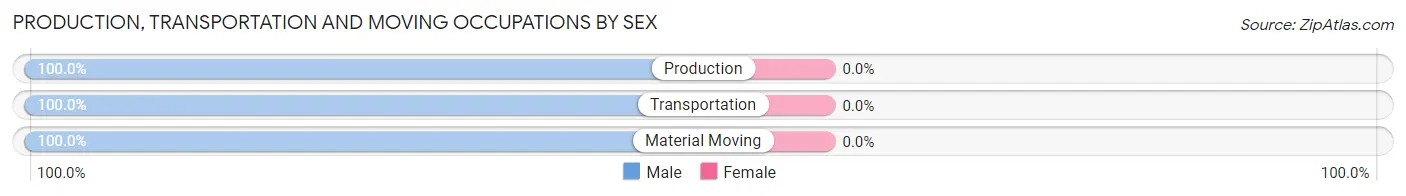
| Occupation | Male | Female |
| Production | 110 (100.0%) | 0 (0.0%) |
| Transportation | 115 (100.0%) | 0 (0.0%) |
| Material Moving | 91 (100.0%) | 0 (0.0%) |
| Total (Category) | 316 (100.0%) | 0 (0.0%) |
| Total (Overall) | 961 (51.5%) | 904 (48.5%) |
Employment Industries by Sex in Beach City
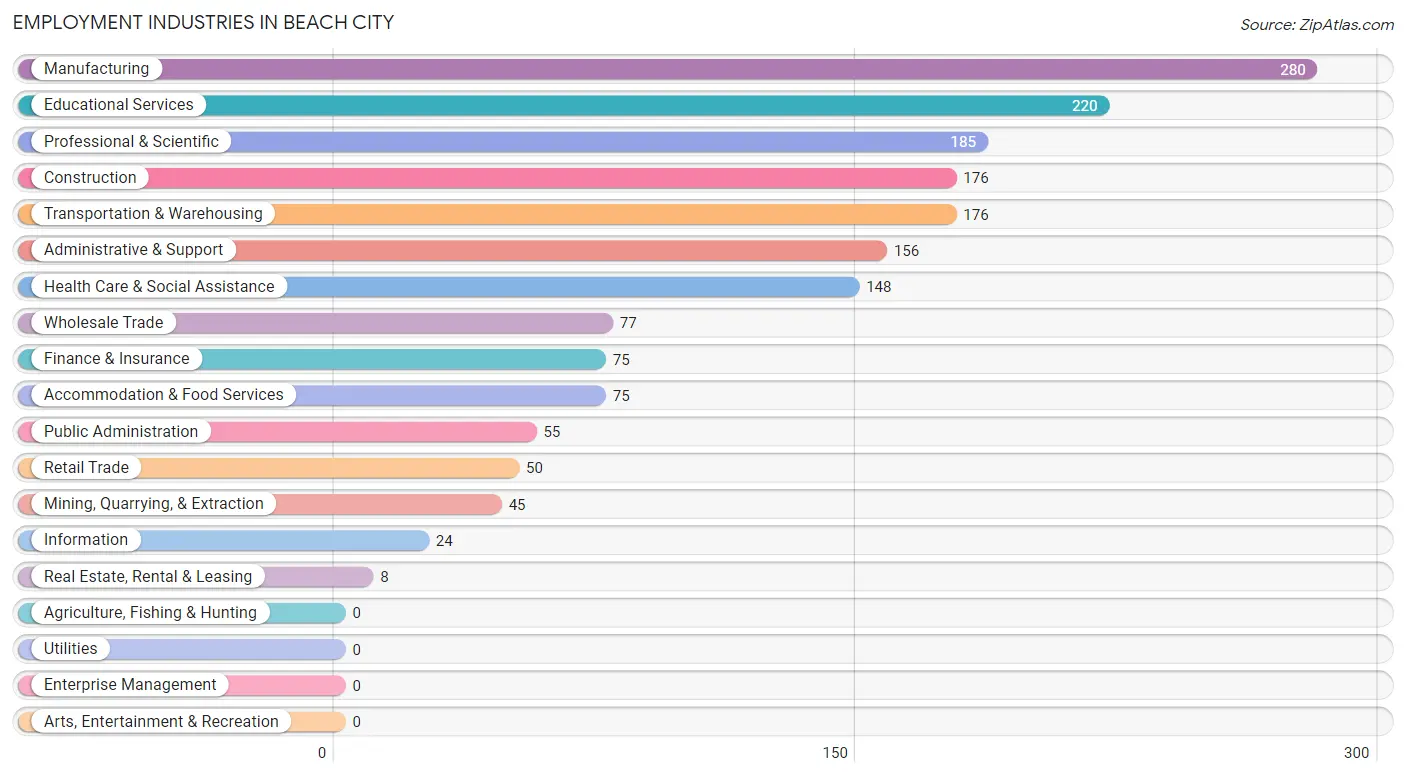
Employment Industries in Beach City
The major employment industries in Beach City include Manufacturing (280 | 15.0%), Educational Services (220 | 11.8%), Professional & Scientific (185 | 9.9%), Construction (176 | 9.4%), and Transportation & Warehousing (176 | 9.4%).
Employment Industries by Sex in Beach City
The Beach City industries that see more men than women are Real Estate, Rental & Leasing (100.0%), Transportation & Warehousing (98.9%), and Construction (88.1%), whereas the industries that tend to have a higher number of women are Finance & Insurance (100.0%), Accommodation & Food Services (100.0%), and Health Care & Social Assistance (96.0%).
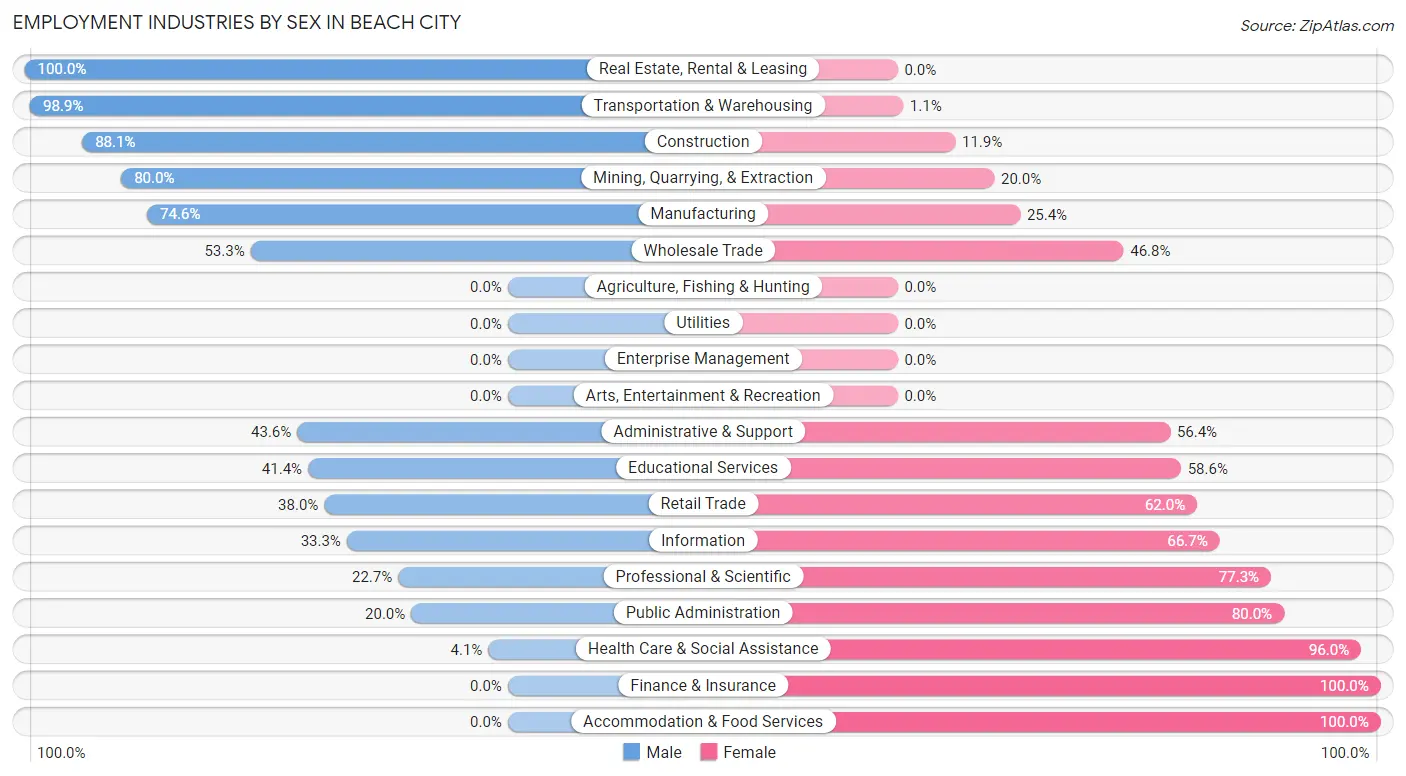
| Industry | Male | Female |
| Agriculture, Fishing & Hunting | 0 (0.0%) | 0 (0.0%) |
| Mining, Quarrying, & Extraction | 36 (80.0%) | 9 (20.0%) |
| Construction | 155 (88.1%) | 21 (11.9%) |
| Manufacturing | 209 (74.6%) | 71 (25.4%) |
| Wholesale Trade | 41 (53.2%) | 36 (46.8%) |
| Retail Trade | 19 (38.0%) | 31 (62.0%) |
| Transportation & Warehousing | 174 (98.9%) | 2 (1.1%) |
| Utilities | 0 (0.0%) | 0 (0.0%) |
| Information | 8 (33.3%) | 16 (66.7%) |
| Finance & Insurance | 0 (0.0%) | 75 (100.0%) |
| Real Estate, Rental & Leasing | 8 (100.0%) | 0 (0.0%) |
| Professional & Scientific | 42 (22.7%) | 143 (77.3%) |
| Enterprise Management | 0 (0.0%) | 0 (0.0%) |
| Administrative & Support | 68 (43.6%) | 88 (56.4%) |
| Educational Services | 91 (41.4%) | 129 (58.6%) |
| Health Care & Social Assistance | 6 (4.1%) | 142 (96.0%) |
| Arts, Entertainment & Recreation | 0 (0.0%) | 0 (0.0%) |
| Accommodation & Food Services | 0 (0.0%) | 75 (100.0%) |
| Public Administration | 11 (20.0%) | 44 (80.0%) |
| Total | 961 (51.5%) | 904 (48.5%) |
Education in Beach City
School Enrollment in Beach City
The most common levels of schooling among the 659 students in Beach City are middle school (161 | 24.4%), college / undergraduate (146 | 22.2%), and graduate / professional (146 | 22.2%).
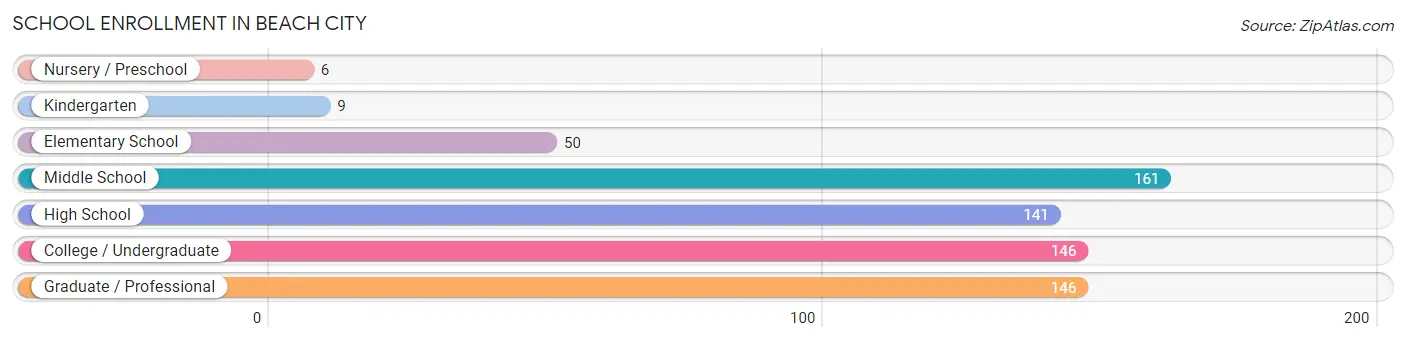
| School Level | # Students | % Students |
| Nursery / Preschool | 6 | 0.9% |
| Kindergarten | 9 | 1.4% |
| Elementary School | 50 | 7.6% |
| Middle School | 161 | 24.4% |
| High School | 141 | 21.4% |
| College / Undergraduate | 146 | 22.2% |
| Graduate / Professional | 146 | 22.2% |
| Total | 659 | 100.0% |
School Enrollment by Age by Funding Source in Beach City
Out of a total of 659 students who are enrolled in schools in Beach City, 128 (19.4%) attend a private institution, while the remaining 531 (80.6%) are enrolled in public schools. The age group of 25 to 34 year olds has the highest likelihood of being enrolled in private schools, with 91 (73.4% in the age bracket) enrolled. Conversely, the age group of 3 to 4 year olds has the lowest likelihood of being enrolled in a private school, with 3 (100.0% in the age bracket) attending a public institution.
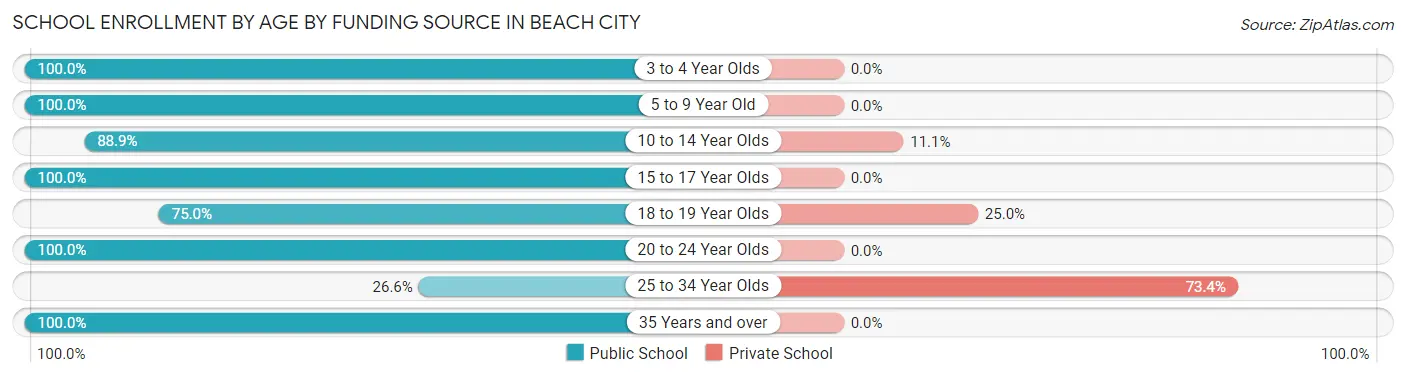
| Age Bracket | Public School | Private School |
| 3 to 4 Year Olds | 3 (100.0%) | 0 (0.0%) |
| 5 to 9 Year Old | 40 (100.0%) | 0 (0.0%) |
| 10 to 14 Year Olds | 208 (88.9%) | 26 (11.1%) |
| 15 to 17 Year Olds | 46 (100.0%) | 0 (0.0%) |
| 18 to 19 Year Olds | 33 (75.0%) | 11 (25.0%) |
| 20 to 24 Year Olds | 117 (100.0%) | 0 (0.0%) |
| 25 to 34 Year Olds | 33 (26.6%) | 91 (73.4%) |
| 35 Years and over | 51 (100.0%) | 0 (0.0%) |
| Total | 531 (80.6%) | 128 (19.4%) |
Educational Attainment by Field of Study in Beach City
Education (207 | 23.6%), business (151 | 17.2%), bio, nature & agricultural (146 | 16.7%), physical & health sciences (72 | 8.2%), and science & technology (72 | 8.2%) are the most common fields of study among 877 individuals in Beach City who have obtained a bachelor's degree or higher.
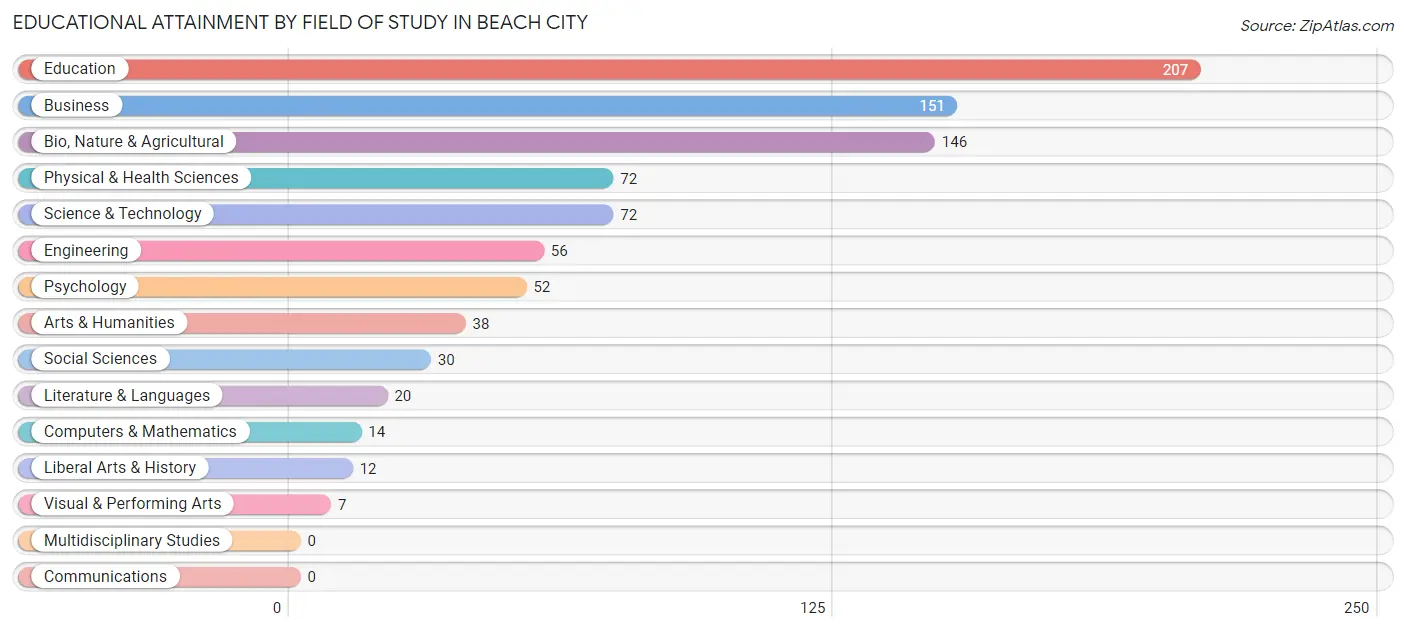
| Field of Study | # Graduates | % Graduates |
| Computers & Mathematics | 14 | 1.6% |
| Bio, Nature & Agricultural | 146 | 16.7% |
| Physical & Health Sciences | 72 | 8.2% |
| Psychology | 52 | 5.9% |
| Social Sciences | 30 | 3.4% |
| Engineering | 56 | 6.4% |
| Multidisciplinary Studies | 0 | 0.0% |
| Science & Technology | 72 | 8.2% |
| Business | 151 | 17.2% |
| Education | 207 | 23.6% |
| Literature & Languages | 20 | 2.3% |
| Liberal Arts & History | 12 | 1.4% |
| Visual & Performing Arts | 7 | 0.8% |
| Communications | 0 | 0.0% |
| Arts & Humanities | 38 | 4.3% |
| Total | 877 | 100.0% |
Transportation & Commute in Beach City
Vehicle Availability by Sex in Beach City
The most prevalent vehicle ownership categories in Beach City are males with 4 vehicles (263, accounting for 27.4%) and females with 4 vehicles (194, making up 29.4%).
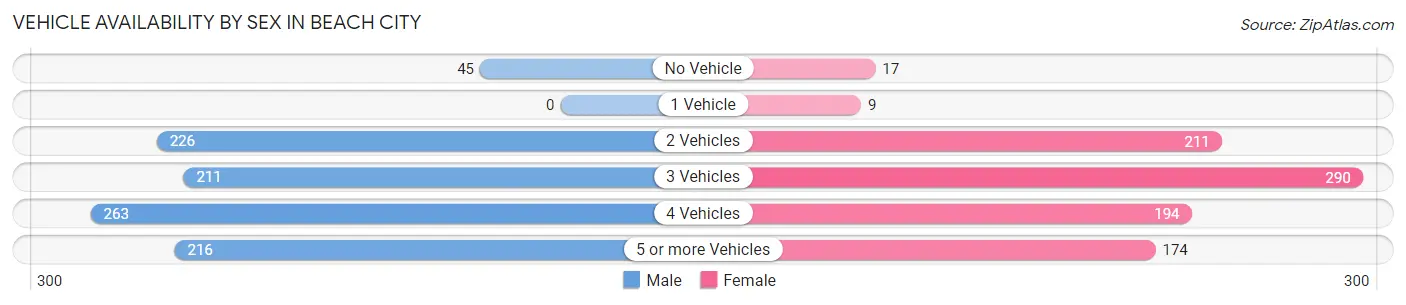
| Vehicles Available | Male | Female |
| No Vehicle | 45 (4.7%) | 17 (1.9%) |
| 1 Vehicle | 0 (0.0%) | 9 (1.0%) |
| 2 Vehicles | 226 (23.5%) | 211 (23.6%) |
| 3 Vehicles | 211 (22.0%) | 290 (32.4%) |
| 4 Vehicles | 263 (27.4%) | 194 (21.7%) |
| 5 or more Vehicles | 216 (22.5%) | 174 (19.4%) |
| Total | 961 (100.0%) | 895 (100.0%) |
Commute Time in Beach City
The most frequently occuring commute durations in Beach City are 30 to 34 minutes (392 commuters, 22.2%), 20 to 24 minutes (349 commuters, 19.7%), and 15 to 19 minutes (279 commuters, 15.8%).
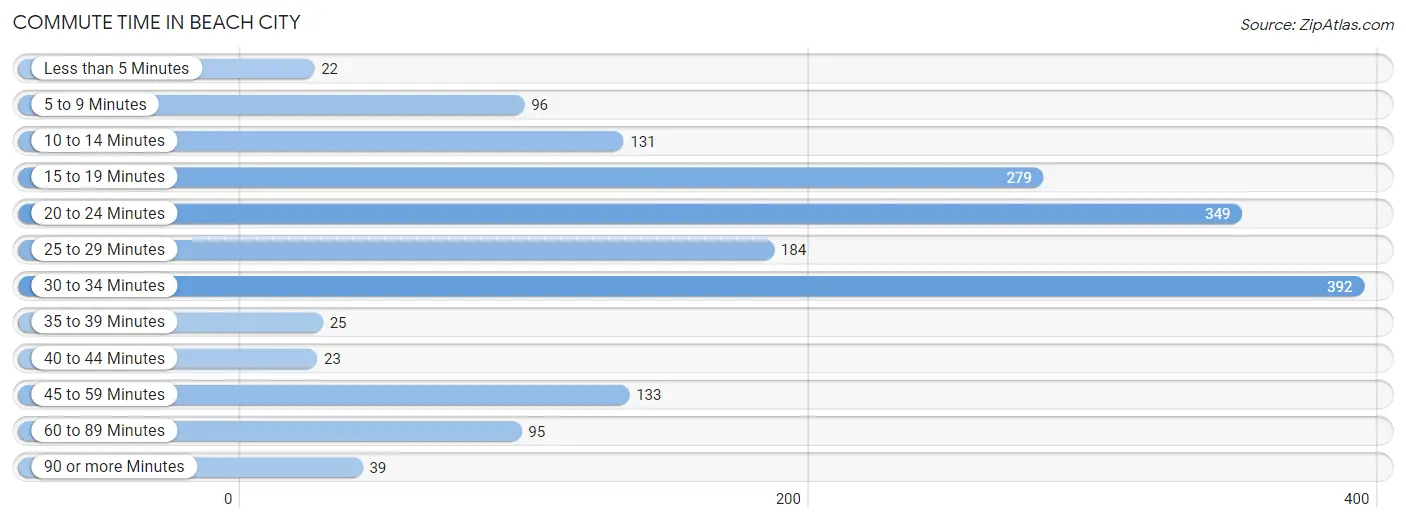
| Commute Time | # Commuters | % Commuters |
| Less than 5 Minutes | 22 | 1.2% |
| 5 to 9 Minutes | 96 | 5.4% |
| 10 to 14 Minutes | 131 | 7.4% |
| 15 to 19 Minutes | 279 | 15.8% |
| 20 to 24 Minutes | 349 | 19.7% |
| 25 to 29 Minutes | 184 | 10.4% |
| 30 to 34 Minutes | 392 | 22.2% |
| 35 to 39 Minutes | 25 | 1.4% |
| 40 to 44 Minutes | 23 | 1.3% |
| 45 to 59 Minutes | 133 | 7.5% |
| 60 to 89 Minutes | 95 | 5.4% |
| 90 or more Minutes | 39 | 2.2% |
Commute Time by Sex in Beach City
The most common commute times in Beach City are 30 to 34 minutes (287 commuters, 30.6%) for males and 20 to 24 minutes (140 commuters, 16.9%) for females.
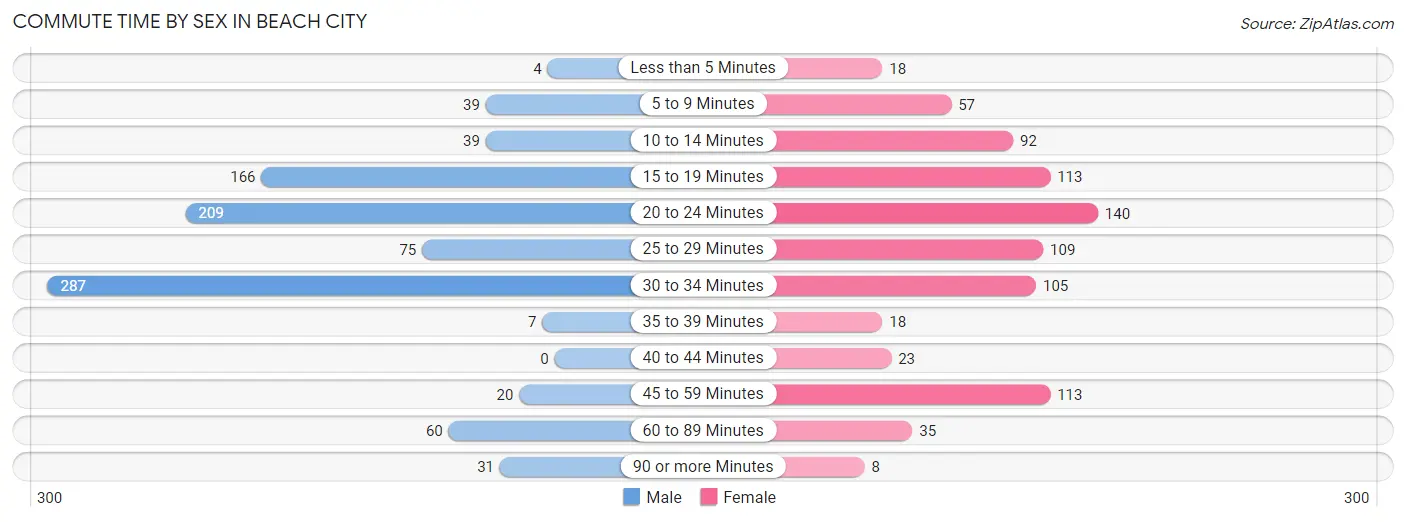
| Commute Time | Male | Female |
| Less than 5 Minutes | 4 (0.4%) | 18 (2.2%) |
| 5 to 9 Minutes | 39 (4.2%) | 57 (6.9%) |
| 10 to 14 Minutes | 39 (4.2%) | 92 (11.1%) |
| 15 to 19 Minutes | 166 (17.7%) | 113 (13.6%) |
| 20 to 24 Minutes | 209 (22.3%) | 140 (16.9%) |
| 25 to 29 Minutes | 75 (8.0%) | 109 (13.1%) |
| 30 to 34 Minutes | 287 (30.6%) | 105 (12.6%) |
| 35 to 39 Minutes | 7 (0.7%) | 18 (2.2%) |
| 40 to 44 Minutes | 0 (0.0%) | 23 (2.8%) |
| 45 to 59 Minutes | 20 (2.1%) | 113 (13.6%) |
| 60 to 89 Minutes | 60 (6.4%) | 35 (4.2%) |
| 90 or more Minutes | 31 (3.3%) | 8 (1.0%) |
Time of Departure to Work by Sex in Beach City
The most frequent times of departure to work in Beach City are 6:00 AM to 6:29 AM (182, 19.4%) for males and 8:00 AM to 8:29 AM (233, 28.0%) for females.
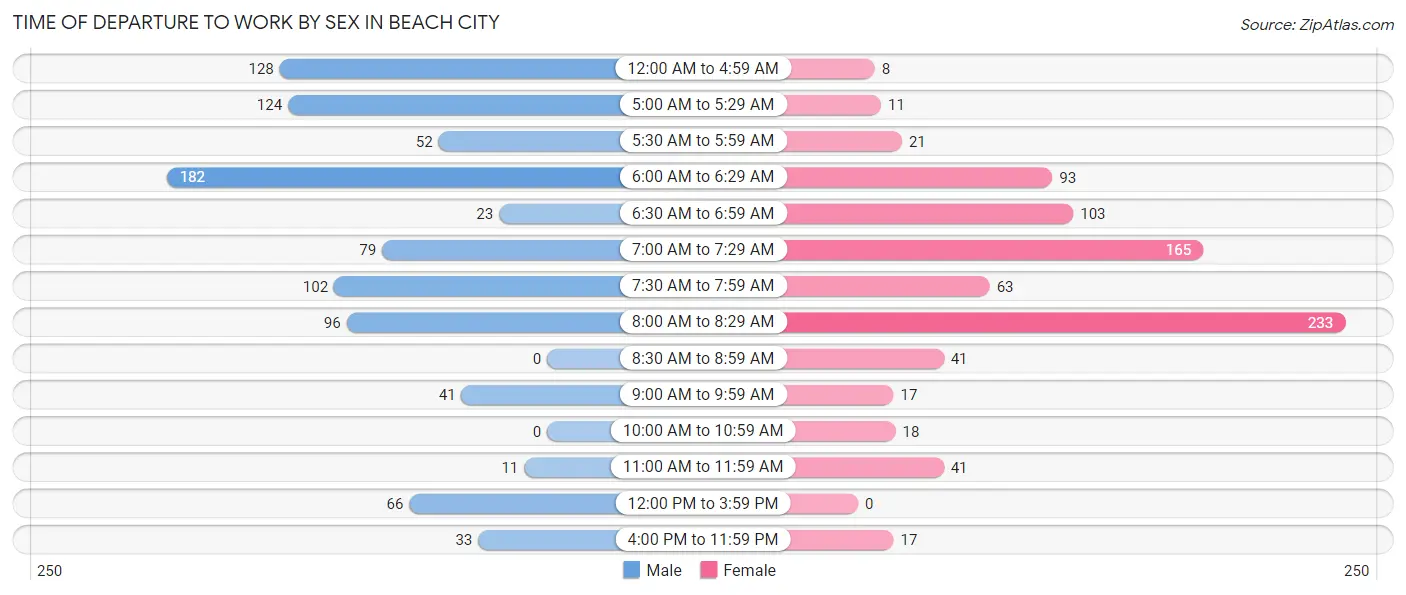
| Time of Departure | Male | Female |
| 12:00 AM to 4:59 AM | 128 (13.7%) | 8 (1.0%) |
| 5:00 AM to 5:29 AM | 124 (13.2%) | 11 (1.3%) |
| 5:30 AM to 5:59 AM | 52 (5.6%) | 21 (2.5%) |
| 6:00 AM to 6:29 AM | 182 (19.4%) | 93 (11.2%) |
| 6:30 AM to 6:59 AM | 23 (2.5%) | 103 (12.4%) |
| 7:00 AM to 7:29 AM | 79 (8.4%) | 165 (19.9%) |
| 7:30 AM to 7:59 AM | 102 (10.9%) | 63 (7.6%) |
| 8:00 AM to 8:29 AM | 96 (10.2%) | 233 (28.0%) |
| 8:30 AM to 8:59 AM | 0 (0.0%) | 41 (4.9%) |
| 9:00 AM to 9:59 AM | 41 (4.4%) | 17 (2.1%) |
| 10:00 AM to 10:59 AM | 0 (0.0%) | 18 (2.2%) |
| 11:00 AM to 11:59 AM | 11 (1.2%) | 41 (4.9%) |
| 12:00 PM to 3:59 PM | 66 (7.0%) | 0 (0.0%) |
| 4:00 PM to 11:59 PM | 33 (3.5%) | 17 (2.1%) |
| Total | 937 (100.0%) | 831 (100.0%) |
Housing Occupancy in Beach City
Occupancy by Ownership in Beach City
Of the total 1,183 dwellings in Beach City, owner-occupied units account for 1,106 (93.5%), while renter-occupied units make up 77 (6.5%).
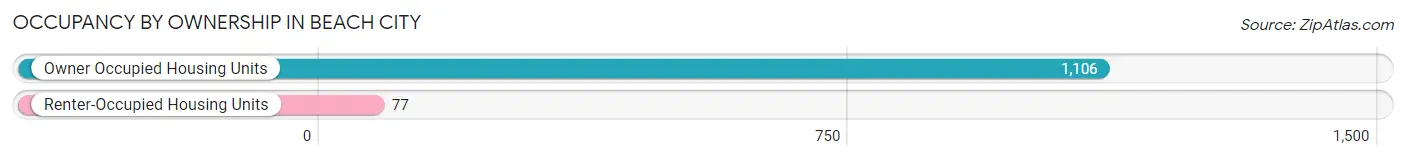
| Occupancy | # Housing Units | % Housing Units |
| Owner Occupied Housing Units | 1,106 | 93.5% |
| Renter-Occupied Housing Units | 77 | 6.5% |
| Total Occupied Housing Units | 1,183 | 100.0% |
Occupancy by Household Size in Beach City
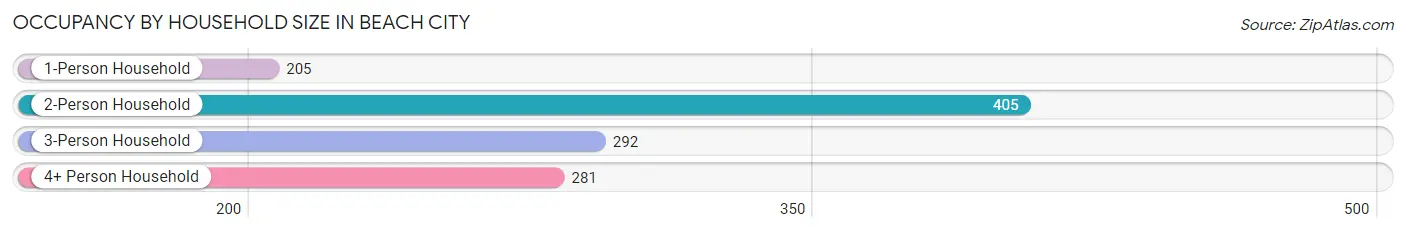
| Household Size | # Housing Units | % Housing Units |
| 1-Person Household | 205 | 17.3% |
| 2-Person Household | 405 | 34.2% |
| 3-Person Household | 292 | 24.7% |
| 4+ Person Household | 281 | 23.7% |
| Total Housing Units | 1,183 | 100.0% |
Occupancy by Ownership by Household Size in Beach City
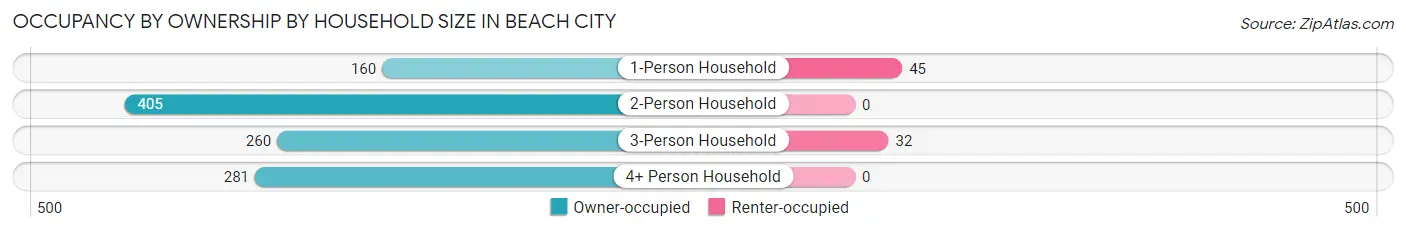
| Household Size | Owner-occupied | Renter-occupied |
| 1-Person Household | 160 (78.0%) | 45 (22.0%) |
| 2-Person Household | 405 (100.0%) | 0 (0.0%) |
| 3-Person Household | 260 (89.0%) | 32 (11.0%) |
| 4+ Person Household | 281 (100.0%) | 0 (0.0%) |
| Total Housing Units | 1,106 (93.5%) | 77 (6.5%) |
Occupancy by Educational Attainment in Beach City
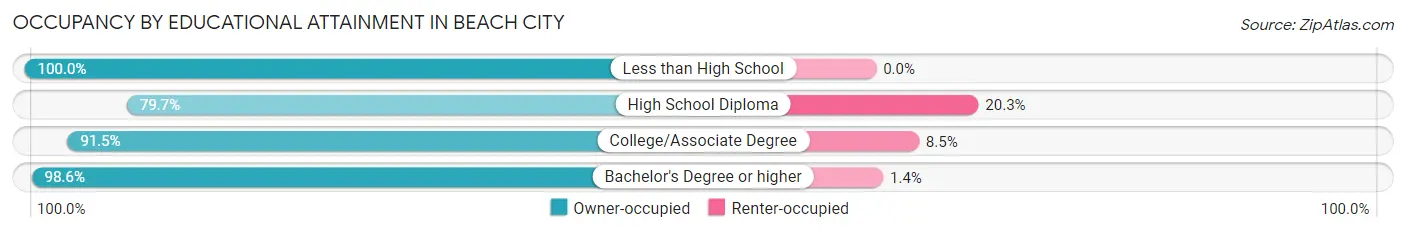
| Household Size | Owner-occupied | Renter-occupied |
| Less than High School | 74 (100.0%) | 0 (0.0%) |
| High School Diploma | 59 (79.7%) | 15 (20.3%) |
| College/Associate Degree | 616 (91.5%) | 57 (8.5%) |
| Bachelor's Degree or higher | 357 (98.6%) | 5 (1.4%) |
Occupancy by Age of Householder in Beach City
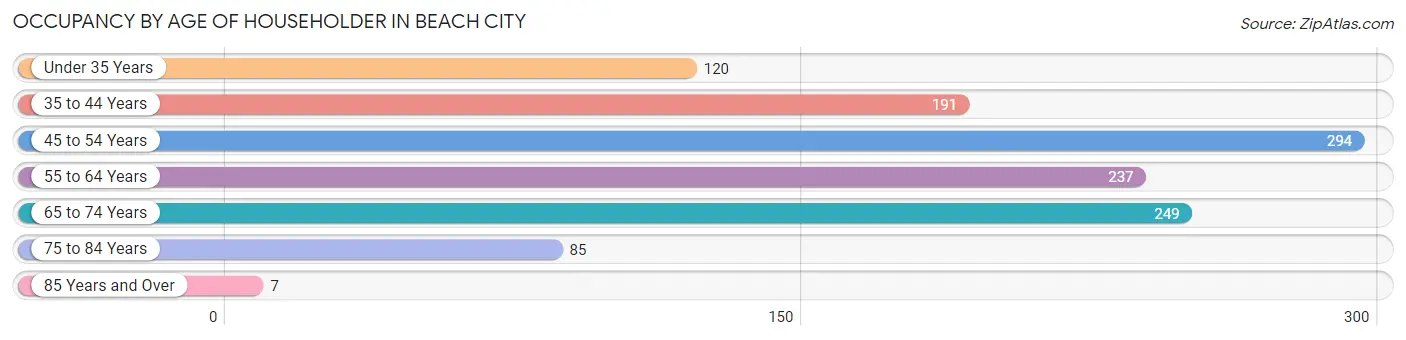
| Age Bracket | # Households | % Households |
| Under 35 Years | 120 | 10.1% |
| 35 to 44 Years | 191 | 16.2% |
| 45 to 54 Years | 294 | 24.8% |
| 55 to 64 Years | 237 | 20.0% |
| 65 to 74 Years | 249 | 21.0% |
| 75 to 84 Years | 85 | 7.2% |
| 85 Years and Over | 7 | 0.6% |
| Total | 1,183 | 100.0% |
Housing Finances in Beach City
Median Income by Occupancy in Beach City
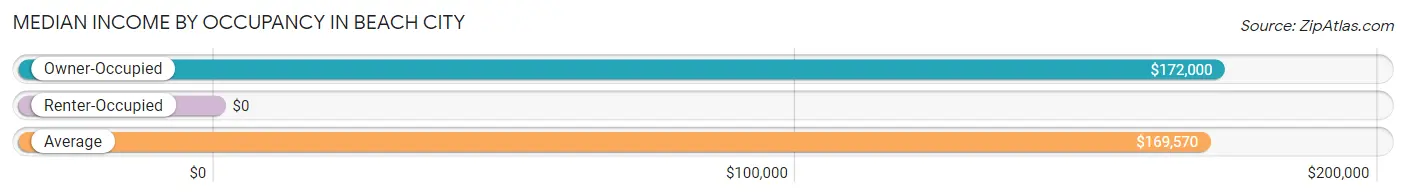
| Occupancy Type | # Households | Median Income |
| Owner-Occupied | 1,106 (93.5%) | $172,000 |
| Renter-Occupied | 77 (6.5%) | $0 |
| Average | 1,183 (100.0%) | $169,570 |
Occupancy by Householder Income Bracket in Beach City
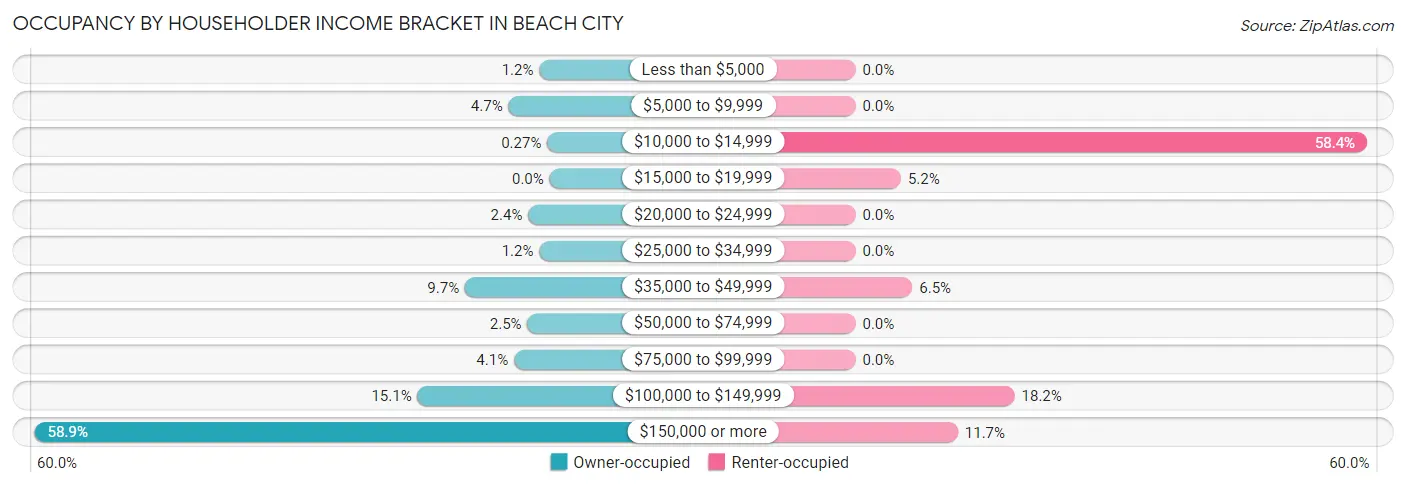
| Income Bracket | Owner-occupied | Renter-occupied |
| Less than $5,000 | 13 (1.2%) | 0 (0.0%) |
| $5,000 to $9,999 | 52 (4.7%) | 0 (0.0%) |
| $10,000 to $14,999 | 3 (0.3%) | 45 (58.4%) |
| $15,000 to $19,999 | 0 (0.0%) | 4 (5.2%) |
| $20,000 to $24,999 | 27 (2.4%) | 0 (0.0%) |
| $25,000 to $34,999 | 13 (1.2%) | 0 (0.0%) |
| $35,000 to $49,999 | 107 (9.7%) | 5 (6.5%) |
| $50,000 to $74,999 | 28 (2.5%) | 0 (0.0%) |
| $75,000 to $99,999 | 45 (4.1%) | 0 (0.0%) |
| $100,000 to $149,999 | 167 (15.1%) | 14 (18.2%) |
| $150,000 or more | 651 (58.9%) | 9 (11.7%) |
| Total | 1,106 (100.0%) | 77 (100.0%) |
Monthly Housing Cost Tiers in Beach City
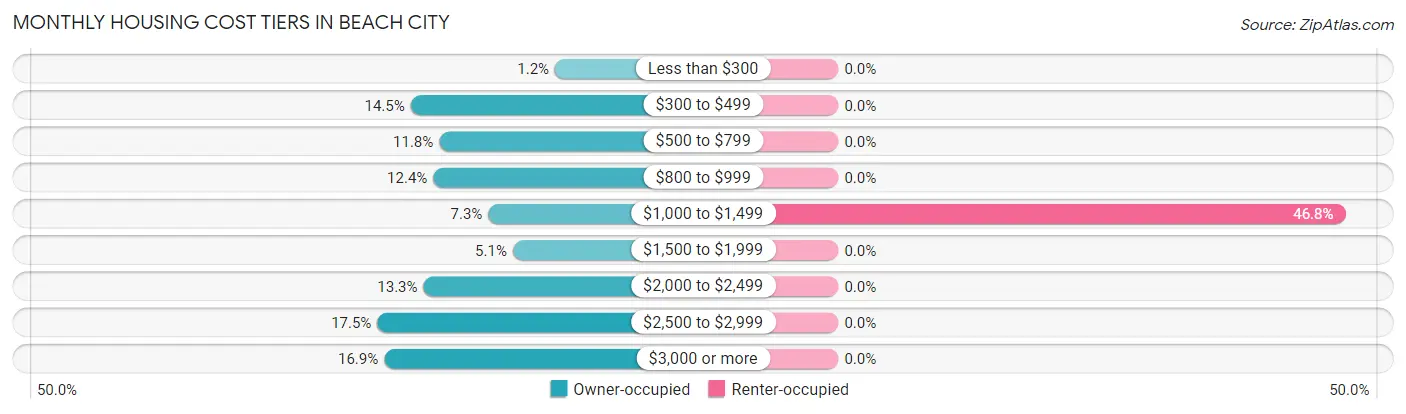
| Monthly Cost | Owner-occupied | Renter-occupied |
| Less than $300 | 13 (1.2%) | 0 (0.0%) |
| $300 to $499 | 160 (14.5%) | 0 (0.0%) |
| $500 to $799 | 131 (11.8%) | 0 (0.0%) |
| $800 to $999 | 137 (12.4%) | 0 (0.0%) |
| $1,000 to $1,499 | 81 (7.3%) | 36 (46.8%) |
| $1,500 to $1,999 | 56 (5.1%) | 0 (0.0%) |
| $2,000 to $2,499 | 147 (13.3%) | 0 (0.0%) |
| $2,500 to $2,999 | 194 (17.5%) | 0 (0.0%) |
| $3,000 or more | 187 (16.9%) | 0 (0.0%) |
| Total | 1,106 (100.0%) | 77 (100.0%) |
Physical Housing Characteristics in Beach City
Housing Structures in Beach City
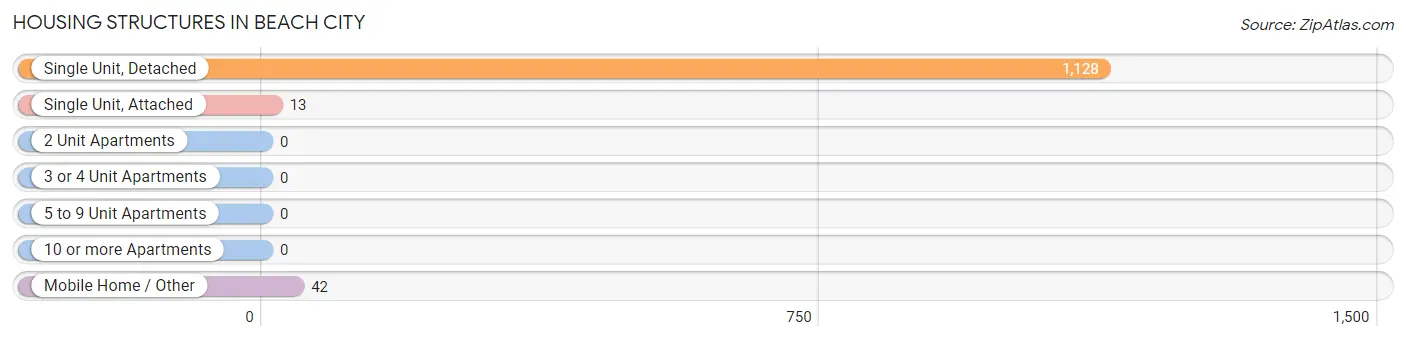
| Structure Type | # Housing Units | % Housing Units |
| Single Unit, Detached | 1,128 | 95.4% |
| Single Unit, Attached | 13 | 1.1% |
| 2 Unit Apartments | 0 | 0.0% |
| 3 or 4 Unit Apartments | 0 | 0.0% |
| 5 to 9 Unit Apartments | 0 | 0.0% |
| 10 or more Apartments | 0 | 0.0% |
| Mobile Home / Other | 42 | 3.5% |
| Total | 1,183 | 100.0% |
Housing Structures by Occupancy in Beach City
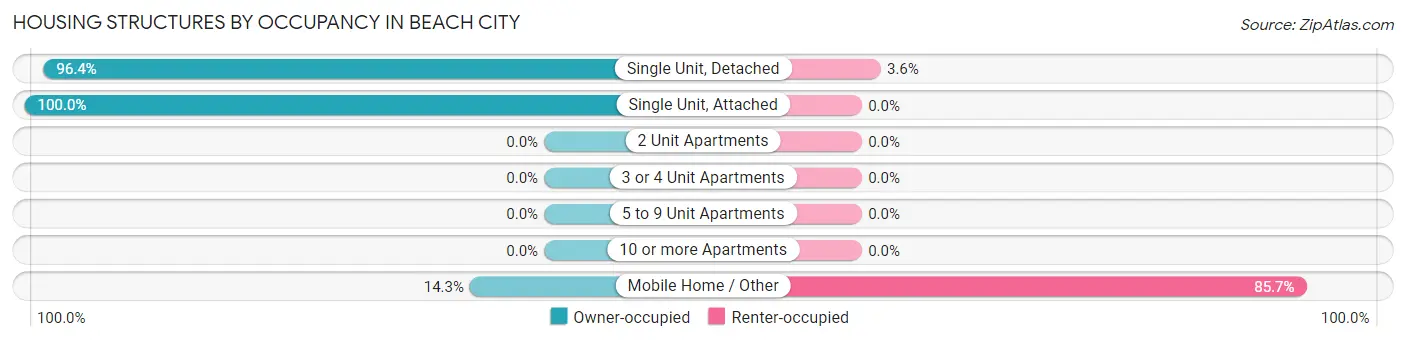
| Structure Type | Owner-occupied | Renter-occupied |
| Single Unit, Detached | 1,087 (96.4%) | 41 (3.6%) |
| Single Unit, Attached | 13 (100.0%) | 0 (0.0%) |
| 2 Unit Apartments | 0 (0.0%) | 0 (0.0%) |
| 3 or 4 Unit Apartments | 0 (0.0%) | 0 (0.0%) |
| 5 to 9 Unit Apartments | 0 (0.0%) | 0 (0.0%) |
| 10 or more Apartments | 0 (0.0%) | 0 (0.0%) |
| Mobile Home / Other | 6 (14.3%) | 36 (85.7%) |
| Total | 1,106 (93.5%) | 77 (6.5%) |
Housing Structures by Number of Rooms in Beach City
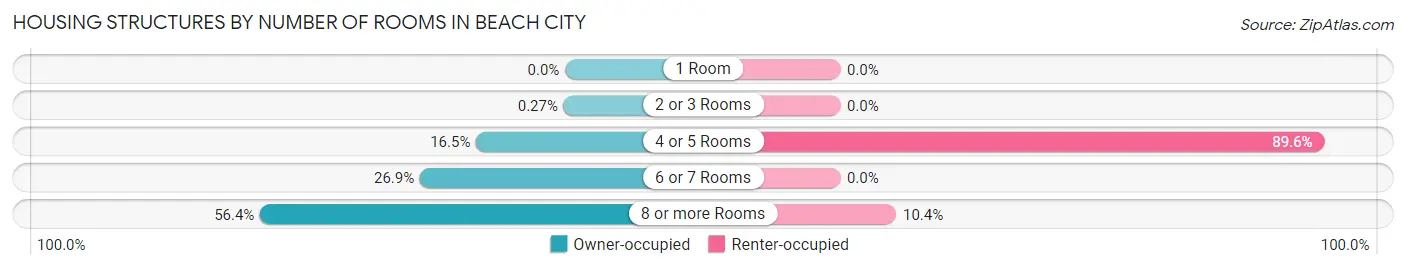
| Number of Rooms | Owner-occupied | Renter-occupied |
| 1 Room | 0 (0.0%) | 0 (0.0%) |
| 2 or 3 Rooms | 3 (0.3%) | 0 (0.0%) |
| 4 or 5 Rooms | 182 (16.5%) | 69 (89.6%) |
| 6 or 7 Rooms | 297 (26.9%) | 0 (0.0%) |
| 8 or more Rooms | 624 (56.4%) | 8 (10.4%) |
| Total | 1,106 (100.0%) | 77 (100.0%) |
Housing Structure by Heating Type in Beach City
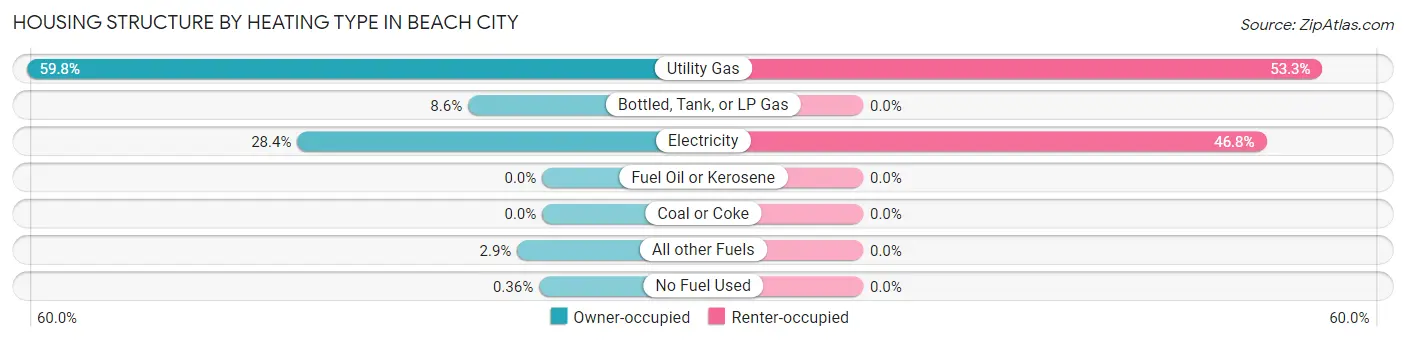
| Heating Type | Owner-occupied | Renter-occupied |
| Utility Gas | 661 (59.8%) | 41 (53.2%) |
| Bottled, Tank, or LP Gas | 95 (8.6%) | 0 (0.0%) |
| Electricity | 314 (28.4%) | 36 (46.8%) |
| Fuel Oil or Kerosene | 0 (0.0%) | 0 (0.0%) |
| Coal or Coke | 0 (0.0%) | 0 (0.0%) |
| All other Fuels | 32 (2.9%) | 0 (0.0%) |
| No Fuel Used | 4 (0.4%) | 0 (0.0%) |
| Total | 1,106 (100.0%) | 77 (100.0%) |
Household Vehicle Usage in Beach City
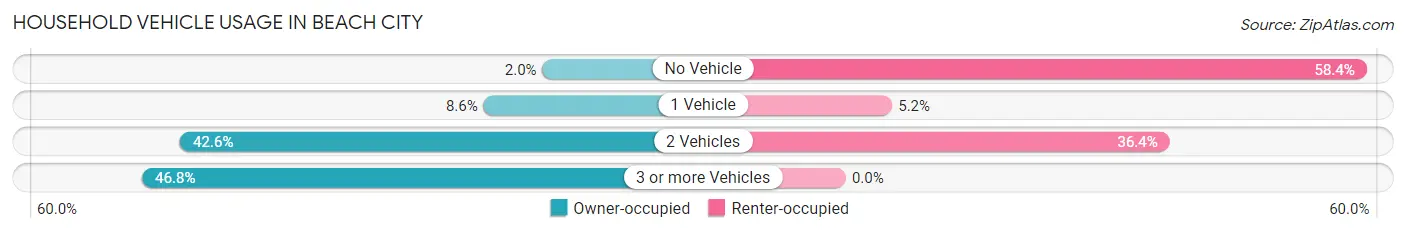
| Vehicles per Household | Owner-occupied | Renter-occupied |
| No Vehicle | 22 (2.0%) | 45 (58.4%) |
| 1 Vehicle | 95 (8.6%) | 4 (5.2%) |
| 2 Vehicles | 471 (42.6%) | 28 (36.4%) |
| 3 or more Vehicles | 518 (46.8%) | 0 (0.0%) |
| Total | 1,106 (100.0%) | 77 (100.0%) |
Real Estate & Mortgages in Beach City
Real Estate and Mortgage Overview in Beach City
| Characteristic | Without Mortgage | With Mortgage |
| Housing Units | 462 | 644 |
| Median Property Value | $374,200 | $434,100 |
| Median Household Income | $144,833 | $424 |
| Monthly Housing Costs | $667 | $187 |
| Real Estate Taxes | $1,707 | $10 |
Property Value by Mortgage Status in Beach City
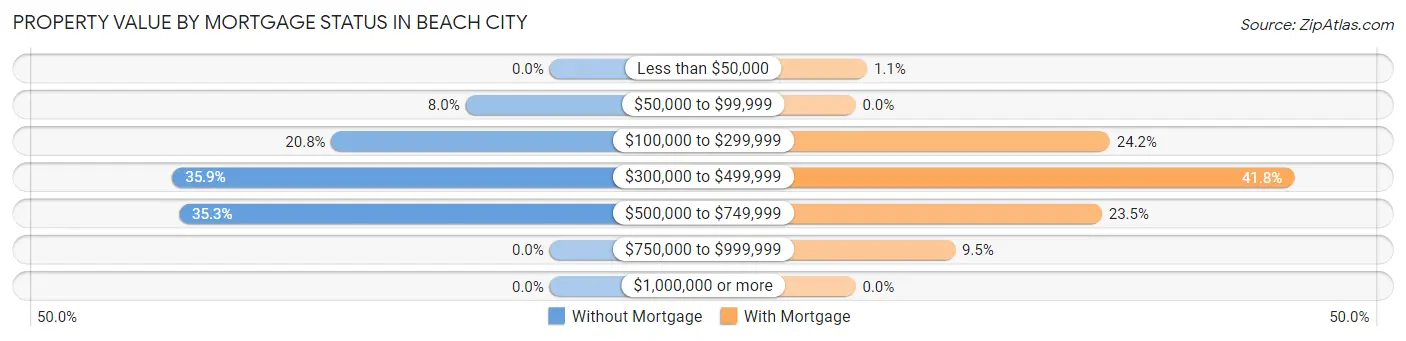
| Property Value | Without Mortgage | With Mortgage |
| Less than $50,000 | 0 (0.0%) | 7 (1.1%) |
| $50,000 to $99,999 | 37 (8.0%) | 0 (0.0%) |
| $100,000 to $299,999 | 96 (20.8%) | 156 (24.2%) |
| $300,000 to $499,999 | 166 (35.9%) | 269 (41.8%) |
| $500,000 to $749,999 | 163 (35.3%) | 151 (23.4%) |
| $750,000 to $999,999 | 0 (0.0%) | 61 (9.5%) |
| $1,000,000 or more | 0 (0.0%) | 0 (0.0%) |
| Total | 462 (100.0%) | 644 (100.0%) |
Household Income by Mortgage Status in Beach City
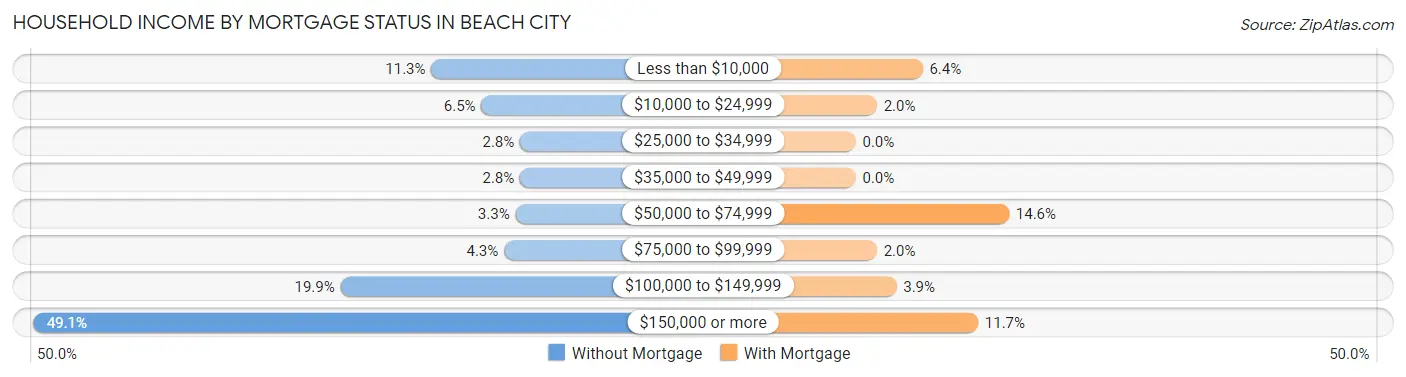
| Household Income | Without Mortgage | With Mortgage |
| Less than $10,000 | 52 (11.3%) | 41 (6.4%) |
| $10,000 to $24,999 | 30 (6.5%) | 13 (2.0%) |
| $25,000 to $34,999 | 13 (2.8%) | 0 (0.0%) |
| $35,000 to $49,999 | 13 (2.8%) | 0 (0.0%) |
| $50,000 to $74,999 | 15 (3.3%) | 94 (14.6%) |
| $75,000 to $99,999 | 20 (4.3%) | 13 (2.0%) |
| $100,000 to $149,999 | 92 (19.9%) | 25 (3.9%) |
| $150,000 or more | 227 (49.1%) | 75 (11.7%) |
| Total | 462 (100.0%) | 644 (100.0%) |
Property Value to Household Income Ratio in Beach City
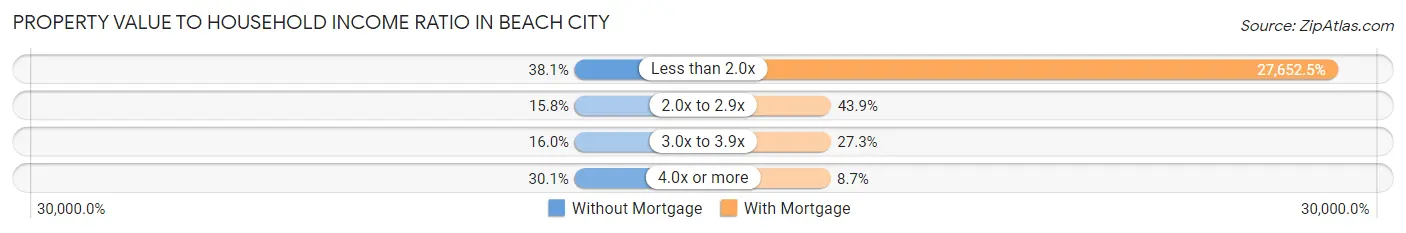
| Value-to-Income Ratio | Without Mortgage | With Mortgage |
| Less than 2.0x | 176 (38.1%) | 178,082 (27,652.5%) |
| 2.0x to 2.9x | 73 (15.8%) | 283 (43.9%) |
| 3.0x to 3.9x | 74 (16.0%) | 176 (27.3%) |
| 4.0x or more | 139 (30.1%) | 56 (8.7%) |
| Total | 462 (100.0%) | 644 (100.0%) |
Real Estate Taxes by Mortgage Status in Beach City
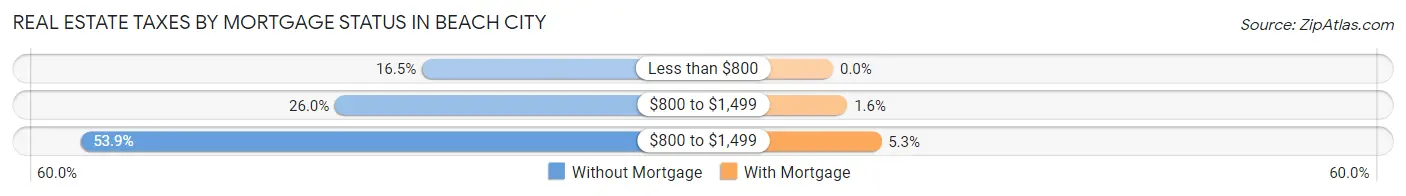
| Property Taxes | Without Mortgage | With Mortgage |
| Less than $800 | 76 (16.5%) | 0 (0.0%) |
| $800 to $1,499 | 120 (26.0%) | 10 (1.5%) |
| $800 to $1,499 | 249 (53.9%) | 34 (5.3%) |
| Total | 462 (100.0%) | 644 (100.0%) |
Health & Disability in Beach City
Health Insurance Coverage by Age in Beach City
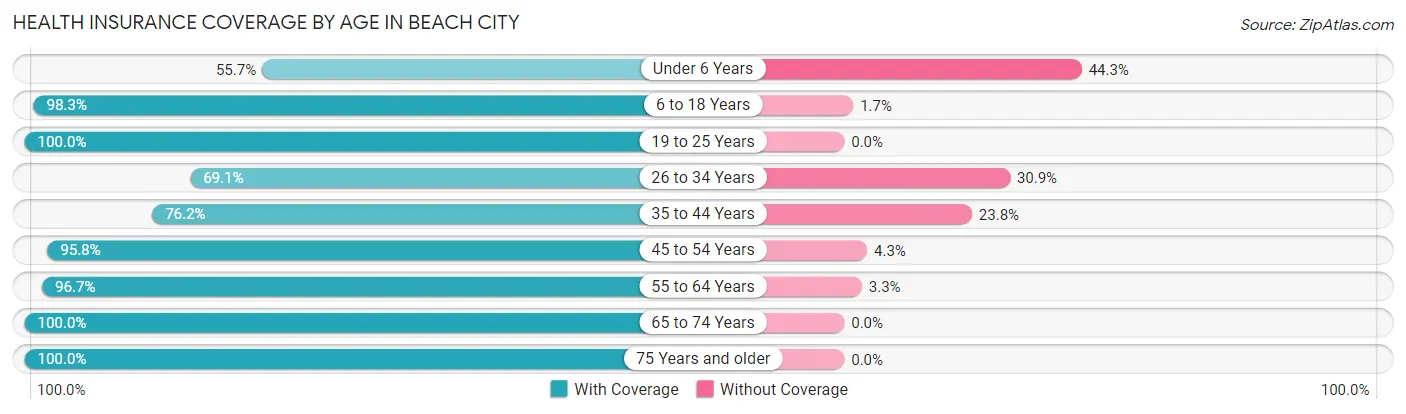
| Age Bracket | With Coverage | Without Coverage |
| Under 6 Years | 73 (55.7%) | 58 (44.3%) |
| 6 to 18 Years | 354 (98.3%) | 6 (1.7%) |
| 19 to 25 Years | 458 (100.0%) | 0 (0.0%) |
| 26 to 34 Years | 179 (69.1%) | 80 (30.9%) |
| 35 to 44 Years | 269 (76.2%) | 84 (23.8%) |
| 45 to 54 Years | 473 (95.8%) | 21 (4.3%) |
| 55 to 64 Years | 501 (96.7%) | 17 (3.3%) |
| 65 to 74 Years | 388 (100.0%) | 0 (0.0%) |
| 75 Years and older | 165 (100.0%) | 0 (0.0%) |
| Total | 2,860 (91.5%) | 266 (8.5%) |
Health Insurance Coverage by Citizenship Status in Beach City
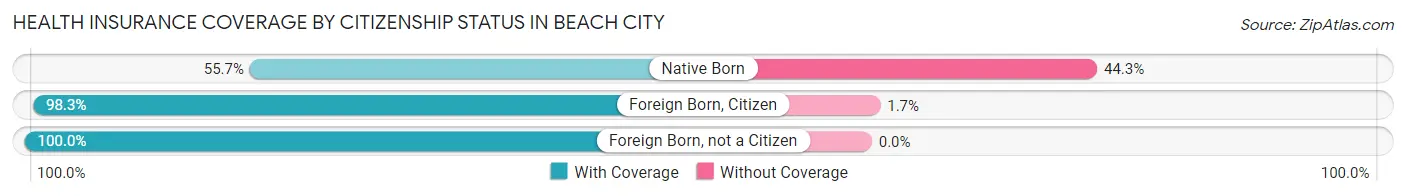
| Citizenship Status | With Coverage | Without Coverage |
| Native Born | 73 (55.7%) | 58 (44.3%) |
| Foreign Born, Citizen | 354 (98.3%) | 6 (1.7%) |
| Foreign Born, not a Citizen | 458 (100.0%) | 0 (0.0%) |
Health Insurance Coverage by Household Income in Beach City
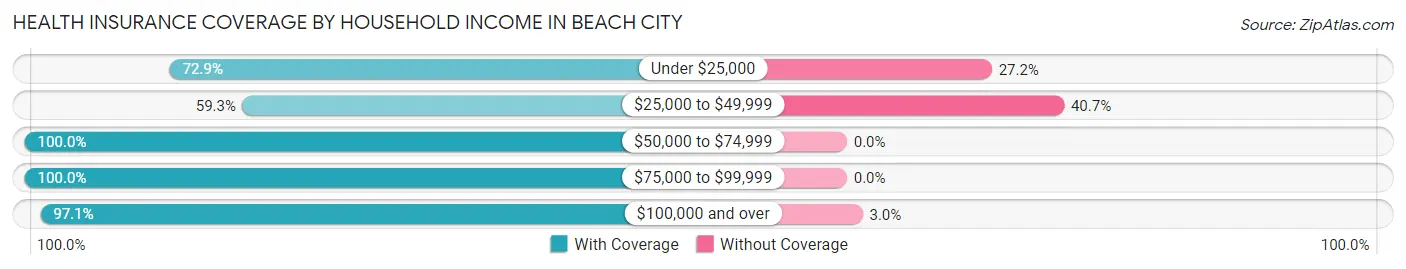
| Household Income | With Coverage | Without Coverage |
| Under $25,000 | 110 (72.9%) | 41 (27.2%) |
| $25,000 to $49,999 | 223 (59.3%) | 153 (40.7%) |
| $50,000 to $74,999 | 45 (100.0%) | 0 (0.0%) |
| $75,000 to $99,999 | 111 (100.0%) | 0 (0.0%) |
| $100,000 and over | 2,371 (97.1%) | 72 (2.9%) |
Public vs Private Health Insurance Coverage by Age in Beach City
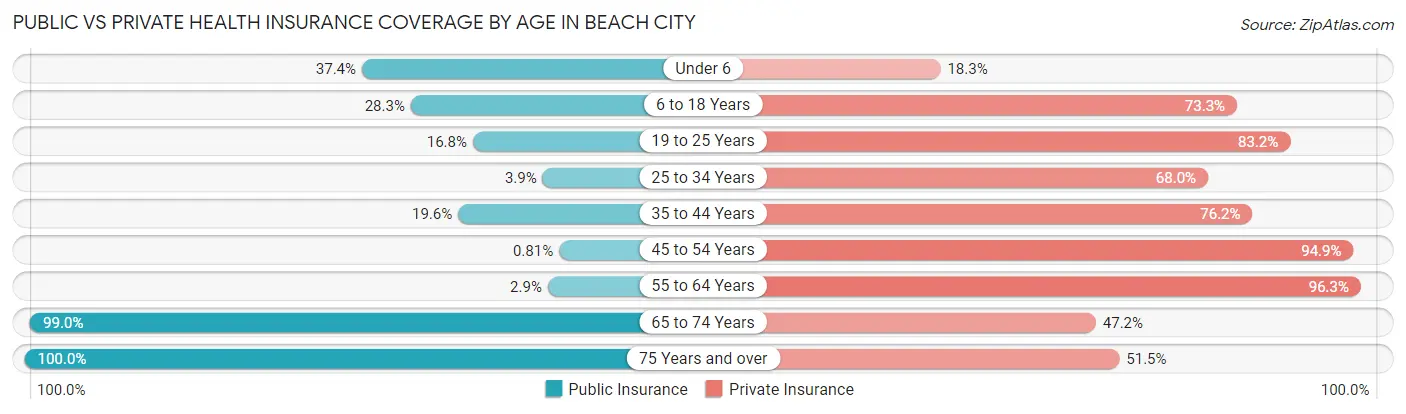
| Age Bracket | Public Insurance | Private Insurance |
| Under 6 | 49 (37.4%) | 24 (18.3%) |
| 6 to 18 Years | 102 (28.3%) | 264 (73.3%) |
| 19 to 25 Years | 77 (16.8%) | 381 (83.2%) |
| 25 to 34 Years | 10 (3.9%) | 176 (67.9%) |
| 35 to 44 Years | 69 (19.6%) | 269 (76.2%) |
| 45 to 54 Years | 4 (0.8%) | 469 (94.9%) |
| 55 to 64 Years | 15 (2.9%) | 499 (96.3%) |
| 65 to 74 Years | 384 (99.0%) | 183 (47.2%) |
| 75 Years and over | 165 (100.0%) | 85 (51.5%) |
| Total | 875 (28.0%) | 2,350 (75.2%) |
Disability Status by Sex by Age in Beach City
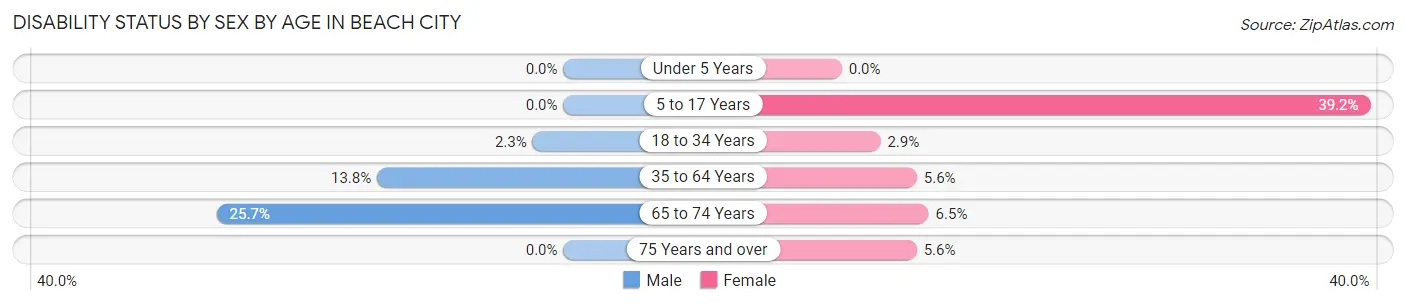
| Age Bracket | Male | Female |
| Under 5 Years | 0 (0.0%) | 0 (0.0%) |
| 5 to 17 Years | 0 (0.0%) | 31 (39.2%) |
| 18 to 34 Years | 11 (2.3%) | 8 (2.9%) |
| 35 to 64 Years | 87 (13.8%) | 41 (5.6%) |
| 65 to 74 Years | 52 (25.7%) | 12 (6.5%) |
| 75 Years and over | 0 (0.0%) | 4 (5.6%) |
Disability Class by Sex by Age in Beach City
Disability Class: Hearing Difficulty
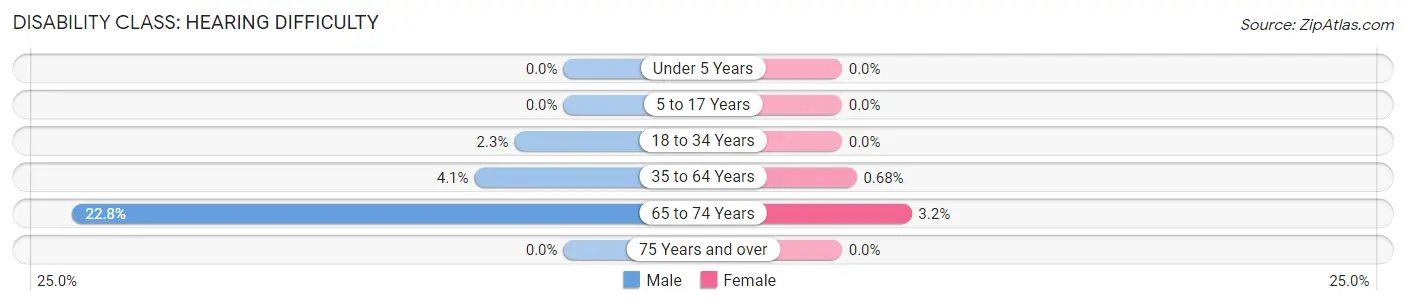
| Age Bracket | Male | Female |
| Under 5 Years | 0 (0.0%) | 0 (0.0%) |
| 5 to 17 Years | 0 (0.0%) | 0 (0.0%) |
| 18 to 34 Years | 11 (2.3%) | 0 (0.0%) |
| 35 to 64 Years | 26 (4.1%) | 5 (0.7%) |
| 65 to 74 Years | 46 (22.8%) | 6 (3.2%) |
| 75 Years and over | 0 (0.0%) | 0 (0.0%) |
Disability Class: Vision Difficulty
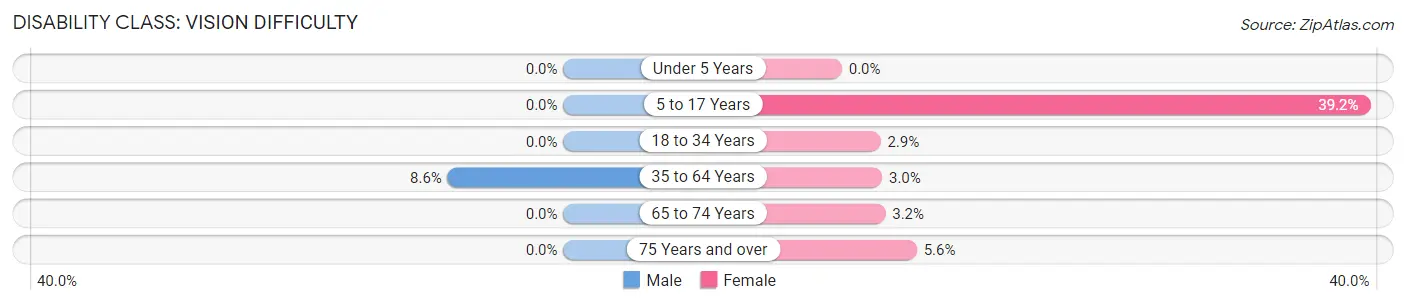
| Age Bracket | Male | Female |
| Under 5 Years | 0 (0.0%) | 0 (0.0%) |
| 5 to 17 Years | 0 (0.0%) | 31 (39.2%) |
| 18 to 34 Years | 0 (0.0%) | 8 (2.9%) |
| 35 to 64 Years | 54 (8.6%) | 22 (3.0%) |
| 65 to 74 Years | 0 (0.0%) | 6 (3.2%) |
| 75 Years and over | 0 (0.0%) | 4 (5.6%) |
Disability Class: Cognitive Difficulty
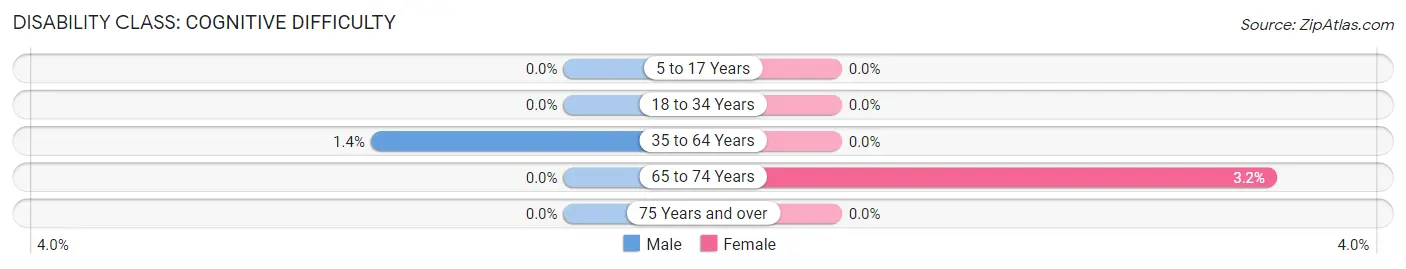
| Age Bracket | Male | Female |
| 5 to 17 Years | 0 (0.0%) | 0 (0.0%) |
| 18 to 34 Years | 0 (0.0%) | 0 (0.0%) |
| 35 to 64 Years | 9 (1.4%) | 0 (0.0%) |
| 65 to 74 Years | 0 (0.0%) | 6 (3.2%) |
| 75 Years and over | 0 (0.0%) | 0 (0.0%) |
Disability Class: Ambulatory Difficulty
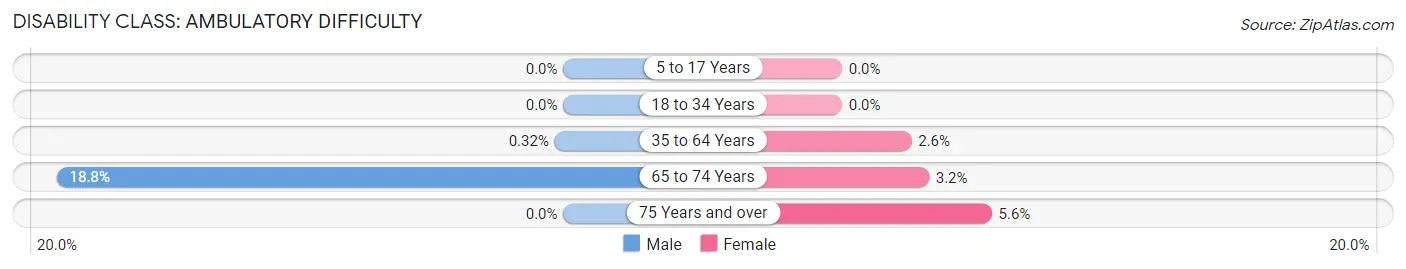
| Age Bracket | Male | Female |
| 5 to 17 Years | 0 (0.0%) | 0 (0.0%) |
| 18 to 34 Years | 0 (0.0%) | 0 (0.0%) |
| 35 to 64 Years | 2 (0.3%) | 19 (2.6%) |
| 65 to 74 Years | 38 (18.8%) | 6 (3.2%) |
| 75 Years and over | 0 (0.0%) | 4 (5.6%) |
Disability Class: Self-Care Difficulty
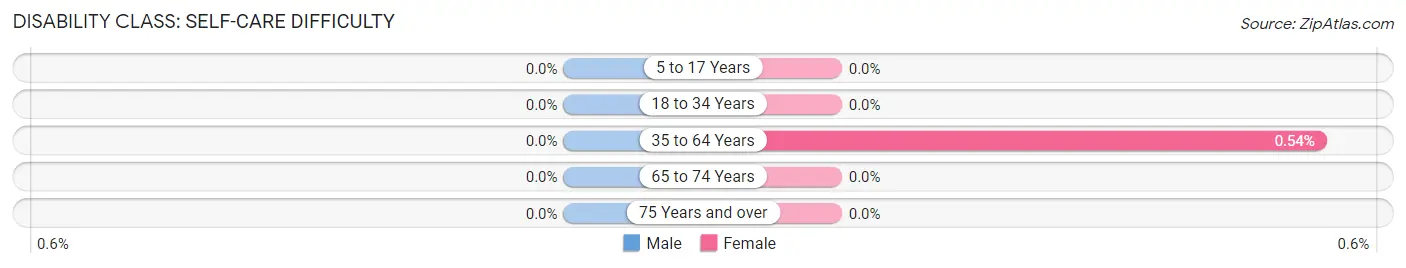
| Age Bracket | Male | Female |
| 5 to 17 Years | 0 (0.0%) | 0 (0.0%) |
| 18 to 34 Years | 0 (0.0%) | 0 (0.0%) |
| 35 to 64 Years | 0 (0.0%) | 4 (0.5%) |
| 65 to 74 Years | 0 (0.0%) | 0 (0.0%) |
| 75 Years and over | 0 (0.0%) | 0 (0.0%) |
Technology Access in Beach City
Computing Device Access in Beach City
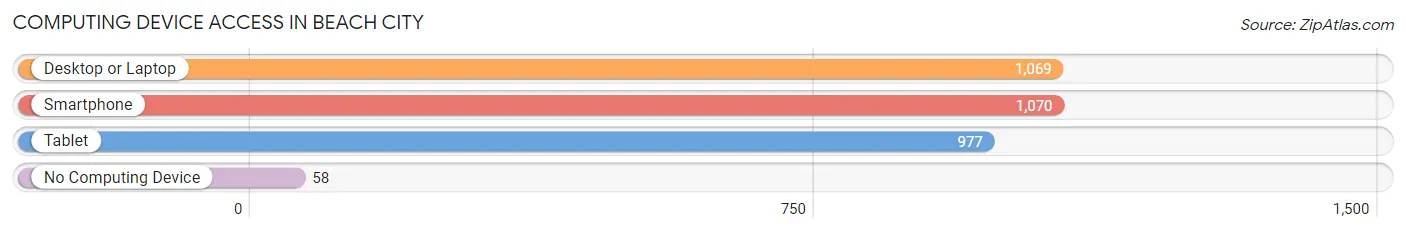
| Device Type | # Households | % Households |
| Desktop or Laptop | 1,069 | 90.4% |
| Smartphone | 1,070 | 90.4% |
| Tablet | 977 | 82.6% |
| No Computing Device | 58 | 4.9% |
| Total | 1,183 | 100.0% |
Internet Access in Beach City
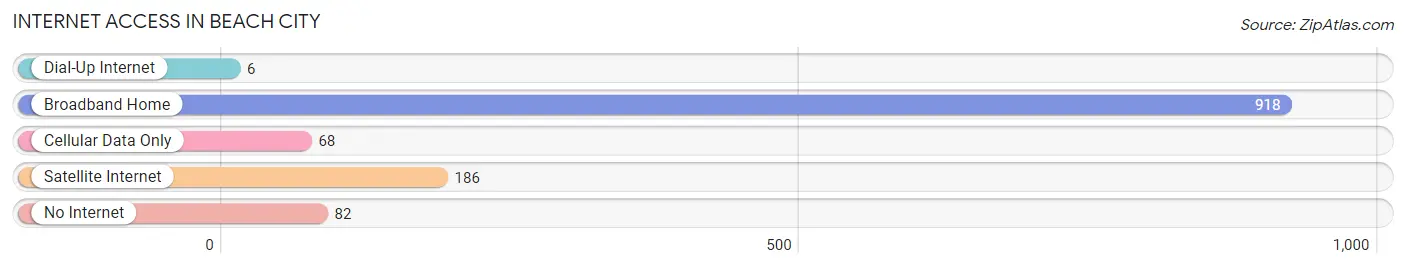
| Internet Type | # Households | % Households |
| Dial-Up Internet | 6 | 0.5% |
| Broadband Home | 918 | 77.6% |
| Cellular Data Only | 68 | 5.8% |
| Satellite Internet | 186 | 15.7% |
| No Internet | 82 | 6.9% |
| Total | 1,183 | 100.0% |
Beach City Summary
Beach City is a small city located in Chambers County, Texas, United States. It is situated on the Gulf of Mexico, approximately 40 miles east of Houston. The city has a population of approximately 2,500 people and covers an area of 1.3 square miles.
History
Beach City was founded in 1891 by a group of settlers from Galveston, Texas. The settlers were looking for a place to settle and start a new life. The city was named after the nearby beach, which was a popular destination for the settlers. The city was incorporated in 1895 and has remained a small, quiet community ever since.
The city was originally a fishing and farming community, but in the early 1900s, the city began to develop into a resort town. The city was home to several hotels, restaurants, and other businesses that catered to tourists. The city also had a large number of beachfront homes and cottages.
In the 1950s, the city began to experience a decline in tourism due to the development of nearby Galveston. The city was also affected by the construction of the Houston Ship Channel, which caused the beach to become polluted. In the 1970s, the city began to experience a resurgence in tourism due to the development of the nearby Kemah Boardwalk.
Geography
Beach City is located on the Gulf of Mexico, approximately 40 miles east of Houston. The city is situated on a peninsula, with the Gulf of Mexico to the south and Galveston Bay to the north. The city is bordered by the cities of Galveston, Texas City, and La Marque.
The city has a humid subtropical climate, with hot, humid summers and mild winters. The average temperature in the summer is around 90 degrees Fahrenheit, and the average temperature in the winter is around 60 degrees Fahrenheit.
Economy
Beach City’s economy is largely based on tourism. The city is home to several hotels, restaurants, and other businesses that cater to tourists. The city also has a large number of beachfront homes and cottages.
The city is also home to several oil and gas companies, as well as a number of manufacturing and industrial businesses. The city is also home to a number of seafood processing plants.
Demographics
As of the 2010 census, Beach City had a population of 2,500 people. The racial makeup of the city was 79.2% White, 14.4% African American, 0.4% Native American, 0.8% Asian, and 4.2% from other races. The median household income was $37,500, and the median family income was $45,000.
Beach City is a small, quiet community that is largely dependent on tourism. The city has a diverse population and a strong economy. The city is home to several hotels, restaurants, and other businesses that cater to tourists. The city also has a large number of beachfront homes and cottages. The city is also home to several oil and gas companies, as well as a number of manufacturing and industrial businesses.
Common Questions
What is the Total Population of Beach City?
Total Population of Beach City is 3,126.
What is the Total Male Population of Beach City?
Total Male Population of Beach City is 1,763.
What is the Total Female Population of Beach City?
Total Female Population of Beach City is 1,363.
What is the Ratio of Males per 100 Females in Beach City?
There are 129.35 Males per 100 Females in Beach City.
What is the Ratio of Females per 100 Males in Beach City?
There are 77.31 Females per 100 Males in Beach City.
What is the Median Population Age in Beach City?
Median Population Age in Beach City is 45.1 Years.
What is the Average Family Size in Beach City
Average Family Size in Beach City is 2.8 People.
What is the Average Household Size in Beach City
Average Household Size in Beach City is 2.6 People.
What is Per Capita Income in Beach City?
Per Capita income in Beach City is $67,816.
What is the Median Family Income in Beach City?
Median Family Income in Beach City is $176,672.
What is the Median Household income in Beach City?
Median Household Income in Beach City is $169,570.
What is Income or Wage Gap in Beach City?
Income or Wage Gap in Beach City is 3.8%.
Women in Beach City earn 96.2 cents for every dollar earned by a man.
What is Inequality or Gini Index in Beach City?
Inequality or Gini Index in Beach City is 0.47.
How Large is the Labor Force in Beach City?
There are 1,942 People in the Labor Forcein in Beach City.
What is the Percentage of People in the Labor Force in Beach City?
71.5% of People are in the Labor Force in Beach City.
What is the Unemployment Rate in Beach City?
Unemployment Rate in Beach City is 4.0%.