Cities with the Most Immigrants from Central America in Oregon
RELATED REPORTS & OPTIONS
Central America
Oregon
Compare Cities
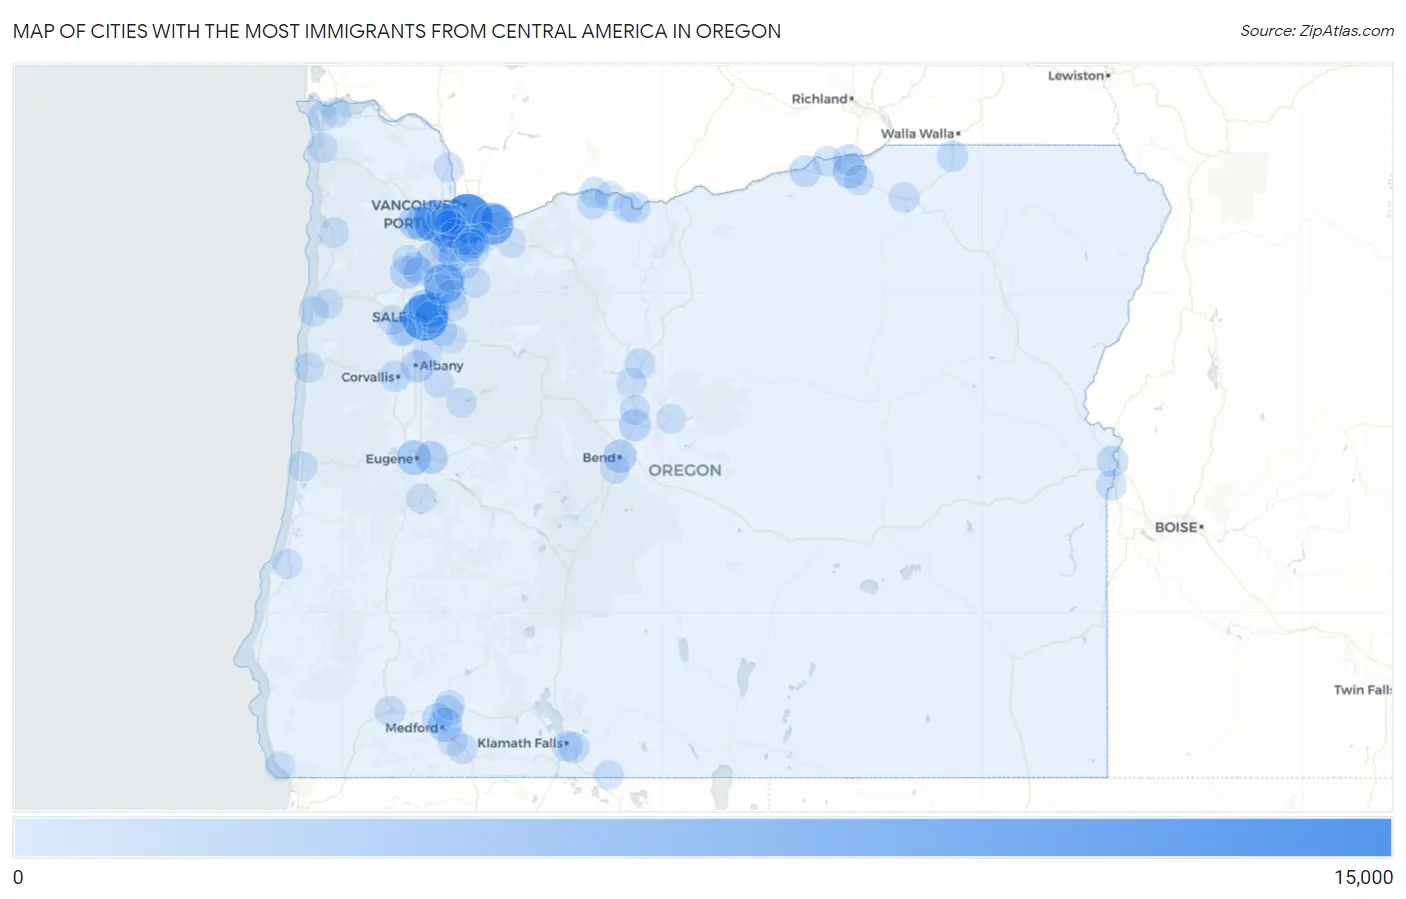
Map of Cities with the Most Immigrants from Central America in Oregon
0
15,000
Cities with the Most Immigrants from Central America in Oregon
| City | Central America | vs State | vs National | |
| 1. | Portland | 13,615 | 155,503(8.76%)#1 | 14,469,050(0.09%)#135 |
| 2. | Salem | 11,348 | 155,503(7.30%)#2 | 14,469,050(0.08%)#170 |
| 3. | Hillsboro | 8,515 | 155,503(5.48%)#3 | 14,469,050(0.06%)#240 |
| 4. | Gresham | 8,226 | 155,503(5.29%)#4 | 14,469,050(0.06%)#252 |
| 5. | Woodburn | 6,948 | 155,503(4.47%)#5 | 14,469,050(0.05%)#301 |
| 6. | Aloha | 4,820 | 155,503(3.10%)#6 | 14,469,050(0.03%)#444 |
| 7. | Beaverton | 4,727 | 155,503(3.04%)#7 | 14,469,050(0.03%)#451 |
| 8. | Hayesville | 4,113 | 155,503(2.64%)#8 | 14,469,050(0.03%)#517 |
| 9. | Cornelius | 3,187 | 155,503(2.05%)#9 | 14,469,050(0.02%)#654 |
| 10. | Eugene | 3,011 | 155,503(1.94%)#10 | 14,469,050(0.02%)#693 |
| 11. | Hermiston | 2,986 | 155,503(1.92%)#11 | 14,469,050(0.02%)#700 |
| 12. | Medford | 2,869 | 155,503(1.84%)#12 | 14,469,050(0.02%)#727 |
| 13. | Forest Grove | 2,516 | 155,503(1.62%)#13 | 14,469,050(0.02%)#800 |
| 14. | Keizer | 2,489 | 155,503(1.60%)#14 | 14,469,050(0.02%)#808 |
| 15. | Bend | 2,336 | 155,503(1.50%)#15 | 14,469,050(0.02%)#849 |
| 16. | Four Corners | 2,334 | 155,503(1.50%)#16 | 14,469,050(0.02%)#853 |
| 17. | Springfield | 2,115 | 155,503(1.36%)#17 | 14,469,050(0.01%)#909 |
| 18. | Mcminnville | 1,870 | 155,503(1.20%)#18 | 14,469,050(0.01%)#1,014 |
| 19. | Albany | 1,716 | 155,503(1.10%)#19 | 14,469,050(0.01%)#1,072 |
| 20. | Tualatin | 1,679 | 155,503(1.08%)#20 | 14,469,050(0.01%)#1,093 |
| 21. | Redmond | 1,558 | 155,503(1.00%)#21 | 14,469,050(0.01%)#1,154 |
| 22. | Newberg | 1,342 | 155,503(0.86%)#22 | 14,469,050(0.01%)#1,280 |
| 23. | White City | 1,203 | 155,503(0.77%)#23 | 14,469,050(0.01%)#1,380 |
| 24. | Boardman | 1,194 | 155,503(0.77%)#24 | 14,469,050(0.01%)#1,383 |
| 25. | Tigard | 1,183 | 155,503(0.76%)#25 | 14,469,050(0.01%)#1,397 |
| 26. | Canby | 1,166 | 155,503(0.75%)#26 | 14,469,050(0.01%)#1,416 |
| 27. | Ontario | 1,108 | 155,503(0.71%)#27 | 14,469,050(0.01%)#1,466 |
| 28. | Wood Village | 1,074 | 155,503(0.69%)#28 | 14,469,050(0.01%)#1,503 |
| 29. | Umatilla | 1,022 | 155,503(0.66%)#29 | 14,469,050(0.01%)#1,557 |
| 30. | The Dalles | 963 | 155,503(0.62%)#30 | 14,469,050(0.01%)#1,621 |
| 31. | Milton Freewater | 902 | 155,503(0.58%)#31 | 14,469,050(0.01%)#1,714 |
| 32. | Independence | 894 | 155,503(0.57%)#32 | 14,469,050(0.01%)#1,719 |
| 33. | Central Point | 839 | 155,503(0.54%)#33 | 14,469,050(0.01%)#1,791 |
| 34. | Altamont | 823 | 155,503(0.53%)#34 | 14,469,050(0.01%)#1,809 |
| 35. | Corvallis | 822 | 155,503(0.53%)#35 | 14,469,050(0.01%)#1,810 |
| 36. | Madras | 782 | 155,503(0.50%)#36 | 14,469,050(0.01%)#1,871 |
| 37. | Troutdale | 744 | 155,503(0.48%)#37 | 14,469,050(0.01%)#1,933 |
| 38. | Hood River | 725 | 155,503(0.47%)#38 | 14,469,050(0.01%)#1,966 |
| 39. | Oak Grove | 695 | 155,503(0.45%)#39 | 14,469,050(0.00%)#2,028 |
| 40. | Wilsonville | 690 | 155,503(0.44%)#40 | 14,469,050(0.00%)#2,038 |
| 41. | Odell | 665 | 155,503(0.43%)#41 | 14,469,050(0.00%)#2,085 |
| 42. | Klamath Falls | 654 | 155,503(0.42%)#42 | 14,469,050(0.00%)#2,102 |
| 43. | Cedar Hills | 652 | 155,503(0.42%)#43 | 14,469,050(0.00%)#2,109 |
| 44. | Nyssa | 574 | 155,503(0.37%)#44 | 14,469,050(0.00%)#2,295 |
| 45. | Gervais | 564 | 155,503(0.36%)#45 | 14,469,050(0.00%)#2,328 |
| 46. | Grants Pass | 558 | 155,503(0.36%)#46 | 14,469,050(0.00%)#2,341 |
| 47. | Tillamook | 508 | 155,503(0.33%)#47 | 14,469,050(0.00%)#2,465 |
| 48. | Lebanon | 498 | 155,503(0.32%)#48 | 14,469,050(0.00%)#2,496 |
| 49. | Newport | 497 | 155,503(0.32%)#49 | 14,469,050(0.00%)#2,500 |
| 50. | Oatfield | 439 | 155,503(0.28%)#50 | 14,469,050(0.00%)#2,705 |
| 51. | Lincoln City | 430 | 155,503(0.28%)#51 | 14,469,050(0.00%)#2,734 |
| 52. | Pendleton | 417 | 155,503(0.27%)#52 | 14,469,050(0.00%)#2,781 |
| 53. | Lafayette | 415 | 155,503(0.27%)#53 | 14,469,050(0.00%)#2,791 |
| 54. | Mount Angel | 395 | 155,503(0.25%)#54 | 14,469,050(0.00%)#2,882 |
| 55. | Stayton | 393 | 155,503(0.25%)#55 | 14,469,050(0.00%)#2,888 |
| 56. | Dayton | 391 | 155,503(0.25%)#56 | 14,469,050(0.00%)#2,904 |
| 57. | Molalla | 390 | 155,503(0.25%)#57 | 14,469,050(0.00%)#2,905 |
| 58. | Hubbard | 382 | 155,503(0.25%)#58 | 14,469,050(0.00%)#2,937 |
| 59. | Monmouth | 368 | 155,503(0.24%)#59 | 14,469,050(0.00%)#3,000 |
| 60. | Seaside | 346 | 155,503(0.22%)#60 | 14,469,050(0.00%)#3,101 |
| 61. | Sherwood | 343 | 155,503(0.22%)#61 | 14,469,050(0.00%)#3,112 |
| 62. | Stanfield | 342 | 155,503(0.22%)#62 | 14,469,050(0.00%)#3,121 |
| 63. | Ashland | 339 | 155,503(0.22%)#63 | 14,469,050(0.00%)#3,135 |
| 64. | Cedar Mill | 338 | 155,503(0.22%)#64 | 14,469,050(0.00%)#3,141 |
| 65. | Jefferson | 330 | 155,503(0.21%)#65 | 14,469,050(0.00%)#3,187 |
| 66. | Gladstone | 329 | 155,503(0.21%)#66 | 14,469,050(0.00%)#3,191 |
| 67. | Coos Bay | 327 | 155,503(0.21%)#67 | 14,469,050(0.00%)#3,199 |
| 68. | St Helens | 310 | 155,503(0.20%)#68 | 14,469,050(0.00%)#3,284 |
| 69. | Lake Oswego | 302 | 155,503(0.19%)#69 | 14,469,050(0.00%)#3,331 |
| 70. | Culver | 296 | 155,503(0.19%)#70 | 14,469,050(0.00%)#3,374 |
| 71. | Eagle Point | 288 | 155,503(0.19%)#71 | 14,469,050(0.00%)#3,423 |
| 72. | Dallas | 284 | 155,503(0.18%)#72 | 14,469,050(0.00%)#3,446 |
| 73. | Sandy | 268 | 155,503(0.17%)#73 | 14,469,050(0.00%)#3,584 |
| 74. | Oregon City | 263 | 155,503(0.17%)#74 | 14,469,050(0.00%)#3,614 |
| 75. | Cottage Grove | 253 | 155,503(0.16%)#75 | 14,469,050(0.00%)#3,682 |
| 76. | Irrigon | 249 | 155,503(0.16%)#76 | 14,469,050(0.00%)#3,715 |
| 77. | Deschutes River Woods | 239 | 155,503(0.15%)#77 | 14,469,050(0.00%)#3,792 |
| 78. | Florence | 219 | 155,503(0.14%)#78 | 14,469,050(0.00%)#3,941 |
| 79. | Rose Lodge | 219 | 155,503(0.14%)#79 | 14,469,050(0.00%)#3,945 |
| 80. | Prineville | 205 | 155,503(0.13%)#80 | 14,469,050(0.00%)#4,074 |
| 81. | Malin | 202 | 155,503(0.13%)#81 | 14,469,050(0.00%)#4,111 |
| 82. | Oak Hills | 196 | 155,503(0.13%)#82 | 14,469,050(0.00%)#4,183 |
| 83. | Marlene | 193 | 155,503(0.12%)#83 | 14,469,050(0.00%)#4,223 |
| 84. | Astoria | 191 | 155,503(0.12%)#84 | 14,469,050(0.00%)#4,245 |
| 85. | Metzger | 191 | 155,503(0.12%)#85 | 14,469,050(0.00%)#4,251 |
| 86. | River Road | 190 | 155,503(0.12%)#86 | 14,469,050(0.00%)#4,259 |
| 87. | Jennings Lodge | 188 | 155,503(0.12%)#87 | 14,469,050(0.00%)#4,287 |
| 88. | Happy Valley | 187 | 155,503(0.12%)#88 | 14,469,050(0.00%)#4,299 |
| 89. | Brookings | 180 | 155,503(0.12%)#89 | 14,469,050(0.00%)#4,384 |
| 90. | Warrenton | 176 | 155,503(0.11%)#90 | 14,469,050(0.00%)#4,455 |
| 91. | Carlton | 175 | 155,503(0.11%)#91 | 14,469,050(0.00%)#4,476 |
| 92. | West Linn | 173 | 155,503(0.11%)#92 | 14,469,050(0.00%)#4,492 |
| 93. | Sweet Home | 168 | 155,503(0.11%)#93 | 14,469,050(0.00%)#4,559 |
| 94. | Mosier | 162 | 155,503(0.10%)#94 | 14,469,050(0.00%)#4,656 |
| 95. | Rockcreek | 158 | 155,503(0.10%)#95 | 14,469,050(0.00%)#4,696 |
| 96. | Talent | 155 | 155,503(0.10%)#96 | 14,469,050(0.00%)#4,743 |
| 97. | Aumsville | 153 | 155,503(0.10%)#97 | 14,469,050(0.00%)#4,777 |
| 98. | Silverton | 144 | 155,503(0.09%)#98 | 14,469,050(0.00%)#4,901 |
| 99. | Chenoweth | 142 | 155,503(0.09%)#99 | 14,469,050(0.00%)#4,931 |
| 100. | Terrebonne | 139 | 155,503(0.09%)#100 | 14,469,050(0.00%)#4,980 |
Common Questions
What are the Top 10 Cities with the Most Immigrants from Central America in Oregon?
Top 10 Cities with the Most Immigrants from Central America in Oregon are:
What city has the Most Immigrants from Central America in Oregon?
Portland has the Most Immigrants from Central America in Oregon with 13,615.
What is the Total Immigrants from Central America in the State of Oregon?
Total Immigrants from Central America in Oregon is 155,503.
What is the Total Immigrants from Central America in the United States?
Total Immigrants from Central America in the United States is 14,469,050.