Cities with the Most Immigrants from Central America in Connecticut
RELATED REPORTS & OPTIONS
Central America
Connecticut
Compare Cities
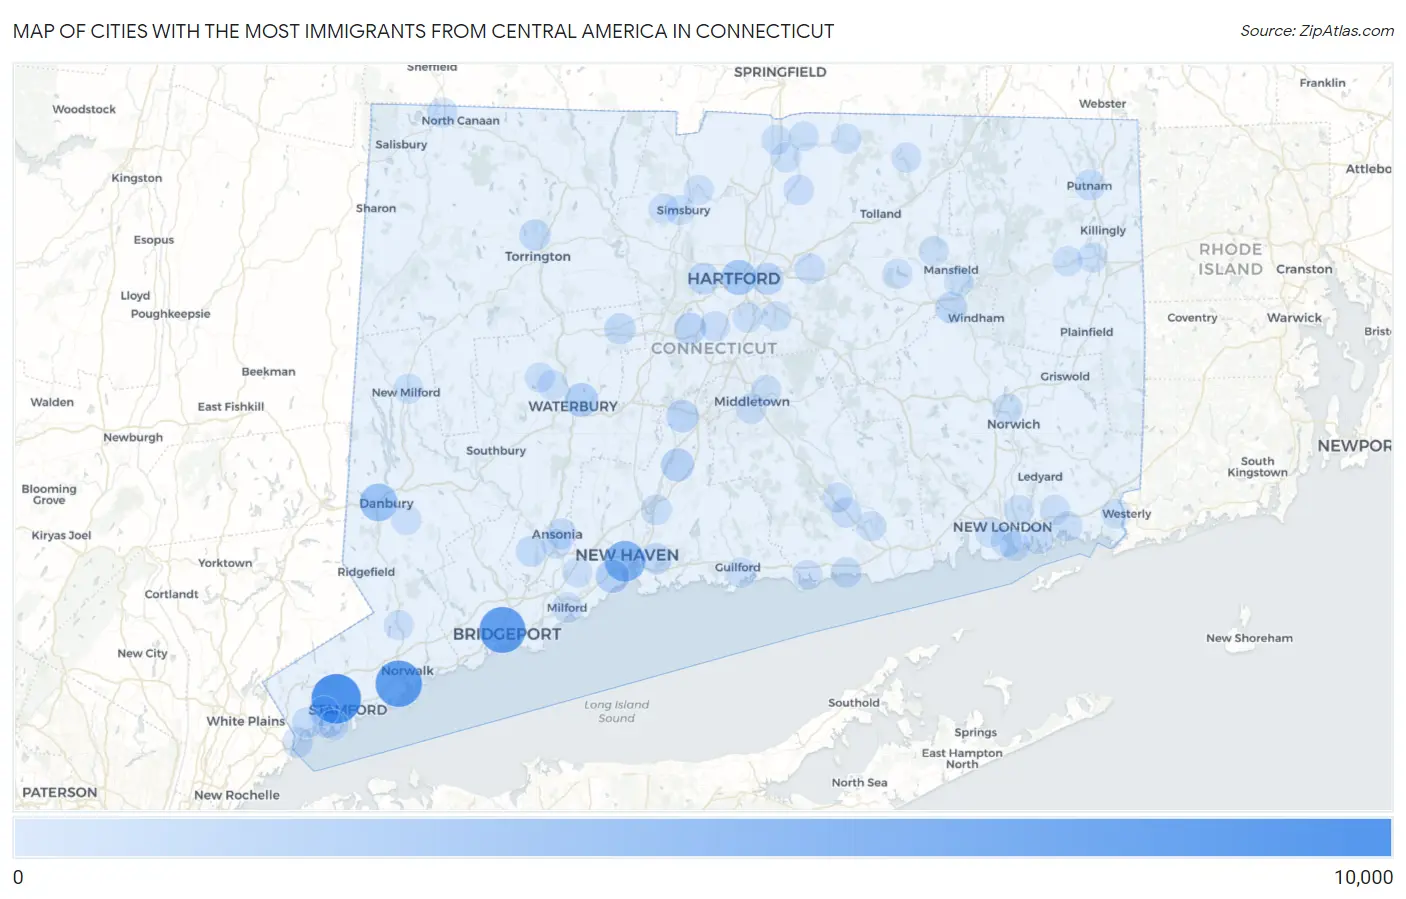
Map of Cities with the Most Immigrants from Central America in Connecticut
0
10,000
Cities with the Most Immigrants from Central America in Connecticut
| City | Central America | vs State | vs National | |
| 1. | Stamford | 9,897 | 62,033(15.95%)#1 | 14,469,050(0.07%)#198 |
| 2. | Norwalk | 8,283 | 62,033(13.35%)#2 | 14,469,050(0.06%)#249 |
| 3. | Bridgeport | 8,073 | 62,033(13.01%)#3 | 14,469,050(0.06%)#257 |
| 4. | New Haven | 5,321 | 62,033(8.58%)#4 | 14,469,050(0.04%)#407 |
| 5. | Danbury | 3,696 | 62,033(5.96%)#5 | 14,469,050(0.03%)#572 |
| 6. | Hartford | 2,472 | 62,033(3.98%)#6 | 14,469,050(0.02%)#814 |
| 7. | Waterbury | 1,808 | 62,033(2.91%)#7 | 14,469,050(0.01%)#1,033 |
| 8. | West Haven | 1,691 | 62,033(2.73%)#8 | 14,469,050(0.01%)#1,086 |
| 9. | Wallingford Center | 1,504 | 62,033(2.42%)#9 | 14,469,050(0.01%)#1,182 |
| 10. | Meriden | 1,184 | 62,033(1.91%)#10 | 14,469,050(0.01%)#1,394 |
| 11. | East Hartford | 975 | 62,033(1.57%)#11 | 14,469,050(0.01%)#1,609 |
| 12. | New Britain | 952 | 62,033(1.53%)#12 | 14,469,050(0.01%)#1,637 |
| 13. | West Hartford | 816 | 62,033(1.32%)#13 | 14,469,050(0.01%)#1,816 |
| 14. | Willimantic | 765 | 62,033(1.23%)#14 | 14,469,050(0.01%)#1,897 |
| 15. | Torrington | 660 | 62,033(1.06%)#15 | 14,469,050(0.00%)#2,091 |
| 16. | East Haven | 643 | 62,033(1.04%)#16 | 14,469,050(0.00%)#2,125 |
| 17. | Bristol | 603 | 62,033(0.97%)#17 | 14,469,050(0.00%)#2,228 |
| 18. | New London | 512 | 62,033(0.83%)#18 | 14,469,050(0.00%)#2,451 |
| 19. | Shelton | 415 | 62,033(0.67%)#19 | 14,469,050(0.00%)#2,790 |
| 20. | Putnam | 406 | 62,033(0.65%)#20 | 14,469,050(0.00%)#2,834 |
| 21. | Naugatuck Borough | 382 | 62,033(0.62%)#21 | 14,469,050(0.00%)#2,933 |
| 22. | Ansonia | 372 | 62,033(0.60%)#22 | 14,469,050(0.00%)#2,986 |
| 23. | Byram | 366 | 62,033(0.59%)#23 | 14,469,050(0.00%)#3,007 |
| 24. | Riverside | 359 | 62,033(0.58%)#24 | 14,469,050(0.00%)#3,037 |
| 25. | Greenwich | 333 | 62,033(0.54%)#25 | 14,469,050(0.00%)#3,164 |
| 26. | Westbrook Center | 279 | 62,033(0.45%)#26 | 14,469,050(0.00%)#3,491 |
| 27. | North Haven | 249 | 62,033(0.40%)#27 | 14,469,050(0.00%)#3,707 |
| 28. | Manchester | 197 | 62,033(0.32%)#28 | 14,469,050(0.00%)#4,161 |
| 29. | Middletown | 192 | 62,033(0.31%)#29 | 14,469,050(0.00%)#4,226 |
| 30. | Poquonock Bridge | 181 | 62,033(0.29%)#30 | 14,469,050(0.00%)#4,376 |
| 31. | Broad Brook | 173 | 62,033(0.28%)#31 | 14,469,050(0.00%)#4,503 |
| 32. | Milford City Balance | 165 | 62,033(0.27%)#32 | 14,469,050(0.00%)#4,605 |
| 33. | Canaan | 147 | 62,033(0.24%)#33 | 14,469,050(0.00%)#4,864 |
| 34. | Danielson Borough | 124 | 62,033(0.20%)#34 | 14,469,050(0.00%)#5,208 |
| 35. | Newington | 116 | 62,033(0.19%)#35 | 14,469,050(0.00%)#5,361 |
| 36. | Norwich | 111 | 62,033(0.18%)#36 | 14,469,050(0.00%)#5,469 |
| 37. | Deep River Center | 110 | 62,033(0.18%)#37 | 14,469,050(0.00%)#5,505 |
| 38. | Oakville | 108 | 62,033(0.17%)#38 | 14,469,050(0.00%)#5,530 |
| 39. | Wethersfield | 70 | 62,033(0.11%)#39 | 14,469,050(0.00%)#6,562 |
| 40. | Cos Cob | 68 | 62,033(0.11%)#40 | 14,469,050(0.00%)#6,635 |
| 41. | Glastonbury Center | 67 | 62,033(0.11%)#41 | 14,469,050(0.00%)#6,660 |
| 42. | Compo | 65 | 62,033(0.10%)#42 | 14,469,050(0.00%)#6,758 |
| 43. | Storrs | 61 | 62,033(0.10%)#43 | 14,469,050(0.00%)#6,901 |
| 44. | Bethel | 58 | 62,033(0.09%)#44 | 14,469,050(0.00%)#7,031 |
| 45. | Old Greenwich | 55 | 62,033(0.09%)#45 | 14,469,050(0.00%)#7,157 |
| 46. | New Milford | 44 | 62,033(0.07%)#46 | 14,469,050(0.00%)#7,755 |
| 47. | East Brooklyn | 44 | 62,033(0.07%)#47 | 14,469,050(0.00%)#7,777 |
| 48. | Greens Farms | 41 | 62,033(0.07%)#48 | 14,469,050(0.00%)#7,954 |
| 49. | West Simsbury | 36 | 62,033(0.06%)#49 | 14,469,050(0.00%)#8,259 |
| 50. | Lakes East | 35 | 62,033(0.06%)#50 | 14,469,050(0.00%)#8,341 |
| 51. | Portland | 33 | 62,033(0.05%)#51 | 14,469,050(0.00%)#8,445 |
| 52. | Coleytown | 33 | 62,033(0.05%)#52 | 14,469,050(0.00%)#8,454 |
| 53. | Brooklyn | 28 | 62,033(0.05%)#53 | 14,469,050(0.00%)#8,870 |
| 54. | Somers | 27 | 62,033(0.04%)#54 | 14,469,050(0.00%)#8,951 |
| 55. | Old Mystic | 24 | 62,033(0.04%)#55 | 14,469,050(0.00%)#9,218 |
| 56. | Southwood Acres | 23 | 62,033(0.04%)#56 | 14,469,050(0.00%)#9,316 |
| 57. | Essex Village | 23 | 62,033(0.04%)#57 | 14,469,050(0.00%)#9,347 |
| 58. | Coventry Lake | 23 | 62,033(0.04%)#58 | 14,469,050(0.00%)#9,356 |
| 59. | Sandy Hook | 20 | 62,033(0.03%)#59 | 14,469,050(0.00%)#9,672 |
| 60. | Groton | 20 | 62,033(0.03%)#60 | 14,469,050(0.00%)#9,673 |
| 61. | Trumbull Center | 17 | 62,033(0.03%)#61 | 14,469,050(0.00%)#10,071 |
| 62. | Wilton Center | 17 | 62,033(0.03%)#62 | 14,469,050(0.00%)#10,123 |
| 63. | Mansfield Center | 17 | 62,033(0.03%)#63 | 14,469,050(0.00%)#10,142 |
| 64. | Derby | 16 | 62,033(0.03%)#64 | 14,469,050(0.00%)#10,221 |
| 65. | Noroton | 16 | 62,033(0.03%)#65 | 14,469,050(0.00%)#10,243 |
| 66. | Tariffville | 16 | 62,033(0.03%)#66 | 14,469,050(0.00%)#10,289 |
| 67. | Botsford | 16 | 62,033(0.03%)#67 | 14,469,050(0.00%)#10,333 |
| 68. | Sail Harbor | 16 | 62,033(0.03%)#68 | 14,469,050(0.00%)#10,363 |
| 69. | Simsbury Center | 15 | 62,033(0.02%)#69 | 14,469,050(0.00%)#10,395 |
| 70. | Watertown | 15 | 62,033(0.02%)#70 | 14,469,050(0.00%)#10,408 |
| 71. | Saugatuck | 15 | 62,033(0.02%)#71 | 14,469,050(0.00%)#10,416 |
| 72. | Candlewood Shores | 15 | 62,033(0.02%)#72 | 14,469,050(0.00%)#10,471 |
| 73. | Thompsonville | 14 | 62,033(0.02%)#73 | 14,469,050(0.00%)#10,535 |
| 74. | Waterford | 14 | 62,033(0.02%)#74 | 14,469,050(0.00%)#10,564 |
| 75. | Conning Towers Nautilus Park | 13 | 62,033(0.02%)#75 | 14,469,050(0.00%)#10,689 |
| 76. | Northford | 13 | 62,033(0.02%)#76 | 14,469,050(0.00%)#10,700 |
| 77. | Oronoque | 13 | 62,033(0.02%)#77 | 14,469,050(0.00%)#10,710 |
| 78. | Hazardville | 12 | 62,033(0.02%)#78 | 14,469,050(0.00%)#10,893 |
| 79. | Orange | 11 | 62,033(0.02%)#79 | 14,469,050(0.00%)#11,072 |
| 80. | Daniels Farm | 11 | 62,033(0.02%)#80 | 14,469,050(0.00%)#11,092 |
| 81. | Stepney | 11 | 62,033(0.02%)#81 | 14,469,050(0.00%)#11,111 |
| 82. | Mystic | 10 | 62,033(0.02%)#82 | 14,469,050(0.00%)#11,283 |
| 83. | Guilford Center | 10 | 62,033(0.02%)#83 | 14,469,050(0.00%)#11,308 |
| 84. | Pawcatuck | 9 | 62,033(0.01%)#84 | 14,469,050(0.00%)#11,481 |
| 85. | Sacred Heart University | 8 | 62,033(0.01%)#85 | 14,469,050(0.00%)#11,797 |
| 86. | Stafford Springs | 7 | 62,033(0.01%)#86 | 14,469,050(0.00%)#11,963 |
| 87. | Fairfield University | 7 | 62,033(0.01%)#87 | 14,469,050(0.00%)#11,982 |
| 88. | Litchfield Borough | 7 | 62,033(0.01%)#88 | 14,469,050(0.00%)#12,051 |
| 89. | Quinnipiac University | 6 | 62,033(0.01%)#89 | 14,469,050(0.00%)#12,246 |
| 90. | Clinton | 4 | 62,033(0.01%)#90 | 14,469,050(0.00%)#12,836 |
| 91. | Stratford Downtown | 4 | 62,033(0.01%)#91 | 14,469,050(0.00%)#12,870 |
| 92. | Chester Center | 2 | 62,033(0.00%)#92 | 14,469,050(0.00%)#13,590 |
1
2Common Questions
What are the Top 10 Cities with the Most Immigrants from Central America in Connecticut?
Top 10 Cities with the Most Immigrants from Central America in Connecticut are:
#1
9,897
#2
8,283
#3
8,073
#4
5,321
#5
3,696
#6
2,472
#7
1,808
#8
1,691
#9
1,504
#10
1,184
What city has the Most Immigrants from Central America in Connecticut?
Stamford has the Most Immigrants from Central America in Connecticut with 9,897.
What is the Total Immigrants from Central America in the State of Connecticut?
Total Immigrants from Central America in Connecticut is 62,033.
What is the Total Immigrants from Central America in the United States?
Total Immigrants from Central America in the United States is 14,469,050.