Cities with the Most Immigrants from Central America in Tennessee
RELATED REPORTS & OPTIONS
Central America
Tennessee
Compare Cities
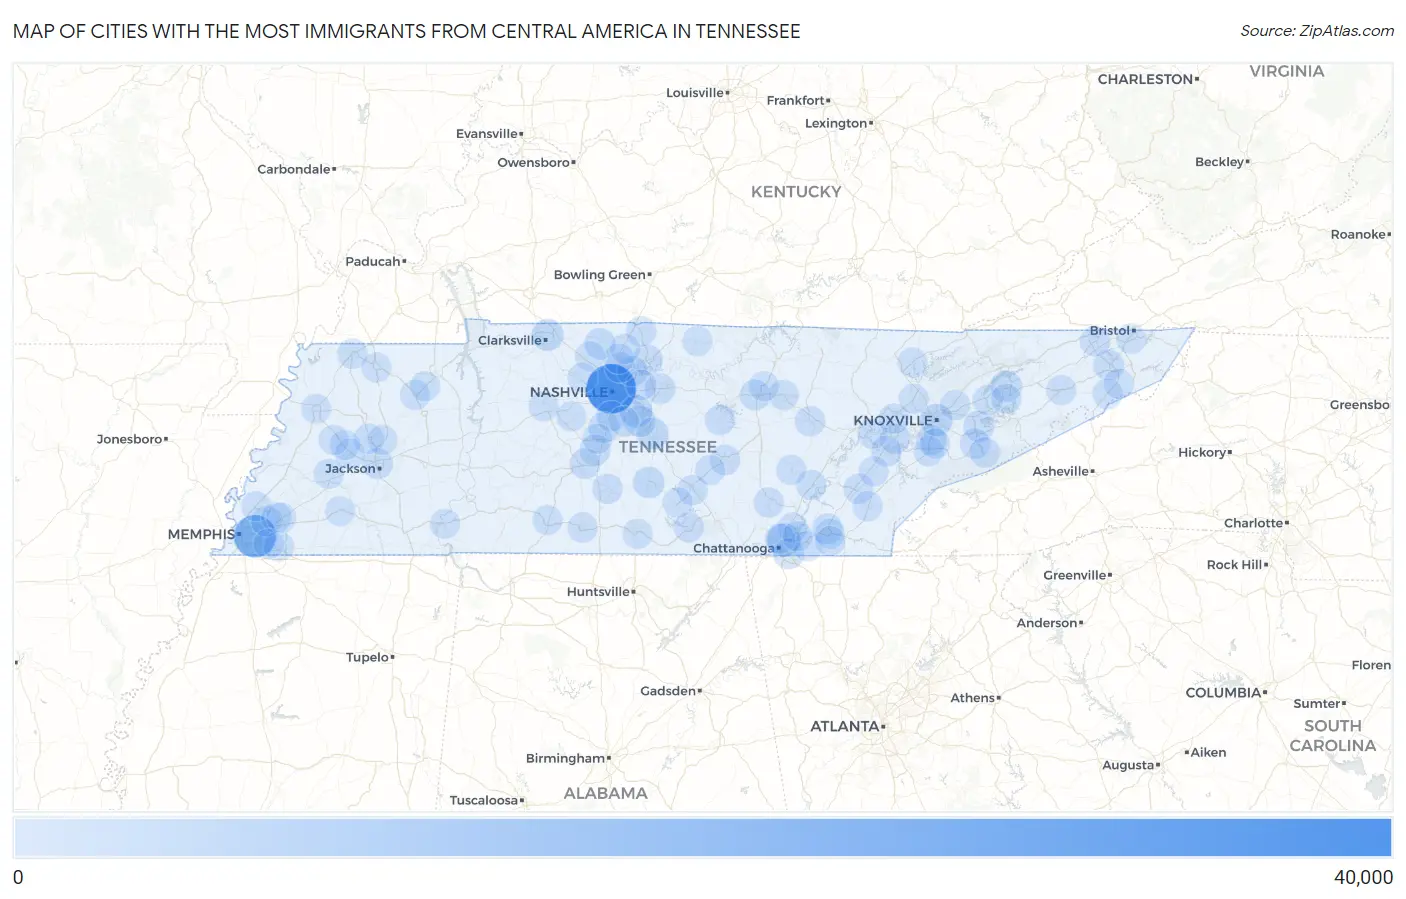
Map of Cities with the Most Immigrants from Central America in Tennessee
0
40,000
Cities with the Most Immigrants from Central America in Tennessee
| City | Central America | vs State | vs National | |
| 1. | Nashville | 33,104 | 138,763(23.86%)#1 | 14,469,050(0.23%)#49 |
| 2. | Memphis | 20,444 | 138,763(14.73%)#2 | 14,469,050(0.14%)#81 |
| 3. | Chattanooga | 5,627 | 138,763(4.06%)#3 | 14,469,050(0.04%)#378 |
| 4. | Knoxville | 3,943 | 138,763(2.84%)#4 | 14,469,050(0.03%)#540 |
| 5. | La Vergne | 3,275 | 138,763(2.36%)#5 | 14,469,050(0.02%)#638 |
| 6. | Clarksville | 3,015 | 138,763(2.17%)#6 | 14,469,050(0.02%)#692 |
| 7. | Murfreesboro | 2,876 | 138,763(2.07%)#7 | 14,469,050(0.02%)#725 |
| 8. | Smyrna | 2,446 | 138,763(1.76%)#8 | 14,469,050(0.02%)#821 |
| 9. | Morristown | 2,410 | 138,763(1.74%)#9 | 14,469,050(0.02%)#829 |
| 10. | Shelbyville | 2,255 | 138,763(1.63%)#10 | 14,469,050(0.02%)#875 |
| 11. | Springfield | 1,761 | 138,763(1.27%)#11 | 14,469,050(0.01%)#1,051 |
| 12. | Franklin | 1,507 | 138,763(1.09%)#12 | 14,469,050(0.01%)#1,181 |
| 13. | Sevierville | 1,345 | 138,763(0.97%)#13 | 14,469,050(0.01%)#1,278 |
| 14. | Cookeville | 1,220 | 138,763(0.88%)#14 | 14,469,050(0.01%)#1,361 |
| 15. | East Ridge | 1,190 | 138,763(0.86%)#15 | 14,469,050(0.01%)#1,389 |
| 16. | Johnson City | 1,154 | 138,763(0.83%)#16 | 14,469,050(0.01%)#1,427 |
| 17. | Jackson | 1,132 | 138,763(0.82%)#17 | 14,469,050(0.01%)#1,450 |
| 18. | Spring Hill | 1,112 | 138,763(0.80%)#18 | 14,469,050(0.01%)#1,464 |
| 19. | Gallatin | 1,112 | 138,763(0.80%)#19 | 14,469,050(0.01%)#1,465 |
| 20. | Lebanon | 1,008 | 138,763(0.73%)#20 | 14,469,050(0.01%)#1,572 |
| 21. | Columbia | 938 | 138,763(0.68%)#21 | 14,469,050(0.01%)#1,662 |
| 22. | Cleveland | 891 | 138,763(0.64%)#22 | 14,469,050(0.01%)#1,722 |
| 23. | Hendersonville | 888 | 138,763(0.64%)#23 | 14,469,050(0.01%)#1,725 |
| 24. | Mount Juliet | 756 | 138,763(0.54%)#24 | 14,469,050(0.01%)#1,908 |
| 25. | Pigeon Forge | 706 | 138,763(0.51%)#25 | 14,469,050(0.00%)#2,004 |
| 26. | Lenoir City | 659 | 138,763(0.47%)#26 | 14,469,050(0.00%)#2,096 |
| 27. | Mcminnville | 631 | 138,763(0.45%)#27 | 14,469,050(0.00%)#2,155 |
| 28. | Loudon | 623 | 138,763(0.45%)#28 | 14,469,050(0.00%)#2,175 |
| 29. | Oak Ridge | 605 | 138,763(0.44%)#29 | 14,469,050(0.00%)#2,220 |
| 30. | Alcoa | 539 | 138,763(0.39%)#30 | 14,469,050(0.00%)#2,389 |
| 31. | Smithville | 522 | 138,763(0.38%)#31 | 14,469,050(0.00%)#2,430 |
| 32. | Bartlett | 518 | 138,763(0.37%)#32 | 14,469,050(0.00%)#2,436 |
| 33. | Athens | 516 | 138,763(0.37%)#33 | 14,469,050(0.00%)#2,442 |
| 34. | Lewisburg | 513 | 138,763(0.37%)#34 | 14,469,050(0.00%)#2,450 |
| 35. | Manchester | 512 | 138,763(0.37%)#35 | 14,469,050(0.00%)#2,452 |
| 36. | Crossville | 491 | 138,763(0.35%)#36 | 14,469,050(0.00%)#2,523 |
| 37. | Goodlettsville | 488 | 138,763(0.35%)#37 | 14,469,050(0.00%)#2,528 |
| 38. | Brentwood | 445 | 138,763(0.32%)#38 | 14,469,050(0.00%)#2,683 |
| 39. | Union City | 440 | 138,763(0.32%)#39 | 14,469,050(0.00%)#2,702 |
| 40. | Collierville | 388 | 138,763(0.28%)#40 | 14,469,050(0.00%)#2,912 |
| 41. | Portland | 385 | 138,763(0.28%)#41 | 14,469,050(0.00%)#2,924 |
| 42. | Humboldt | 359 | 138,763(0.26%)#42 | 14,469,050(0.00%)#3,038 |
| 43. | Kingsport | 347 | 138,763(0.25%)#43 | 14,469,050(0.00%)#3,093 |
| 44. | Dunlap | 333 | 138,763(0.24%)#44 | 14,469,050(0.00%)#3,167 |
| 45. | Dayton | 319 | 138,763(0.23%)#45 | 14,469,050(0.00%)#3,243 |
| 46. | Winchester | 309 | 138,763(0.22%)#46 | 14,469,050(0.00%)#3,291 |
| 47. | Gatlinburg | 301 | 138,763(0.22%)#47 | 14,469,050(0.00%)#3,339 |
| 48. | Maryville | 288 | 138,763(0.21%)#48 | 14,469,050(0.00%)#3,421 |
| 49. | Nolensville | 284 | 138,763(0.20%)#49 | 14,469,050(0.00%)#3,448 |
| 50. | Jefferson City | 270 | 138,763(0.19%)#50 | 14,469,050(0.00%)#3,558 |
| 51. | Bells | 264 | 138,763(0.19%)#51 | 14,469,050(0.00%)#3,610 |
| 52. | Mascot | 253 | 138,763(0.18%)#52 | 14,469,050(0.00%)#3,684 |
| 53. | Monterey | 244 | 138,763(0.18%)#53 | 14,469,050(0.00%)#3,758 |
| 54. | Millersville | 232 | 138,763(0.17%)#54 | 14,469,050(0.00%)#3,845 |
| 55. | Millington | 224 | 138,763(0.16%)#55 | 14,469,050(0.00%)#3,896 |
| 56. | Tullahoma | 217 | 138,763(0.16%)#56 | 14,469,050(0.00%)#3,957 |
| 57. | White House | 216 | 138,763(0.16%)#57 | 14,469,050(0.00%)#3,964 |
| 58. | Greeneville | 212 | 138,763(0.15%)#58 | 14,469,050(0.00%)#3,989 |
| 59. | Alamo | 198 | 138,763(0.14%)#59 | 14,469,050(0.00%)#4,158 |
| 60. | Middle Valley | 186 | 138,763(0.13%)#60 | 14,469,050(0.00%)#4,312 |
| 61. | Lakeland | 179 | 138,763(0.13%)#61 | 14,469,050(0.00%)#4,399 |
| 62. | Powell | 176 | 138,763(0.13%)#62 | 14,469,050(0.00%)#4,453 |
| 63. | Dyersburg | 173 | 138,763(0.12%)#63 | 14,469,050(0.00%)#4,495 |
| 64. | Erwin | 173 | 138,763(0.12%)#64 | 14,469,050(0.00%)#4,500 |
| 65. | Lawrenceburg | 171 | 138,763(0.12%)#65 | 14,469,050(0.00%)#4,522 |
| 66. | Bristol | 170 | 138,763(0.12%)#66 | 14,469,050(0.00%)#4,534 |
| 67. | Brownsville | 170 | 138,763(0.12%)#67 | 14,469,050(0.00%)#4,538 |
| 68. | Germantown | 166 | 138,763(0.12%)#68 | 14,469,050(0.00%)#4,581 |
| 69. | Etowah | 161 | 138,763(0.12%)#69 | 14,469,050(0.00%)#4,668 |
| 70. | Dickson | 159 | 138,763(0.11%)#70 | 14,469,050(0.00%)#4,680 |
| 71. | Collegedale | 151 | 138,763(0.11%)#71 | 14,469,050(0.00%)#4,798 |
| 72. | Fairview | 150 | 138,763(0.11%)#72 | 14,469,050(0.00%)#4,810 |
| 73. | Maury City | 136 | 138,763(0.10%)#73 | 14,469,050(0.00%)#5,020 |
| 74. | Eagleton Village | 132 | 138,763(0.10%)#74 | 14,469,050(0.00%)#5,069 |
| 75. | Pikeville | 127 | 138,763(0.09%)#75 | 14,469,050(0.00%)#5,150 |
| 76. | Unicoi | 126 | 138,763(0.09%)#76 | 14,469,050(0.00%)#5,168 |
| 77. | Martin | 124 | 138,763(0.09%)#77 | 14,469,050(0.00%)#5,201 |
| 78. | Medina | 121 | 138,763(0.09%)#78 | 14,469,050(0.00%)#5,264 |
| 79. | Red Bank | 116 | 138,763(0.08%)#79 | 14,469,050(0.00%)#5,366 |
| 80. | White Pine | 111 | 138,763(0.08%)#80 | 14,469,050(0.00%)#5,484 |
| 81. | Algood | 110 | 138,763(0.08%)#81 | 14,469,050(0.00%)#5,501 |
| 82. | Mckenzie | 108 | 138,763(0.08%)#82 | 14,469,050(0.00%)#5,532 |
| 83. | Clinton | 107 | 138,763(0.08%)#83 | 14,469,050(0.00%)#5,554 |
| 84. | Coopertown | 91 | 138,763(0.07%)#84 | 14,469,050(0.00%)#5,955 |
| 85. | La Follette | 89 | 138,763(0.06%)#85 | 14,469,050(0.00%)#6,009 |
| 86. | Thompson S Station | 88 | 138,763(0.06%)#86 | 14,469,050(0.00%)#6,039 |
| 87. | Ashland City | 88 | 138,763(0.06%)#87 | 14,469,050(0.00%)#6,043 |
| 88. | Pulaski | 84 | 138,763(0.06%)#88 | 14,469,050(0.00%)#6,137 |
| 89. | Sweetwater | 84 | 138,763(0.06%)#89 | 14,469,050(0.00%)#6,148 |
| 90. | Fayetteville | 80 | 138,763(0.06%)#90 | 14,469,050(0.00%)#6,273 |
| 91. | Whiteville | 80 | 138,763(0.06%)#91 | 14,469,050(0.00%)#6,276 |
| 92. | Lafayette | 77 | 138,763(0.06%)#92 | 14,469,050(0.00%)#6,355 |
| 93. | Morrison | 76 | 138,763(0.05%)#93 | 14,469,050(0.00%)#6,391 |
| 94. | East Cleveland | 75 | 138,763(0.05%)#94 | 14,469,050(0.00%)#6,412 |
| 95. | Savannah | 69 | 138,763(0.05%)#95 | 14,469,050(0.00%)#6,605 |
| 96. | Henry | 68 | 138,763(0.05%)#96 | 14,469,050(0.00%)#6,651 |
| 97. | Arlington | 66 | 138,763(0.05%)#97 | 14,469,050(0.00%)#6,698 |
| 98. | Wildwood Lake | 66 | 138,763(0.05%)#98 | 14,469,050(0.00%)#6,707 |
| 99. | Harrison | 63 | 138,763(0.05%)#99 | 14,469,050(0.00%)#6,827 |
| 100. | Kingston | 63 | 138,763(0.05%)#100 | 14,469,050(0.00%)#6,831 |
Common Questions
What are the Top 10 Cities with the Most Immigrants from Central America in Tennessee?
Top 10 Cities with the Most Immigrants from Central America in Tennessee are:
#1
33,104
#2
20,444
#3
5,627
#4
3,943
#5
3,275
#6
3,015
#7
2,876
#8
2,446
#9
2,410
#10
2,255
What city has the Most Immigrants from Central America in Tennessee?
Nashville has the Most Immigrants from Central America in Tennessee with 33,104.
What is the Total Immigrants from Central America in the State of Tennessee?
Total Immigrants from Central America in Tennessee is 138,763.
What is the Total Immigrants from Central America in the United States?
Total Immigrants from Central America in the United States is 14,469,050.