Cities with the Most Immigrants from Central America in Florida
RELATED REPORTS & OPTIONS
Central America
Florida
Compare Cities
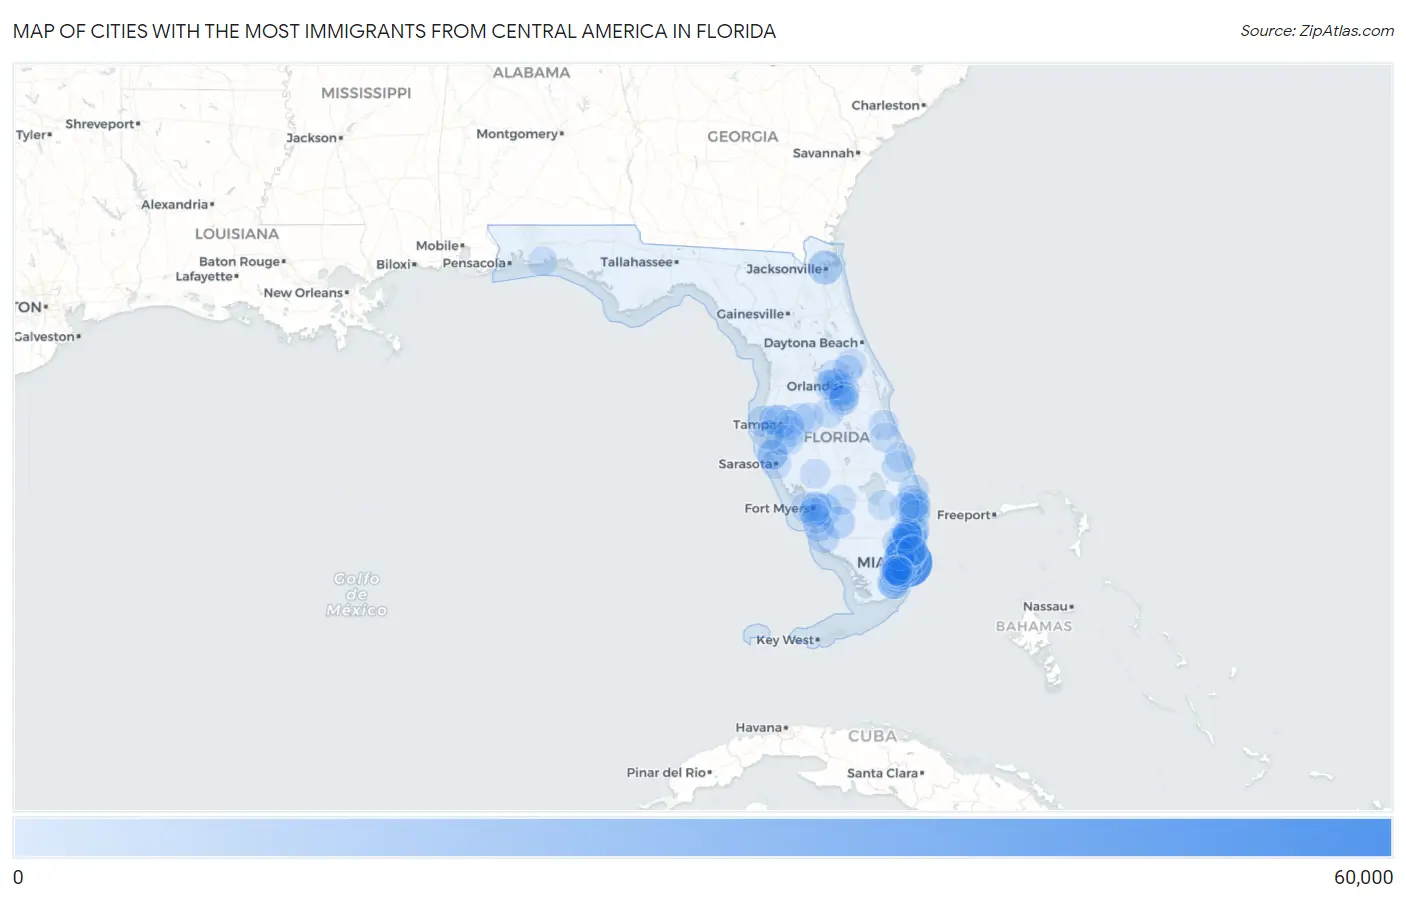
Map of Cities with the Most Immigrants from Central America in Florida
0
60,000
Cities with the Most Immigrants from Central America in Florida
| City | Central America | vs State | vs National | |
| 1. | Miami | 58,816 | 660,755(8.90%)#1 | 14,469,050(0.41%)#18 |
| 2. | Hialeah | 13,352 | 660,755(2.02%)#2 | 14,469,050(0.09%)#138 |
| 3. | Jacksonville | 13,184 | 660,755(2.00%)#3 | 14,469,050(0.09%)#140 |
| 4. | Homestead | 11,061 | 660,755(1.67%)#4 | 14,469,050(0.08%)#176 |
| 5. | Tampa | 9,376 | 660,755(1.42%)#5 | 14,469,050(0.06%)#216 |
| 6. | Lake Worth Beach | 8,856 | 660,755(1.34%)#6 | 14,469,050(0.06%)#229 |
| 7. | Fort Lauderdale | 8,003 | 660,755(1.21%)#7 | 14,469,050(0.06%)#260 |
| 8. | Lehigh Acres | 7,266 | 660,755(1.10%)#8 | 14,469,050(0.05%)#289 |
| 9. | West Palm Beach | 7,211 | 660,755(1.09%)#9 | 14,469,050(0.05%)#291 |
| 10. | Immokalee | 7,210 | 660,755(1.09%)#10 | 14,469,050(0.05%)#292 |
| 11. | Pompano Beach | 5,987 | 660,755(0.91%)#11 | 14,469,050(0.04%)#355 |
| 12. | Davie | 5,879 | 660,755(0.89%)#12 | 14,469,050(0.04%)#363 |
| 13. | Fountainebleau | 5,515 | 660,755(0.83%)#13 | 14,469,050(0.04%)#386 |
| 14. | Orlando | 5,512 | 660,755(0.83%)#14 | 14,469,050(0.04%)#387 |
| 15. | Fort Myers | 5,388 | 660,755(0.82%)#15 | 14,469,050(0.04%)#395 |
| 16. | Hollywood | 5,202 | 660,755(0.79%)#16 | 14,469,050(0.04%)#422 |
| 17. | Miami Beach | 4,917 | 660,755(0.74%)#17 | 14,469,050(0.03%)#438 |
| 18. | University Cdp Hillsborough County | 4,700 | 660,755(0.71%)#18 | 14,469,050(0.03%)#453 |
| 19. | Pembroke Pines | 4,697 | 660,755(0.71%)#19 | 14,469,050(0.03%)#455 |
| 20. | Golden Gate | 4,669 | 660,755(0.71%)#20 | 14,469,050(0.03%)#456 |
| 21. | Bonita Springs | 4,552 | 660,755(0.69%)#21 | 14,469,050(0.03%)#469 |
| 22. | Leisure City | 4,529 | 660,755(0.69%)#22 | 14,469,050(0.03%)#475 |
| 23. | Oakland Park | 4,324 | 660,755(0.65%)#23 | 14,469,050(0.03%)#490 |
| 24. | Miami Gardens | 4,298 | 660,755(0.65%)#24 | 14,469,050(0.03%)#493 |
| 25. | Port St Lucie | 4,226 | 660,755(0.64%)#25 | 14,469,050(0.03%)#500 |
| 26. | Palm Springs | 4,146 | 660,755(0.63%)#26 | 14,469,050(0.03%)#510 |
| 27. | Deerfield Beach | 3,921 | 660,755(0.59%)#27 | 14,469,050(0.03%)#545 |
| 28. | Miramar | 3,794 | 660,755(0.57%)#28 | 14,469,050(0.03%)#558 |
| 29. | Sweetwater | 3,704 | 660,755(0.56%)#29 | 14,469,050(0.03%)#569 |
| 30. | Kendall | 3,669 | 660,755(0.56%)#30 | 14,469,050(0.03%)#578 |
| 31. | West Little River | 3,669 | 660,755(0.56%)#31 | 14,469,050(0.03%)#579 |
| 32. | The Hammocks | 3,658 | 660,755(0.55%)#32 | 14,469,050(0.03%)#582 |
| 33. | Tamiami | 3,531 | 660,755(0.53%)#33 | 14,469,050(0.02%)#599 |
| 34. | Greenacres | 3,523 | 660,755(0.53%)#34 | 14,469,050(0.02%)#600 |
| 35. | Clearwater | 3,474 | 660,755(0.53%)#35 | 14,469,050(0.02%)#606 |
| 36. | Plant City | 3,454 | 660,755(0.52%)#36 | 14,469,050(0.02%)#610 |
| 37. | Princeton | 3,390 | 660,755(0.51%)#37 | 14,469,050(0.02%)#618 |
| 38. | Kendale Lakes | 3,262 | 660,755(0.49%)#38 | 14,469,050(0.02%)#639 |
| 39. | Oak Ridge | 3,208 | 660,755(0.49%)#39 | 14,469,050(0.02%)#648 |
| 40. | Kissimmee | 3,192 | 660,755(0.48%)#40 | 14,469,050(0.02%)#650 |
| 41. | Apopka | 3,181 | 660,755(0.48%)#41 | 14,469,050(0.02%)#658 |
| 42. | North Lauderdale | 3,157 | 660,755(0.48%)#42 | 14,469,050(0.02%)#662 |
| 43. | Ocoee | 3,139 | 660,755(0.48%)#43 | 14,469,050(0.02%)#669 |
| 44. | Jupiter | 2,999 | 660,755(0.45%)#44 | 14,469,050(0.02%)#696 |
| 45. | Brownsville | 2,966 | 660,755(0.45%)#45 | 14,469,050(0.02%)#703 |
| 46. | Cape Coral | 2,953 | 660,755(0.45%)#46 | 14,469,050(0.02%)#707 |
| 47. | South Miami Heights | 2,846 | 660,755(0.43%)#47 | 14,469,050(0.02%)#732 |
| 48. | Bradenton | 2,828 | 660,755(0.43%)#48 | 14,469,050(0.02%)#736 |
| 49. | Kendall West | 2,748 | 660,755(0.42%)#49 | 14,469,050(0.02%)#752 |
| 50. | Riverview | 2,742 | 660,755(0.41%)#50 | 14,469,050(0.02%)#754 |
| 51. | North Miami | 2,729 | 660,755(0.41%)#51 | 14,469,050(0.02%)#759 |
| 52. | Coral Springs | 2,634 | 660,755(0.40%)#52 | 14,469,050(0.02%)#776 |
| 53. | Doral | 2,463 | 660,755(0.37%)#53 | 14,469,050(0.02%)#817 |
| 54. | Weston | 2,457 | 660,755(0.37%)#54 | 14,469,050(0.02%)#819 |
| 55. | Westchester | 2,428 | 660,755(0.37%)#55 | 14,469,050(0.02%)#825 |
| 56. | Haines City | 2,380 | 660,755(0.36%)#56 | 14,469,050(0.02%)#835 |
| 57. | Country Club | 2,336 | 660,755(0.35%)#57 | 14,469,050(0.02%)#850 |
| 58. | Sarasota | 2,316 | 660,755(0.35%)#58 | 14,469,050(0.02%)#857 |
| 59. | Pine Hills | 2,263 | 660,755(0.34%)#59 | 14,469,050(0.02%)#874 |
| 60. | Cutler Bay | 2,249 | 660,755(0.34%)#60 | 14,469,050(0.02%)#878 |
| 61. | North Miami Beach | 2,193 | 660,755(0.33%)#61 | 14,469,050(0.02%)#888 |
| 62. | Westgate | 2,119 | 660,755(0.32%)#62 | 14,469,050(0.01%)#906 |
| 63. | Brandon | 2,097 | 660,755(0.32%)#63 | 14,469,050(0.01%)#915 |
| 64. | Boynton Beach | 2,088 | 660,755(0.32%)#64 | 14,469,050(0.01%)#919 |
| 65. | Sunrise | 2,084 | 660,755(0.32%)#65 | 14,469,050(0.01%)#921 |
| 66. | Winter Garden | 2,028 | 660,755(0.31%)#66 | 14,469,050(0.01%)#946 |
| 67. | Coral Gables | 2,015 | 660,755(0.30%)#67 | 14,469,050(0.01%)#951 |
| 68. | Margate | 1,942 | 660,755(0.29%)#68 | 14,469,050(0.01%)#971 |
| 69. | Fort Pierce | 1,923 | 660,755(0.29%)#69 | 14,469,050(0.01%)#978 |
| 70. | Florida City | 1,919 | 660,755(0.29%)#70 | 14,469,050(0.01%)#981 |
| 71. | Port Labelle | 1,907 | 660,755(0.29%)#71 | 14,469,050(0.01%)#988 |
| 72. | Ruskin | 1,902 | 660,755(0.29%)#72 | 14,469,050(0.01%)#996 |
| 73. | Wimauma | 1,894 | 660,755(0.29%)#73 | 14,469,050(0.01%)#998 |
| 74. | Town N Country | 1,888 | 660,755(0.29%)#74 | 14,469,050(0.01%)#1,003 |
| 75. | Wellington | 1,876 | 660,755(0.28%)#75 | 14,469,050(0.01%)#1,013 |
| 76. | Tice | 1,786 | 660,755(0.27%)#76 | 14,469,050(0.01%)#1,044 |
| 77. | Richmond West | 1,780 | 660,755(0.27%)#77 | 14,469,050(0.01%)#1,046 |
| 78. | Lakeland | 1,734 | 660,755(0.26%)#78 | 14,469,050(0.01%)#1,064 |
| 79. | Deltona | 1,715 | 660,755(0.26%)#79 | 14,469,050(0.01%)#1,073 |
| 80. | Coral Terrace | 1,706 | 660,755(0.26%)#80 | 14,469,050(0.01%)#1,080 |
| 81. | South Bradenton | 1,691 | 660,755(0.26%)#81 | 14,469,050(0.01%)#1,087 |
| 82. | Tamarac | 1,648 | 660,755(0.25%)#82 | 14,469,050(0.01%)#1,102 |
| 83. | St Petersburg | 1,642 | 660,755(0.25%)#83 | 14,469,050(0.01%)#1,108 |
| 84. | Sanford | 1,620 | 660,755(0.25%)#84 | 14,469,050(0.01%)#1,119 |
| 85. | Hialeah Gardens | 1,585 | 660,755(0.24%)#85 | 14,469,050(0.01%)#1,139 |
| 86. | Hallandale Beach | 1,582 | 660,755(0.24%)#86 | 14,469,050(0.01%)#1,141 |
| 87. | Country Walk | 1,562 | 660,755(0.24%)#87 | 14,469,050(0.01%)#1,150 |
| 88. | Buenaventura Lakes | 1,547 | 660,755(0.23%)#88 | 14,469,050(0.01%)#1,159 |
| 89. | Aventura | 1,485 | 660,755(0.22%)#89 | 14,469,050(0.01%)#1,194 |
| 90. | Palm Bay | 1,480 | 660,755(0.22%)#90 | 14,469,050(0.01%)#1,197 |
| 91. | Belle Glade | 1,467 | 660,755(0.22%)#91 | 14,469,050(0.01%)#1,203 |
| 92. | Fellsmere | 1,466 | 660,755(0.22%)#92 | 14,469,050(0.01%)#1,204 |
| 93. | The Crossings | 1,462 | 660,755(0.22%)#93 | 14,469,050(0.01%)#1,207 |
| 94. | San Carlos Park | 1,431 | 660,755(0.22%)#94 | 14,469,050(0.01%)#1,223 |
| 95. | Palmetto Estates | 1,429 | 660,755(0.22%)#95 | 14,469,050(0.01%)#1,225 |
| 96. | Wright | 1,410 | 660,755(0.21%)#96 | 14,469,050(0.01%)#1,238 |
| 97. | Southeast Arcadia | 1,405 | 660,755(0.21%)#97 | 14,469,050(0.01%)#1,241 |
| 98. | Meadow Woods | 1,403 | 660,755(0.21%)#98 | 14,469,050(0.01%)#1,242 |
| 99. | Three Lakes | 1,397 | 660,755(0.21%)#99 | 14,469,050(0.01%)#1,247 |
| 100. | Pine Manor | 1,390 | 660,755(0.21%)#100 | 14,469,050(0.01%)#1,252 |
Common Questions
What are the Top 10 Cities with the Most Immigrants from Central America in Florida?
Top 10 Cities with the Most Immigrants from Central America in Florida are:
#1
58,816
#2
13,352
#3
13,184
#4
11,061
#5
9,376
#6
8,003
#7
7,266
#8
7,211
#9
7,210
#10
5,987
What city has the Most Immigrants from Central America in Florida?
Miami has the Most Immigrants from Central America in Florida with 58,816.
What is the Total Immigrants from Central America in the State of Florida?
Total Immigrants from Central America in Florida is 660,755.
What is the Total Immigrants from Central America in the United States?
Total Immigrants from Central America in the United States is 14,469,050.