Cities with the Highest Percentage of Population with a Degree in Engineering in Kansas
RELATED REPORTS & OPTIONS
Engineering
Kansas
Compare Cities
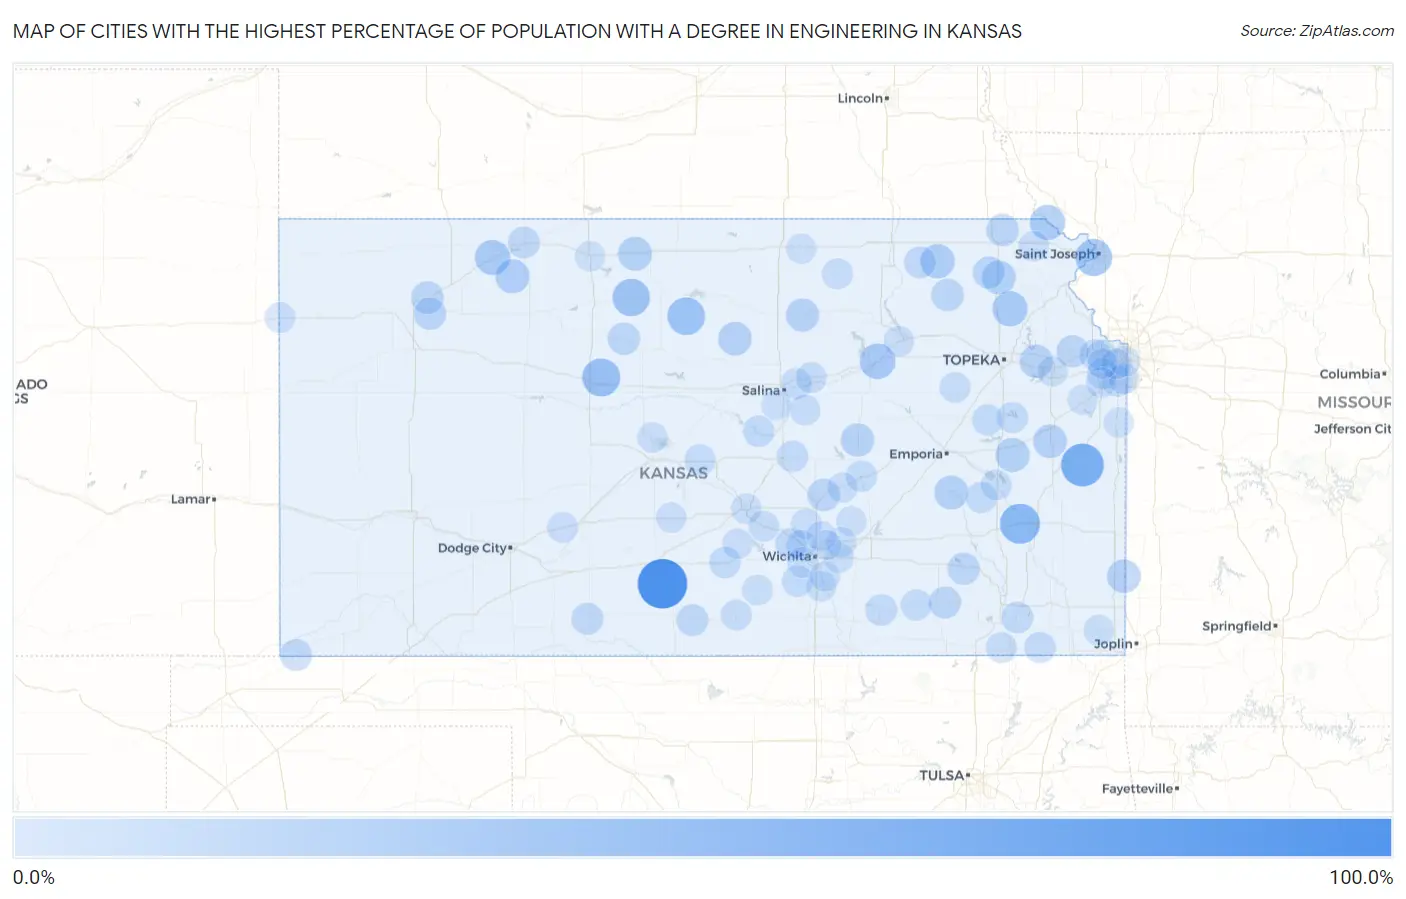
Map of Cities with the Highest Percentage of Population with a Degree in Engineering in Kansas
0.0%
100.0%
Cities with the Highest Percentage of Population with a Degree in Engineering in Kansas
| City | % Graduates | vs State | vs National | |
| 1. | Sawyer | 83.3% | 5.8%(+77.5)#1 | 7.6%(+75.7)#69 |
| 2. | Parker | 55.6% | 5.8%(+49.7)#2 | 7.6%(+47.9)#139 |
| 3. | Eastshore | 50.0% | 5.8%(+44.2)#3 | 7.6%(+42.4)#180 |
| 4. | Wabaunsee | 47.1% | 5.8%(+41.2)#4 | 7.6%(+39.4)#199 |
| 5. | Piqua | 44.4% | 5.8%(+38.6)#5 | 7.6%(+36.8)#219 |
| 6. | Catharine | 36.4% | 5.8%(+30.5)#6 | 7.6%(+28.7)#318 |
| 7. | Tipton | 34.5% | 5.8%(+28.7)#7 | 7.6%(+26.8)#342 |
| 8. | Alton | 33.3% | 5.8%(+27.5)#8 | 7.6%(+25.7)#370 |
| 9. | Elwood | 32.0% | 5.8%(+26.2)#9 | 7.6%(+24.4)#395 |
| 10. | Grandview Plaza | 26.6% | 5.8%(+20.8)#10 | 7.6%(+19.0)#576 |
| 11. | Denison | 25.0% | 5.8%(+19.2)#11 | 7.6%(+17.4)#665 |
| 12. | White Cloud | 25.0% | 5.8%(+19.2)#12 | 7.6%(+17.4)#668 |
| 13. | Clayton | 25.0% | 5.8%(+19.2)#13 | 7.6%(+17.4)#672 |
| 14. | Tecumseh | 22.2% | 5.8%(+16.4)#14 | 7.6%(+14.6)#831 |
| 15. | Vermillion | 22.2% | 5.8%(+16.4)#15 | 7.6%(+14.6)#847 |
| 16. | Lenora | 21.1% | 5.8%(+15.2)#16 | 7.6%(+13.4)#939 |
| 17. | Waverly | 20.6% | 5.8%(+14.8)#17 | 7.6%(+12.9)#991 |
| 18. | Madison | 20.0% | 5.8%(+14.2)#18 | 7.6%(+12.4)#1,031 |
| 19. | Netawaka | 20.0% | 5.8%(+14.2)#19 | 7.6%(+12.4)#1,055 |
| 20. | Athol | 20.0% | 5.8%(+14.2)#20 | 7.6%(+12.4)#1,073 |
| 21. | Princeton | 19.0% | 5.8%(+13.2)#21 | 7.6%(+11.4)#1,158 |
| 22. | Barnard | 19.0% | 5.8%(+13.2)#22 | 7.6%(+11.4)#1,161 |
| 23. | Mulberry | 18.8% | 5.8%(+12.9)#23 | 7.6%(+11.1)#1,194 |
| 24. | Lincolnville | 18.2% | 5.8%(+12.4)#24 | 7.6%(+10.5)#1,271 |
| 25. | Lecompton | 17.8% | 5.8%(+12.0)#25 | 7.6%(+10.1)#1,315 |
| 26. | Miltonvale | 17.3% | 5.8%(+11.5)#26 | 7.6%(+9.66)#1,396 |
| 27. | Rexford | 15.0% | 5.8%(+9.18)#27 | 7.6%(+7.35)#1,878 |
| 28. | Onaga | 14.8% | 5.8%(+8.99)#28 | 7.6%(+7.17)#1,907 |
| 29. | Walton | 14.8% | 5.8%(+8.99)#29 | 7.6%(+7.17)#1,909 |
| 30. | Natoma | 14.3% | 5.8%(+8.46)#30 | 7.6%(+6.64)#2,037 |
| 31. | Fall River | 14.3% | 5.8%(+8.46)#31 | 7.6%(+6.64)#2,051 |
| 32. | Morrill | 14.3% | 5.8%(+8.46)#32 | 7.6%(+6.64)#2,054 |
| 33. | Menlo | 14.3% | 5.8%(+8.46)#33 | 7.6%(+6.64)#2,069 |
| 34. | Wetmore | 13.8% | 5.8%(+7.97)#34 | 7.6%(+6.15)#2,221 |
| 35. | Elk Falls | 13.5% | 5.8%(+7.69)#35 | 7.6%(+5.87)#2,305 |
| 36. | Tonganoxie | 13.4% | 5.8%(+7.59)#36 | 7.6%(+5.77)#2,333 |
| 37. | Norton | 12.5% | 5.8%(+6.70)#37 | 7.6%(+4.88)#2,653 |
| 38. | Sharon | 12.5% | 5.8%(+6.68)#38 | 7.6%(+4.85)#2,708 |
| 39. | Elkhart | 12.4% | 5.8%(+6.62)#39 | 7.6%(+4.79)#2,725 |
| 40. | Coldwater | 12.3% | 5.8%(+6.51)#40 | 7.6%(+4.68)#2,766 |
| 41. | Colwich | 12.0% | 5.8%(+6.17)#41 | 7.6%(+4.34)#2,896 |
| 42. | Frankfort | 11.9% | 5.8%(+6.04)#42 | 7.6%(+4.22)#2,953 |
| 43. | Cherryvale | 11.6% | 5.8%(+5.82)#43 | 7.6%(+4.00)#3,054 |
| 44. | Burden | 11.3% | 5.8%(+5.43)#44 | 7.6%(+3.60)#3,248 |
| 45. | Marquette | 11.0% | 5.8%(+5.14)#45 | 7.6%(+3.31)#3,428 |
| 46. | Kingman | 10.8% | 5.8%(+4.98)#46 | 7.6%(+3.16)#3,518 |
| 47. | Galva | 10.4% | 5.8%(+4.54)#47 | 7.6%(+2.71)#3,817 |
| 48. | Vassar | 10.2% | 5.8%(+4.42)#48 | 7.6%(+2.59)#3,907 |
| 49. | Edna | 10.2% | 5.8%(+4.38)#49 | 7.6%(+2.56)#3,932 |
| 50. | Bonner Springs | 10.0% | 5.8%(+4.22)#50 | 7.6%(+2.40)#4,033 |
| 51. | Florence | 10.0% | 5.8%(+4.18)#51 | 7.6%(+2.35)#4,074 |
| 52. | Chase | 10.0% | 5.8%(+4.18)#52 | 7.6%(+2.35)#4,076 |
| 53. | Clearwater | 10.0% | 5.8%(+4.14)#53 | 7.6%(+2.31)#4,122 |
| 54. | Gridley | 9.8% | 5.8%(+3.98)#54 | 7.6%(+2.16)#4,250 |
| 55. | Grenola | 9.7% | 5.8%(+3.86)#55 | 7.6%(+2.03)#4,335 |
| 56. | Osage City | 9.2% | 5.8%(+3.34)#56 | 7.6%(+1.52)#4,743 |
| 57. | New Cambria | 9.1% | 5.8%(+3.27)#57 | 7.6%(+1.44)#4,823 |
| 58. | Overland Park | 8.7% | 5.8%(+2.92)#58 | 7.6%(+1.09)#5,165 |
| 59. | Solomon | 8.7% | 5.8%(+2.87)#59 | 7.6%(+1.05)#5,200 |
| 60. | Palmer | 8.7% | 5.8%(+2.87)#60 | 7.6%(+1.05)#5,223 |
| 61. | Burlington | 8.7% | 5.8%(+2.85)#61 | 7.6%(+1.03)#5,239 |
| 62. | Harper | 8.3% | 5.8%(+2.51)#62 | 7.6%(+0.686)#5,554 |
| 63. | Eskridge | 8.3% | 5.8%(+2.51)#63 | 7.6%(+0.686)#5,568 |
| 64. | Haven | 8.3% | 5.8%(+2.46)#64 | 7.6%(+0.636)#5,634 |
| 65. | Dearing | 8.1% | 5.8%(+2.29)#65 | 7.6%(+0.461)#5,834 |
| 66. | Lenexa | 8.0% | 5.8%(+2.21)#66 | 7.6%(+0.387)#5,923 |
| 67. | Gypsum | 7.9% | 5.8%(+2.07)#67 | 7.6%(+0.247)#6,106 |
| 68. | Wichita | 7.7% | 5.8%(+1.91)#68 | 7.6%(+0.080)#6,290 |
| 69. | Leawood | 7.7% | 5.8%(+1.88)#69 | 7.6%(+0.051)#6,325 |
| 70. | Kanorado | 7.7% | 5.8%(+1.87)#70 | 7.6%(+0.045)#6,365 |
| 71. | Robinson | 7.7% | 5.8%(+1.87)#71 | 7.6%(+0.045)#6,368 |
| 72. | Manhattan | 7.6% | 5.8%(+1.77)#72 | 7.6%(-0.055)#6,485 |
| 73. | South Hutchinson | 7.6% | 5.8%(+1.77)#73 | 7.6%(-0.057)#6,489 |
| 74. | Norwich | 7.6% | 5.8%(+1.75)#74 | 7.6%(-0.072)#6,508 |
| 75. | Sedgwick | 7.5% | 5.8%(+1.70)#75 | 7.6%(-0.121)#6,556 |
| 76. | Edwardsville | 7.5% | 5.8%(+1.63)#76 | 7.6%(-0.196)#6,654 |
| 77. | Offerle | 7.4% | 5.8%(+1.59)#77 | 7.6%(-0.240)#6,714 |
| 78. | Westwood | 7.4% | 5.8%(+1.57)#78 | 7.6%(-0.258)#6,736 |
| 79. | Merriam | 7.1% | 5.8%(+1.24)#79 | 7.6%(-0.581)#7,191 |
| 80. | Olathe | 6.9% | 5.8%(+1.12)#80 | 7.6%(-0.702)#7,345 |
| 81. | Columbus | 6.8% | 5.8%(+1.02)#81 | 7.6%(-0.801)#7,482 |
| 82. | Shawnee | 6.8% | 5.8%(+1.02)#82 | 7.6%(-0.802)#7,484 |
| 83. | Mulvane | 6.8% | 5.8%(+0.996)#83 | 7.6%(-0.829)#7,522 |
| 84. | Hoisington | 6.8% | 5.8%(+0.996)#84 | 7.6%(-0.829)#7,524 |
| 85. | Lawrence | 6.8% | 5.8%(+0.972)#85 | 7.6%(-0.854)#7,559 |
| 86. | Pretty Prairie | 6.7% | 5.8%(+0.927)#86 | 7.6%(-0.899)#7,622 |
| 87. | Benton | 6.7% | 5.8%(+0.924)#87 | 7.6%(-0.901)#7,625 |
| 88. | Maize | 6.7% | 5.8%(+0.901)#88 | 7.6%(-0.924)#7,656 |
| 89. | Stafford | 6.7% | 5.8%(+0.901)#89 | 7.6%(-0.925)#7,663 |
| 90. | Potwin | 6.6% | 5.8%(+0.757)#90 | 7.6%(-1.07)#7,874 |
| 91. | Cuba | 6.6% | 5.8%(+0.735)#91 | 7.6%(-1.09)#7,906 |
| 92. | Andover | 6.5% | 5.8%(+0.724)#92 | 7.6%(-1.10)#7,925 |
| 93. | Phillipsburg | 6.5% | 5.8%(+0.718)#93 | 7.6%(-1.11)#7,935 |
| 94. | Kechi | 6.4% | 5.8%(+0.580)#94 | 7.6%(-1.25)#8,147 |
| 95. | Edgerton | 6.4% | 5.8%(+0.536)#95 | 7.6%(-1.29)#8,210 |
| 96. | Louisburg | 6.3% | 5.8%(+0.507)#96 | 7.6%(-1.32)#8,255 |
| 97. | Derby | 6.3% | 5.8%(+0.481)#97 | 7.6%(-1.34)#8,303 |
| 98. | Bel Aire | 6.3% | 5.8%(+0.455)#98 | 7.6%(-1.37)#8,339 |
| 99. | Smolan | 6.0% | 5.8%(+0.178)#99 | 7.6%(-1.65)#8,840 |
| 100. | Peabody | 5.9% | 5.8%(+0.119)#100 | 7.6%(-1.71)#8,931 |
Common Questions
What are the Top 10 Cities with the Highest Percentage of Population with a Degree in Engineering in Kansas?
Top 10 Cities with the Highest Percentage of Population with a Degree in Engineering in Kansas are:
#1
83.3%
#2
55.6%
#3
44.4%
#4
36.4%
#5
34.5%
#6
33.3%
#7
32.0%
#8
26.6%
#9
25.0%
#10
25.0%
What city has the Highest Percentage of Population with a Degree in Engineering in Kansas?
Sawyer has the Highest Percentage of Population with a Degree in Engineering in Kansas with 83.3%.
What is the Percentage of Population with a Degree in Engineering in the State of Kansas?
Percentage of Population with a Degree in Engineering in Kansas is 5.8%.
What is the Percentage of Population with a Degree in Engineering in the United States?
Percentage of Population with a Degree in Engineering in the United States is 7.6%.