Cities with the Highest Percentage of Population with a Degree in Engineering in North Carolina
RELATED REPORTS & OPTIONS
Engineering
North Carolina
Compare Cities
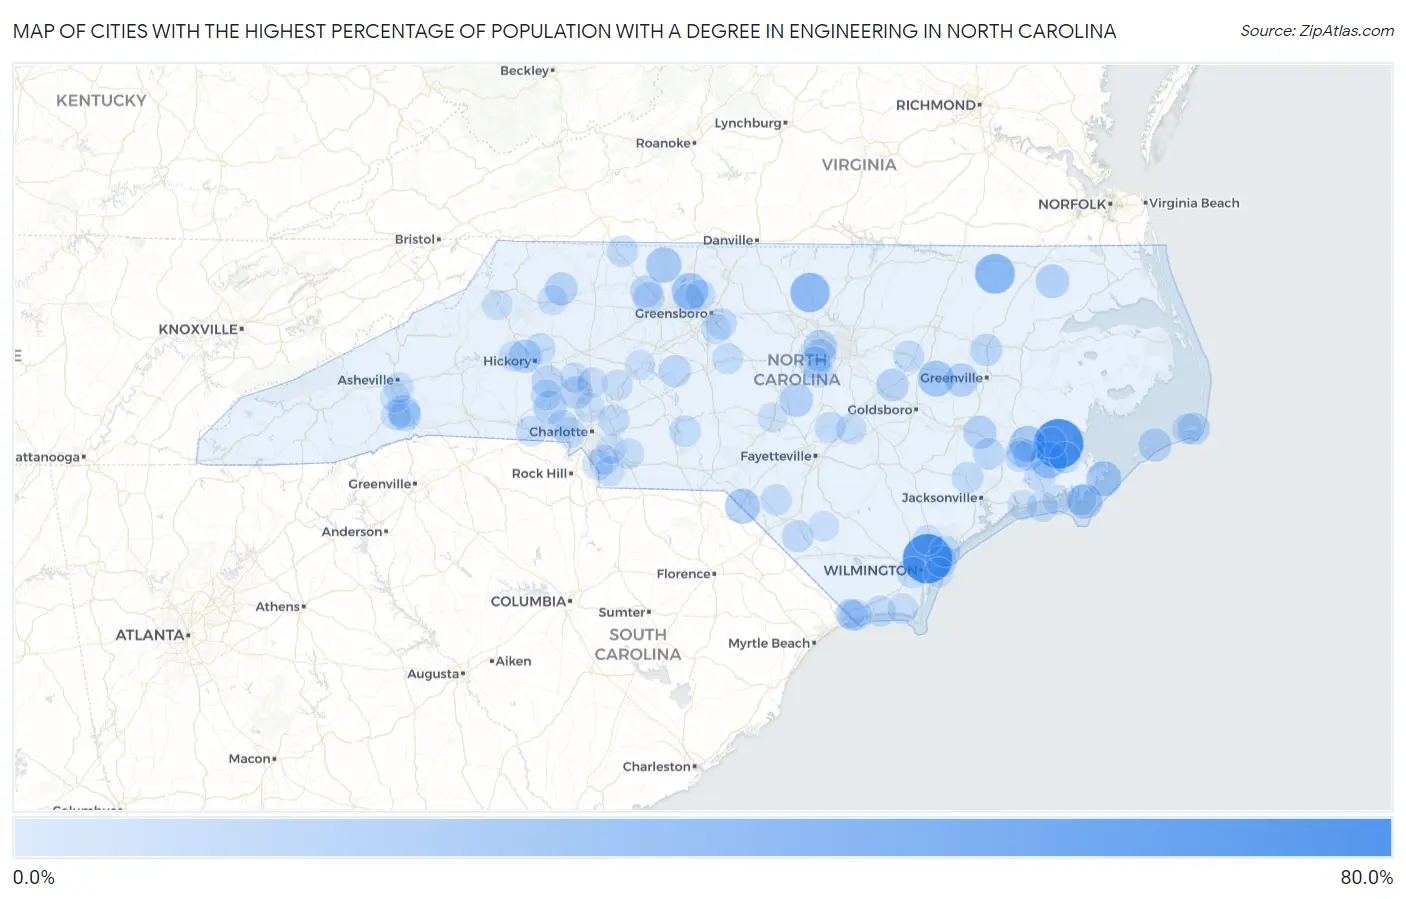
Map of Cities with the Highest Percentage of Population with a Degree in Engineering in North Carolina
0.0%
80.0%
Cities with the Highest Percentage of Population with a Degree in Engineering in North Carolina
| City | % Graduates | vs State | vs National | |
| 1. | Stonewall | 63.6% | 6.7%(+56.9)#1 | 7.6%(+56.0)#106 |
| 2. | Blue Clay Farms | 63.2% | 6.7%(+56.5)#2 | 7.6%(+55.5)#108 |
| 3. | Barnardsville | 44.2% | 6.7%(+37.5)#3 | 7.6%(+36.6)#222 |
| 4. | Lasker | 35.7% | 6.7%(+29.0)#4 | 7.6%(+28.1)#326 |
| 5. | Rougemont | 34.3% | 6.7%(+27.6)#5 | 7.6%(+26.6)#348 |
| 6. | Dudley | 33.6% | 6.7%(+26.9)#6 | 7.6%(+25.9)#354 |
| 7. | Stokesdale | 26.4% | 6.7%(+19.7)#7 | 7.6%(+18.7)#581 |
| 8. | Arapahoe | 25.6% | 6.7%(+19.0)#8 | 7.6%(+18.0)#619 |
| 9. | Stantonsburg | 24.7% | 6.7%(+18.0)#9 | 7.6%(+17.1)#686 |
| 10. | Bridgeton | 24.4% | 6.7%(+17.7)#10 | 7.6%(+16.8)#700 |
| 11. | Danbury | 23.3% | 6.7%(+16.6)#11 | 7.6%(+15.7)#761 |
| 12. | Atlantic | 22.4% | 6.7%(+15.8)#12 | 7.6%(+14.8)#811 |
| 13. | Scotch Meadows | 22.4% | 6.7%(+15.7)#13 | 7.6%(+14.7)#815 |
| 14. | Marshallberg | 21.9% | 6.7%(+15.2)#14 | 7.6%(+14.3)#858 |
| 15. | Harrellsville | 18.8% | 6.7%(+12.1)#15 | 7.6%(+11.1)#1,195 |
| 16. | Broadway | 18.2% | 6.7%(+11.5)#16 | 7.6%(+10.6)#1,249 |
| 17. | Rhodhiss | 17.7% | 6.7%(+11.1)#17 | 7.6%(+10.1)#1,322 |
| 18. | Farmville | 17.6% | 6.7%(+10.9)#18 | 7.6%(+9.94)#1,340 |
| 19. | Dover | 17.4% | 6.7%(+10.7)#19 | 7.6%(+9.74)#1,376 |
| 20. | Governors | 17.3% | 6.7%(+10.6)#20 | 7.6%(+9.62)#1,403 |
| 21. | High Shoals | 17.0% | 6.7%(+10.3)#21 | 7.6%(+9.37)#1,441 |
| 22. | Morrisville | 16.9% | 6.7%(+10.3)#22 | 7.6%(+9.30)#1,454 |
| 23. | Ocracoke | 16.7% | 6.7%(+10.0)#23 | 7.6%(+9.08)#1,491 |
| 24. | Brandywine Bay | 16.5% | 6.7%(+9.81)#24 | 7.6%(+8.85)#1,564 |
| 25. | Hays | 16.5% | 6.7%(+9.80)#25 | 7.6%(+8.84)#1,568 |
| 26. | Westport | 16.3% | 6.7%(+9.66)#26 | 7.6%(+8.70)#1,590 |
| 27. | Grandfather | 16.0% | 6.7%(+9.31)#27 | 7.6%(+8.35)#1,655 |
| 28. | Mountain Home | 15.8% | 6.7%(+9.15)#28 | 7.6%(+8.19)#1,690 |
| 29. | Micro | 15.7% | 6.7%(+9.00)#29 | 7.6%(+8.04)#1,736 |
| 30. | Cary | 15.1% | 6.7%(+8.39)#30 | 7.6%(+7.43)#1,858 |
| 31. | Buxton | 15.0% | 6.7%(+8.28)#31 | 7.6%(+7.32)#1,881 |
| 32. | Bethel | 14.8% | 6.7%(+8.14)#32 | 7.6%(+7.18)#1,904 |
| 33. | Balfour | 14.5% | 6.7%(+7.80)#33 | 7.6%(+6.84)#1,980 |
| 34. | Maiden | 14.4% | 6.7%(+7.72)#34 | 7.6%(+6.76)#1,996 |
| 35. | Apex | 14.2% | 6.7%(+7.56)#35 | 7.6%(+6.60)#2,077 |
| 36. | Denton | 14.2% | 6.7%(+7.49)#36 | 7.6%(+6.53)#2,096 |
| 37. | Tobaccoville | 14.0% | 6.7%(+7.34)#37 | 7.6%(+6.38)#2,137 |
| 38. | Bethania | 13.4% | 6.7%(+6.75)#38 | 7.6%(+5.79)#2,328 |
| 39. | Proctorville | 13.3% | 6.7%(+6.65)#39 | 7.6%(+5.69)#2,378 |
| 40. | Trenton | 12.8% | 6.7%(+6.13)#40 | 7.6%(+5.17)#2,556 |
| 41. | Belville | 12.5% | 6.7%(+5.85)#41 | 7.6%(+4.89)#2,648 |
| 42. | Porters Neck | 12.5% | 6.7%(+5.77)#42 | 7.6%(+4.81)#2,721 |
| 43. | Richlands | 12.4% | 6.7%(+5.73)#43 | 7.6%(+4.77)#2,733 |
| 44. | Flat Rock | 12.4% | 6.7%(+5.70)#44 | 7.6%(+4.74)#2,740 |
| 45. | Mount Gilead | 12.3% | 6.7%(+5.65)#45 | 7.6%(+4.69)#2,757 |
| 46. | Hampstead | 12.2% | 6.7%(+5.55)#46 | 7.6%(+4.59)#2,799 |
| 47. | Forest Oaks | 12.2% | 6.7%(+5.52)#47 | 7.6%(+4.56)#2,806 |
| 48. | James City | 12.2% | 6.7%(+5.51)#48 | 7.6%(+4.55)#2,809 |
| 49. | Oriental | 12.1% | 6.7%(+5.42)#49 | 7.6%(+4.46)#2,852 |
| 50. | Sims | 12.1% | 6.7%(+5.38)#50 | 7.6%(+4.42)#2,863 |
| 51. | Harrisburg | 12.1% | 6.7%(+5.37)#51 | 7.6%(+4.41)#2,868 |
| 52. | Holden Beach | 11.9% | 6.7%(+5.21)#52 | 7.6%(+4.25)#2,937 |
| 53. | Sunset Beach | 11.9% | 6.7%(+5.20)#53 | 7.6%(+4.24)#2,942 |
| 54. | Linden | 11.8% | 6.7%(+5.08)#54 | 7.6%(+4.12)#3,005 |
| 55. | Prospect | 11.6% | 6.7%(+4.96)#55 | 7.6%(+4.00)#3,055 |
| 56. | Brices Creek | 11.6% | 6.7%(+4.88)#56 | 7.6%(+3.92)#3,083 |
| 57. | Calabash | 11.5% | 6.7%(+4.83)#57 | 7.6%(+3.87)#3,114 |
| 58. | Indian Beach | 11.4% | 6.7%(+4.72)#58 | 7.6%(+3.76)#3,168 |
| 59. | Ramseur | 11.1% | 6.7%(+4.42)#59 | 7.6%(+3.46)#3,319 |
| 60. | Marvin | 11.0% | 6.7%(+4.33)#60 | 7.6%(+3.37)#3,392 |
| 61. | Plain View | 11.0% | 6.7%(+4.30)#61 | 7.6%(+3.34)#3,407 |
| 62. | Lincolnton | 11.0% | 6.7%(+4.29)#62 | 7.6%(+3.33)#3,415 |
| 63. | Kings Mountain | 11.0% | 6.7%(+4.28)#63 | 7.6%(+3.32)#3,423 |
| 64. | Bethlehem | 11.0% | 6.7%(+4.28)#64 | 7.6%(+3.32)#3,424 |
| 65. | Havelock | 10.9% | 6.7%(+4.24)#65 | 7.6%(+3.27)#3,449 |
| 66. | Landis | 10.9% | 6.7%(+4.20)#66 | 7.6%(+3.24)#3,472 |
| 67. | Belmont | 10.8% | 6.7%(+4.16)#67 | 7.6%(+3.20)#3,489 |
| 68. | Frisco | 10.8% | 6.7%(+4.16)#68 | 7.6%(+3.20)#3,496 |
| 69. | Oak Ridge | 10.6% | 6.7%(+3.94)#69 | 7.6%(+2.98)#3,630 |
| 70. | St James | 10.6% | 6.7%(+3.90)#70 | 7.6%(+2.94)#3,656 |
| 71. | Summerfield | 10.5% | 6.7%(+3.84)#71 | 7.6%(+2.88)#3,685 |
| 72. | Lowell | 10.5% | 6.7%(+3.81)#72 | 7.6%(+2.85)#3,722 |
| 73. | Gloucester | 10.4% | 6.7%(+3.75)#73 | 7.6%(+2.79)#3,764 |
| 74. | Horse Shoe | 10.2% | 6.7%(+3.50)#74 | 7.6%(+2.54)#3,945 |
| 75. | Unionville | 10.0% | 6.7%(+3.32)#75 | 7.6%(+2.36)#4,054 |
| 76. | Mooresville | 9.9% | 6.7%(+3.23)#76 | 7.6%(+2.27)#4,156 |
| 77. | Cricket | 9.8% | 6.7%(+3.13)#77 | 7.6%(+2.17)#4,237 |
| 78. | Weddington | 9.7% | 6.7%(+3.05)#78 | 7.6%(+2.09)#4,287 |
| 79. | Alliance | 9.7% | 6.7%(+3.04)#79 | 7.6%(+2.07)#4,302 |
| 80. | Holly Springs | 9.6% | 6.7%(+2.91)#80 | 7.6%(+1.95)#4,389 |
| 81. | Bladenboro | 9.5% | 6.7%(+2.84)#81 | 7.6%(+1.88)#4,440 |
| 82. | Rutherford College | 9.5% | 6.7%(+2.78)#82 | 7.6%(+1.82)#4,497 |
| 83. | Blowing Rock | 9.5% | 6.7%(+2.77)#83 | 7.6%(+1.81)#4,501 |
| 84. | Springdale | 9.5% | 6.7%(+2.77)#84 | 7.6%(+1.81)#4,505 |
| 85. | Rocky Point | 9.4% | 6.7%(+2.75)#85 | 7.6%(+1.79)#4,521 |
| 86. | Lake Norman Of Catawba | 9.4% | 6.7%(+2.72)#86 | 7.6%(+1.76)#4,540 |
| 87. | Carolina Meadows | 9.2% | 6.7%(+2.55)#87 | 7.6%(+1.59)#4,684 |
| 88. | Biltmore Forest | 9.2% | 6.7%(+2.53)#88 | 7.6%(+1.57)#4,702 |
| 89. | Pleasant Garden | 9.2% | 6.7%(+2.50)#89 | 7.6%(+1.54)#4,734 |
| 90. | Wrightsville Beach | 9.1% | 6.7%(+2.38)#90 | 7.6%(+1.42)#4,843 |
| 91. | Cameron | 9.0% | 6.7%(+2.29)#91 | 7.6%(+1.33)#4,946 |
| 92. | New Bern | 9.0% | 6.7%(+2.27)#92 | 7.6%(+1.31)#4,971 |
| 93. | Mineral Springs | 8.9% | 6.7%(+2.22)#93 | 7.6%(+1.26)#5,017 |
| 94. | Spencer | 8.9% | 6.7%(+2.22)#94 | 7.6%(+1.26)#5,023 |
| 95. | Morehead City | 8.8% | 6.7%(+2.15)#95 | 7.6%(+1.19)#5,078 |
| 96. | Cape Carteret | 8.8% | 6.7%(+2.15)#96 | 7.6%(+1.19)#5,081 |
| 97. | Avery Creek | 8.8% | 6.7%(+2.10)#97 | 7.6%(+1.14)#5,122 |
| 98. | Stallings | 8.8% | 6.7%(+2.07)#98 | 7.6%(+1.11)#5,146 |
| 99. | Huntersville | 8.7% | 6.7%(+2.06)#99 | 7.6%(+1.10)#5,160 |
| 100. | Carolina Shores | 8.6% | 6.7%(+1.93)#100 | 7.6%(+0.973)#5,285 |
Common Questions
What are the Top 10 Cities with the Highest Percentage of Population with a Degree in Engineering in North Carolina?
Top 10 Cities with the Highest Percentage of Population with a Degree in Engineering in North Carolina are:
#1
63.6%
#2
63.2%
#3
35.7%
#4
34.3%
#5
26.4%
#6
25.6%
#7
24.7%
#8
24.4%
#9
23.3%
#10
22.4%
What city has the Highest Percentage of Population with a Degree in Engineering in North Carolina?
Stonewall has the Highest Percentage of Population with a Degree in Engineering in North Carolina with 63.6%.
What is the Percentage of Population with a Degree in Engineering in the State of North Carolina?
Percentage of Population with a Degree in Engineering in North Carolina is 6.7%.
What is the Percentage of Population with a Degree in Engineering in the United States?
Percentage of Population with a Degree in Engineering in the United States is 7.6%.