Zip Codes with the Highest Percentage of Population Employed in Agriculture, Fishing & Hunting in Fall River, MA
RELATED REPORTS & OPTIONS
Agriculture, Fishing & Hunting
Fall River
Compare Zip Codes
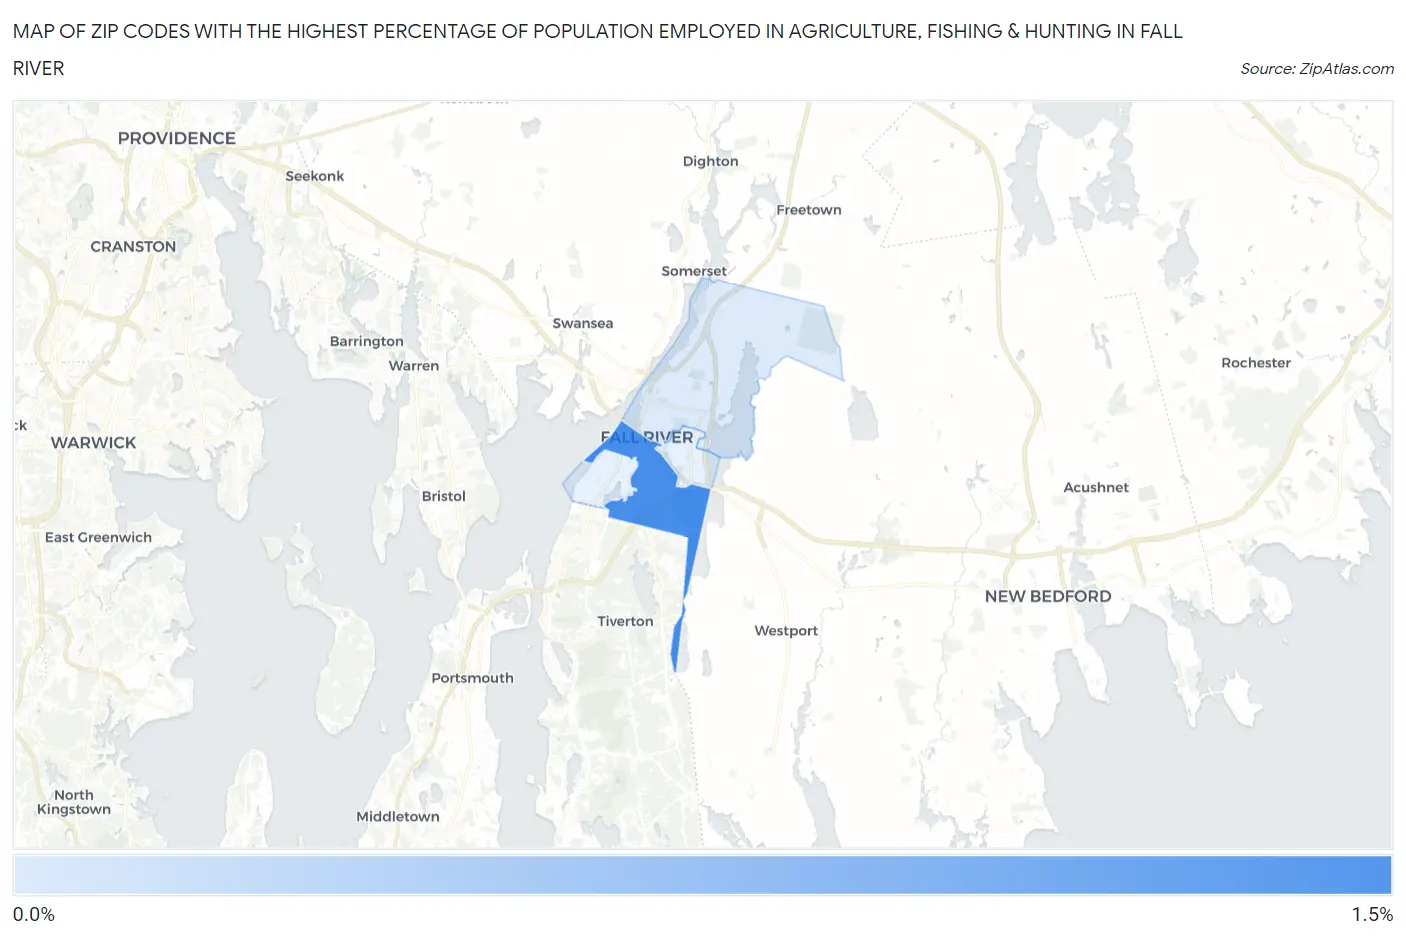
Map of Zip Codes with the Highest Percentage of Population Employed in Agriculture, Fishing & Hunting in Fall River
0.0%
1.5%
Zip Codes with the Highest Percentage of Population Employed in Agriculture, Fishing & Hunting in Fall River, MA
| Zip Code | % Employed | vs State | vs National | |
| 1. | 02721 | 1.0% | 0.39%(+0.654)#108 | 1.2%(-0.151)#16,014 |
| 2. | 02720 | 0.19% | 0.39%(-0.207)#283 | 1.2%(-1.01)#22,503 |
1
Common Questions
What are the Top 3 Zip Codes with the Highest Percentage of Population Employed in Agriculture, Fishing & Hunting in Fall River, MA?
Top 3 Zip Codes with the Highest Percentage of Population Employed in Agriculture, Fishing & Hunting in Fall River, MA are:
What zip code has the Highest Percentage of Population Employed in Agriculture, Fishing & Hunting in Fall River, MA?
02721 has the Highest Percentage of Population Employed in Agriculture, Fishing & Hunting in Fall River, MA with 1.0%.
What is the Percentage of Population Employed in Agriculture, Fishing & Hunting in Fall River, MA?
Percentage of Population Employed in Agriculture, Fishing & Hunting in Fall River is 0.36%.
What is the Percentage of Population Employed in Agriculture, Fishing & Hunting in Massachusetts?
Percentage of Population Employed in Agriculture, Fishing & Hunting in Massachusetts is 0.39%.
What is the Percentage of Population Employed in Agriculture, Fishing & Hunting in the United States?
Percentage of Population Employed in Agriculture, Fishing & Hunting in the United States is 1.2%.