Zip Codes with the Highest Percentage of Population Employed in Agriculture, Fishing & Hunting in New Bedford, MA
RELATED REPORTS & OPTIONS
Agriculture, Fishing & Hunting
New Bedford
Compare Zip Codes
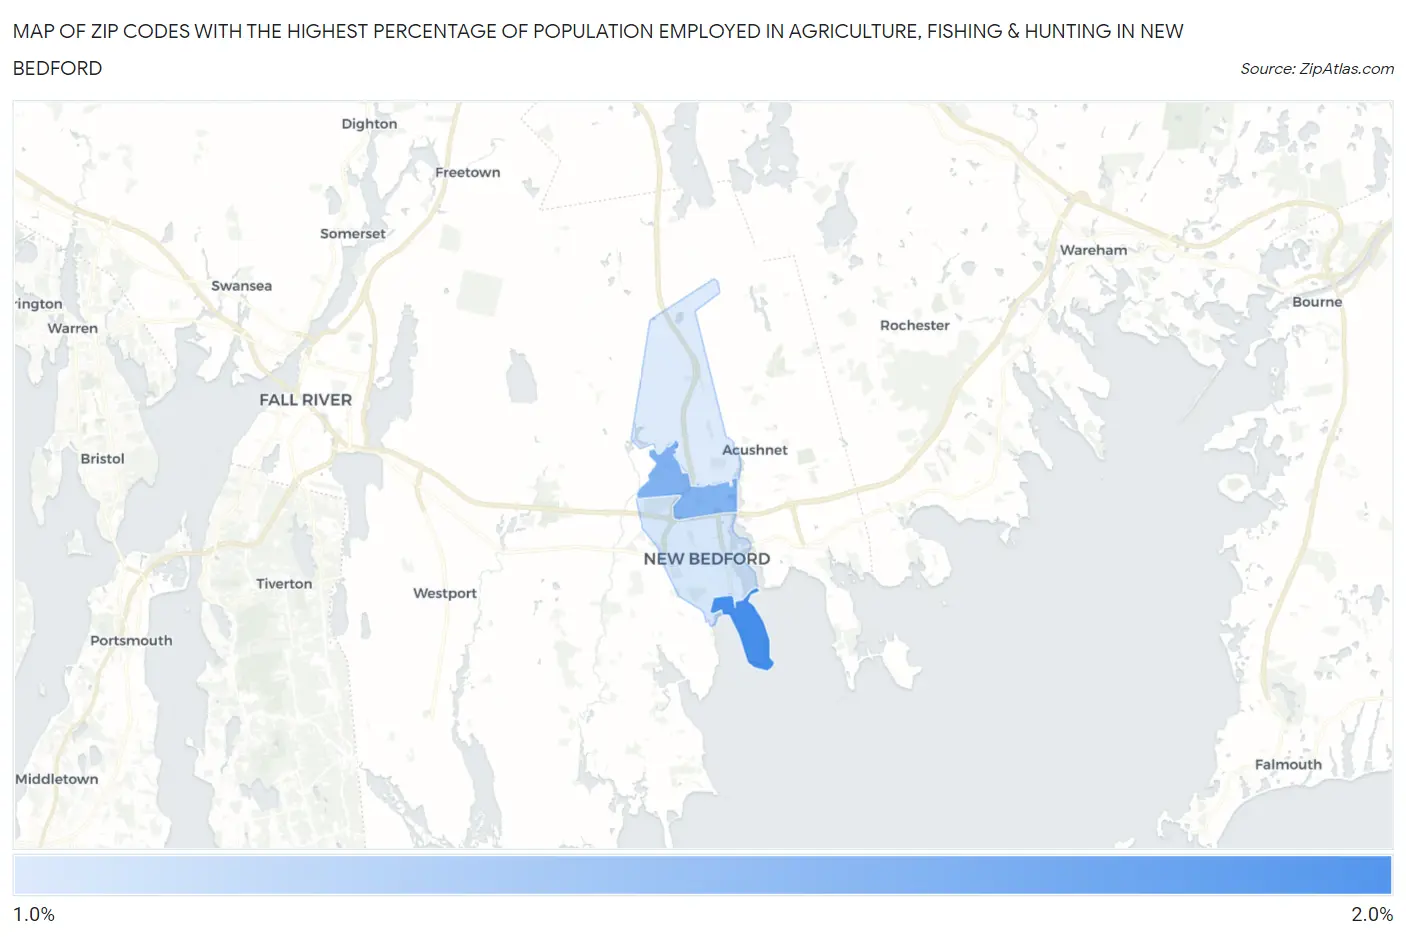
Map of Zip Codes with the Highest Percentage of Population Employed in Agriculture, Fishing & Hunting in New Bedford
0.0%
2.0%
Zip Codes with the Highest Percentage of Population Employed in Agriculture, Fishing & Hunting in New Bedford, MA
| Zip Code | % Employed | vs State | vs National | |
| 1. | 02744 | 2.0% | 0.39%(+1.58)#57 | 1.2%(+0.771)#12,843 |
| 2. | 02746 | 1.7% | 0.39%(+1.27)#67 | 1.2%(+0.465)#13,758 |
| 3. | 02740 | 1.2% | 0.39%(+0.812)#94 | 1.2%(+0.008)#15,374 |
| 4. | 02745 | 1.2% | 0.39%(+0.779)#96 | 1.2%(-0.026)#15,498 |
1
Common Questions
What are the Top 3 Zip Codes with the Highest Percentage of Population Employed in Agriculture, Fishing & Hunting in New Bedford, MA?
Top 3 Zip Codes with the Highest Percentage of Population Employed in Agriculture, Fishing & Hunting in New Bedford, MA are:
What zip code has the Highest Percentage of Population Employed in Agriculture, Fishing & Hunting in New Bedford, MA?
02744 has the Highest Percentage of Population Employed in Agriculture, Fishing & Hunting in New Bedford, MA with 2.0%.
What is the Percentage of Population Employed in Agriculture, Fishing & Hunting in New Bedford, MA?
Percentage of Population Employed in Agriculture, Fishing & Hunting in New Bedford is 1.3%.
What is the Percentage of Population Employed in Agriculture, Fishing & Hunting in Massachusetts?
Percentage of Population Employed in Agriculture, Fishing & Hunting in Massachusetts is 0.39%.
What is the Percentage of Population Employed in Agriculture, Fishing & Hunting in the United States?
Percentage of Population Employed in Agriculture, Fishing & Hunting in the United States is 1.2%.