Cities with the Highest Percentage of Population Employed in Agriculture, Fishing & Hunting in Indiana
RELATED REPORTS & OPTIONS
Agriculture, Fishing & Hunting
Indiana
Compare Cities
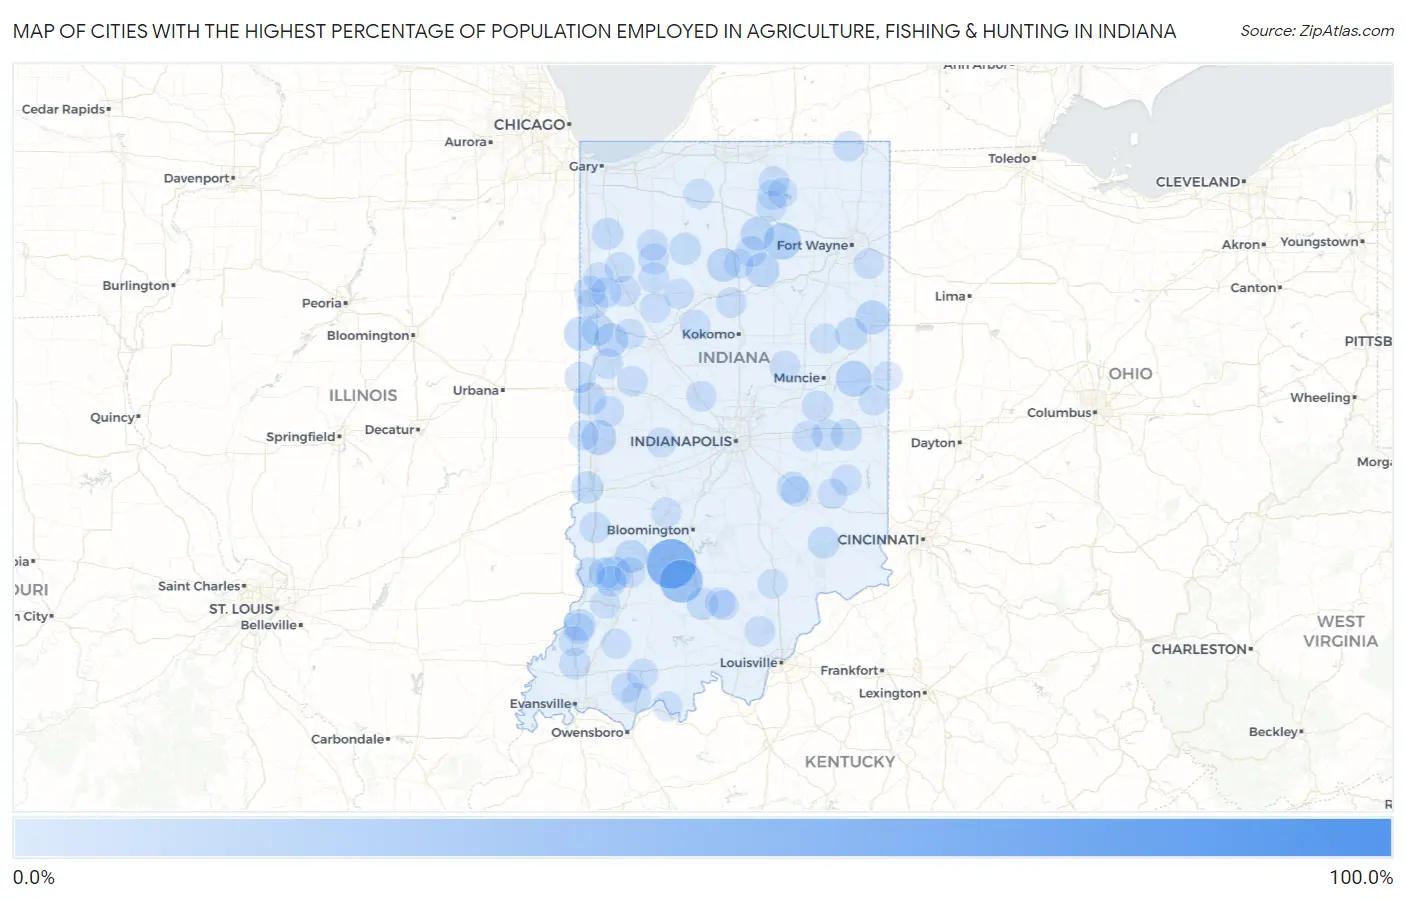
Map of Cities with the Highest Percentage of Population Employed in Agriculture, Fishing & Hunting in Indiana
0.0%
100.0%
Cities with the Highest Percentage of Population Employed in Agriculture, Fishing & Hunting in Indiana
| City | % Employed | vs State | vs National | |
| 1. | Millville | 100.0% | 1.1%(+98.9)#1 | 1.2%(+98.8)#5 |
| 2. | Fair Oaks | 75.0% | 1.1%(+73.9)#2 | 1.2%(+73.8)#93 |
| 3. | Hashtown | 55.0% | 1.1%(+53.9)#3 | 1.2%(+53.8)#170 |
| 4. | Owensburg | 54.8% | 1.1%(+53.7)#4 | 1.2%(+53.6)#172 |
| 5. | Marshfield | 48.6% | 1.1%(+47.5)#5 | 1.2%(+47.4)#216 |
| 6. | Williams | 36.8% | 1.1%(+35.7)#6 | 1.2%(+35.6)#357 |
| 7. | Brownsville | 31.5% | 1.1%(+30.4)#7 | 1.2%(+30.3)#476 |
| 8. | Newtonville | 20.9% | 1.1%(+19.9)#8 | 1.2%(+19.7)#943 |
| 9. | Sidney | 20.5% | 1.1%(+19.5)#9 | 1.2%(+19.3)#971 |
| 10. | Poland | 18.2% | 1.1%(+17.1)#10 | 1.2%(+17.0)#1,144 |
| 11. | Farmland | 17.9% | 1.1%(+16.9)#11 | 1.2%(+16.7)#1,169 |
| 12. | Montezuma | 15.8% | 1.1%(+14.8)#12 | 1.2%(+14.6)#1,393 |
| 13. | Prospect | 14.9% | 1.1%(+13.8)#13 | 1.2%(+13.7)#1,500 |
| 14. | Ambia | 14.5% | 1.1%(+13.4)#14 | 1.2%(+13.3)#1,547 |
| 15. | Westphalia | 14.3% | 1.1%(+13.2)#15 | 1.2%(+13.1)#1,577 |
| 16. | Geneva | 13.5% | 1.1%(+12.5)#16 | 1.2%(+12.3)#1,668 |
| 17. | Roann | 12.8% | 1.1%(+11.7)#17 | 1.2%(+11.6)#1,784 |
| 18. | Pine Village | 12.3% | 1.1%(+11.2)#18 | 1.2%(+11.1)#1,876 |
| 19. | Fulton | 11.9% | 1.1%(+10.8)#19 | 1.2%(+10.7)#1,933 |
| 20. | Burket | 11.8% | 1.1%(+10.7)#20 | 1.2%(+10.6)#1,959 |
| 21. | Perrysville | 10.2% | 1.1%(+9.18)#21 | 1.2%(+9.04)#2,372 |
| 22. | Lyons | 10.2% | 1.1%(+9.10)#22 | 1.2%(+8.95)#2,394 |
| 23. | Pittsburg | 9.9% | 1.1%(+8.80)#23 | 1.2%(+8.66)#2,478 |
| 24. | Glezen | 9.8% | 1.1%(+8.79)#24 | 1.2%(+8.65)#2,482 |
| 25. | Freelandville | 8.7% | 1.1%(+7.62)#25 | 1.2%(+7.48)#2,884 |
| 26. | Pennville | 8.6% | 1.1%(+7.56)#26 | 1.2%(+7.42)#2,914 |
| 27. | Pleasant Mills | 8.5% | 1.1%(+7.43)#27 | 1.2%(+7.29)#2,955 |
| 28. | Haysville | 8.4% | 1.1%(+7.36)#28 | 1.2%(+7.22)#2,993 |
| 29. | Winamac | 8.3% | 1.1%(+7.26)#29 | 1.2%(+7.11)#3,036 |
| 30. | Toad Hop | 8.2% | 1.1%(+7.19)#30 | 1.2%(+7.05)#3,052 |
| 31. | Orleans | 7.8% | 1.1%(+6.78)#31 | 1.2%(+6.64)#3,199 |
| 32. | Boswell | 7.8% | 1.1%(+6.72)#32 | 1.2%(+6.58)#3,220 |
| 33. | Holton | 7.3% | 1.1%(+6.21)#33 | 1.2%(+6.07)#3,461 |
| 34. | Waldron | 7.2% | 1.1%(+6.12)#34 | 1.2%(+5.98)#3,504 |
| 35. | Roselawn | 7.1% | 1.1%(+6.07)#35 | 1.2%(+5.93)#3,546 |
| 36. | Decker | 7.1% | 1.1%(+6.01)#36 | 1.2%(+5.87)#3,563 |
| 37. | Ramsey | 6.9% | 1.1%(+5.85)#37 | 1.2%(+5.71)#3,645 |
| 38. | Young America | 6.8% | 1.1%(+5.78)#38 | 1.2%(+5.63)#3,686 |
| 39. | Lewisville | 6.6% | 1.1%(+5.57)#39 | 1.2%(+5.43)#3,788 |
| 40. | Fort Branch | 6.6% | 1.1%(+5.54)#40 | 1.2%(+5.40)#3,802 |
| 41. | Celestine | 6.4% | 1.1%(+5.34)#41 | 1.2%(+5.20)#3,893 |
| 42. | Mount Auburn | 6.4% | 1.1%(+5.33)#42 | 1.2%(+5.18)#3,905 |
| 43. | Kentland | 6.1% | 1.1%(+5.04)#43 | 1.2%(+4.89)#4,058 |
| 44. | Sulphur Springs | 5.9% | 1.1%(+4.79)#44 | 1.2%(+4.65)#4,212 |
| 45. | Akron | 5.8% | 1.1%(+4.76)#45 | 1.2%(+4.62)#4,229 |
| 46. | Earl Park | 5.6% | 1.1%(+4.56)#46 | 1.2%(+4.41)#4,379 |
| 47. | Shelburn | 5.6% | 1.1%(+4.52)#47 | 1.2%(+4.37)#4,409 |
| 48. | Medaryville | 5.3% | 1.1%(+4.21)#48 | 1.2%(+4.06)#4,630 |
| 49. | State Line City | 5.2% | 1.1%(+4.14)#49 | 1.2%(+4.00)#4,686 |
| 50. | Hoagland | 5.2% | 1.1%(+4.11)#50 | 1.2%(+3.96)#4,712 |
| 51. | Francesville | 5.1% | 1.1%(+4.07)#51 | 1.2%(+3.93)#4,738 |
| 52. | Leesburg | 5.1% | 1.1%(+4.03)#52 | 1.2%(+3.89)#4,768 |
| 53. | Kingman | 5.0% | 1.1%(+3.99)#53 | 1.2%(+3.85)#4,810 |
| 54. | Orestes | 5.0% | 1.1%(+3.97)#54 | 1.2%(+3.83)#4,819 |
| 55. | Stanford | 5.0% | 1.1%(+3.92)#55 | 1.2%(+3.78)#4,861 |
| 56. | Elnora | 4.9% | 1.1%(+3.80)#56 | 1.2%(+3.66)#4,946 |
| 57. | Orland | 4.9% | 1.1%(+3.80)#57 | 1.2%(+3.66)#4,947 |
| 58. | Remington | 4.8% | 1.1%(+3.78)#58 | 1.2%(+3.64)#4,964 |
| 59. | Laurel | 4.8% | 1.1%(+3.75)#59 | 1.2%(+3.61)#4,996 |
| 60. | Edwardsport | 4.7% | 1.1%(+3.67)#60 | 1.2%(+3.53)#5,070 |
| 61. | Dale | 4.6% | 1.1%(+3.56)#61 | 1.2%(+3.42)#5,141 |
| 62. | Hazleton | 4.5% | 1.1%(+3.49)#62 | 1.2%(+3.35)#5,211 |
| 63. | Knightstown | 4.5% | 1.1%(+3.45)#63 | 1.2%(+3.31)#5,259 |
| 64. | Chalmers | 4.5% | 1.1%(+3.45)#64 | 1.2%(+3.31)#5,260 |
| 65. | Tennyson | 4.5% | 1.1%(+3.42)#65 | 1.2%(+3.28)#5,285 |
| 66. | St Paul | 4.5% | 1.1%(+3.40)#66 | 1.2%(+3.26)#5,299 |
| 67. | Williamsport | 4.4% | 1.1%(+3.34)#67 | 1.2%(+3.20)#5,352 |
| 68. | Goodland | 4.4% | 1.1%(+3.32)#68 | 1.2%(+3.17)#5,383 |
| 69. | Milford | 4.3% | 1.1%(+3.29)#69 | 1.2%(+3.14)#5,431 |
| 70. | Monon | 4.3% | 1.1%(+3.27)#70 | 1.2%(+3.13)#5,444 |
| 71. | Wingate | 4.2% | 1.1%(+3.14)#71 | 1.2%(+3.00)#5,548 |
| 72. | Onward | 4.1% | 1.1%(+3.05)#72 | 1.2%(+2.91)#5,661 |
| 73. | Lynn | 4.1% | 1.1%(+3.03)#73 | 1.2%(+2.89)#5,682 |
| 74. | Flora | 4.0% | 1.1%(+2.98)#74 | 1.2%(+2.83)#5,727 |
| 75. | Borden | 4.0% | 1.1%(+2.92)#75 | 1.2%(+2.77)#5,792 |
| 76. | Saltillo | 4.0% | 1.1%(+2.90)#76 | 1.2%(+2.76)#5,810 |
| 77. | Rensselaer | 3.9% | 1.1%(+2.81)#77 | 1.2%(+2.67)#5,910 |
| 78. | Lake Santee | 3.8% | 1.1%(+2.78)#78 | 1.2%(+2.64)#5,956 |
| 79. | New Paris | 3.8% | 1.1%(+2.74)#79 | 1.2%(+2.60)#6,001 |
| 80. | Enchanted Hills | 3.8% | 1.1%(+2.72)#80 | 1.2%(+2.57)#6,029 |
| 81. | Ulen | 3.8% | 1.1%(+2.72)#81 | 1.2%(+2.57)#6,036 |
| 82. | Idaville | 3.6% | 1.1%(+2.58)#82 | 1.2%(+2.44)#6,210 |
| 83. | Chrisney | 3.5% | 1.1%(+2.41)#83 | 1.2%(+2.27)#6,400 |
| 84. | Patoka | 3.4% | 1.1%(+2.34)#84 | 1.2%(+2.20)#6,488 |
| 85. | Oaktown | 3.4% | 1.1%(+2.31)#85 | 1.2%(+2.16)#6,537 |
| 86. | Hartford City | 3.3% | 1.1%(+2.28)#86 | 1.2%(+2.14)#6,571 |
| 87. | Tell City | 3.2% | 1.1%(+2.18)#87 | 1.2%(+2.03)#6,718 |
| 88. | Winslow | 3.2% | 1.1%(+2.17)#88 | 1.2%(+2.03)#6,724 |
| 89. | Campbellsburg | 3.2% | 1.1%(+2.12)#89 | 1.2%(+1.98)#6,780 |
| 90. | Spencer | 3.1% | 1.1%(+2.06)#90 | 1.2%(+1.92)#6,870 |
| 91. | Crothersville | 3.1% | 1.1%(+2.05)#91 | 1.2%(+1.91)#6,887 |
| 92. | Dana | 3.1% | 1.1%(+2.00)#92 | 1.2%(+1.86)#6,961 |
| 93. | Bainbridge | 3.0% | 1.1%(+1.97)#93 | 1.2%(+1.83)#6,980 |
| 94. | Union City | 3.0% | 1.1%(+1.96)#94 | 1.2%(+1.81)#7,021 |
| 95. | Brook | 3.0% | 1.1%(+1.93)#95 | 1.2%(+1.79)#7,057 |
| 96. | Koontz Lake | 2.9% | 1.1%(+1.89)#96 | 1.2%(+1.75)#7,114 |
| 97. | Wheatland | 2.8% | 1.1%(+1.77)#97 | 1.2%(+1.63)#7,300 |
| 98. | Syracuse | 2.8% | 1.1%(+1.74)#98 | 1.2%(+1.60)#7,346 |
| 99. | Macy | 2.8% | 1.1%(+1.72)#99 | 1.2%(+1.58)#7,378 |
| 100. | Otterbein | 2.8% | 1.1%(+1.70)#100 | 1.2%(+1.56)#7,407 |
Common Questions
What are the Top 10 Cities with the Highest Percentage of Population Employed in Agriculture, Fishing & Hunting in Indiana?
Top 10 Cities with the Highest Percentage of Population Employed in Agriculture, Fishing & Hunting in Indiana are:
#1
54.8%
#2
36.8%
#3
20.5%
#4
17.9%
#5
15.8%
#6
14.5%
#7
14.3%
#8
13.5%
#9
12.8%
#10
12.3%
What city has the Highest Percentage of Population Employed in Agriculture, Fishing & Hunting in Indiana?
Owensburg has the Highest Percentage of Population Employed in Agriculture, Fishing & Hunting in Indiana with 54.8%.
What is the Percentage of Population Employed in Agriculture, Fishing & Hunting in the State of Indiana?
Percentage of Population Employed in Agriculture, Fishing & Hunting in Indiana is 1.1%.
What is the Percentage of Population Employed in Agriculture, Fishing & Hunting in the United States?
Percentage of Population Employed in Agriculture, Fishing & Hunting in the United States is 1.2%.