Cities with the Highest Child Poverty Level Among Boys Under the Age of 16 in Tennessee
RELATED REPORTS & OPTIONS
Highest Poverty | Boys 0-16
Tennessee
Compare Cities
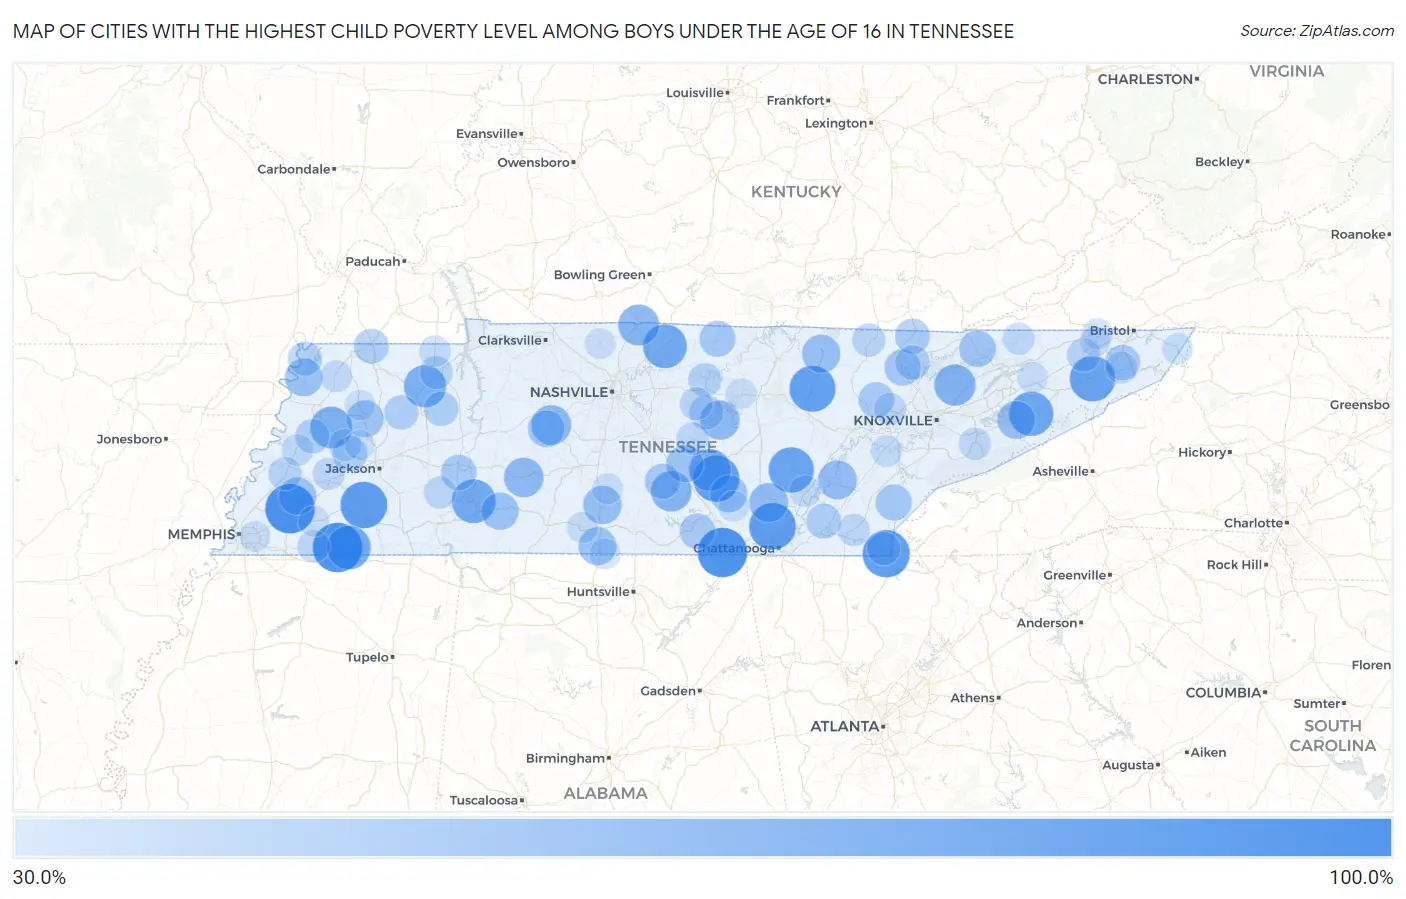
Map of Cities with the Highest Child Poverty Level Among Boys Under the Age of 16 in Tennessee
0.0%
100.0%
Cities with the Highest Child Poverty Level Among Boys Under the Age of 16 in Tennessee
| City | Child Poverty (Boys) | vs State | vs National | |
| 1. | Gallaway | 100.0% | 19.7%(+80.3)#1 | 16.9%(+83.1)#117 |
| 2. | Grand Junction | 100.0% | 19.7%(+80.3)#2 | 16.9%(+83.1)#186 |
| 3. | Nixon | 100.0% | 19.7%(+80.3)#3 | 16.9%(+83.1)#261 |
| 4. | Randolph | 100.0% | 19.7%(+80.3)#4 | 16.9%(+83.1)#364 |
| 5. | Farner | 100.0% | 19.7%(+80.3)#5 | 16.9%(+83.1)#471 |
| 6. | Orme | 100.0% | 19.7%(+80.3)#6 | 16.9%(+83.1)#620 |
| 7. | Copperhill | 92.3% | 19.7%(+72.6)#7 | 16.9%(+75.4)#696 |
| 8. | Lone Oak | 90.1% | 19.7%(+70.4)#8 | 16.9%(+73.2)#730 |
| 9. | Toone | 89.9% | 19.7%(+70.2)#9 | 16.9%(+73.0)#735 |
| 10. | Viola | 88.9% | 19.7%(+69.2)#10 | 16.9%(+72.0)#755 |
| 11. | Clarkrange | 88.0% | 19.7%(+68.3)#11 | 16.9%(+71.1)#768 |
| 12. | Telford | 86.3% | 19.7%(+66.5)#12 | 16.9%(+69.4)#810 |
| 13. | Pikeville | 85.4% | 19.7%(+65.7)#13 | 16.9%(+68.5)#829 |
| 14. | Parrottsville | 82.5% | 19.7%(+62.8)#14 | 16.9%(+65.6)#926 |
| 15. | Saulsbury | 81.1% | 19.7%(+61.4)#15 | 16.9%(+64.2)#975 |
| 16. | Clifton | 80.9% | 19.7%(+61.2)#16 | 16.9%(+64.0)#978 |
| 17. | Bethpage | 80.4% | 19.7%(+60.6)#17 | 16.9%(+63.5)#992 |
| 18. | John Sevier | 75.8% | 19.7%(+56.0)#18 | 16.9%(+58.9)#1,156 |
| 19. | Henry | 75.3% | 19.7%(+55.6)#19 | 16.9%(+58.4)#1,170 |
| 20. | Morrison | 74.4% | 19.7%(+54.7)#20 | 16.9%(+57.5)#1,222 |
| 21. | Friendship | 74.1% | 19.7%(+54.3)#21 | 16.9%(+57.2)#1,232 |
| 22. | Luttrell | 72.4% | 19.7%(+52.6)#22 | 16.9%(+55.5)#1,306 |
| 23. | Valley Forge | 71.5% | 19.7%(+51.8)#23 | 16.9%(+54.6)#1,339 |
| 24. | Mitchellville | 70.6% | 19.7%(+50.9)#24 | 16.9%(+53.7)#1,394 |
| 25. | Normandy | 70.0% | 19.7%(+50.3)#25 | 16.9%(+53.1)#1,426 |
| 26. | Bon Aqua Junction | 67.3% | 19.7%(+47.6)#26 | 16.9%(+50.4)#1,545 |
| 27. | Hohenwald | 66.4% | 19.7%(+46.7)#27 | 16.9%(+49.5)#1,623 |
| 28. | Smithville | 65.6% | 19.7%(+45.9)#28 | 16.9%(+48.7)#1,663 |
| 29. | Dunlap | 65.1% | 19.7%(+45.4)#29 | 16.9%(+48.2)#1,682 |
| 30. | Decatur | 63.6% | 19.7%(+43.9)#30 | 16.9%(+46.7)#1,775 |
| 31. | Cornersville | 62.9% | 19.7%(+43.2)#31 | 16.9%(+46.0)#1,812 |
| 32. | Jamestown | 61.9% | 19.7%(+42.1)#32 | 16.9%(+45.0)#1,876 |
| 33. | Newport | 61.3% | 19.7%(+41.6)#33 | 16.9%(+44.4)#1,916 |
| 34. | Hickman | 60.9% | 19.7%(+41.1)#34 | 16.9%(+44.0)#1,941 |
| 35. | Elkton | 60.5% | 19.7%(+40.8)#35 | 16.9%(+43.6)#1,963 |
| 36. | Ridgely | 59.9% | 19.7%(+40.2)#36 | 16.9%(+43.0)#2,022 |
| 37. | Mason | 59.8% | 19.7%(+40.1)#37 | 16.9%(+42.9)#2,026 |
| 38. | Waynesboro | 59.3% | 19.7%(+39.6)#38 | 16.9%(+42.4)#2,055 |
| 39. | Altamont | 58.9% | 19.7%(+39.2)#39 | 16.9%(+42.0)#2,081 |
| 40. | Lakewood Park | 58.6% | 19.7%(+38.8)#40 | 16.9%(+41.7)#2,113 |
| 41. | Trenton | 57.8% | 19.7%(+38.0)#41 | 16.9%(+40.9)#2,178 |
| 42. | Wrigley | 57.1% | 19.7%(+37.4)#42 | 16.9%(+40.2)#2,224 |
| 43. | Tazewell | 56.7% | 19.7%(+37.0)#43 | 16.9%(+39.8)#2,265 |
| 44. | Caryville | 55.5% | 19.7%(+35.7)#44 | 16.9%(+38.6)#2,368 |
| 45. | Tellico Plains | 55.2% | 19.7%(+35.4)#45 | 16.9%(+38.3)#2,382 |
| 46. | Red Boiling Springs | 54.7% | 19.7%(+35.0)#46 | 16.9%(+37.8)#2,421 |
| 47. | Petros | 53.3% | 19.7%(+33.6)#47 | 16.9%(+36.4)#2,552 |
| 48. | Cowan | 52.9% | 19.7%(+33.2)#48 | 16.9%(+36.0)#2,582 |
| 49. | Decaturville | 52.8% | 19.7%(+33.1)#49 | 16.9%(+35.9)#2,606 |
| 50. | Wartrace | 52.8% | 19.7%(+33.1)#50 | 16.9%(+35.9)#2,616 |
| 51. | Watauga | 52.5% | 19.7%(+32.8)#51 | 16.9%(+35.6)#2,635 |
| 52. | Jellico | 51.7% | 19.7%(+32.0)#52 | 16.9%(+34.8)#2,713 |
| 53. | Bells | 51.2% | 19.7%(+31.4)#53 | 16.9%(+34.2)#2,776 |
| 54. | Sullivan Gardens | 51.0% | 19.7%(+31.3)#54 | 16.9%(+34.1)#2,786 |
| 55. | Hopewell | 50.7% | 19.7%(+31.0)#55 | 16.9%(+33.8)#2,807 |
| 56. | South Fulton | 50.2% | 19.7%(+30.5)#56 | 16.9%(+33.3)#2,842 |
| 57. | La Follette | 50.1% | 19.7%(+30.4)#57 | 16.9%(+33.2)#2,847 |
| 58. | Hollow Rock | 50.0% | 19.7%(+30.3)#58 | 16.9%(+33.1)#2,872 |
| 59. | Trezevant | 49.5% | 19.7%(+29.8)#59 | 16.9%(+32.6)#3,010 |
| 60. | Gates | 49.2% | 19.7%(+29.5)#60 | 16.9%(+32.3)#3,032 |
| 61. | Dowelltown | 48.6% | 19.7%(+28.8)#61 | 16.9%(+31.7)#3,107 |
| 62. | Tiptonville | 48.4% | 19.7%(+28.7)#62 | 16.9%(+31.5)#3,123 |
| 63. | South Carthage | 47.0% | 19.7%(+27.3)#63 | 16.9%(+30.1)#3,308 |
| 64. | Fall Branch | 46.4% | 19.7%(+26.7)#64 | 16.9%(+29.5)#3,364 |
| 65. | Covington | 45.9% | 19.7%(+26.1)#65 | 16.9%(+28.9)#3,444 |
| 66. | Oneida | 45.8% | 19.7%(+26.0)#66 | 16.9%(+28.8)#3,451 |
| 67. | Paris | 45.6% | 19.7%(+25.9)#67 | 16.9%(+28.7)#3,471 |
| 68. | Ducktown | 45.5% | 19.7%(+25.7)#68 | 16.9%(+28.6)#3,494 |
| 69. | Alexandria | 44.4% | 19.7%(+24.7)#69 | 16.9%(+27.5)#3,646 |
| 70. | Rocky Top | 43.8% | 19.7%(+24.0)#70 | 16.9%(+26.8)#3,719 |
| 71. | Woodbury | 43.6% | 19.7%(+23.9)#71 | 16.9%(+26.7)#3,754 |
| 72. | Alamo | 43.4% | 19.7%(+23.7)#72 | 16.9%(+26.5)#3,781 |
| 73. | Moscow | 43.2% | 19.7%(+23.5)#73 | 16.9%(+26.3)#3,815 |
| 74. | Sardis | 43.1% | 19.7%(+23.4)#74 | 16.9%(+26.2)#3,828 |
| 75. | Pigeon Forge | 42.4% | 19.7%(+22.7)#75 | 16.9%(+25.5)#3,940 |
| 76. | Brownsville | 42.4% | 19.7%(+22.6)#76 | 16.9%(+25.5)#3,948 |
| 77. | Oliver Springs | 42.3% | 19.7%(+22.6)#77 | 16.9%(+25.4)#3,951 |
| 78. | Benton | 42.2% | 19.7%(+22.5)#78 | 16.9%(+25.3)#3,968 |
| 79. | Sneedville | 41.7% | 19.7%(+22.0)#79 | 16.9%(+24.8)#4,029 |
| 80. | Central | 41.5% | 19.7%(+21.8)#80 | 16.9%(+24.6)#4,086 |
| 81. | Ripley | 41.0% | 19.7%(+21.2)#81 | 16.9%(+24.1)#4,158 |
| 82. | Graysville | 40.5% | 19.7%(+20.8)#82 | 16.9%(+23.6)#4,210 |
| 83. | Obion | 40.5% | 19.7%(+20.8)#83 | 16.9%(+23.6)#4,211 |
| 84. | Puryear | 40.0% | 19.7%(+20.3)#84 | 16.9%(+23.1)#4,300 |
| 85. | Loudon | 39.6% | 19.7%(+19.9)#85 | 16.9%(+22.7)#4,397 |
| 86. | Pulaski | 38.7% | 19.7%(+19.0)#86 | 16.9%(+21.8)#4,550 |
| 87. | Blanche | 38.5% | 19.7%(+18.7)#87 | 16.9%(+21.6)#4,579 |
| 88. | Mountain City | 38.4% | 19.7%(+18.7)#88 | 16.9%(+21.5)#4,599 |
| 89. | Somerville | 38.3% | 19.7%(+18.5)#89 | 16.9%(+21.3)#4,627 |
| 90. | Ardmore | 38.2% | 19.7%(+18.5)#90 | 16.9%(+21.3)#4,636 |
| 91. | Lewisburg | 38.2% | 19.7%(+18.5)#91 | 16.9%(+21.3)#4,637 |
| 92. | Memphis | 38.0% | 19.7%(+18.2)#92 | 16.9%(+21.0)#4,681 |
| 93. | Bloomingdale | 37.8% | 19.7%(+18.1)#93 | 16.9%(+20.9)#4,710 |
| 94. | Springfield | 37.8% | 19.7%(+18.1)#94 | 16.9%(+20.9)#4,713 |
| 95. | Coalmont | 37.7% | 19.7%(+17.9)#95 | 16.9%(+20.8)#4,737 |
| 96. | Baxter | 37.3% | 19.7%(+17.6)#96 | 16.9%(+20.4)#4,802 |
| 97. | Bulls Gap | 37.3% | 19.7%(+17.6)#97 | 16.9%(+20.4)#4,804 |
| 98. | Dyer | 37.0% | 19.7%(+17.3)#98 | 16.9%(+20.1)#4,857 |
| 99. | Kingsport | 36.6% | 19.7%(+16.9)#99 | 16.9%(+19.7)#4,936 |
| 100. | Gadsden | 35.7% | 19.7%(+16.0)#100 | 16.9%(+18.8)#5,126 |
Common Questions
What are the Top 10 Cities with the Highest Child Poverty Level Among Boys Under the Age of 16 in Tennessee?
Top 10 Cities with the Highest Child Poverty Level Among Boys Under the Age of 16 in Tennessee are:
#1
100.0%
#2
100.0%
#3
100.0%
#4
92.3%
#5
90.1%
#6
89.9%
#7
88.9%
#8
88.0%
#9
86.3%
#10
85.4%
What city has the Highest Child Poverty Level Among Boys Under the Age of 16 in Tennessee?
Gallaway has the Highest Child Poverty Level Among Boys Under the Age of 16 in Tennessee with 100.0%.
What is the Poverty Level Among Boys Under the Age of 16 in the State of Tennessee?
Poverty Level Among Boys Under the Age of 16 in Tennessee is 19.7%.
What is the Poverty Level Among Boys Under the Age of 16 in the United States?
Poverty Level Among Boys Under the Age of 16 in the United States is 16.9%.