Cities with the Highest Child Poverty Level Among Boys Under the Age of 16 in Kentucky
RELATED REPORTS & OPTIONS
Highest Poverty | Boys 0-16
Kentucky
Compare Cities
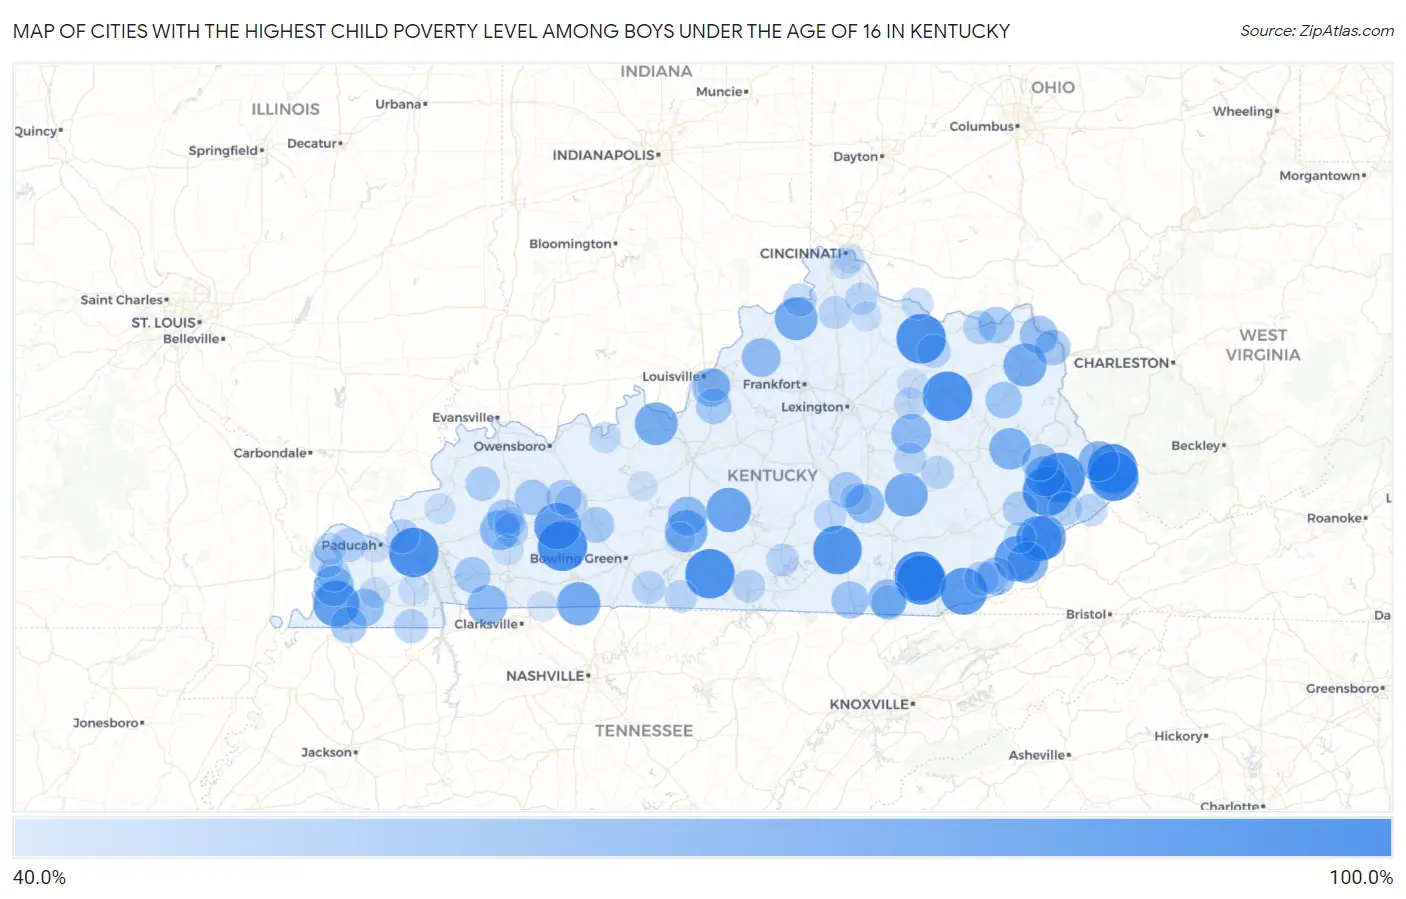
Map of Cities with the Highest Child Poverty Level Among Boys Under the Age of 16 in Kentucky
0.0%
100.0%
Cities with the Highest Child Poverty Level Among Boys Under the Age of 16 in Kentucky
| City | Child Poverty (Boys) | vs State | vs National | |
| 1. | Barbourville | 100.0% | 21.1%(+78.9)#1 | 16.9%(+83.1)#1 |
| 2. | Artemus | 100.0% | 21.1%(+78.9)#2 | 16.9%(+83.1)#111 |
| 3. | Betsy Layne | 100.0% | 21.1%(+78.9)#3 | 16.9%(+83.1)#119 |
| 4. | Mcdowell | 100.0% | 21.1%(+78.9)#4 | 16.9%(+83.1)#155 |
| 5. | Salt Lick | 100.0% | 21.1%(+78.9)#5 | 16.9%(+83.1)#210 |
| 6. | Summer Shade | 100.0% | 21.1%(+78.9)#6 | 16.9%(+83.1)#255 |
| 7. | Gilbertsville | 100.0% | 21.1%(+78.9)#7 | 16.9%(+83.1)#296 |
| 8. | Mccarr | 100.0% | 21.1%(+78.9)#8 | 16.9%(+83.1)#301 |
| 9. | Dunmor | 100.0% | 21.1%(+78.9)#9 | 16.9%(+83.1)#334 |
| 10. | Freeburn | 100.0% | 21.1%(+78.9)#10 | 16.9%(+83.1)#477 |
| 11. | Mays Lick | 100.0% | 21.1%(+78.9)#11 | 16.9%(+83.1)#507 |
| 12. | Ferguson | 96.9% | 21.1%(+75.7)#12 | 16.9%(+80.0)#665 |
| 13. | Pathfork | 92.9% | 21.1%(+71.7)#13 | 16.9%(+76.0)#690 |
| 14. | Drakesboro | 90.9% | 21.1%(+69.8)#14 | 16.9%(+74.0)#716 |
| 15. | Clinton | 89.7% | 21.1%(+68.6)#15 | 16.9%(+72.8)#736 |
| 16. | Cumberland | 88.3% | 21.1%(+67.2)#16 | 16.9%(+71.4)#763 |
| 17. | Whitesburg | 87.7% | 21.1%(+66.6)#17 | 16.9%(+70.8)#772 |
| 18. | Summersville | 84.8% | 21.1%(+63.7)#18 | 16.9%(+67.9)#847 |
| 19. | Mayking | 84.3% | 21.1%(+63.2)#19 | 16.9%(+67.4)#860 |
| 20. | Adairville | 81.4% | 21.1%(+60.2)#20 | 16.9%(+64.5)#964 |
| 21. | Grayson | 80.7% | 21.1%(+59.6)#21 | 16.9%(+63.8)#984 |
| 22. | Mckee | 80.6% | 21.1%(+59.5)#22 | 16.9%(+63.7)#986 |
| 23. | Sanders | 80.0% | 21.1%(+58.9)#23 | 16.9%(+63.1)#998 |
| 24. | Ekron | 80.0% | 21.1%(+58.9)#24 | 16.9%(+63.1)#1,003 |
| 25. | Horse Cave | 78.4% | 21.1%(+57.3)#25 | 16.9%(+61.5)#1,072 |
| 26. | Salyersville | 76.0% | 21.1%(+54.8)#26 | 16.9%(+59.1)#1,152 |
| 27. | Lynch | 75.0% | 21.1%(+53.9)#27 | 16.9%(+58.1)#1,176 |
| 28. | South Williamson | 72.7% | 21.1%(+51.6)#28 | 16.9%(+55.8)#1,290 |
| 29. | Martin | 71.9% | 21.1%(+50.7)#29 | 16.9%(+55.0)#1,326 |
| 30. | Arlington | 71.4% | 21.1%(+50.3)#30 | 16.9%(+54.5)#1,344 |
| 31. | Lafayette | 71.4% | 21.1%(+50.3)#31 | 16.9%(+54.5)#1,347 |
| 32. | St Charles | 71.0% | 21.1%(+49.8)#32 | 16.9%(+54.1)#1,374 |
| 33. | Clay City | 70.2% | 21.1%(+49.0)#33 | 16.9%(+53.3)#1,412 |
| 34. | Munfordville | 68.6% | 21.1%(+47.4)#34 | 16.9%(+51.7)#1,487 |
| 35. | Smithfield | 67.9% | 21.1%(+46.7)#35 | 16.9%(+51.0)#1,521 |
| 36. | Mount Vernon | 67.8% | 21.1%(+46.7)#36 | 16.9%(+50.9)#1,523 |
| 37. | Emlyn | 67.2% | 21.1%(+46.0)#37 | 16.9%(+50.3)#1,552 |
| 38. | Evarts | 65.7% | 21.1%(+44.6)#38 | 16.9%(+48.8)#1,653 |
| 39. | Poplar Hills | 65.7% | 21.1%(+44.6)#39 | 16.9%(+48.8)#1,654 |
| 40. | Greenup | 65.5% | 21.1%(+44.4)#40 | 16.9%(+48.6)#1,669 |
| 41. | Wingo | 64.2% | 21.1%(+43.0)#41 | 16.9%(+47.2)#1,739 |
| 42. | Stearns | 63.1% | 21.1%(+42.0)#42 | 16.9%(+46.2)#1,799 |
| 43. | Prestonsburg | 61.5% | 21.1%(+40.4)#43 | 16.9%(+44.6)#1,901 |
| 44. | Sandy Hook | 61.1% | 21.1%(+40.0)#44 | 16.9%(+44.2)#1,926 |
| 45. | Fulton | 60.8% | 21.1%(+39.7)#45 | 16.9%(+43.9)#1,944 |
| 46. | Garrison | 60.7% | 21.1%(+39.6)#46 | 16.9%(+43.8)#1,947 |
| 47. | Earlington | 60.0% | 21.1%(+38.9)#47 | 16.9%(+43.1)#1,983 |
| 48. | Cadiz | 59.8% | 21.1%(+38.6)#48 | 16.9%(+42.9)#2,028 |
| 49. | Ironville | 59.4% | 21.1%(+38.3)#49 | 16.9%(+42.5)#2,051 |
| 50. | Crab Orchard | 59.2% | 21.1%(+38.1)#50 | 16.9%(+42.3)#2,064 |
| 51. | Morgantown | 58.8% | 21.1%(+37.7)#51 | 16.9%(+41.9)#2,085 |
| 52. | Hebron Estates | 58.6% | 21.1%(+37.4)#52 | 16.9%(+41.7)#2,114 |
| 53. | Sacramento | 58.5% | 21.1%(+37.3)#53 | 16.9%(+41.6)#2,124 |
| 54. | Centertown | 57.5% | 21.1%(+36.4)#54 | 16.9%(+40.6)#2,193 |
| 55. | Pleasant View | 56.9% | 21.1%(+35.8)#55 | 16.9%(+40.0)#2,249 |
| 56. | Hindman | 55.6% | 21.1%(+34.4)#56 | 16.9%(+38.7)#2,351 |
| 57. | Harlan | 54.7% | 21.1%(+33.5)#57 | 16.9%(+37.8)#2,427 |
| 58. | Dixon | 54.4% | 21.1%(+33.3)#58 | 16.9%(+37.5)#2,462 |
| 59. | Kevil | 54.3% | 21.1%(+33.1)#59 | 16.9%(+37.4)#2,472 |
| 60. | Hazel | 53.8% | 21.1%(+32.7)#60 | 16.9%(+36.9)#2,504 |
| 61. | Smithland | 53.8% | 21.1%(+32.7)#61 | 16.9%(+36.9)#2,509 |
| 62. | Nortonville | 53.6% | 21.1%(+32.4)#62 | 16.9%(+36.7)#2,531 |
| 63. | Vanceburg | 52.8% | 21.1%(+31.6)#63 | 16.9%(+35.9)#2,615 |
| 64. | Virgie | 52.4% | 21.1%(+31.3)#64 | 16.9%(+35.5)#2,644 |
| 65. | Bardwell | 52.2% | 21.1%(+31.0)#65 | 16.9%(+35.3)#2,670 |
| 66. | Wickliffe | 52.2% | 21.1%(+31.0)#66 | 16.9%(+35.3)#2,671 |
| 67. | Scottsville | 52.0% | 21.1%(+30.9)#67 | 16.9%(+35.1)#2,684 |
| 68. | Flemingsburg | 51.9% | 21.1%(+30.7)#68 | 16.9%(+35.0)#2,699 |
| 69. | Warsaw | 51.8% | 21.1%(+30.7)#69 | 16.9%(+34.9)#2,703 |
| 70. | Burkesville | 51.2% | 21.1%(+30.1)#70 | 16.9%(+34.3)#2,766 |
| 71. | Beattyville | 51.2% | 21.1%(+30.0)#71 | 16.9%(+34.3)#2,770 |
| 72. | West Buechel | 50.7% | 21.1%(+29.5)#72 | 16.9%(+33.8)#2,809 |
| 73. | Dry Ridge | 50.4% | 21.1%(+29.2)#73 | 16.9%(+33.5)#2,833 |
| 74. | Jamestown | 50.0% | 21.1%(+28.9)#74 | 16.9%(+33.1)#2,852 |
| 75. | Ravenna | 50.0% | 21.1%(+28.9)#75 | 16.9%(+33.1)#2,878 |
| 76. | Ages | 50.0% | 21.1%(+28.9)#76 | 16.9%(+33.1)#2,900 |
| 77. | Mchenry | 50.0% | 21.1%(+28.9)#77 | 16.9%(+33.1)#2,902 |
| 78. | Fountain Run | 50.0% | 21.1%(+28.9)#78 | 16.9%(+33.1)#2,920 |
| 79. | Elkhorn City | 49.2% | 21.1%(+28.1)#79 | 16.9%(+32.3)#3,031 |
| 80. | Eubank | 49.0% | 21.1%(+27.8)#80 | 16.9%(+32.1)#3,057 |
| 81. | Brodhead | 48.9% | 21.1%(+27.8)#81 | 16.9%(+32.0)#3,068 |
| 82. | Mount Sterling | 48.8% | 21.1%(+27.7)#82 | 16.9%(+31.9)#3,077 |
| 83. | Butler | 48.6% | 21.1%(+27.5)#83 | 16.9%(+31.7)#3,096 |
| 84. | Barlow | 47.7% | 21.1%(+26.5)#84 | 16.9%(+30.8)#3,211 |
| 85. | Dover | 47.4% | 21.1%(+26.2)#85 | 16.9%(+30.5)#3,249 |
| 86. | Mortons Gap | 47.1% | 21.1%(+25.9)#86 | 16.9%(+30.2)#3,286 |
| 87. | Cloverport | 46.7% | 21.1%(+25.6)#87 | 16.9%(+29.8)#3,337 |
| 88. | Blackey | 46.2% | 21.1%(+25.0)#88 | 16.9%(+29.3)#3,409 |
| 89. | Hardin | 45.0% | 21.1%(+23.9)#89 | 16.9%(+28.1)#3,562 |
| 90. | Crofton | 45.0% | 21.1%(+23.9)#90 | 16.9%(+28.1)#3,563 |
| 91. | Mayfield | 44.8% | 21.1%(+23.6)#91 | 16.9%(+27.9)#3,590 |
| 92. | Covington | 44.6% | 21.1%(+23.5)#92 | 16.9%(+27.7)#3,604 |
| 93. | Cave City | 44.5% | 21.1%(+23.4)#93 | 16.9%(+27.6)#3,613 |
| 94. | Marion | 44.3% | 21.1%(+23.1)#94 | 16.9%(+27.4)#3,652 |
| 95. | Sharpsburg | 43.8% | 21.1%(+22.6)#95 | 16.9%(+26.8)#3,726 |
| 96. | Guthrie | 43.5% | 21.1%(+22.4)#96 | 16.9%(+26.6)#3,758 |
| 97. | Falmouth | 43.4% | 21.1%(+22.3)#97 | 16.9%(+26.5)#3,775 |
| 98. | Southgate | 43.1% | 21.1%(+22.0)#98 | 16.9%(+26.2)#3,829 |
| 99. | Leitchfield | 42.7% | 21.1%(+21.5)#99 | 16.9%(+25.8)#3,910 |
| 100. | Paducah | 42.3% | 21.1%(+21.1)#100 | 16.9%(+25.4)#3,961 |
Common Questions
What are the Top 10 Cities with the Highest Child Poverty Level Among Boys Under the Age of 16 in Kentucky?
Top 10 Cities with the Highest Child Poverty Level Among Boys Under the Age of 16 in Kentucky are:
#1
100.0%
#2
100.0%
#3
100.0%
#4
100.0%
#5
100.0%
#6
100.0%
#7
100.0%
#8
100.0%
#9
100.0%
#10
100.0%
What city has the Highest Child Poverty Level Among Boys Under the Age of 16 in Kentucky?
Barbourville has the Highest Child Poverty Level Among Boys Under the Age of 16 in Kentucky with 100.0%.
What is the Poverty Level Among Boys Under the Age of 16 in the State of Kentucky?
Poverty Level Among Boys Under the Age of 16 in Kentucky is 21.1%.
What is the Poverty Level Among Boys Under the Age of 16 in the United States?
Poverty Level Among Boys Under the Age of 16 in the United States is 16.9%.