Zip Codes with the Highest Percentage of Population Enrolled in Private School in Quincy, IL
RELATED REPORTS & OPTIONS
In Private School
Quincy
Compare Zip Codes
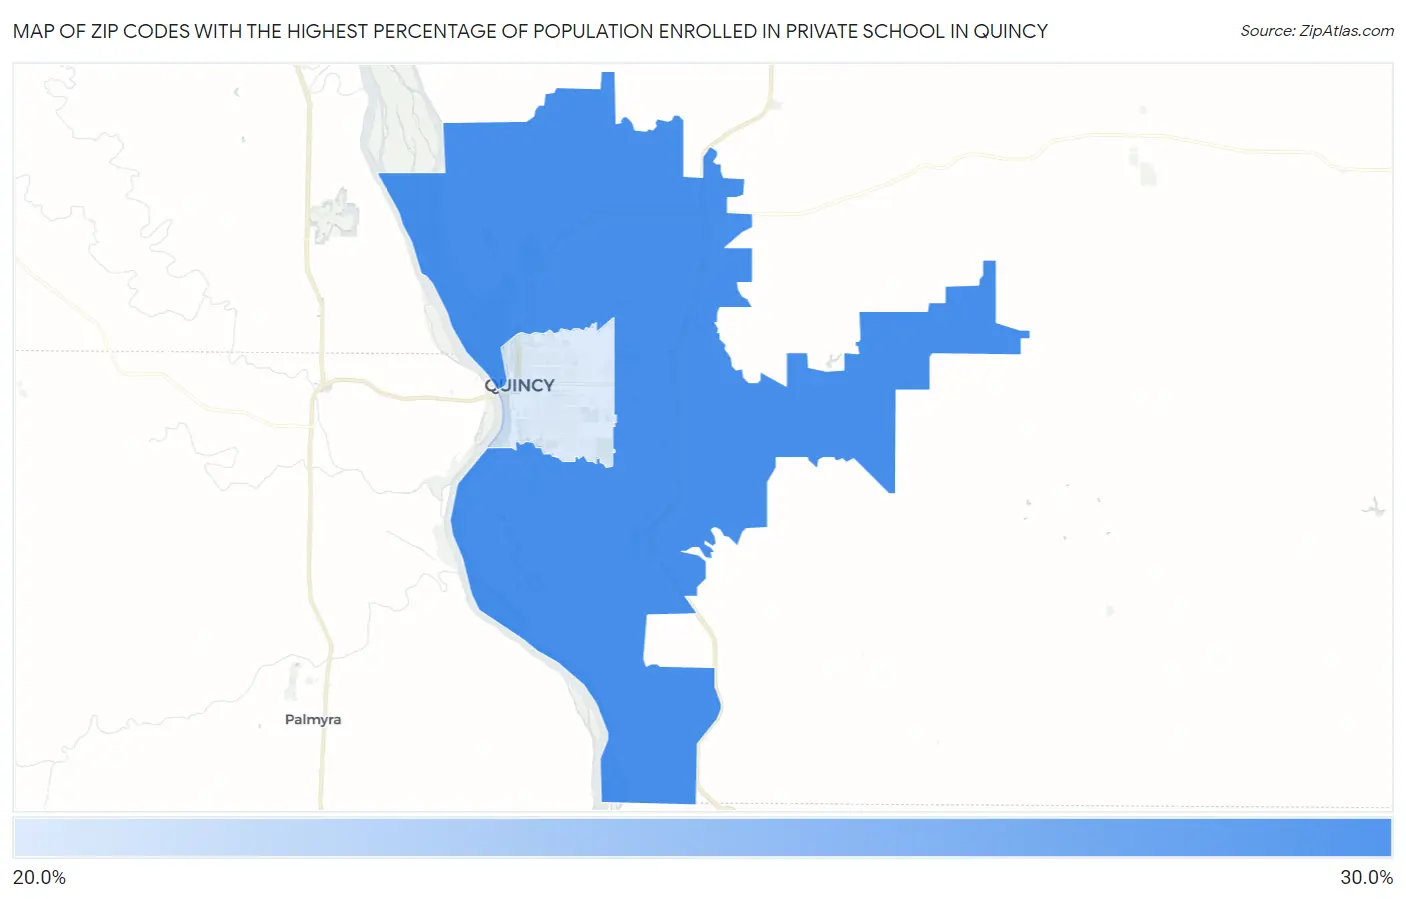
Map of Zip Codes with the Highest Percentage of Population Enrolled in Private School in Quincy
0.0%
30.0%
Zip Codes with the Highest Percentage of Population Enrolled in Private School in Quincy, IL
| Zip Code | % in Private School | vs State | vs National | |
| 1. | 62305 | 25.7% | 19.3%(+6.40)#180 | 17.3%(+8.40)#5,030 |
| 2. | 62301 | 21.6% | 19.3%(+2.30)#280 | 17.3%(+4.30)#7,238 |
1
Common Questions
What are the Top Zip Codes with the Highest Percentage of Population Enrolled in Private School in Quincy, IL?
Top Zip Codes with the Highest Percentage of Population Enrolled in Private School in Quincy, IL are:
What zip code has the Highest Percentage of Population Enrolled in Private School in Quincy, IL?
62305 has the Highest Percentage of Population Enrolled in Private School in Quincy, IL with 25.7%.
What is the Percentage of Population Enrolled in Private School in Quincy, IL?
Percentage of Population Enrolled in Private School in Quincy is 22.6%.
What is the Percentage of Population Enrolled in Private School in Illinois?
Percentage of Population Enrolled in Private School in Illinois is 19.3%.
What is the Percentage of Population Enrolled in Private School in the United States?
Percentage of Population Enrolled in Private School in the United States is 17.3%.