San Benito, TX
San Benito Map
San Benito Overview
24,766
TOTAL POPULATION
12,546
MALE POPULATION
12,220
FEMALE POPULATION
102.67
MALES / 100 FEMALES
97.40
FEMALES / 100 MALES
31.5
MEDIAN AGE
3.8
AVG FAMILY SIZE
3.1
AVG HOUSEHOLD SIZE
$17,550
PER CAPITA INCOME
$42,707
AVG FAMILY INCOME
$38,100
AVG HOUSEHOLD INCOME
6.3%
WAGE / INCOME GAP [ % ]
93.7¢/ $1
WAGE / INCOME GAP [ $ ]
$11,187
FAMILY INCOME DEFICIT
0.44
INEQUALITY / GINI INDEX
9,057
LABOR FORCE [ PEOPLE ]
50.3%
PERCENT IN LABOR FORCE
5.3%
UNEMPLOYMENT RATE
San Benito Zip Codes
San Benito Area Codes
Race in San Benito
The most populous races in San Benito are Hispanic or Latino (22,798 | 92.0%), White / Caucasian (15,208 | 61.4%), and Two or more Races (7,845 | 31.7%).
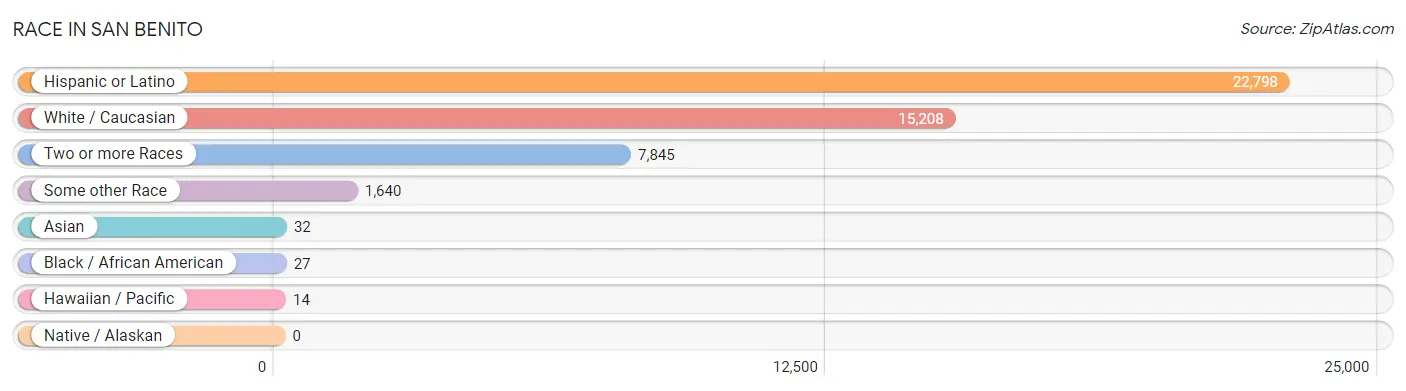
| Race | # Population | % Population |
| Asian | 32 | 0.1% |
| Black / African American | 27 | 0.1% |
| Hawaiian / Pacific | 14 | 0.1% |
| Hispanic or Latino | 22,798 | 92.0% |
| Native / Alaskan | 0 | 0.0% |
| White / Caucasian | 15,208 | 61.4% |
| Two or more Races | 7,845 | 31.7% |
| Some other Race | 1,640 | 6.6% |
| Total | 24,766 | 100.0% |
Ancestry in San Benito
The most populous ancestries reported in San Benito are Mexican (21,851 | 88.2%), English (314 | 1.3%), American (238 | 1.0%), German (228 | 0.9%), and Central American (226 | 0.9%), together accounting for 92.3% of all San Benito residents.
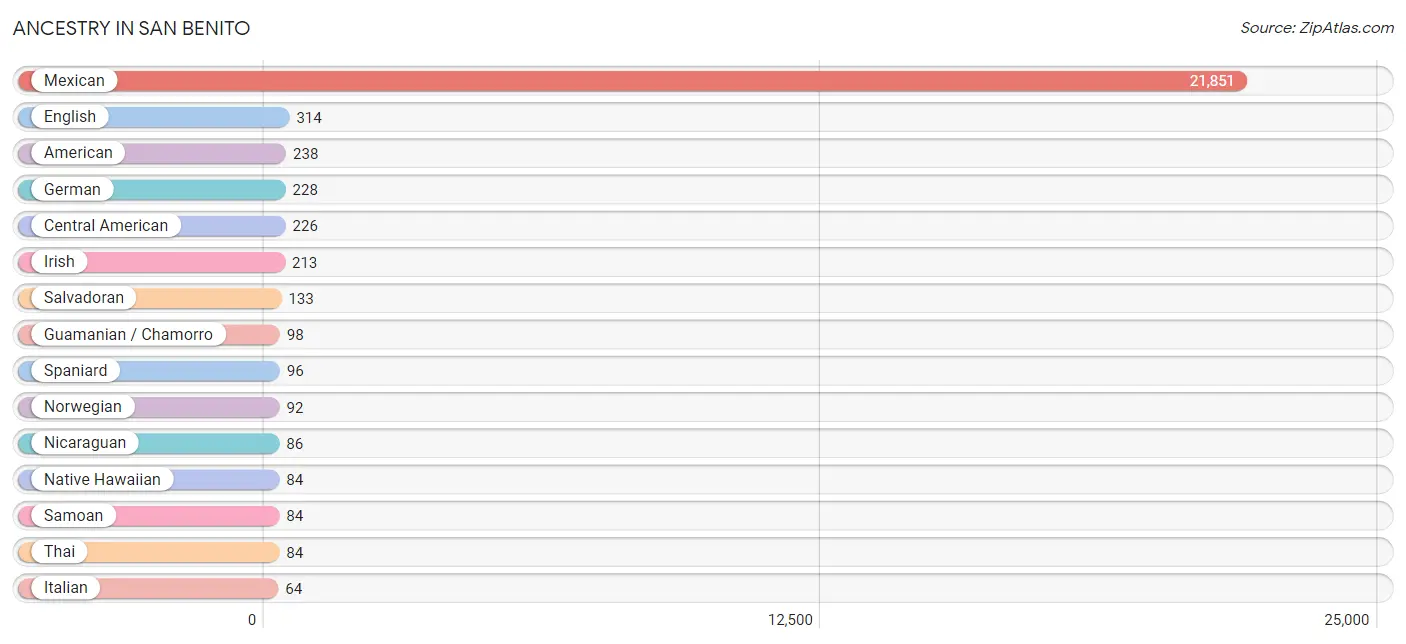
| Ancestry | # Population | % Population |
| American | 238 | 1.0% |
| Central American | 226 | 0.9% |
| Cherokee | 8 | 0.0% |
| Chickasaw | 37 | 0.2% |
| Comanche | 6 | 0.0% |
| Czech | 8 | 0.0% |
| Dutch | 21 | 0.1% |
| English | 314 | 1.3% |
| French | 33 | 0.1% |
| German | 228 | 0.9% |
| Ghanaian | 14 | 0.1% |
| Guamanian / Chamorro | 98 | 0.4% |
| Guatemalan | 5 | 0.0% |
| Honduran | 2 | 0.0% |
| Hungarian | 11 | 0.0% |
| Indian (Asian) | 32 | 0.1% |
| Irish | 213 | 0.9% |
| Italian | 64 | 0.3% |
| Korean | 36 | 0.2% |
| Lithuanian | 5 | 0.0% |
| Mexican | 21,851 | 88.2% |
| Native Hawaiian | 84 | 0.3% |
| Nicaraguan | 86 | 0.4% |
| Northern European | 53 | 0.2% |
| Norwegian | 92 | 0.4% |
| Polish | 13 | 0.1% |
| Portuguese | 8 | 0.0% |
| Puerto Rican | 57 | 0.2% |
| Salvadoran | 133 | 0.5% |
| Samoan | 84 | 0.3% |
| Scotch-Irish | 17 | 0.1% |
| Scottish | 26 | 0.1% |
| Spaniard | 96 | 0.4% |
| Spanish | 20 | 0.1% |
| Subsaharan African | 14 | 0.1% |
| Swedish | 42 | 0.2% |
| Thai | 84 | 0.3% | View All 37 Rows |
Immigrants in San Benito
The most numerous immigrant groups reported in San Benito came from Central America (4,150 | 16.8%), Latin America (4,150 | 16.8%), Mexico (3,954 | 16.0%), El Salvador (95 | 0.4%), and Nicaragua (86 | 0.4%), together accounting for 50.2% of all San Benito residents.
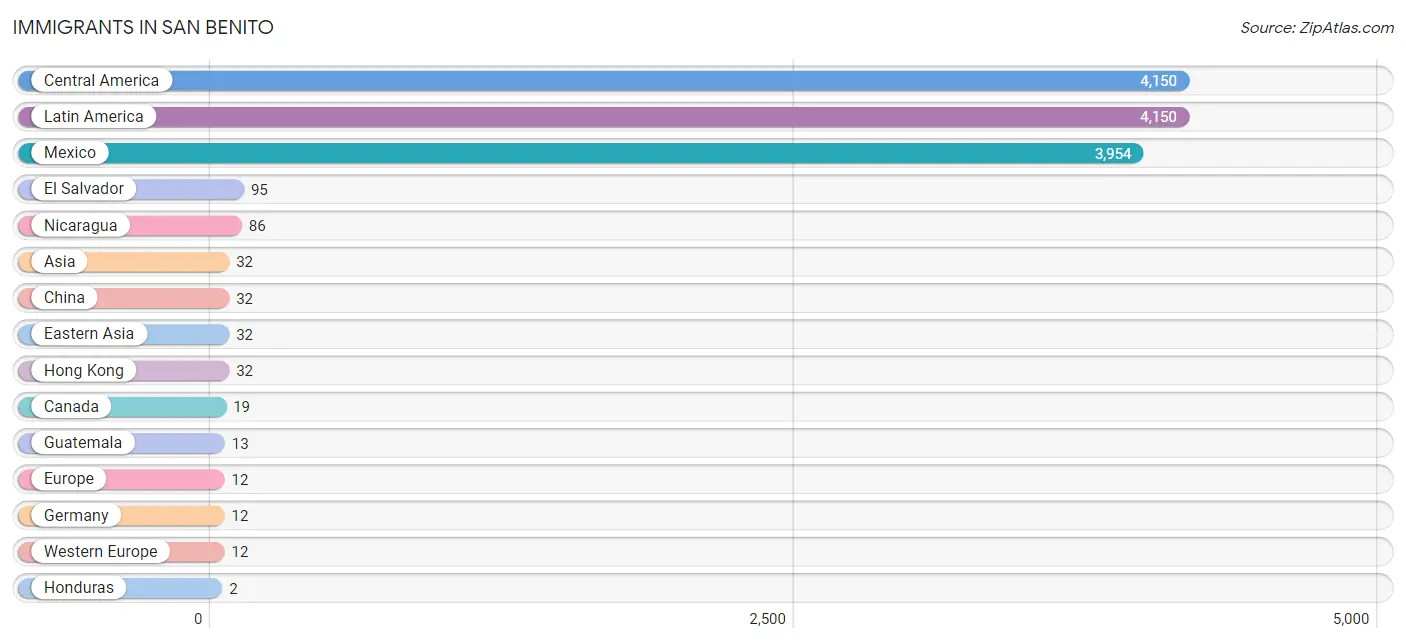
| Immigration Origin | # Population | % Population |
| Asia | 32 | 0.1% |
| Canada | 19 | 0.1% |
| Central America | 4,150 | 16.8% |
| China | 32 | 0.1% |
| Eastern Asia | 32 | 0.1% |
| El Salvador | 95 | 0.4% |
| Europe | 12 | 0.1% |
| Germany | 12 | 0.1% |
| Guatemala | 13 | 0.1% |
| Honduras | 2 | 0.0% |
| Hong Kong | 32 | 0.1% |
| Latin America | 4,150 | 16.8% |
| Mexico | 3,954 | 16.0% |
| Nicaragua | 86 | 0.4% |
| Western Europe | 12 | 0.1% | View All 15 Rows |
Sex and Age in San Benito
Sex and Age in San Benito
The most populous age groups in San Benito are 5 to 9 Years (1,413 | 11.3%) for men and 15 to 19 Years (1,219 | 10.0%) for women.
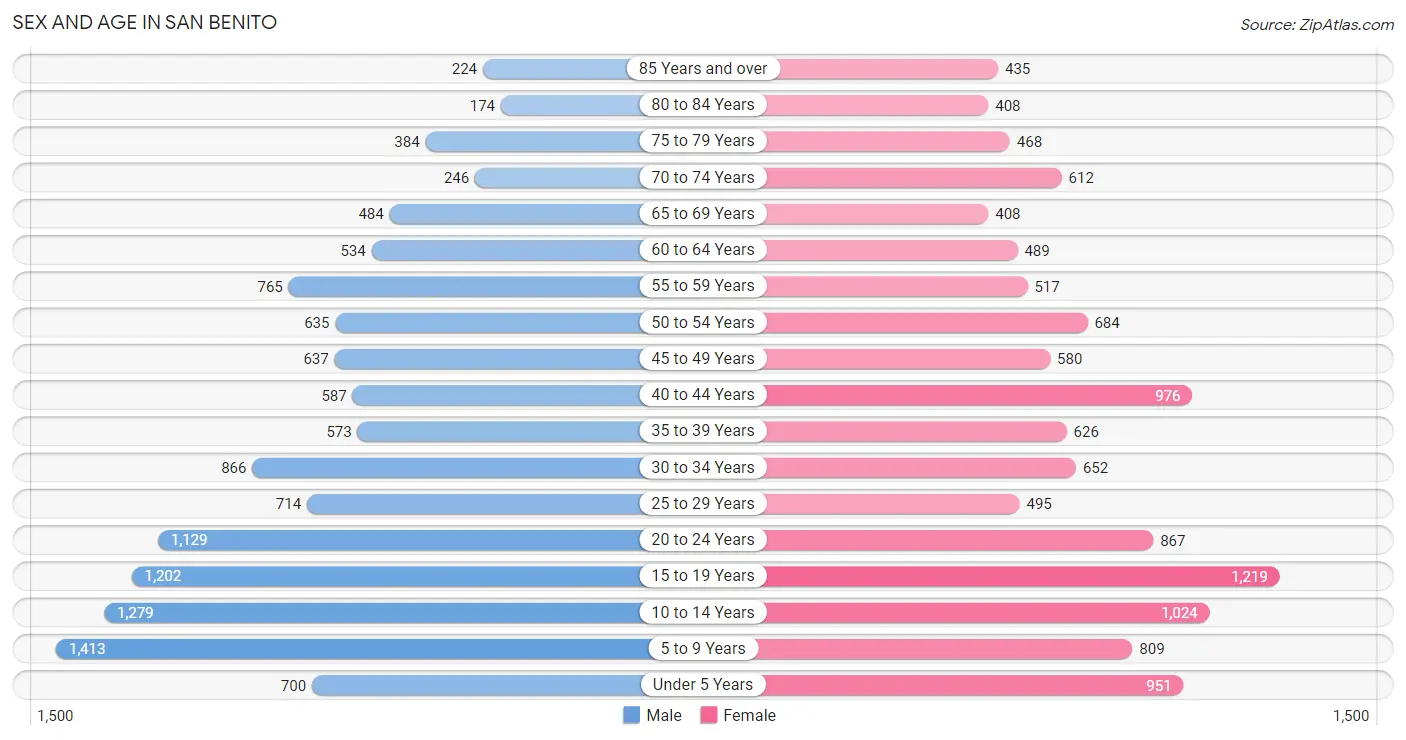
| Age Bracket | Male | Female |
| Under 5 Years | 700 (5.6%) | 951 (7.8%) |
| 5 to 9 Years | 1,413 (11.3%) | 809 (6.6%) |
| 10 to 14 Years | 1,279 (10.2%) | 1,024 (8.4%) |
| 15 to 19 Years | 1,202 (9.6%) | 1,219 (10.0%) |
| 20 to 24 Years | 1,129 (9.0%) | 867 (7.1%) |
| 25 to 29 Years | 714 (5.7%) | 495 (4.1%) |
| 30 to 34 Years | 866 (6.9%) | 652 (5.3%) |
| 35 to 39 Years | 573 (4.6%) | 626 (5.1%) |
| 40 to 44 Years | 587 (4.7%) | 976 (8.0%) |
| 45 to 49 Years | 637 (5.1%) | 580 (4.8%) |
| 50 to 54 Years | 635 (5.1%) | 684 (5.6%) |
| 55 to 59 Years | 765 (6.1%) | 517 (4.2%) |
| 60 to 64 Years | 534 (4.3%) | 489 (4.0%) |
| 65 to 69 Years | 484 (3.9%) | 408 (3.3%) |
| 70 to 74 Years | 246 (2.0%) | 612 (5.0%) |
| 75 to 79 Years | 384 (3.1%) | 468 (3.8%) |
| 80 to 84 Years | 174 (1.4%) | 408 (3.3%) |
| 85 Years and over | 224 (1.8%) | 435 (3.6%) |
| Total | 12,546 (100.0%) | 12,220 (100.0%) |
Families and Households in San Benito
Median Family Size in San Benito
The median family size in San Benito is 3.79 persons per family, with married-couple families (3,482 | 60.4%) accounting for the largest median family size of 3.96 persons per family. On the other hand, single male/father families (754 | 13.1%) represent the smallest median family size with 3.06 persons per family.
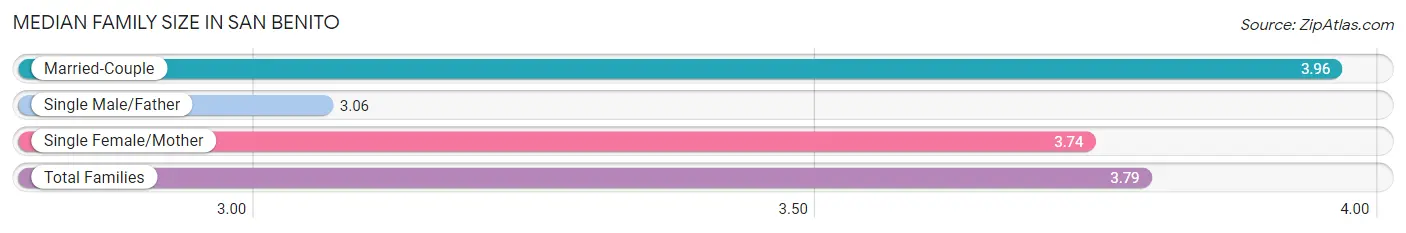
| Family Type | # Families | Family Size |
| Married-Couple | 3,482 (60.4%) | 3.96 |
| Single Male/Father | 754 (13.1%) | 3.06 |
| Single Female/Mother | 1,531 (26.6%) | 3.74 |
| Total Families | 5,767 (100.0%) | 3.79 |
Median Household Size in San Benito
The median household size in San Benito is 3.14 persons per household, with married-couple households (3,482 | 44.5%) accounting for the largest median household size of 3.99 persons per household. non-family households (2,055 | 26.3%) represent the smallest median household size with 1.15 persons per household.
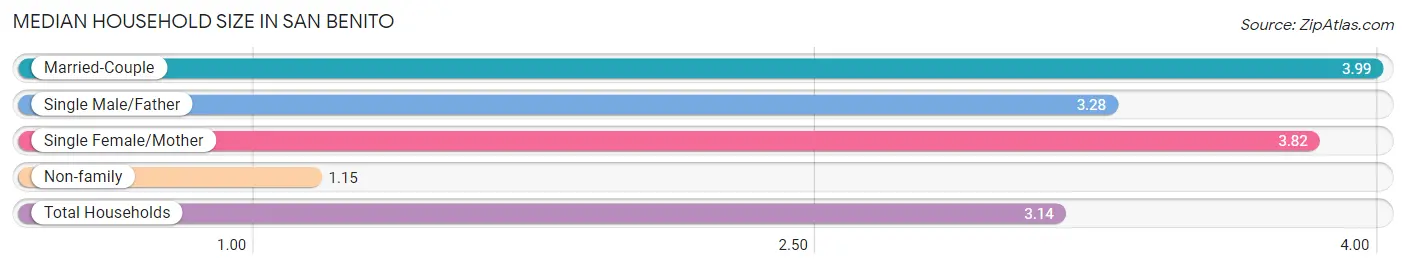
| Household Type | # Households | Household Size |
| Married-Couple | 3,482 (44.5%) | 3.99 |
| Single Male/Father | 754 (9.6%) | 3.28 |
| Single Female/Mother | 1,531 (19.6%) | 3.82 |
| Non-family | 2,055 (26.3%) | 1.15 |
| Total Households | 7,822 (100.0%) | 3.14 |
Household Size by Marriage Status in San Benito
Out of a total of 7,822 households in San Benito, 5,767 (73.7%) are family households, while 2,055 (26.3%) are nonfamily households. The most numerous type of family households are 2-person households, comprising 2,184, and the most common type of nonfamily households are 1-person households, comprising 1,885.
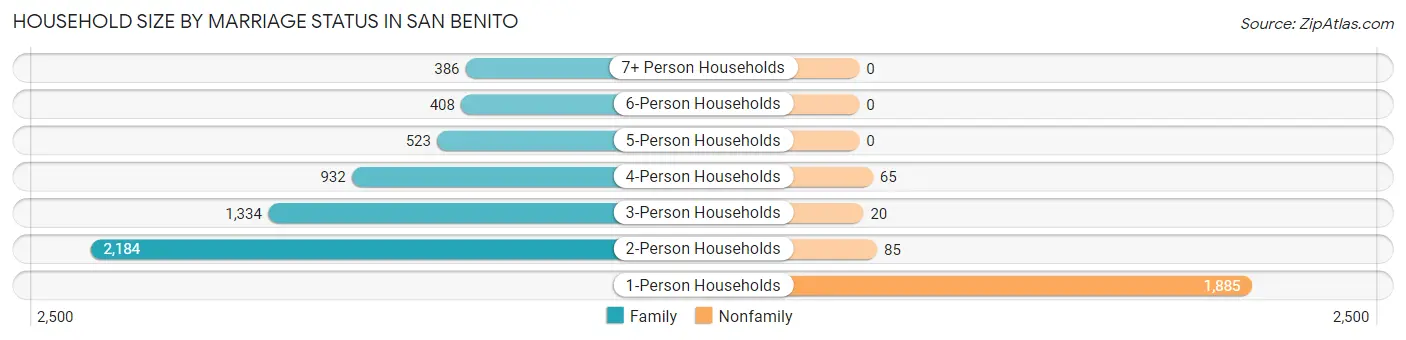
| Household Size | Family Households | Nonfamily Households |
| 1-Person Households | - | 1,885 (24.1%) |
| 2-Person Households | 2,184 (27.9%) | 85 (1.1%) |
| 3-Person Households | 1,334 (17.1%) | 20 (0.3%) |
| 4-Person Households | 932 (11.9%) | 65 (0.8%) |
| 5-Person Households | 523 (6.7%) | 0 (0.0%) |
| 6-Person Households | 408 (5.2%) | 0 (0.0%) |
| 7+ Person Households | 386 (4.9%) | 0 (0.0%) |
| Total | 5,767 (73.7%) | 2,055 (26.3%) |
Female Fertility in San Benito
Fertility by Age in San Benito
Average fertility rate in San Benito is 21.0 births per 1,000 women. Women in the age bracket of 20 to 34 years have the highest fertility rate with 34.0 births per 1,000 women. Women in the age bracket of 20 to 34 years acount for 59.1% of all women with births.
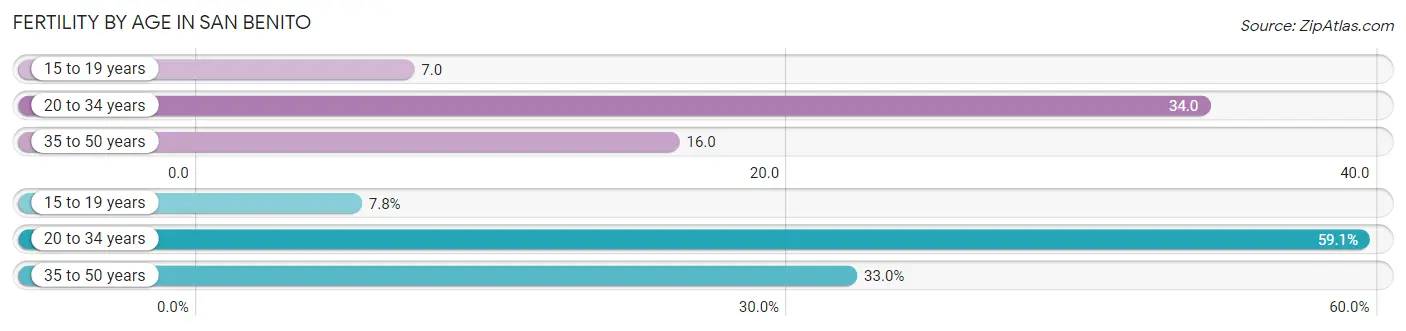
| Age Bracket | Women with Births | Births / 1,000 Women |
| 15 to 19 years | 9 (7.8%) | 7.0 |
| 20 to 34 years | 68 (59.1%) | 34.0 |
| 35 to 50 years | 38 (33.0%) | 16.0 |
| Total | 115 (100.0%) | 21.0 |
Fertility by Age by Marriage Status in San Benito
52.2% of women with births (115) in San Benito are married. The highest percentage of unmarried women with births falls into 15 to 19 years age bracket with 100.0% of them unmarried at the time of birth, while the lowest percentage of unmarried women with births belong to 35 to 50 years age bracket with 15.8% of them unmarried.
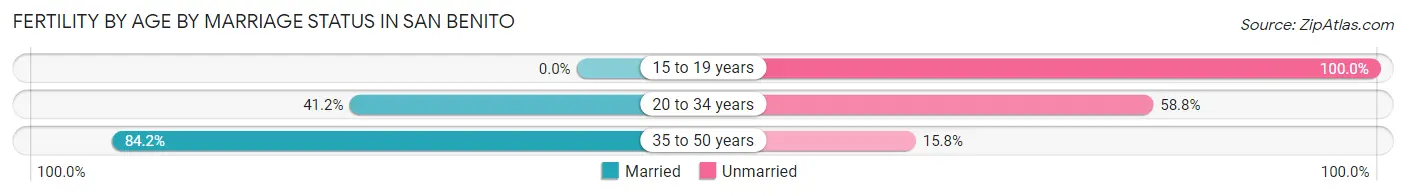
| Age Bracket | Married | Unmarried |
| 15 to 19 years | 0 (0.0%) | 9 (100.0%) |
| 20 to 34 years | 28 (41.2%) | 40 (58.8%) |
| 35 to 50 years | 32 (84.2%) | 6 (15.8%) |
| Total | 60 (52.2%) | 55 (47.8%) |
Fertility by Education in San Benito
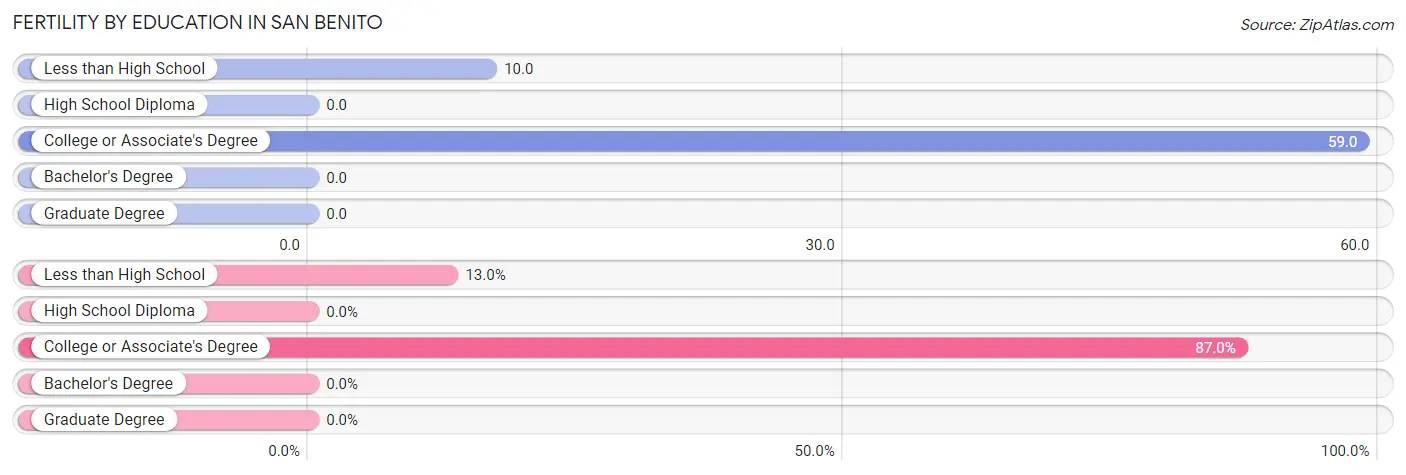
| Educational Attainment | Women with Births | Births / 1,000 Women |
| Less than High School | 15 (13.0%) | 10.0 |
| High School Diploma | 0 (0.0%) | 0.0 |
| College or Associate's Degree | 100 (87.0%) | 59.0 |
| Bachelor's Degree | 0 (0.0%) | 0.0 |
| Graduate Degree | 0 (0.0%) | 0.0 |
| Total | 115 (100.0%) | 21.0 |
Fertility by Education by Marriage Status in San Benito
47.8% of women with births in San Benito are unmarried. Women with the educational attainment of college or associate's degree are most likely to be married with 60.0% of them married at childbirth, while women with the educational attainment of less than high school are least likely to be married with 100.0% of them unmarried at childbirth.
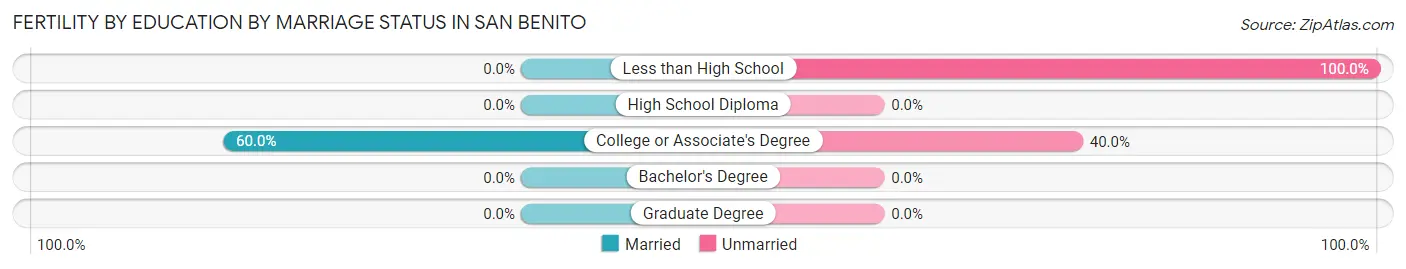
| Educational Attainment | Married | Unmarried |
| Less than High School | 0 (0.0%) | 15 (100.0%) |
| High School Diploma | 0 (0.0%) | 0 (0.0%) |
| College or Associate's Degree | 60 (60.0%) | 40 (40.0%) |
| Bachelor's Degree | 0 (0.0%) | 0 (0.0%) |
| Graduate Degree | 0 (0.0%) | 0 (0.0%) |
| Total | 60 (52.2%) | 55 (47.8%) |
Income in San Benito
Income Overview in San Benito
Per Capita Income in San Benito is $17,550, while median incomes of families and households are $42,707 and $38,100 respectively.
| Characteristic | Number | Measure |
| Per Capita Income | 24,766 | $17,550 |
| Median Family Income | 5,767 | $42,707 |
| Mean Family Income | 5,767 | $56,368 |
| Median Household Income | 7,822 | $38,100 |
| Mean Household Income | 7,822 | $51,172 |
| Income Deficit | 5,767 | $11,187 |
| Wage / Income Gap (%) | 24,766 | 6.35% |
| Wage / Income Gap ($) | 24,766 | 93.65¢ per $1 |
| Gini / Inequality Index | 24,766 | 0.44 |
Earnings by Sex in San Benito
Average Earnings in San Benito are $25,813, $26,492 for men and $24,810 for women, a difference of 6.4%.
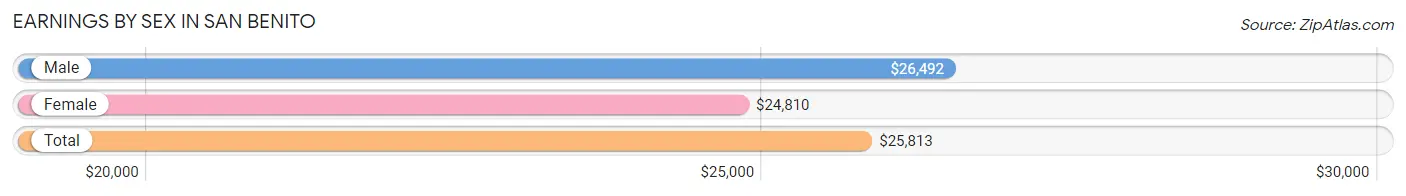
| Sex | Number | Average Earnings |
| Male | 5,612 (60.1%) | $26,492 |
| Female | 3,733 (40.0%) | $24,810 |
| Total | 9,345 (100.0%) | $25,813 |
Earnings by Sex by Income Bracket in San Benito
The most common earnings brackets in San Benito are $17,500 to $19,999 for men (465 | 8.3%) and $30,000 to $34,999 for women (338 | 9.0%).
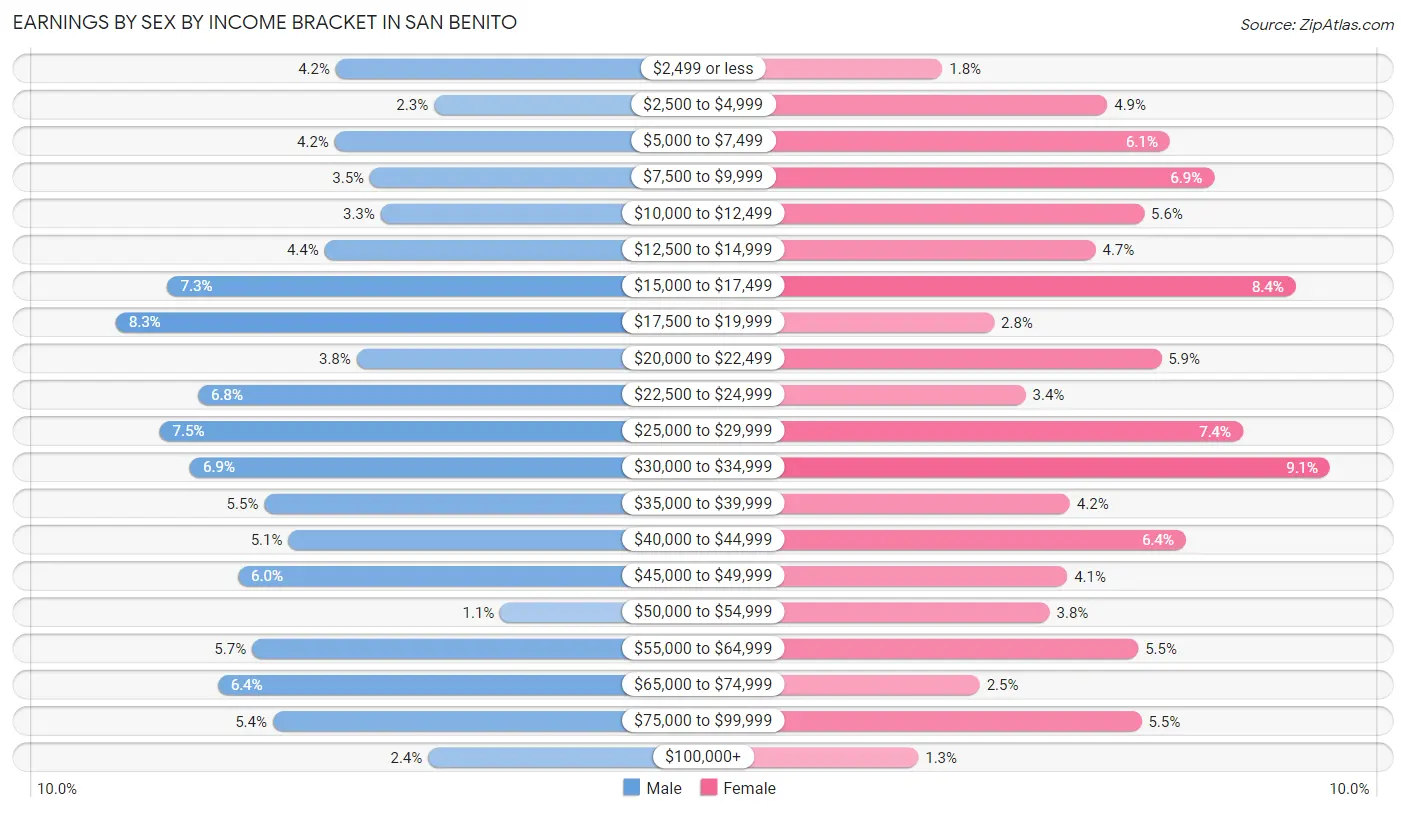
| Income | Male | Female |
| $2,499 or less | 234 (4.2%) | 67 (1.8%) |
| $2,500 to $4,999 | 131 (2.3%) | 182 (4.9%) |
| $5,000 to $7,499 | 235 (4.2%) | 226 (6.0%) |
| $7,500 to $9,999 | 198 (3.5%) | 257 (6.9%) |
| $10,000 to $12,499 | 187 (3.3%) | 208 (5.6%) |
| $12,500 to $14,999 | 246 (4.4%) | 174 (4.7%) |
| $15,000 to $17,499 | 411 (7.3%) | 314 (8.4%) |
| $17,500 to $19,999 | 465 (8.3%) | 103 (2.8%) |
| $20,000 to $22,499 | 212 (3.8%) | 220 (5.9%) |
| $22,500 to $24,999 | 379 (6.8%) | 125 (3.4%) |
| $25,000 to $29,999 | 419 (7.5%) | 277 (7.4%) |
| $30,000 to $34,999 | 387 (6.9%) | 338 (9.0%) |
| $35,000 to $39,999 | 309 (5.5%) | 156 (4.2%) |
| $40,000 to $44,999 | 284 (5.1%) | 237 (6.4%) |
| $45,000 to $49,999 | 337 (6.0%) | 154 (4.1%) |
| $50,000 to $54,999 | 61 (1.1%) | 142 (3.8%) |
| $55,000 to $64,999 | 322 (5.7%) | 204 (5.5%) |
| $65,000 to $74,999 | 358 (6.4%) | 93 (2.5%) |
| $75,000 to $99,999 | 300 (5.3%) | 206 (5.5%) |
| $100,000+ | 137 (2.4%) | 50 (1.3%) |
| Total | 5,612 (100.0%) | 3,733 (100.0%) |
Earnings by Sex by Educational Attainment in San Benito
Average earnings in San Benito are $30,684 for men and $27,297 for women, a difference of 11.0%. Men with an educational attainment of graduate degree enjoy the highest average annual earnings of $66,652, while those with less than high school education earn the least with $21,300. Women with an educational attainment of graduate degree earn the most with the average annual earnings of $66,750, while those with less than high school education have the smallest earnings of $16,195.
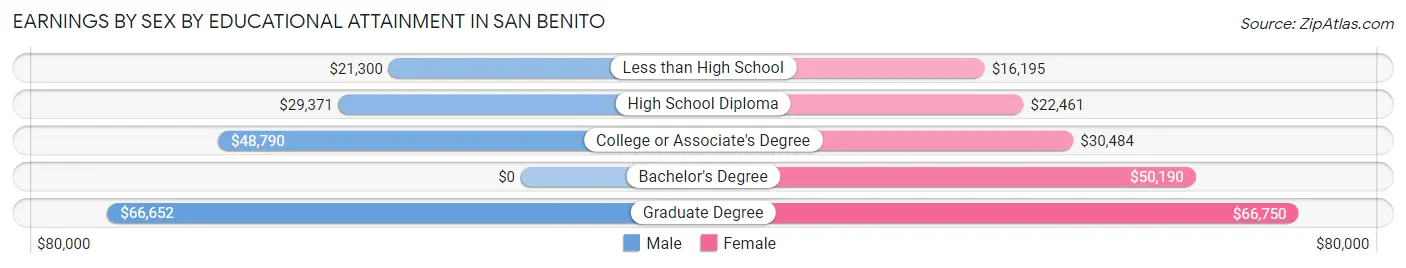
| Educational Attainment | Male Income | Female Income |
| Less than High School | $21,300 | $16,195 |
| High School Diploma | $29,371 | $22,461 |
| College or Associate's Degree | $48,790 | $30,484 |
| Bachelor's Degree | - | - |
| Graduate Degree | $66,652 | $66,750 |
| Total | $30,684 | $27,297 |
Family Income in San Benito
Family Income Brackets in San Benito
According to the San Benito family income data, there are 1,130 families falling into the $50,000 to $74,999 income range, which is the most common income bracket and makes up 19.6% of all families. Conversely, the $200,000+ income bracket is the least frequent group with only 110 families (1.9%) belonging to this category.
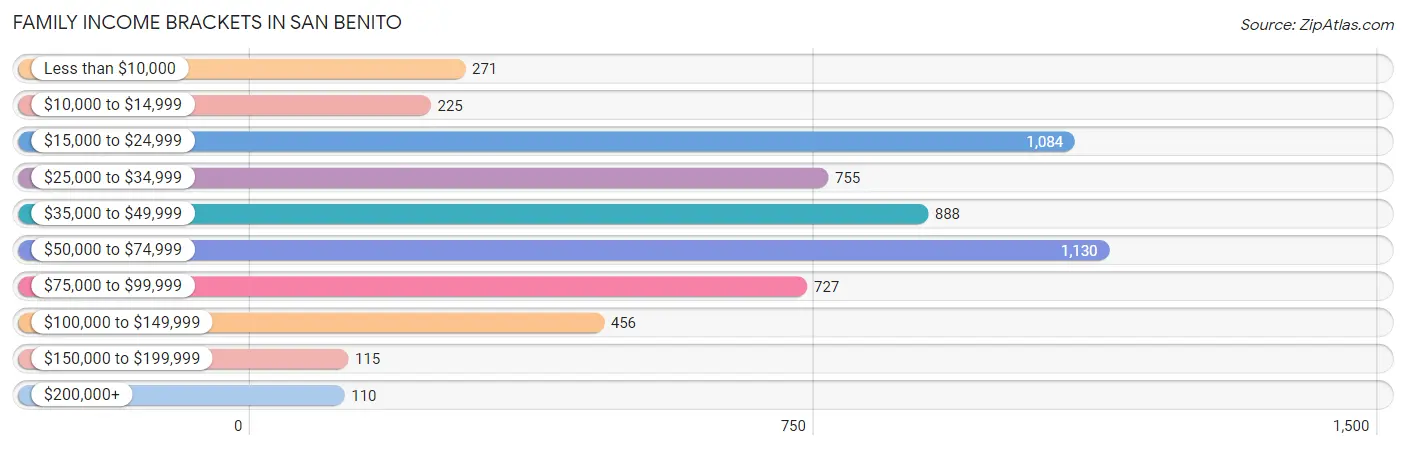
| Income Bracket | # Families | % Families |
| Less than $10,000 | 271 | 4.7% |
| $10,000 to $14,999 | 225 | 3.9% |
| $15,000 to $24,999 | 1,084 | 18.8% |
| $25,000 to $34,999 | 755 | 13.1% |
| $35,000 to $49,999 | 888 | 15.4% |
| $50,000 to $74,999 | 1,130 | 19.6% |
| $75,000 to $99,999 | 727 | 12.6% |
| $100,000 to $149,999 | 456 | 7.9% |
| $150,000 to $199,999 | 115 | 2.0% |
| $200,000+ | 110 | 1.9% |
Family Income by Famaliy Size in San Benito
6-person families (390 | 6.8%) account for the highest median family income in San Benito with $69,118 per family, while 2-person families (2,273 | 39.4%) have the highest median income of $16,885 per family member.
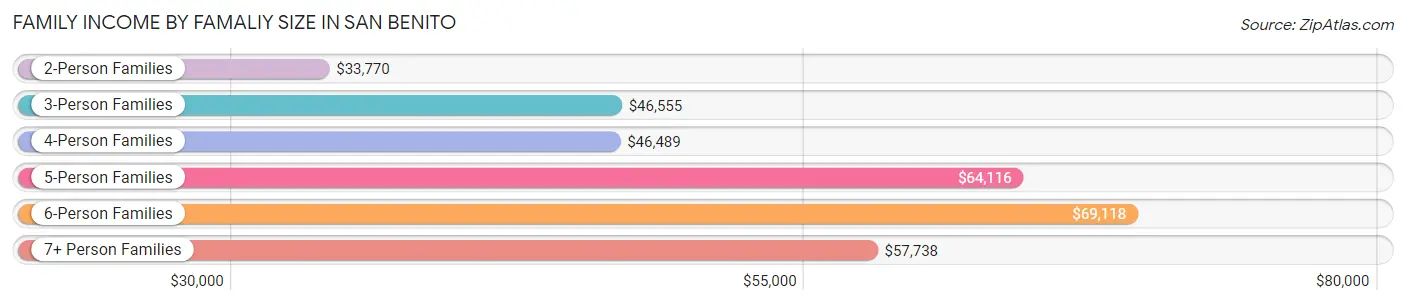
| Income Bracket | # Families | Median Income |
| 2-Person Families | 2,273 (39.4%) | $33,770 |
| 3-Person Families | 1,353 (23.5%) | $46,555 |
| 4-Person Families | 906 (15.7%) | $46,489 |
| 5-Person Families | 491 (8.5%) | $64,116 |
| 6-Person Families | 390 (6.8%) | $69,118 |
| 7+ Person Families | 354 (6.1%) | $57,738 |
| Total | 5,767 (100.0%) | $42,707 |
Family Income by Number of Earners in San Benito
The median family income in San Benito is $42,707, with families comprising 3+ earners (557) having the highest median family income of $86,178, while families with no earners (1,061) have the lowest median family income of $20,384, accounting for 9.7% and 18.4% of families, respectively.
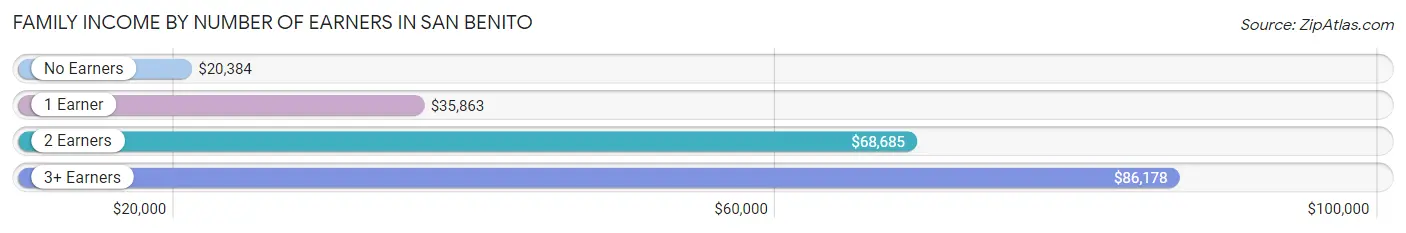
| Number of Earners | # Families | Median Income |
| No Earners | 1,061 (18.4%) | $20,384 |
| 1 Earner | 2,482 (43.0%) | $35,863 |
| 2 Earners | 1,667 (28.9%) | $68,685 |
| 3+ Earners | 557 (9.7%) | $86,178 |
| Total | 5,767 (100.0%) | $42,707 |
Household Income in San Benito
Household Income Brackets in San Benito
With 1,729 households falling in the category, the $15,000 to $24,999 income range is the most frequent in San Benito, accounting for 22.1% of all households. In contrast, only 110 households (1.4%) fall into the $200,000+ income bracket, making it the least populous group.
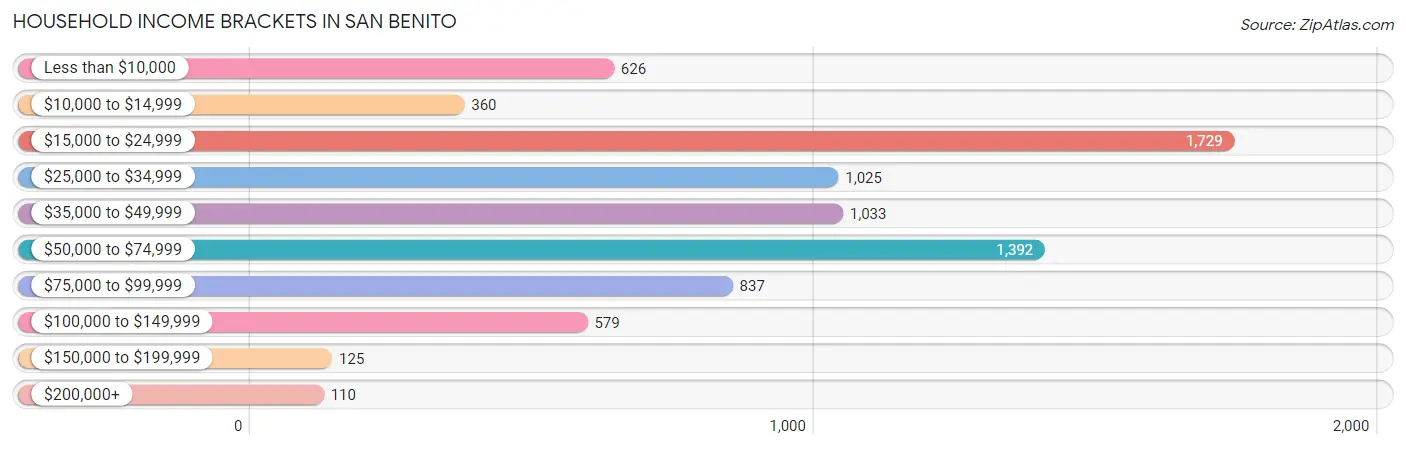
| Income Bracket | # Households | % Households |
| Less than $10,000 | 626 | 8.0% |
| $10,000 to $14,999 | 360 | 4.6% |
| $15,000 to $24,999 | 1,729 | 22.1% |
| $25,000 to $34,999 | 1,025 | 13.1% |
| $35,000 to $49,999 | 1,033 | 13.2% |
| $50,000 to $74,999 | 1,392 | 17.8% |
| $75,000 to $99,999 | 837 | 10.7% |
| $100,000 to $149,999 | 579 | 7.4% |
| $150,000 to $199,999 | 125 | 1.6% |
| $200,000+ | 110 | 1.4% |
Household Income by Householder Age in San Benito
The median household income in San Benito is $38,100, with the highest median household income of $50,142 found in the 45 to 64 years age bracket for the primary householder. A total of 2,661 households (34.0%) fall into this category. Meanwhile, the 65+ years age bracket for the primary householder has the lowest median household income of $28,972, with 2,471 households (31.6%) in this group.
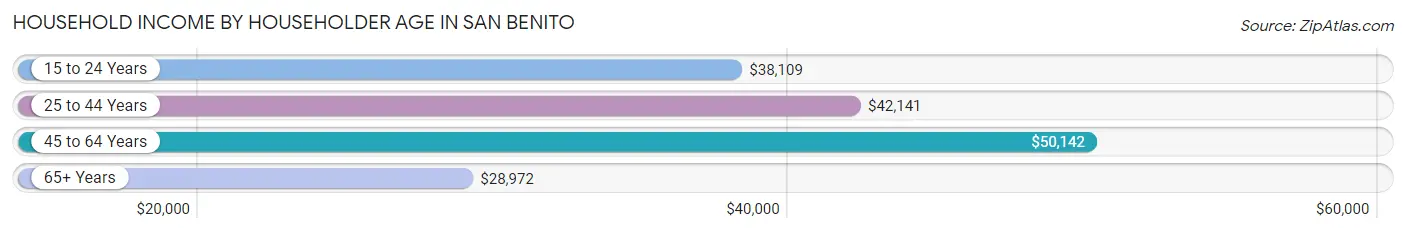
| Income Bracket | # Households | Median Income |
| 15 to 24 Years | 361 (4.6%) | $38,109 |
| 25 to 44 Years | 2,329 (29.8%) | $42,141 |
| 45 to 64 Years | 2,661 (34.0%) | $50,142 |
| 65+ Years | 2,471 (31.6%) | $28,972 |
| Total | 7,822 (100.0%) | $38,100 |
Poverty in San Benito
Income Below Poverty by Sex and Age in San Benito
With 31.7% poverty level for males and 27.9% for females among the residents of San Benito, under 5 year old males and 16 and 17 year old females are the most vulnerable to poverty, with 397 males (56.7%) and 227 females (68.0%) in their respective age groups living below the poverty level.
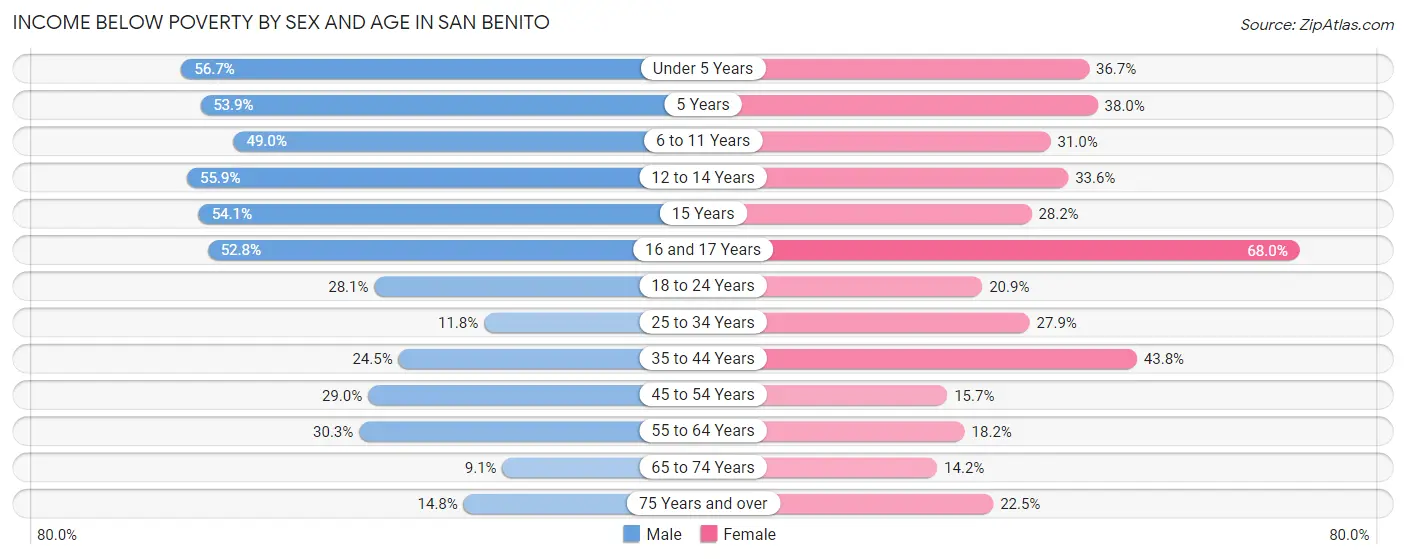
| Age Bracket | Male | Female |
| Under 5 Years | 397 (56.7%) | 330 (36.7%) |
| 5 Years | 55 (53.9%) | 68 (38.0%) |
| 6 to 11 Years | 881 (49.0%) | 275 (31.0%) |
| 12 to 14 Years | 409 (55.9%) | 231 (33.6%) |
| 15 Years | 144 (54.1%) | 89 (28.2%) |
| 16 and 17 Years | 132 (52.8%) | 227 (68.0%) |
| 18 to 24 Years | 508 (28.1%) | 299 (20.8%) |
| 25 to 34 Years | 186 (11.8%) | 320 (27.9%) |
| 35 to 44 Years | 284 (24.5%) | 702 (43.8%) |
| 45 to 54 Years | 369 (29.0%) | 198 (15.7%) |
| 55 to 64 Years | 390 (30.3%) | 180 (18.2%) |
| 65 to 74 Years | 64 (9.0%) | 141 (14.2%) |
| 75 Years and over | 112 (14.8%) | 283 (22.5%) |
| Total | 3,931 (31.7%) | 3,343 (27.9%) |
Income Above Poverty by Sex and Age in San Benito
According to the poverty statistics in San Benito, males aged 65 to 74 years and females aged 65 to 74 years are the age groups that are most secure financially, with 90.9% of males and 85.8% of females in these age groups living above the poverty line.
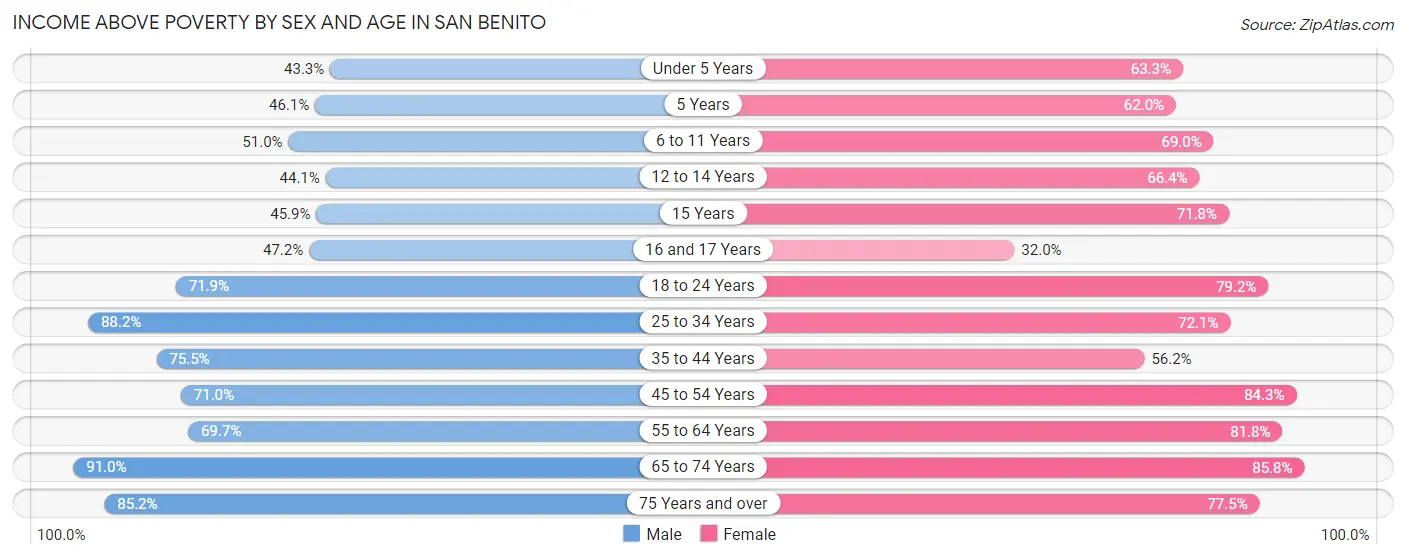
| Age Bracket | Male | Female |
| Under 5 Years | 303 (43.3%) | 569 (63.3%) |
| 5 Years | 47 (46.1%) | 111 (62.0%) |
| 6 to 11 Years | 918 (51.0%) | 612 (69.0%) |
| 12 to 14 Years | 323 (44.1%) | 456 (66.4%) |
| 15 Years | 122 (45.9%) | 227 (71.8%) |
| 16 and 17 Years | 118 (47.2%) | 107 (32.0%) |
| 18 to 24 Years | 1,302 (71.9%) | 1,135 (79.1%) |
| 25 to 34 Years | 1,394 (88.2%) | 827 (72.1%) |
| 35 to 44 Years | 876 (75.5%) | 900 (56.2%) |
| 45 to 54 Years | 903 (71.0%) | 1,066 (84.3%) |
| 55 to 64 Years | 896 (69.7%) | 807 (81.8%) |
| 65 to 74 Years | 643 (90.9%) | 855 (85.8%) |
| 75 Years and over | 644 (85.2%) | 976 (77.5%) |
| Total | 8,489 (68.3%) | 8,648 (72.1%) |
Income Below Poverty Among Married-Couple Families in San Benito
The poverty statistics for married-couple families in San Benito show that 24.5% or 855 of the total 3,482 families live below the poverty line. Families with 5 or more children have the highest poverty rate of 100.0%, comprising of 106 families. On the other hand, families with 1 or 2 children have the lowest poverty rate of 15.9%, which includes 192 families.
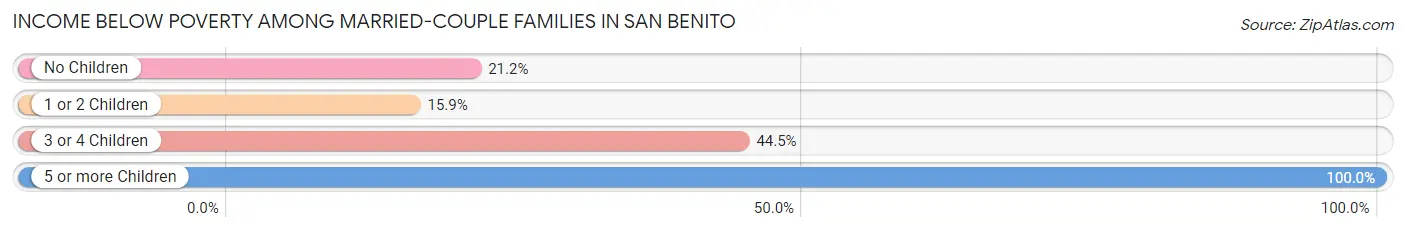
| Children | Above Poverty | Below Poverty |
| No Children | 1,378 (78.8%) | 370 (21.2%) |
| 1 or 2 Children | 1,016 (84.1%) | 192 (15.9%) |
| 3 or 4 Children | 233 (55.5%) | 187 (44.5%) |
| 5 or more Children | 0 (0.0%) | 106 (100.0%) |
| Total | 2,627 (75.4%) | 855 (24.5%) |
Income Below Poverty Among Single-Parent Households in San Benito
According to the poverty data in San Benito, 20.3% or 153 single-father households and 28.5% or 437 single-mother households are living below the poverty line. Among single-father households, those with 3 or 4 children have the highest poverty rate, with 27 households (100.0%) experiencing poverty. Likewise, among single-mother households, those with 5 or more children have the highest poverty rate, with 46 households (86.8%) falling below the poverty line.
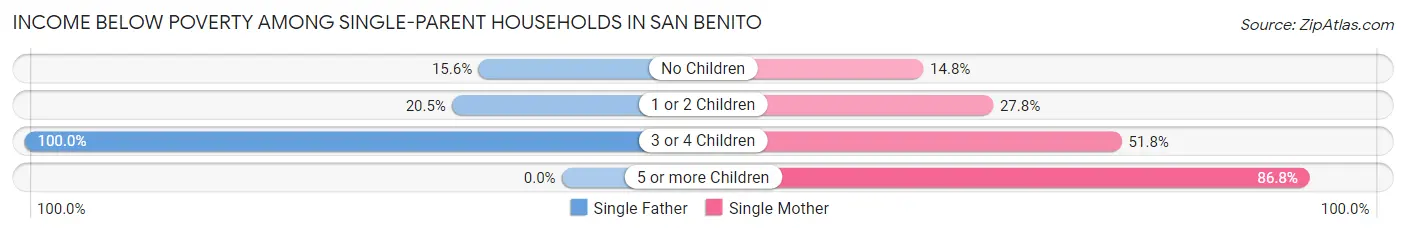
| Children | Single Father | Single Mother |
| No Children | 72 (15.5%) | 92 (14.8%) |
| 1 or 2 Children | 54 (20.4%) | 168 (27.8%) |
| 3 or 4 Children | 27 (100.0%) | 131 (51.8%) |
| 5 or more Children | 0 (0.0%) | 46 (86.8%) |
| Total | 153 (20.3%) | 437 (28.5%) |
Income Below Poverty Among Married-Couple vs Single-Parent Households in San Benito
The poverty data for San Benito shows that 855 of the married-couple family households (24.5%) and 590 of the single-parent households (25.8%) are living below the poverty level. Within the married-couple family households, those with 5 or more children have the highest poverty rate, with 106 households (100.0%) falling below the poverty line. Among the single-parent households, those with 5 or more children have the highest poverty rate, with 46 household (86.8%) living below poverty.
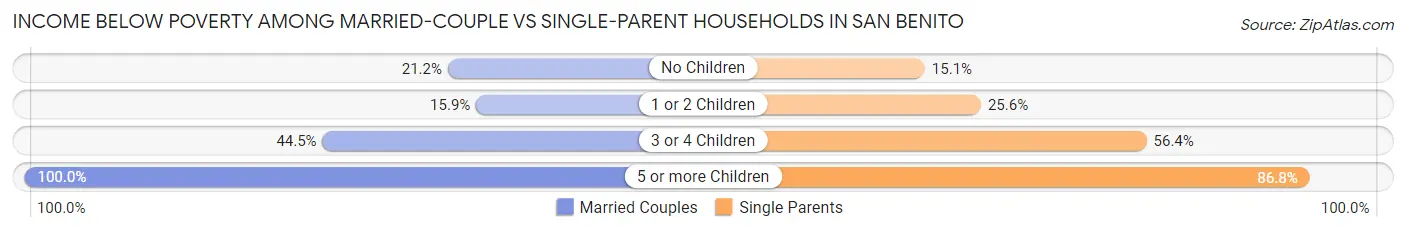
| Children | Married-Couple Families | Single-Parent Households |
| No Children | 370 (21.2%) | 164 (15.1%) |
| 1 or 2 Children | 192 (15.9%) | 222 (25.6%) |
| 3 or 4 Children | 187 (44.5%) | 158 (56.4%) |
| 5 or more Children | 106 (100.0%) | 46 (86.8%) |
| Total | 855 (24.5%) | 590 (25.8%) |
Employment Characteristics in San Benito
Employment by Class of Employer in San Benito
Among the 8,529 employed individuals in San Benito, private company employees (5,492 | 64.4%), local government employees (943 | 11.1%), and self-employed (not incorporated) (875 | 10.3%) make up the most common classes of employment.
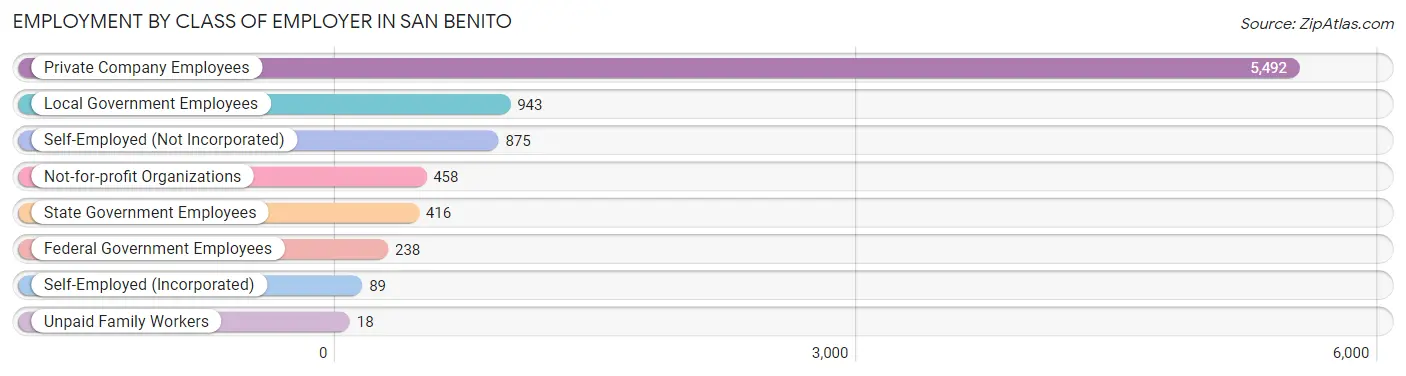
| Employer Class | # Employees | % Employees |
| Private Company Employees | 5,492 | 64.4% |
| Self-Employed (Incorporated) | 89 | 1.0% |
| Self-Employed (Not Incorporated) | 875 | 10.3% |
| Not-for-profit Organizations | 458 | 5.4% |
| Local Government Employees | 943 | 11.1% |
| State Government Employees | 416 | 4.9% |
| Federal Government Employees | 238 | 2.8% |
| Unpaid Family Workers | 18 | 0.2% |
| Total | 8,529 | 100.0% |
Employment Status by Age in San Benito
According to the labor force statistics for San Benito, out of the total population over 16 years of age (18,006), 50.3% or 9,057 individuals are in the labor force, with 5.3% or 480 of them unemployed. The age group with the highest labor force participation rate is 20 to 24 years, with 74.1% or 1,479 individuals in the labor force. Within the labor force, the 16 to 19 years age range has the highest percentage of unemployed individuals, with 19.1% or 73 of them being unemployed.
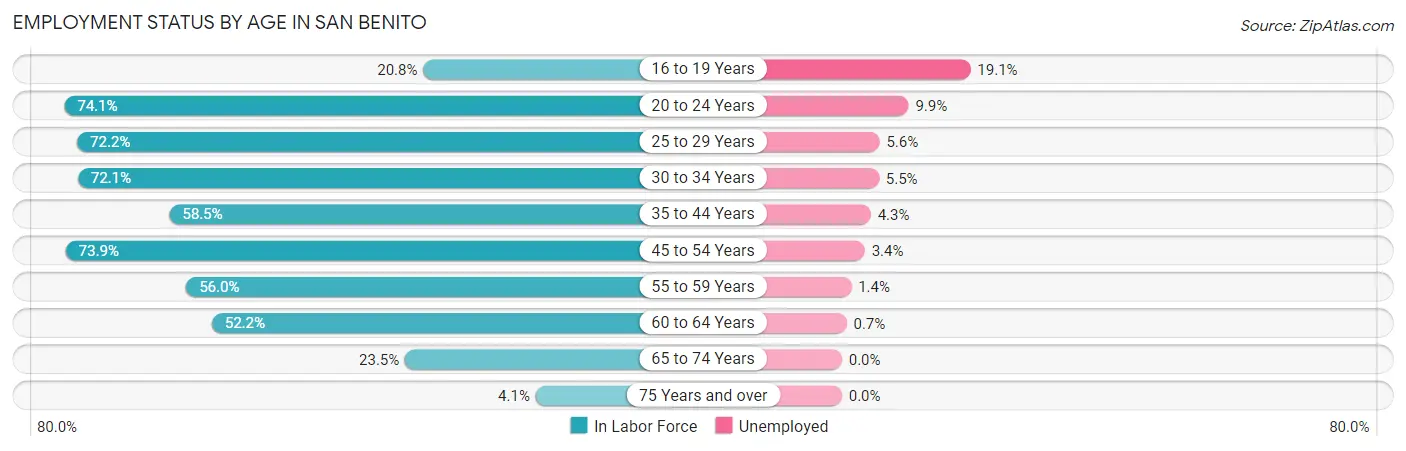
| Age Bracket | In Labor Force | Unemployed |
| 16 to 19 Years | 382 (20.8%) | 73 (19.1%) |
| 20 to 24 Years | 1,479 (74.1%) | 146 (9.9%) |
| 25 to 29 Years | 873 (72.2%) | 49 (5.6%) |
| 30 to 34 Years | 1,094 (72.1%) | 60 (5.5%) |
| 35 to 44 Years | 1,616 (58.5%) | 69 (4.3%) |
| 45 to 54 Years | 1,874 (73.9%) | 64 (3.4%) |
| 55 to 59 Years | 718 (56.0%) | 10 (1.4%) |
| 60 to 64 Years | 534 (52.2%) | 4 (0.7%) |
| 65 to 74 Years | 411 (23.5%) | 0 (0.0%) |
| 75 Years and over | 86 (4.1%) | 0 (0.0%) |
| Total | 9,057 (50.3%) | 480 (5.3%) |
Employment Status by Educational Attainment in San Benito
According to labor force statistics for San Benito, 64.9% of individuals (6,704) out of the total population between 25 and 64 years of age (10,330) are in the labor force, with 3.8% or 255 of them being unemployed. The group with the highest labor force participation rate are those with the educational attainment of bachelor's degree or higher, with 70.6% or 976 individuals in the labor force. Within the labor force, individuals with college / associate degree education have the highest percentage of unemployment, with 5.9% or 106 of them being unemployed.
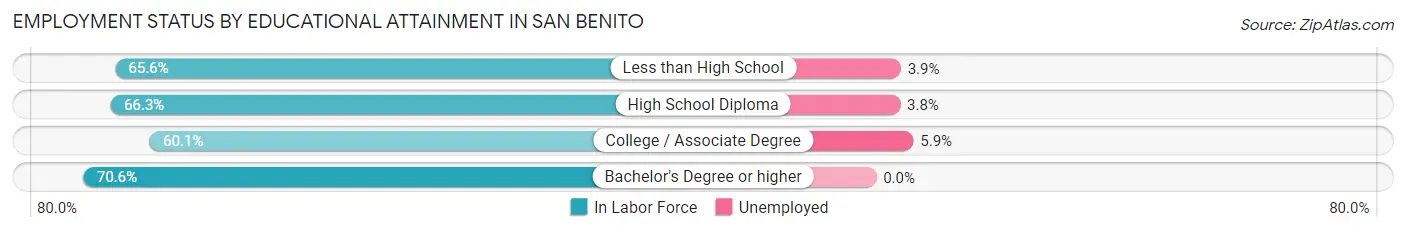
| Educational Attainment | In Labor Force | Unemployed |
| Less than High School | 1,547 (65.6%) | 92 (3.9%) |
| High School Diploma | 2,385 (66.3%) | 137 (3.8%) |
| College / Associate Degree | 1,798 (60.1%) | 177 (5.9%) |
| Bachelor's Degree or higher | 976 (70.6%) | 0 (0.0%) |
| Total | 6,704 (64.9%) | 393 (3.8%) |
Employment Occupations by Sex in San Benito
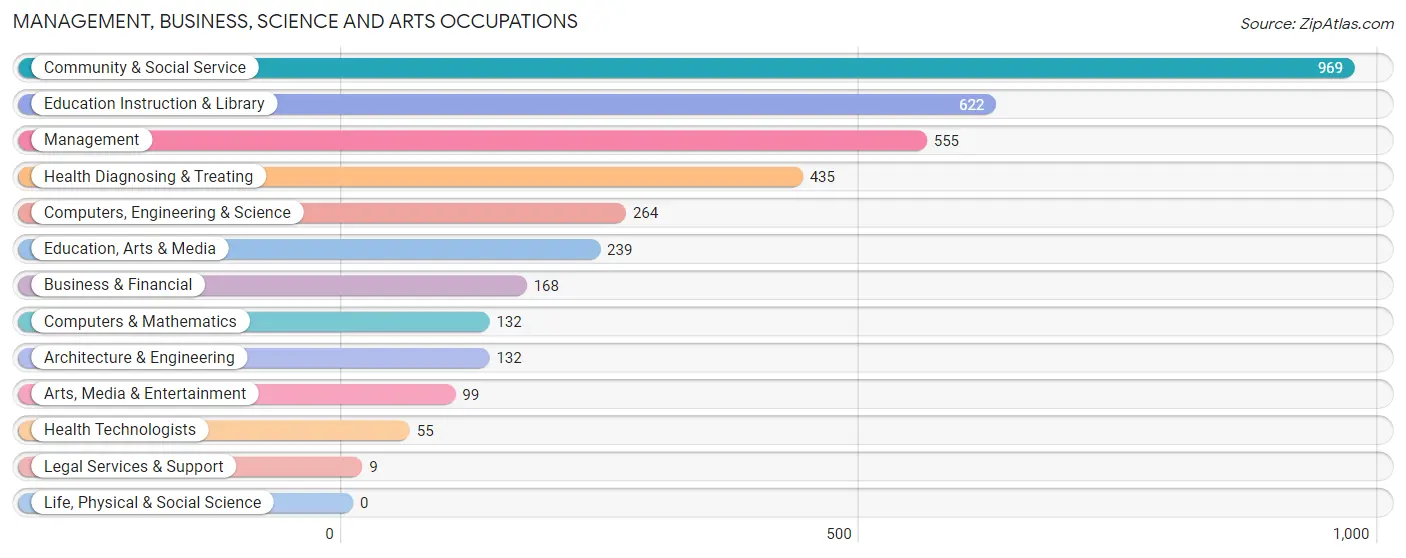
Management, Business, Science and Arts Occupations
The most common Management, Business, Science and Arts occupations in San Benito are Community & Social Service (969 | 11.3%), Education Instruction & Library (622 | 7.2%), Management (555 | 6.5%), Health Diagnosing & Treating (435 | 5.1%), and Computers, Engineering & Science (264 | 3.1%).
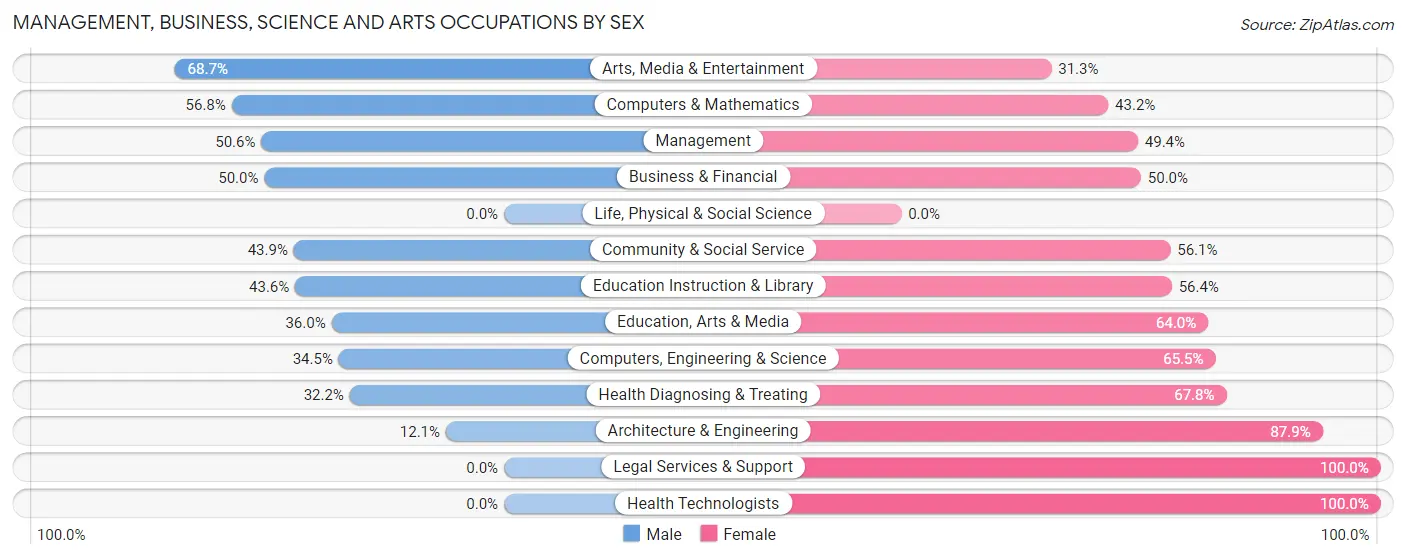
Management, Business, Science and Arts Occupations by Sex
Within the Management, Business, Science and Arts occupations in San Benito, the most male-oriented occupations are Arts, Media & Entertainment (68.7%), Computers & Mathematics (56.8%), and Management (50.6%), while the most female-oriented occupations are Legal Services & Support (100.0%), Health Technologists (100.0%), and Architecture & Engineering (87.9%).
| Occupation | Male | Female |
| Management | 281 (50.6%) | 274 (49.4%) |
| Business & Financial | 84 (50.0%) | 84 (50.0%) |
| Computers, Engineering & Science | 91 (34.5%) | 173 (65.5%) |
| Computers & Mathematics | 75 (56.8%) | 57 (43.2%) |
| Architecture & Engineering | 16 (12.1%) | 116 (87.9%) |
| Life, Physical & Social Science | 0 (0.0%) | 0 (0.0%) |
| Community & Social Service | 425 (43.9%) | 544 (56.1%) |
| Education, Arts & Media | 86 (36.0%) | 153 (64.0%) |
| Legal Services & Support | 0 (0.0%) | 9 (100.0%) |
| Education Instruction & Library | 271 (43.6%) | 351 (56.4%) |
| Arts, Media & Entertainment | 68 (68.7%) | 31 (31.3%) |
| Health Diagnosing & Treating | 140 (32.2%) | 295 (67.8%) |
| Health Technologists | 0 (0.0%) | 55 (100.0%) |
| Total (Category) | 1,021 (42.7%) | 1,370 (57.3%) |
| Total (Overall) | 5,148 (59.9%) | 3,440 (40.1%) |
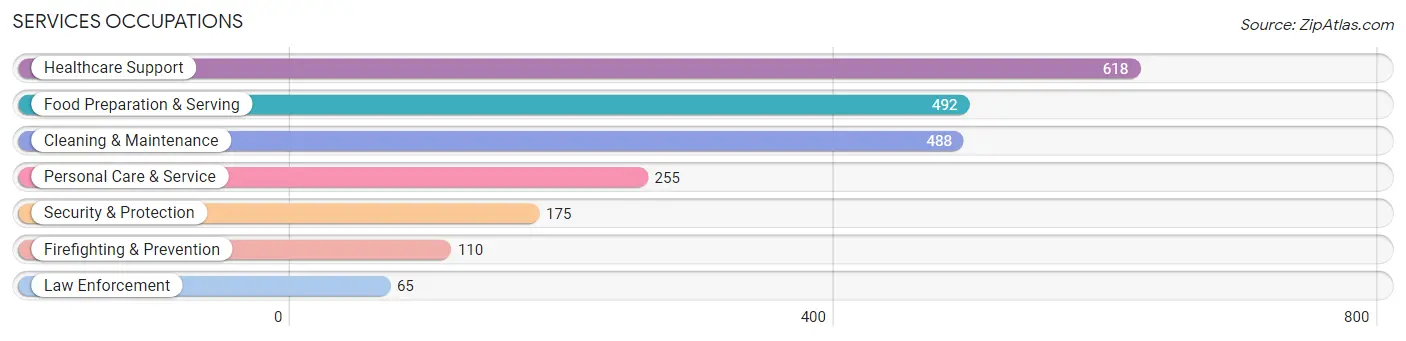
Services Occupations
The most common Services occupations in San Benito are Healthcare Support (618 | 7.2%), Food Preparation & Serving (492 | 5.7%), Cleaning & Maintenance (488 | 5.7%), Personal Care & Service (255 | 3.0%), and Security & Protection (175 | 2.0%).
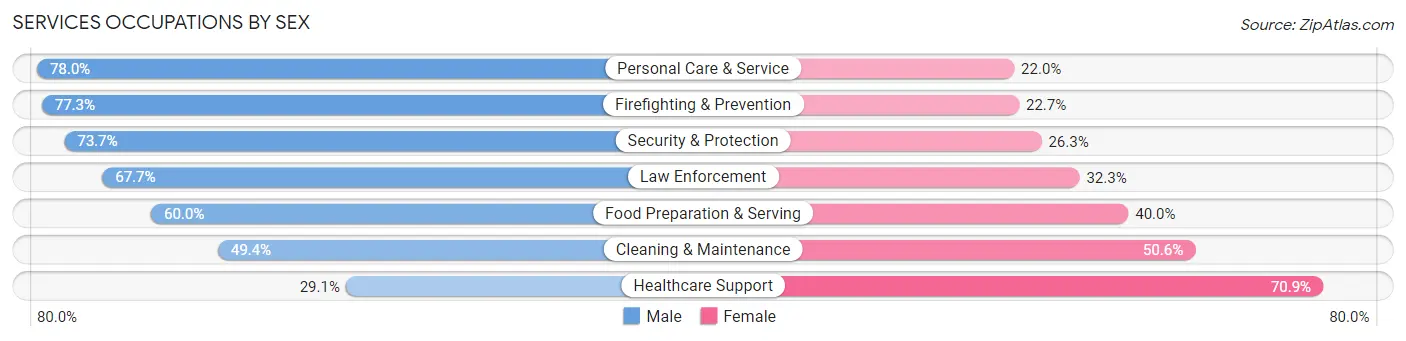
Services Occupations by Sex
Within the Services occupations in San Benito, the most male-oriented occupations are Personal Care & Service (78.0%), Firefighting & Prevention (77.3%), and Security & Protection (73.7%), while the most female-oriented occupations are Healthcare Support (70.9%), Cleaning & Maintenance (50.6%), and Food Preparation & Serving (40.0%).
| Occupation | Male | Female |
| Healthcare Support | 180 (29.1%) | 438 (70.9%) |
| Security & Protection | 129 (73.7%) | 46 (26.3%) |
| Firefighting & Prevention | 85 (77.3%) | 25 (22.7%) |
| Law Enforcement | 44 (67.7%) | 21 (32.3%) |
| Food Preparation & Serving | 295 (60.0%) | 197 (40.0%) |
| Cleaning & Maintenance | 241 (49.4%) | 247 (50.6%) |
| Personal Care & Service | 199 (78.0%) | 56 (22.0%) |
| Total (Category) | 1,044 (51.5%) | 984 (48.5%) |
| Total (Overall) | 5,148 (59.9%) | 3,440 (40.1%) |
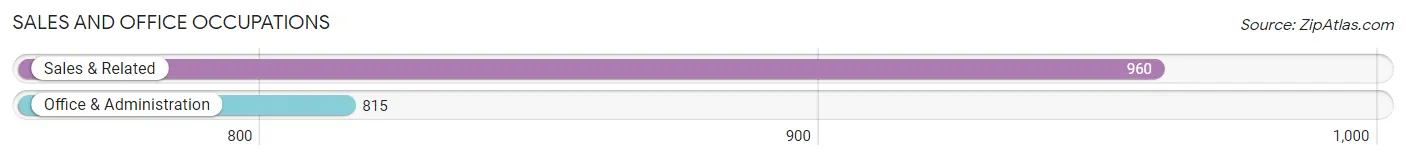
Sales and Office Occupations
The most common Sales and Office occupations in San Benito are Sales & Related (960 | 11.2%), and Office & Administration (815 | 9.5%).
Sales and Office Occupations by Sex
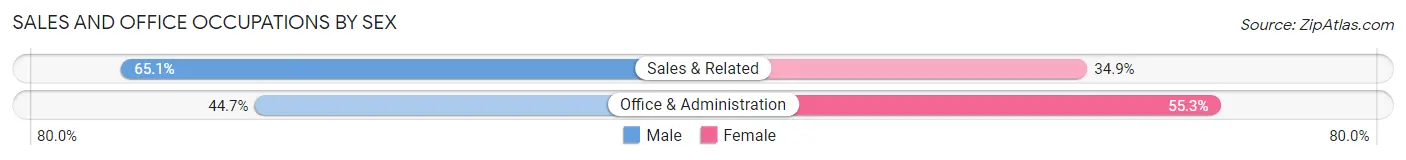
| Occupation | Male | Female |
| Sales & Related | 625 (65.1%) | 335 (34.9%) |
| Office & Administration | 364 (44.7%) | 451 (55.3%) |
| Total (Category) | 989 (55.7%) | 786 (44.3%) |
| Total (Overall) | 5,148 (59.9%) | 3,440 (40.1%) |
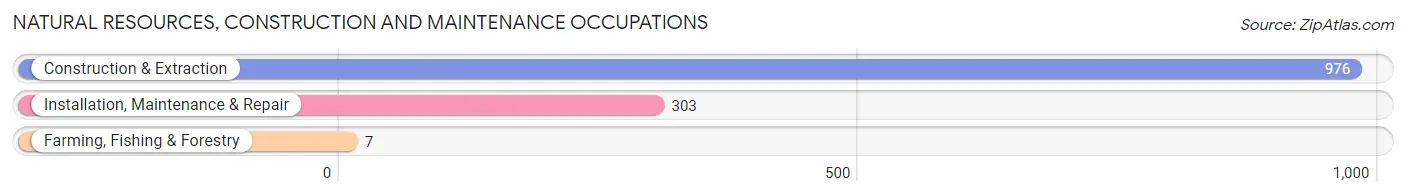
Natural Resources, Construction and Maintenance Occupations
The most common Natural Resources, Construction and Maintenance occupations in San Benito are Construction & Extraction (976 | 11.4%), Installation, Maintenance & Repair (303 | 3.5%), and Farming, Fishing & Forestry (7 | 0.1%).
Natural Resources, Construction and Maintenance Occupations by Sex
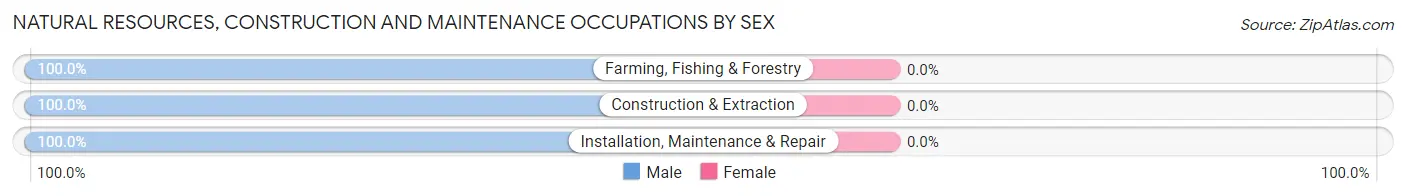
| Occupation | Male | Female |
| Farming, Fishing & Forestry | 7 (100.0%) | 0 (0.0%) |
| Construction & Extraction | 976 (100.0%) | 0 (0.0%) |
| Installation, Maintenance & Repair | 303 (100.0%) | 0 (0.0%) |
| Total (Category) | 1,286 (100.0%) | 0 (0.0%) |
| Total (Overall) | 5,148 (59.9%) | 3,440 (40.1%) |
Production, Transportation and Moving Occupations
The most common Production, Transportation and Moving occupations in San Benito are Material Moving (404 | 4.7%), Transportation (365 | 4.3%), and Production (339 | 4.0%).
Production, Transportation and Moving Occupations by Sex
| Occupation | Male | Female |
| Production | 193 (56.9%) | 146 (43.1%) |
| Transportation | 326 (89.3%) | 39 (10.7%) |
| Material Moving | 289 (71.5%) | 115 (28.5%) |
| Total (Category) | 808 (72.9%) | 300 (27.1%) |
| Total (Overall) | 5,148 (59.9%) | 3,440 (40.1%) |
Employment Industries by Sex in San Benito
Employment Industries in San Benito
The major employment industries in San Benito include Health Care & Social Assistance (1,461 | 17.0%), Educational Services (1,175 | 13.7%), Retail Trade (1,144 | 13.3%), Construction (817 | 9.5%), and Transportation & Warehousing (603 | 7.0%).
Employment Industries by Sex in San Benito
The San Benito industries that see more men than women are Mining, Quarrying, & Extraction (100.0%), Utilities (100.0%), and Construction (98.8%), whereas the industries that tend to have a higher number of women are Finance & Insurance (70.7%), Health Care & Social Assistance (65.0%), and Educational Services (61.3%).
| Industry | Male | Female |
| Agriculture, Fishing & Hunting | 40 (60.6%) | 26 (39.4%) |
| Mining, Quarrying, & Extraction | 104 (100.0%) | 0 (0.0%) |
| Construction | 807 (98.8%) | 10 (1.2%) |
| Manufacturing | 248 (63.4%) | 143 (36.6%) |
| Wholesale Trade | 143 (79.9%) | 36 (20.1%) |
| Retail Trade | 737 (64.4%) | 407 (35.6%) |
| Transportation & Warehousing | 594 (98.5%) | 9 (1.5%) |
| Utilities | 45 (100.0%) | 0 (0.0%) |
| Information | 38 (51.3%) | 36 (48.6%) |
| Finance & Insurance | 65 (29.3%) | 157 (70.7%) |
| Real Estate, Rental & Leasing | 51 (89.5%) | 6 (10.5%) |
| Professional & Scientific | 133 (63.3%) | 77 (36.7%) |
| Enterprise Management | 0 (0.0%) | 0 (0.0%) |
| Administrative & Support | 240 (51.6%) | 225 (48.4%) |
| Educational Services | 455 (38.7%) | 720 (61.3%) |
| Health Care & Social Assistance | 512 (35.0%) | 949 (65.0%) |
| Arts, Entertainment & Recreation | 214 (88.8%) | 27 (11.2%) |
| Accommodation & Food Services | 272 (46.3%) | 316 (53.7%) |
| Public Administration | 219 (48.9%) | 229 (51.1%) |
| Total | 5,148 (59.9%) | 3,440 (40.1%) |
Education in San Benito
School Enrollment in San Benito
The most common levels of schooling among the 7,668 students in San Benito are middle school (2,038 | 26.6%), elementary school (1,787 | 23.3%), and high school (1,487 | 19.4%).
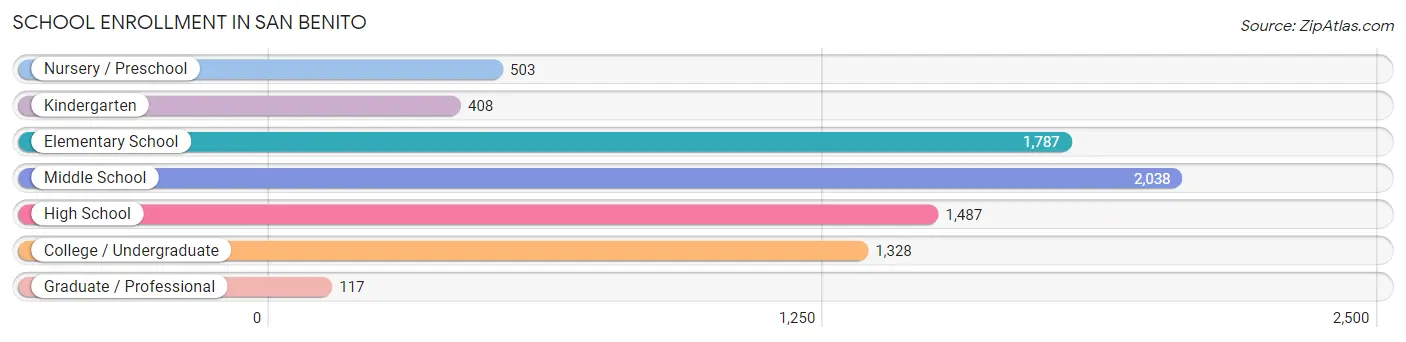
| School Level | # Students | % Students |
| Nursery / Preschool | 503 | 6.6% |
| Kindergarten | 408 | 5.3% |
| Elementary School | 1,787 | 23.3% |
| Middle School | 2,038 | 26.6% |
| High School | 1,487 | 19.4% |
| College / Undergraduate | 1,328 | 17.3% |
| Graduate / Professional | 117 | 1.5% |
| Total | 7,668 | 100.0% |
School Enrollment by Age by Funding Source in San Benito
Out of a total of 7,668 students who are enrolled in schools in San Benito, 429 (5.6%) attend a private institution, while the remaining 7,239 (94.4%) are enrolled in public schools. The age group of 25 to 34 year olds has the highest likelihood of being enrolled in private schools, with 68 (20.4% in the age bracket) enrolled. Conversely, the age group of 3 to 4 year olds has the lowest likelihood of being enrolled in a private school, with 400 (100.0% in the age bracket) attending a public institution.
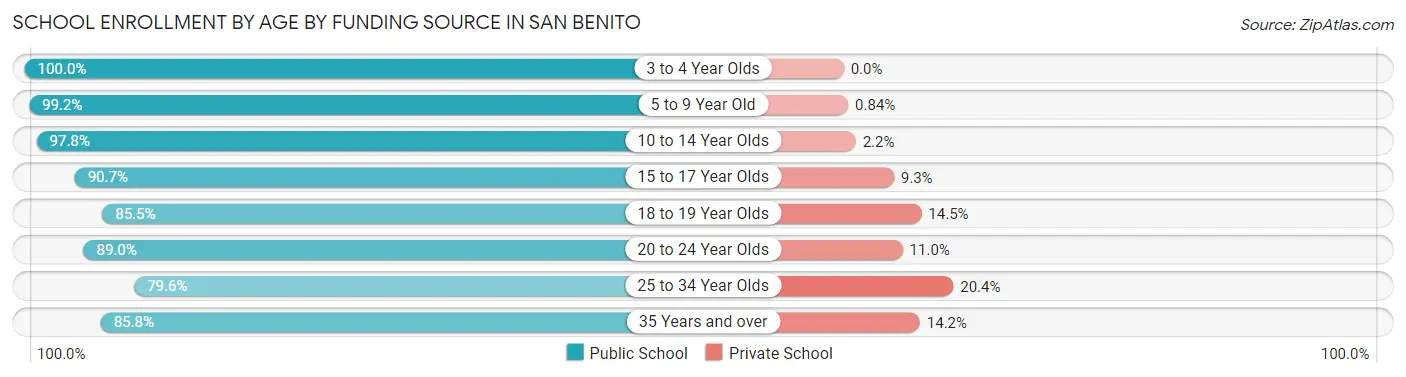
| Age Bracket | Public School | Private School |
| 3 to 4 Year Olds | 400 (100.0%) | 0 (0.0%) |
| 5 to 9 Year Old | 2,131 (99.2%) | 18 (0.8%) |
| 10 to 14 Year Olds | 2,142 (97.8%) | 49 (2.2%) |
| 15 to 17 Year Olds | 1,058 (90.7%) | 109 (9.3%) |
| 18 to 19 Year Olds | 614 (85.5%) | 104 (14.5%) |
| 20 to 24 Year Olds | 494 (89.0%) | 61 (11.0%) |
| 25 to 34 Year Olds | 265 (79.6%) | 68 (20.4%) |
| 35 Years and over | 133 (85.8%) | 22 (14.2%) |
| Total | 7,239 (94.4%) | 429 (5.6%) |
Educational Attainment by Field of Study in San Benito
Education (773 | 42.3%), arts & humanities (245 | 13.4%), business (210 | 11.5%), science & technology (169 | 9.2%), and psychology (101 | 5.5%) are the most common fields of study among 1,828 individuals in San Benito who have obtained a bachelor's degree or higher.
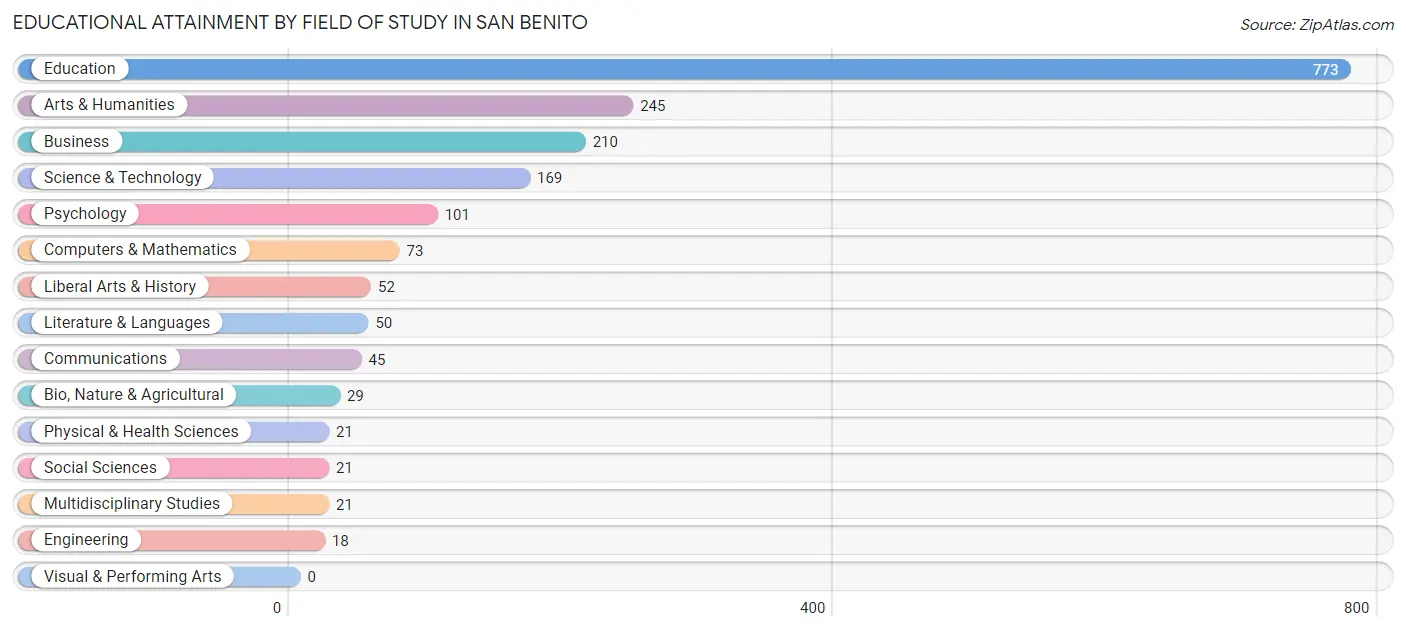
| Field of Study | # Graduates | % Graduates |
| Computers & Mathematics | 73 | 4.0% |
| Bio, Nature & Agricultural | 29 | 1.6% |
| Physical & Health Sciences | 21 | 1.1% |
| Psychology | 101 | 5.5% |
| Social Sciences | 21 | 1.1% |
| Engineering | 18 | 1.0% |
| Multidisciplinary Studies | 21 | 1.1% |
| Science & Technology | 169 | 9.2% |
| Business | 210 | 11.5% |
| Education | 773 | 42.3% |
| Literature & Languages | 50 | 2.7% |
| Liberal Arts & History | 52 | 2.8% |
| Visual & Performing Arts | 0 | 0.0% |
| Communications | 45 | 2.5% |
| Arts & Humanities | 245 | 13.4% |
| Total | 1,828 | 100.0% |
Transportation & Commute in San Benito
Vehicle Availability by Sex in San Benito
The most prevalent vehicle ownership categories in San Benito are males with 2 vehicles (2,102, accounting for 40.9%) and females with 2 vehicles (1,235, making up 62.0%).
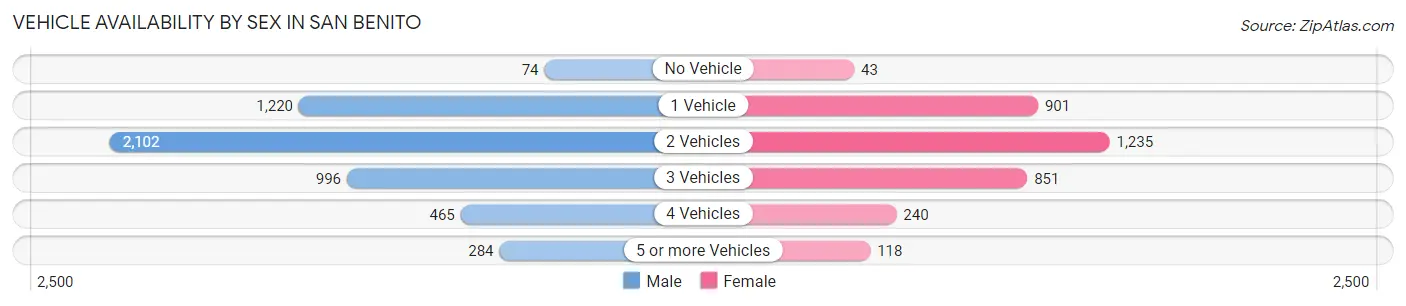
| Vehicles Available | Male | Female |
| No Vehicle | 74 (1.4%) | 43 (1.3%) |
| 1 Vehicle | 1,220 (23.7%) | 901 (26.6%) |
| 2 Vehicles | 2,102 (40.9%) | 1,235 (36.4%) |
| 3 Vehicles | 996 (19.4%) | 851 (25.1%) |
| 4 Vehicles | 465 (9.0%) | 240 (7.1%) |
| 5 or more Vehicles | 284 (5.5%) | 118 (3.5%) |
| Total | 5,141 (100.0%) | 3,388 (100.0%) |
Commute Time in San Benito
The most frequently occuring commute durations in San Benito are 10 to 14 minutes (1,773 commuters, 22.6%), 20 to 24 minutes (1,447 commuters, 18.5%), and 15 to 19 minutes (1,428 commuters, 18.2%).
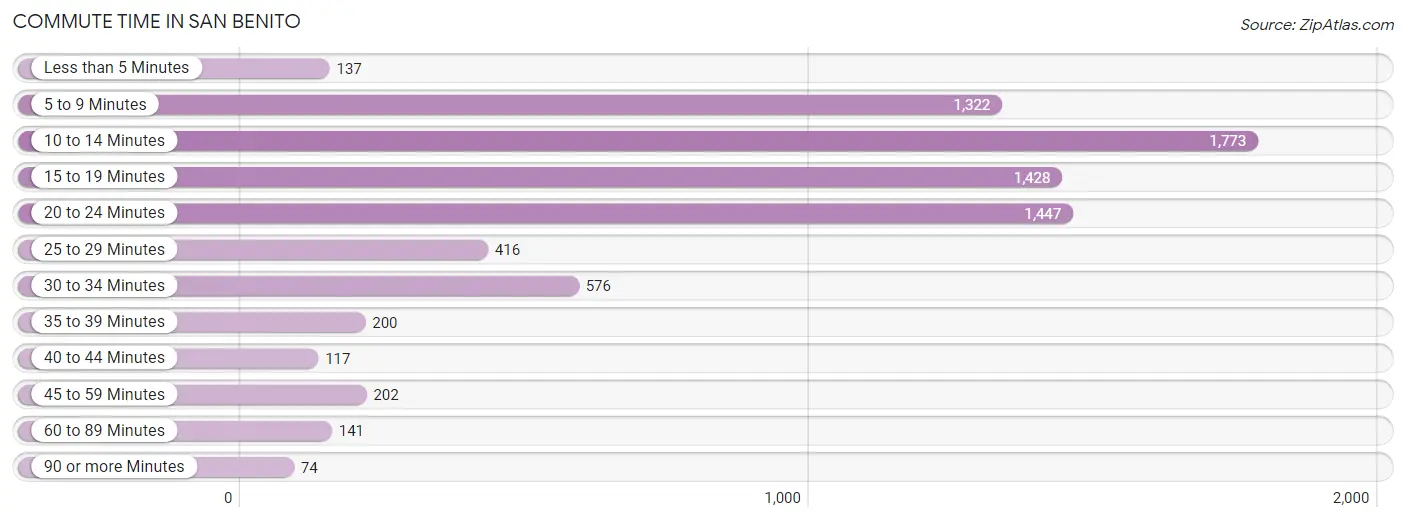
| Commute Time | # Commuters | % Commuters |
| Less than 5 Minutes | 137 | 1.8% |
| 5 to 9 Minutes | 1,322 | 16.9% |
| 10 to 14 Minutes | 1,773 | 22.6% |
| 15 to 19 Minutes | 1,428 | 18.2% |
| 20 to 24 Minutes | 1,447 | 18.5% |
| 25 to 29 Minutes | 416 | 5.3% |
| 30 to 34 Minutes | 576 | 7.3% |
| 35 to 39 Minutes | 200 | 2.5% |
| 40 to 44 Minutes | 117 | 1.5% |
| 45 to 59 Minutes | 202 | 2.6% |
| 60 to 89 Minutes | 141 | 1.8% |
| 90 or more Minutes | 74 | 0.9% |
Commute Time by Sex in San Benito
The most common commute times in San Benito are 10 to 14 minutes (1,085 commuters, 22.7%) for males and 10 to 14 minutes (688 commuters, 22.5%) for females.
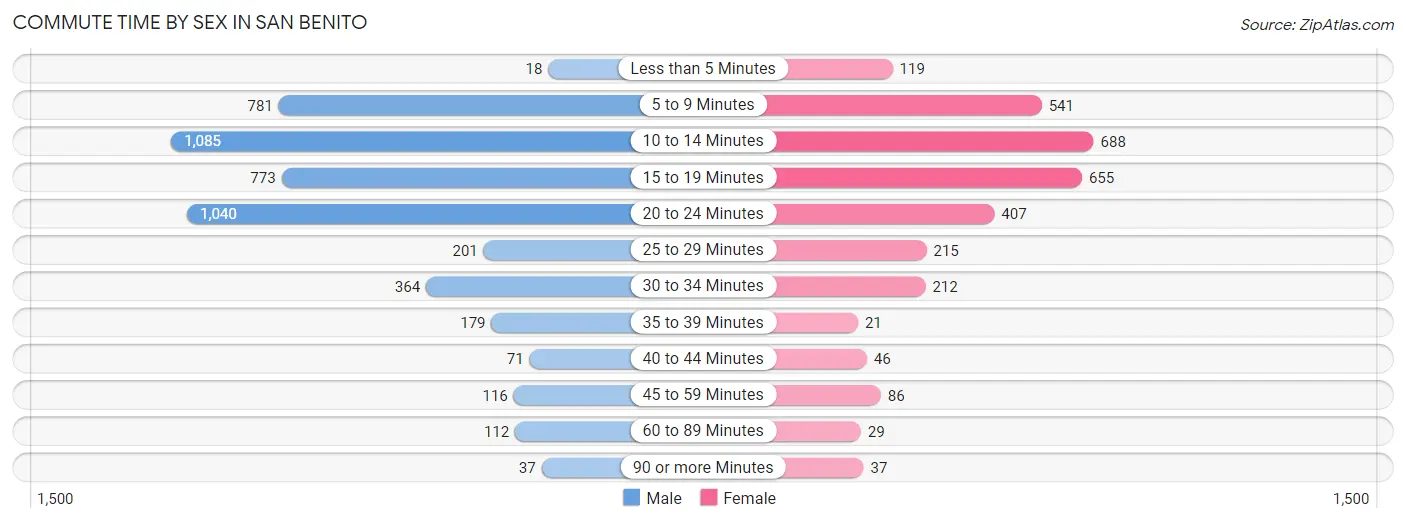
| Commute Time | Male | Female |
| Less than 5 Minutes | 18 (0.4%) | 119 (3.9%) |
| 5 to 9 Minutes | 781 (16.4%) | 541 (17.7%) |
| 10 to 14 Minutes | 1,085 (22.7%) | 688 (22.5%) |
| 15 to 19 Minutes | 773 (16.2%) | 655 (21.4%) |
| 20 to 24 Minutes | 1,040 (21.8%) | 407 (13.3%) |
| 25 to 29 Minutes | 201 (4.2%) | 215 (7.0%) |
| 30 to 34 Minutes | 364 (7.6%) | 212 (6.9%) |
| 35 to 39 Minutes | 179 (3.7%) | 21 (0.7%) |
| 40 to 44 Minutes | 71 (1.5%) | 46 (1.5%) |
| 45 to 59 Minutes | 116 (2.4%) | 86 (2.8%) |
| 60 to 89 Minutes | 112 (2.3%) | 29 (0.9%) |
| 90 or more Minutes | 37 (0.8%) | 37 (1.2%) |
Time of Departure to Work by Sex in San Benito
The most frequent times of departure to work in San Benito are 8:00 AM to 8:29 AM (851, 17.8%) for males and 7:00 AM to 7:29 AM (597, 19.5%) for females.
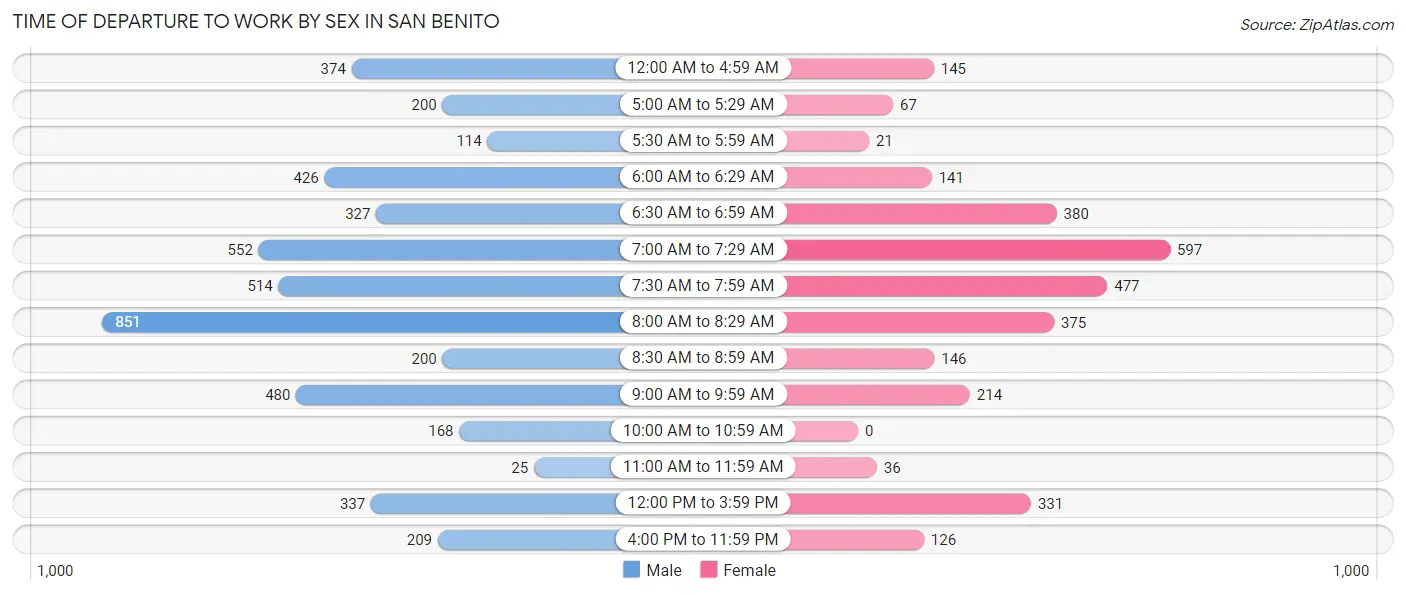
| Time of Departure | Male | Female |
| 12:00 AM to 4:59 AM | 374 (7.8%) | 145 (4.7%) |
| 5:00 AM to 5:29 AM | 200 (4.2%) | 67 (2.2%) |
| 5:30 AM to 5:59 AM | 114 (2.4%) | 21 (0.7%) |
| 6:00 AM to 6:29 AM | 426 (8.9%) | 141 (4.6%) |
| 6:30 AM to 6:59 AM | 327 (6.9%) | 380 (12.4%) |
| 7:00 AM to 7:29 AM | 552 (11.6%) | 597 (19.5%) |
| 7:30 AM to 7:59 AM | 514 (10.8%) | 477 (15.6%) |
| 8:00 AM to 8:29 AM | 851 (17.8%) | 375 (12.3%) |
| 8:30 AM to 8:59 AM | 200 (4.2%) | 146 (4.8%) |
| 9:00 AM to 9:59 AM | 480 (10.1%) | 214 (7.0%) |
| 10:00 AM to 10:59 AM | 168 (3.5%) | 0 (0.0%) |
| 11:00 AM to 11:59 AM | 25 (0.5%) | 36 (1.2%) |
| 12:00 PM to 3:59 PM | 337 (7.0%) | 331 (10.8%) |
| 4:00 PM to 11:59 PM | 209 (4.4%) | 126 (4.1%) |
| Total | 4,777 (100.0%) | 3,056 (100.0%) |
Housing Occupancy in San Benito
Occupancy by Ownership in San Benito
Of the total 7,822 dwellings in San Benito, owner-occupied units account for 5,327 (68.1%), while renter-occupied units make up 2,495 (31.9%).
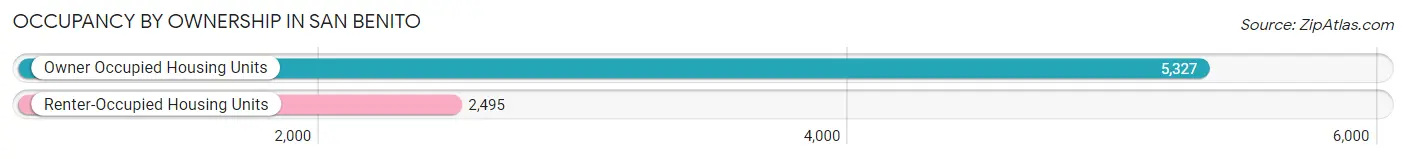
| Occupancy | # Housing Units | % Housing Units |
| Owner Occupied Housing Units | 5,327 | 68.1% |
| Renter-Occupied Housing Units | 2,495 | 31.9% |
| Total Occupied Housing Units | 7,822 | 100.0% |
Occupancy by Household Size in San Benito
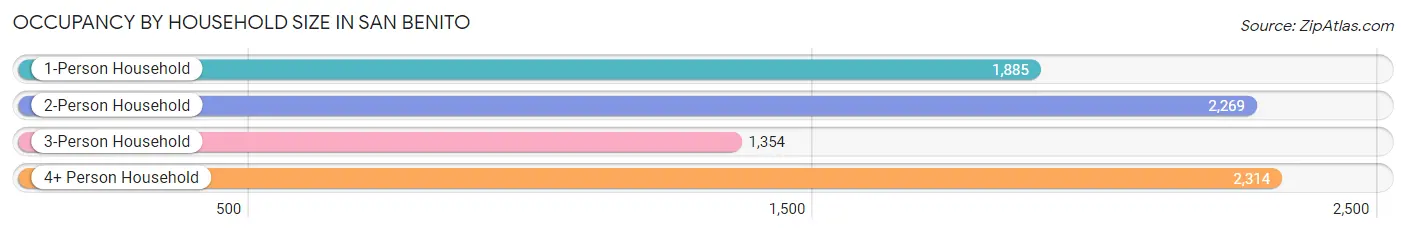
| Household Size | # Housing Units | % Housing Units |
| 1-Person Household | 1,885 | 24.1% |
| 2-Person Household | 2,269 | 29.0% |
| 3-Person Household | 1,354 | 17.3% |
| 4+ Person Household | 2,314 | 29.6% |
| Total Housing Units | 7,822 | 100.0% |
Occupancy by Ownership by Household Size in San Benito
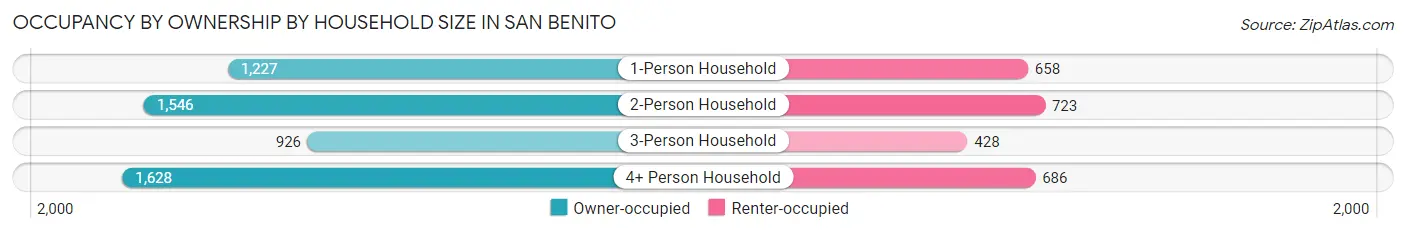
| Household Size | Owner-occupied | Renter-occupied |
| 1-Person Household | 1,227 (65.1%) | 658 (34.9%) |
| 2-Person Household | 1,546 (68.1%) | 723 (31.9%) |
| 3-Person Household | 926 (68.4%) | 428 (31.6%) |
| 4+ Person Household | 1,628 (70.4%) | 686 (29.6%) |
| Total Housing Units | 5,327 (68.1%) | 2,495 (31.9%) |
Occupancy by Educational Attainment in San Benito
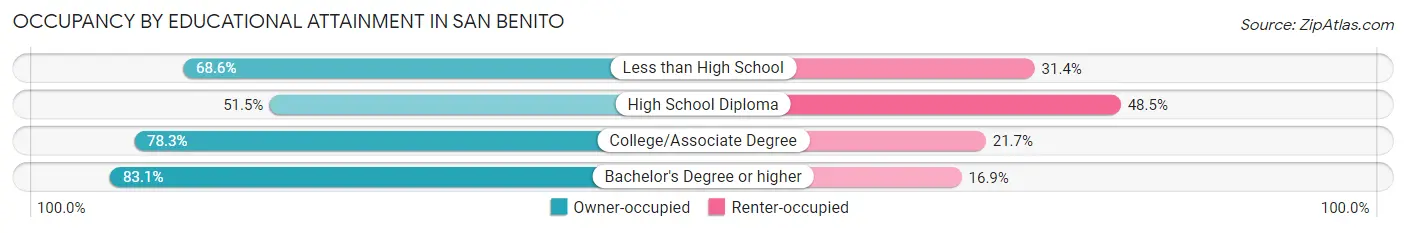
| Household Size | Owner-occupied | Renter-occupied |
| Less than High School | 1,460 (68.6%) | 669 (31.4%) |
| High School Diploma | 1,225 (51.5%) | 1,153 (48.5%) |
| College/Associate Degree | 1,823 (78.3%) | 506 (21.7%) |
| Bachelor's Degree or higher | 819 (83.1%) | 167 (16.9%) |
Occupancy by Age of Householder in San Benito
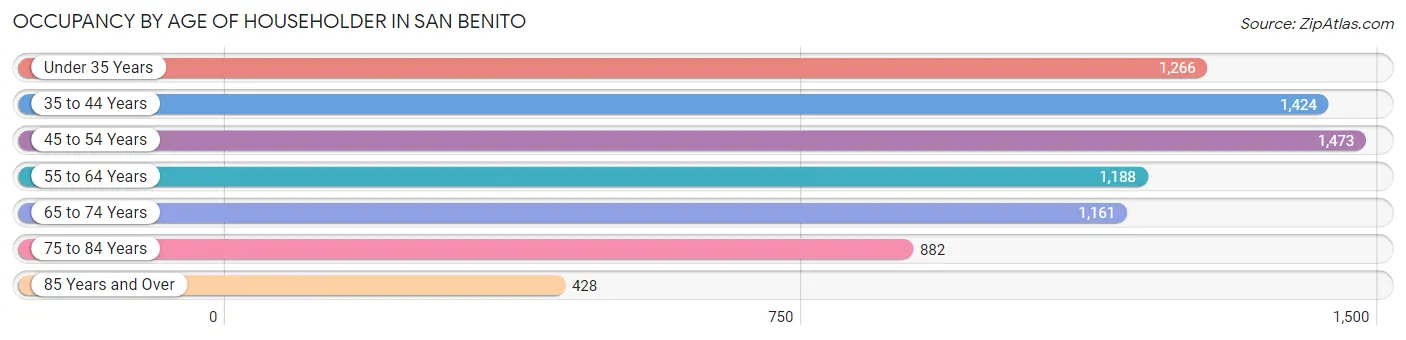
| Age Bracket | # Households | % Households |
| Under 35 Years | 1,266 | 16.2% |
| 35 to 44 Years | 1,424 | 18.2% |
| 45 to 54 Years | 1,473 | 18.8% |
| 55 to 64 Years | 1,188 | 15.2% |
| 65 to 74 Years | 1,161 | 14.8% |
| 75 to 84 Years | 882 | 11.3% |
| 85 Years and Over | 428 | 5.5% |
| Total | 7,822 | 100.0% |
Housing Finances in San Benito
Median Income by Occupancy in San Benito
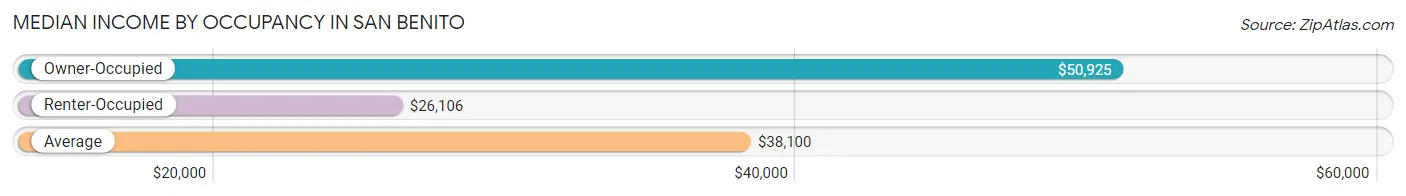
| Occupancy Type | # Households | Median Income |
| Owner-Occupied | 5,327 (68.1%) | $50,925 |
| Renter-Occupied | 2,495 (31.9%) | $26,106 |
| Average | 7,822 (100.0%) | $38,100 |
Occupancy by Householder Income Bracket in San Benito
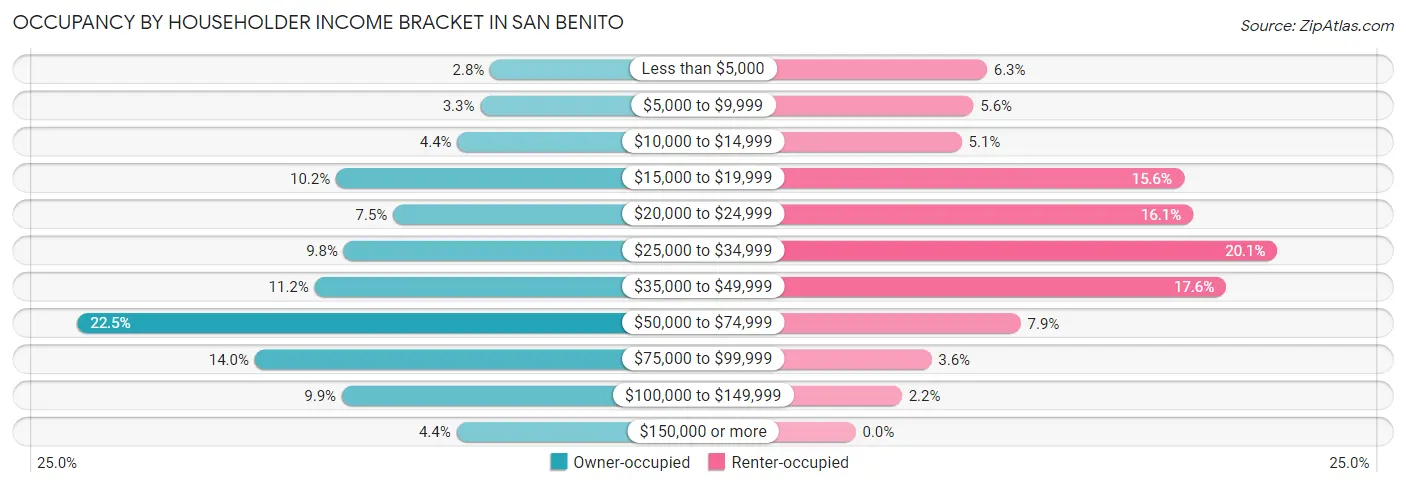
| Income Bracket | Owner-occupied | Renter-occupied |
| Less than $5,000 | 151 (2.8%) | 156 (6.2%) |
| $5,000 to $9,999 | 176 (3.3%) | 140 (5.6%) |
| $10,000 to $14,999 | 234 (4.4%) | 126 (5.1%) |
| $15,000 to $19,999 | 542 (10.2%) | 390 (15.6%) |
| $20,000 to $24,999 | 397 (7.4%) | 401 (16.1%) |
| $25,000 to $34,999 | 522 (9.8%) | 501 (20.1%) |
| $35,000 to $49,999 | 596 (11.2%) | 440 (17.6%) |
| $50,000 to $74,999 | 1,198 (22.5%) | 196 (7.9%) |
| $75,000 to $99,999 | 748 (14.0%) | 90 (3.6%) |
| $100,000 to $149,999 | 527 (9.9%) | 55 (2.2%) |
| $150,000 or more | 236 (4.4%) | 0 (0.0%) |
| Total | 5,327 (100.0%) | 2,495 (100.0%) |
Monthly Housing Cost Tiers in San Benito
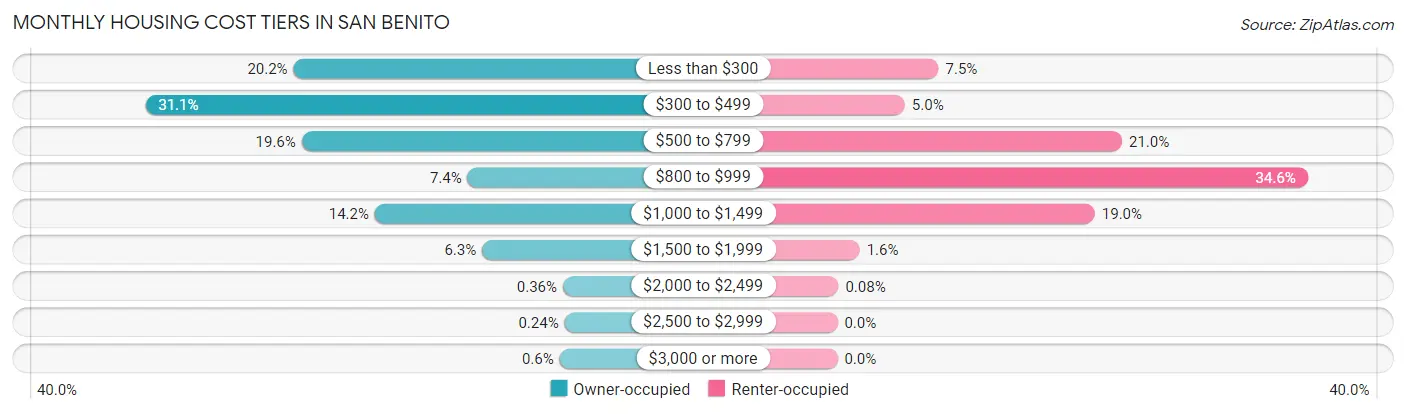
| Monthly Cost | Owner-occupied | Renter-occupied |
| Less than $300 | 1,076 (20.2%) | 186 (7.4%) |
| $300 to $499 | 1,657 (31.1%) | 124 (5.0%) |
| $500 to $799 | 1,044 (19.6%) | 523 (21.0%) |
| $800 to $999 | 393 (7.4%) | 864 (34.6%) |
| $1,000 to $1,499 | 757 (14.2%) | 473 (19.0%) |
| $1,500 to $1,999 | 336 (6.3%) | 41 (1.6%) |
| $2,000 to $2,499 | 19 (0.4%) | 2 (0.1%) |
| $2,500 to $2,999 | 13 (0.2%) | 0 (0.0%) |
| $3,000 or more | 32 (0.6%) | 0 (0.0%) |
| Total | 5,327 (100.0%) | 2,495 (100.0%) |
Physical Housing Characteristics in San Benito
Housing Structures in San Benito
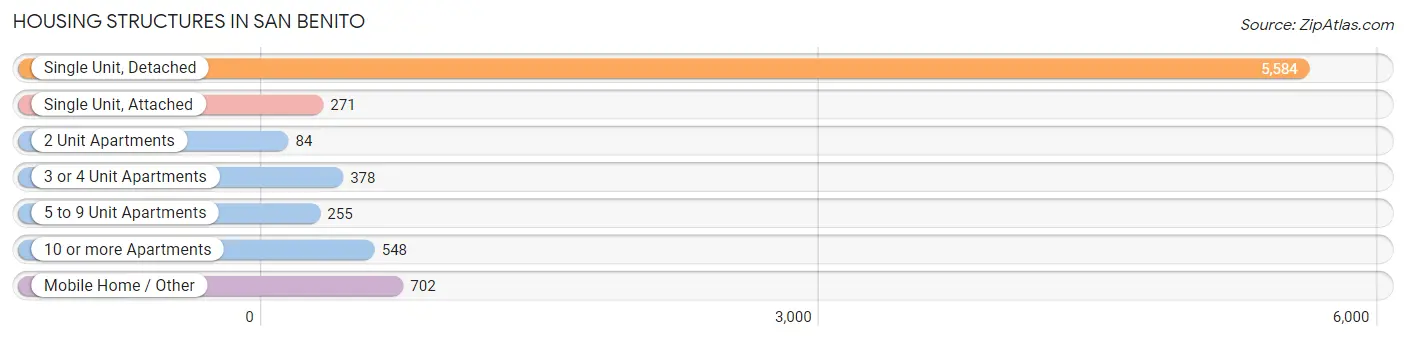
| Structure Type | # Housing Units | % Housing Units |
| Single Unit, Detached | 5,584 | 71.4% |
| Single Unit, Attached | 271 | 3.5% |
| 2 Unit Apartments | 84 | 1.1% |
| 3 or 4 Unit Apartments | 378 | 4.8% |
| 5 to 9 Unit Apartments | 255 | 3.3% |
| 10 or more Apartments | 548 | 7.0% |
| Mobile Home / Other | 702 | 9.0% |
| Total | 7,822 | 100.0% |
Housing Structures by Occupancy in San Benito
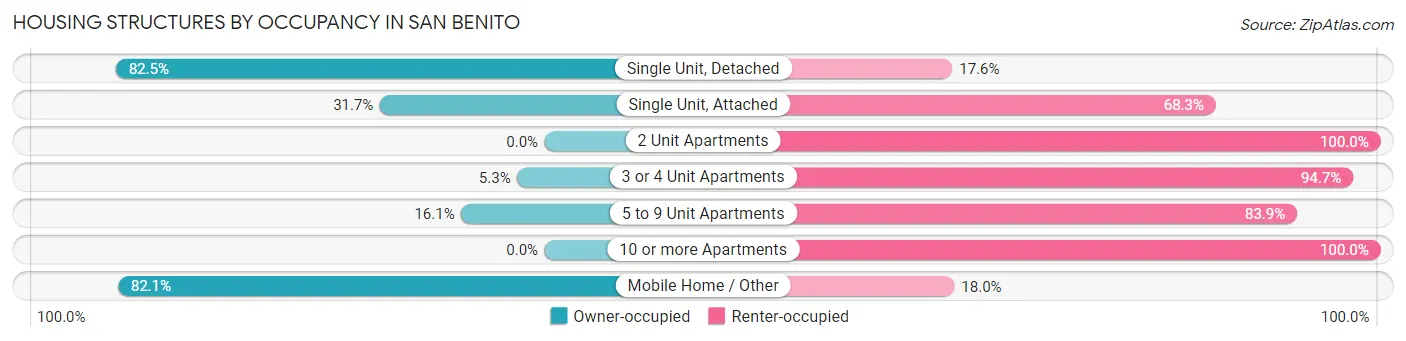
| Structure Type | Owner-occupied | Renter-occupied |
| Single Unit, Detached | 4,604 (82.5%) | 980 (17.5%) |
| Single Unit, Attached | 86 (31.7%) | 185 (68.3%) |
| 2 Unit Apartments | 0 (0.0%) | 84 (100.0%) |
| 3 or 4 Unit Apartments | 20 (5.3%) | 358 (94.7%) |
| 5 to 9 Unit Apartments | 41 (16.1%) | 214 (83.9%) |
| 10 or more Apartments | 0 (0.0%) | 548 (100.0%) |
| Mobile Home / Other | 576 (82.1%) | 126 (17.9%) |
| Total | 5,327 (68.1%) | 2,495 (31.9%) |
Housing Structures by Number of Rooms in San Benito
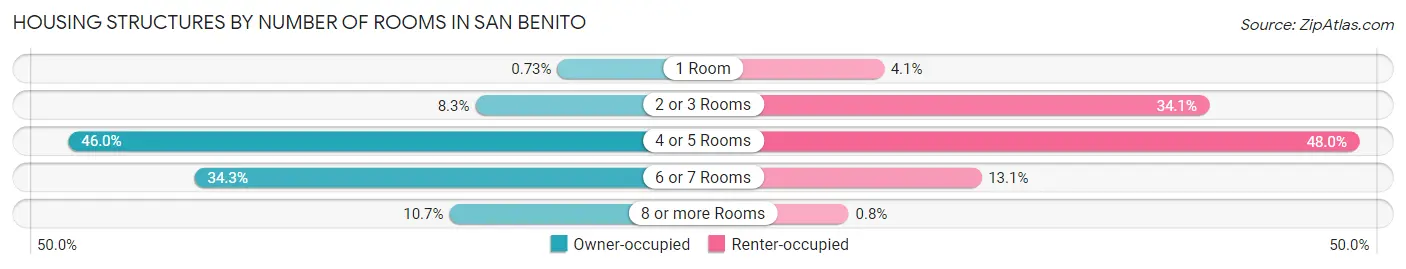
| Number of Rooms | Owner-occupied | Renter-occupied |
| 1 Room | 39 (0.7%) | 101 (4.1%) |
| 2 or 3 Rooms | 443 (8.3%) | 851 (34.1%) |
| 4 or 5 Rooms | 2,448 (46.0%) | 1,197 (48.0%) |
| 6 or 7 Rooms | 1,826 (34.3%) | 326 (13.1%) |
| 8 or more Rooms | 571 (10.7%) | 20 (0.8%) |
| Total | 5,327 (100.0%) | 2,495 (100.0%) |
Housing Structure by Heating Type in San Benito
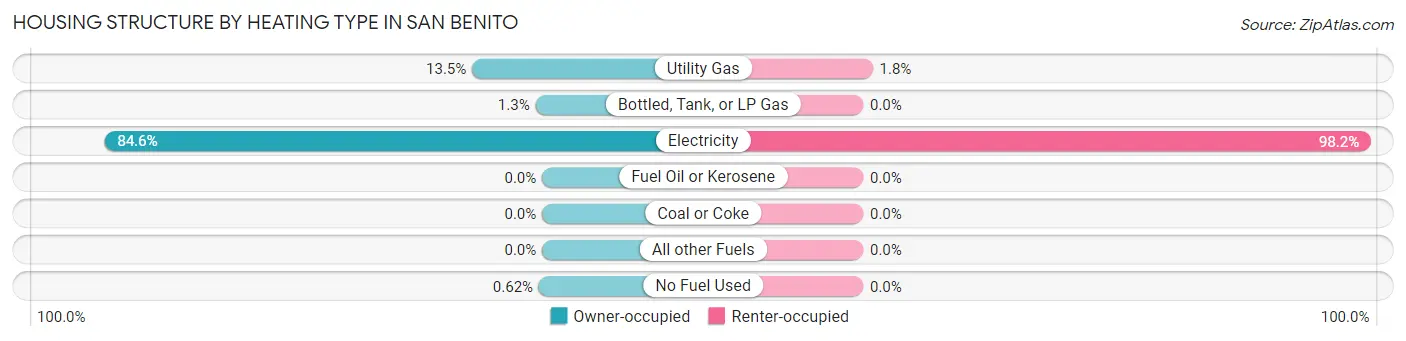
| Heating Type | Owner-occupied | Renter-occupied |
| Utility Gas | 720 (13.5%) | 46 (1.8%) |
| Bottled, Tank, or LP Gas | 68 (1.3%) | 0 (0.0%) |
| Electricity | 4,506 (84.6%) | 2,449 (98.2%) |
| Fuel Oil or Kerosene | 0 (0.0%) | 0 (0.0%) |
| Coal or Coke | 0 (0.0%) | 0 (0.0%) |
| All other Fuels | 0 (0.0%) | 0 (0.0%) |
| No Fuel Used | 33 (0.6%) | 0 (0.0%) |
| Total | 5,327 (100.0%) | 2,495 (100.0%) |
Household Vehicle Usage in San Benito
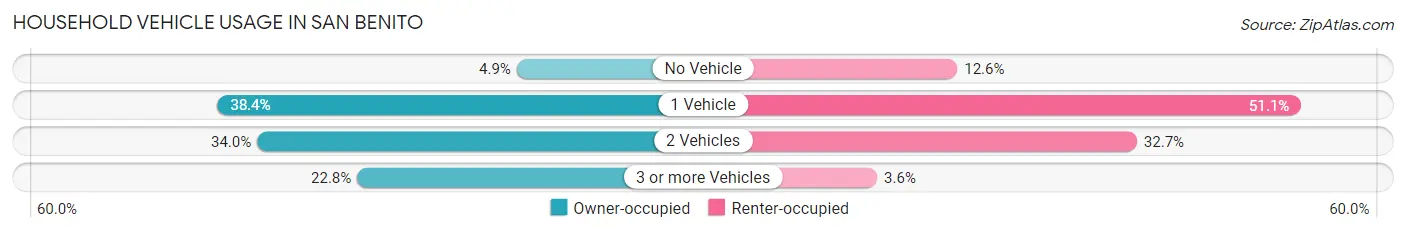
| Vehicles per Household | Owner-occupied | Renter-occupied |
| No Vehicle | 260 (4.9%) | 314 (12.6%) |
| 1 Vehicle | 2,046 (38.4%) | 1,275 (51.1%) |
| 2 Vehicles | 1,809 (34.0%) | 816 (32.7%) |
| 3 or more Vehicles | 1,212 (22.8%) | 90 (3.6%) |
| Total | 5,327 (100.0%) | 2,495 (100.0%) |
Real Estate & Mortgages in San Benito
Real Estate and Mortgage Overview in San Benito
| Characteristic | Without Mortgage | With Mortgage |
| Housing Units | 3,872 | 1,455 |
| Median Property Value | $61,100 | $116,600 |
| Median Household Income | $42,478 | $120 |
| Monthly Housing Costs | $393 | $32 |
| Real Estate Taxes | $1,002 | $198 |
Property Value by Mortgage Status in San Benito
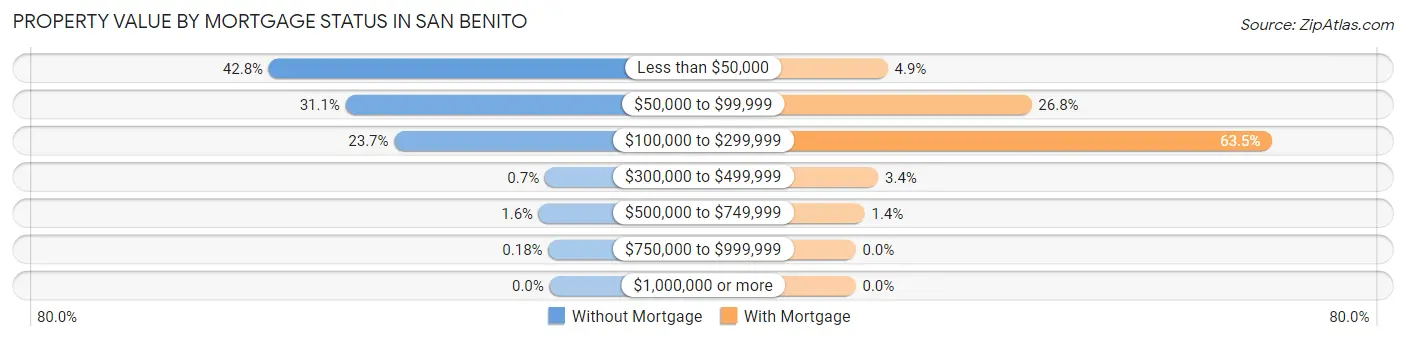
| Property Value | Without Mortgage | With Mortgage |
| Less than $50,000 | 1,656 (42.8%) | 71 (4.9%) |
| $50,000 to $99,999 | 1,203 (31.1%) | 390 (26.8%) |
| $100,000 to $299,999 | 916 (23.7%) | 924 (63.5%) |
| $300,000 to $499,999 | 27 (0.7%) | 50 (3.4%) |
| $500,000 to $749,999 | 63 (1.6%) | 20 (1.4%) |
| $750,000 to $999,999 | 7 (0.2%) | 0 (0.0%) |
| $1,000,000 or more | 0 (0.0%) | 0 (0.0%) |
| Total | 3,872 (100.0%) | 1,455 (100.0%) |
Household Income by Mortgage Status in San Benito
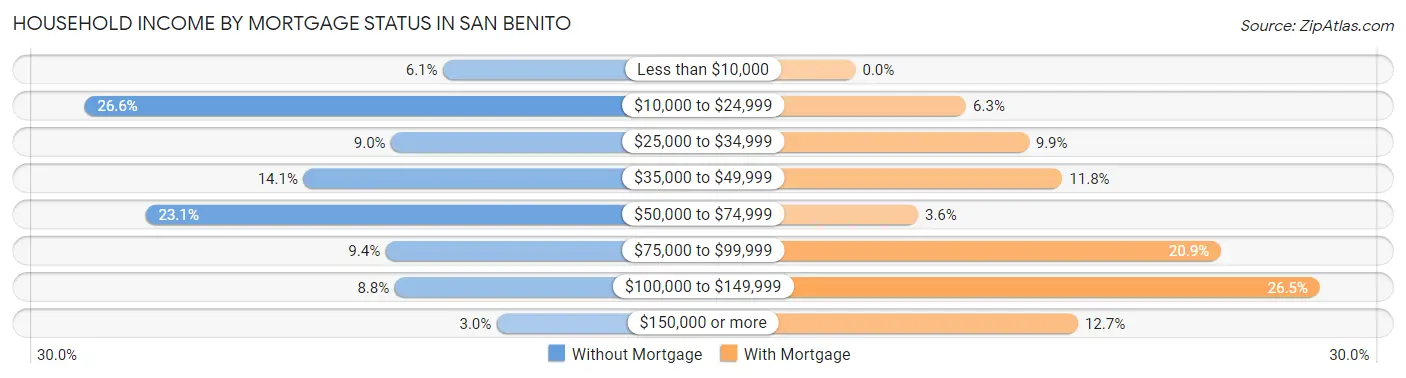
| Household Income | Without Mortgage | With Mortgage |
| Less than $10,000 | 235 (6.1%) | 0 (0.0%) |
| $10,000 to $24,999 | 1,029 (26.6%) | 92 (6.3%) |
| $25,000 to $34,999 | 350 (9.0%) | 144 (9.9%) |
| $35,000 to $49,999 | 544 (14.1%) | 172 (11.8%) |
| $50,000 to $74,999 | 894 (23.1%) | 52 (3.6%) |
| $75,000 to $99,999 | 362 (9.3%) | 304 (20.9%) |
| $100,000 to $149,999 | 342 (8.8%) | 386 (26.5%) |
| $150,000 or more | 116 (3.0%) | 185 (12.7%) |
| Total | 3,872 (100.0%) | 1,455 (100.0%) |
Property Value to Household Income Ratio in San Benito
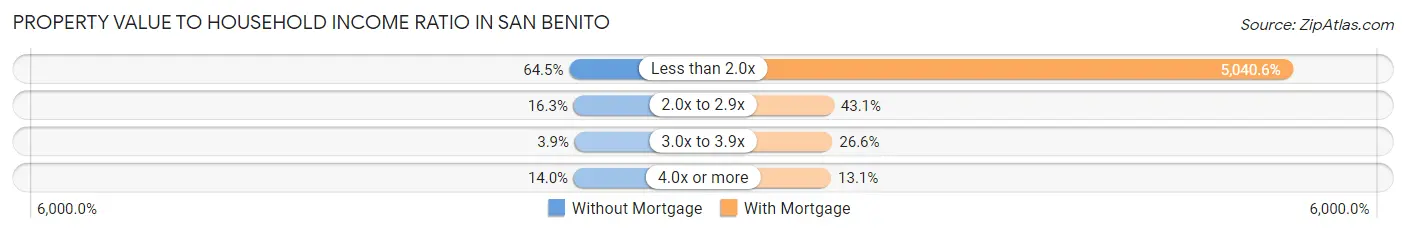
| Value-to-Income Ratio | Without Mortgage | With Mortgage |
| Less than 2.0x | 2,498 (64.5%) | 73,341 (5,040.6%) |
| 2.0x to 2.9x | 632 (16.3%) | 627 (43.1%) |
| 3.0x to 3.9x | 150 (3.9%) | 387 (26.6%) |
| 4.0x or more | 542 (14.0%) | 190 (13.1%) |
| Total | 3,872 (100.0%) | 1,455 (100.0%) |
Real Estate Taxes by Mortgage Status in San Benito
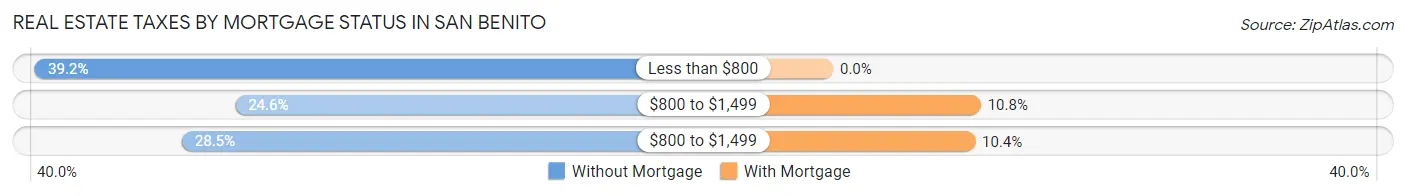
| Property Taxes | Without Mortgage | With Mortgage |
| Less than $800 | 1,519 (39.2%) | 0 (0.0%) |
| $800 to $1,499 | 953 (24.6%) | 157 (10.8%) |
| $800 to $1,499 | 1,104 (28.5%) | 151 (10.4%) |
| Total | 3,872 (100.0%) | 1,455 (100.0%) |
Health & Disability in San Benito
Health Insurance Coverage by Age in San Benito
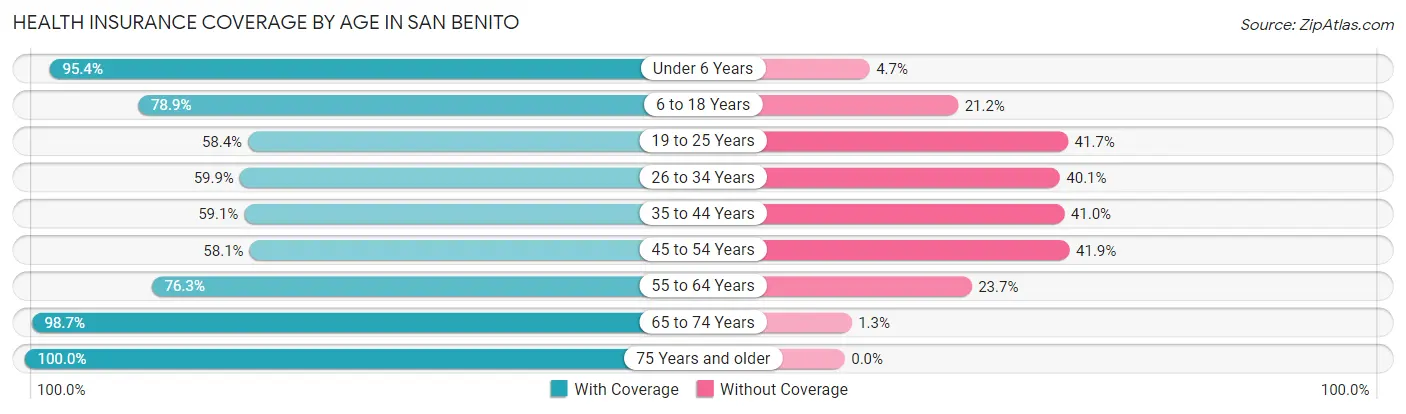
| Age Bracket | With Coverage | Without Coverage |
| Under 6 Years | 1,887 (95.4%) | 92 (4.6%) |
| 6 to 18 Years | 4,823 (78.8%) | 1,294 (21.1%) |
| 19 to 25 Years | 1,601 (58.4%) | 1,143 (41.6%) |
| 26 to 34 Years | 1,481 (59.9%) | 992 (40.1%) |
| 35 to 44 Years | 1,631 (59.1%) | 1,131 (40.9%) |
| 45 to 54 Years | 1,473 (58.1%) | 1,063 (41.9%) |
| 55 to 64 Years | 1,735 (76.3%) | 538 (23.7%) |
| 65 to 74 Years | 1,681 (98.7%) | 22 (1.3%) |
| 75 Years and older | 2,015 (100.0%) | 0 (0.0%) |
| Total | 18,327 (74.5%) | 6,275 (25.5%) |
Health Insurance Coverage by Citizenship Status in San Benito
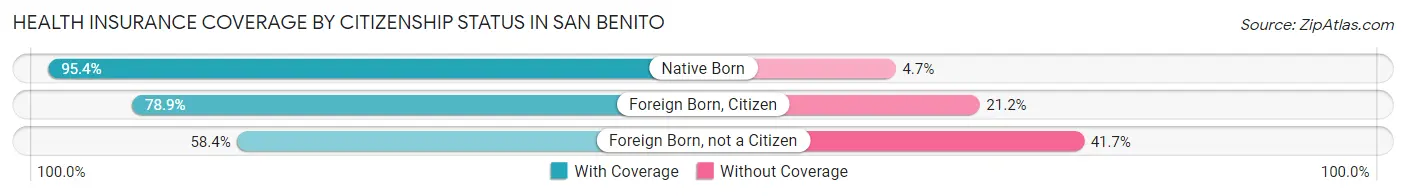
| Citizenship Status | With Coverage | Without Coverage |
| Native Born | 1,887 (95.4%) | 92 (4.6%) |
| Foreign Born, Citizen | 4,823 (78.8%) | 1,294 (21.1%) |
| Foreign Born, not a Citizen | 1,601 (58.4%) | 1,143 (41.6%) |
Health Insurance Coverage by Household Income in San Benito
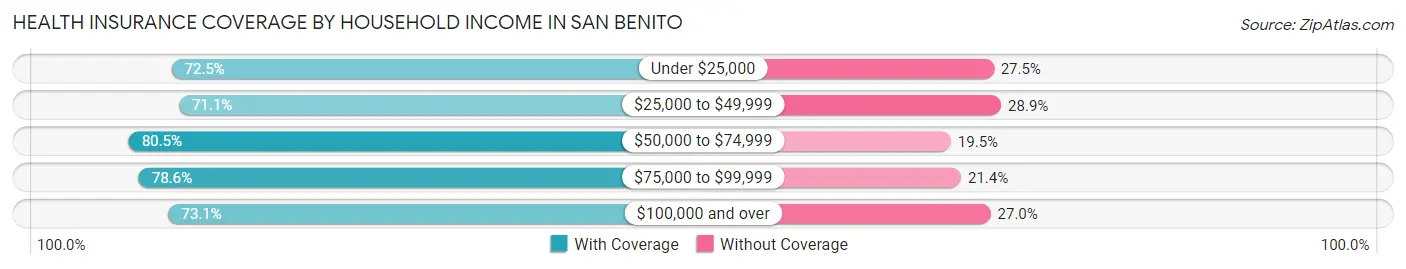
| Household Income | With Coverage | Without Coverage |
| Under $25,000 | 4,628 (72.5%) | 1,757 (27.5%) |
| $25,000 to $49,999 | 4,629 (71.1%) | 1,883 (28.9%) |
| $50,000 to $74,999 | 3,932 (80.5%) | 953 (19.5%) |
| $75,000 to $99,999 | 2,368 (78.6%) | 645 (21.4%) |
| $100,000 and over | 2,762 (73.1%) | 1,019 (27.0%) |
Public vs Private Health Insurance Coverage by Age in San Benito
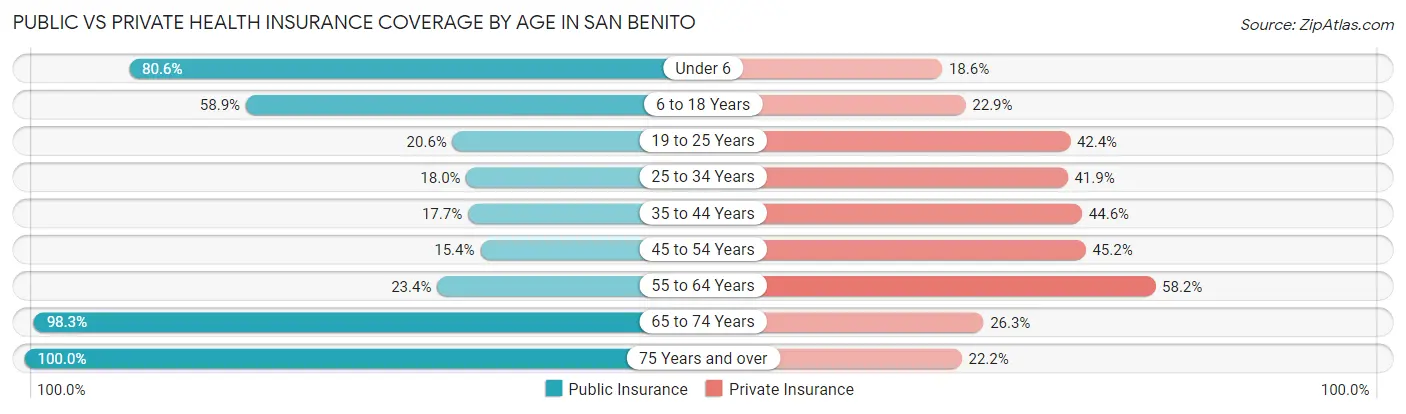
| Age Bracket | Public Insurance | Private Insurance |
| Under 6 | 1,595 (80.6%) | 368 (18.6%) |
| 6 to 18 Years | 3,604 (58.9%) | 1,403 (22.9%) |
| 19 to 25 Years | 564 (20.5%) | 1,162 (42.3%) |
| 25 to 34 Years | 445 (18.0%) | 1,036 (41.9%) |
| 35 to 44 Years | 489 (17.7%) | 1,231 (44.6%) |
| 45 to 54 Years | 391 (15.4%) | 1,147 (45.2%) |
| 55 to 64 Years | 532 (23.4%) | 1,322 (58.2%) |
| 65 to 74 Years | 1,674 (98.3%) | 447 (26.3%) |
| 75 Years and over | 2,015 (100.0%) | 448 (22.2%) |
| Total | 11,309 (46.0%) | 8,564 (34.8%) |
Disability Status by Sex by Age in San Benito
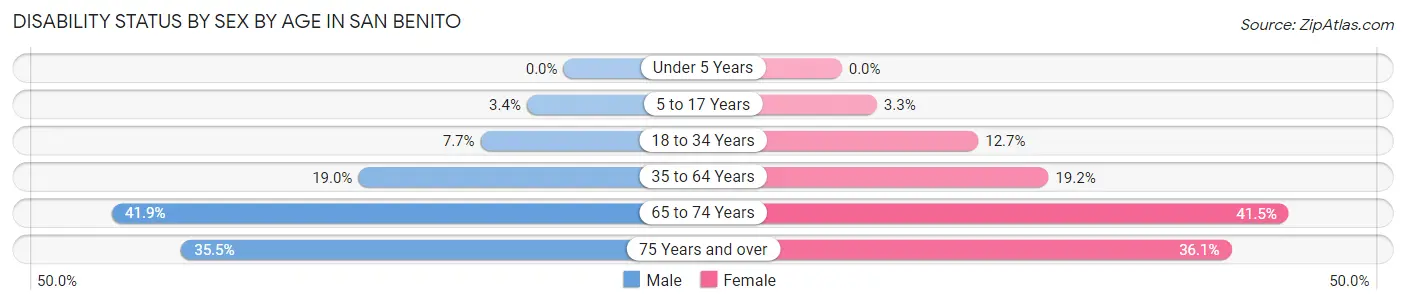
| Age Bracket | Male | Female |
| Under 5 Years | 0 (0.0%) | 0 (0.0%) |
| 5 to 17 Years | 109 (3.4%) | 81 (3.3%) |
| 18 to 34 Years | 261 (7.7%) | 327 (12.7%) |
| 35 to 64 Years | 708 (19.0%) | 739 (19.2%) |
| 65 to 74 Years | 296 (41.9%) | 413 (41.5%) |
| 75 Years and over | 268 (35.4%) | 455 (36.1%) |
Disability Class by Sex by Age in San Benito
Disability Class: Hearing Difficulty
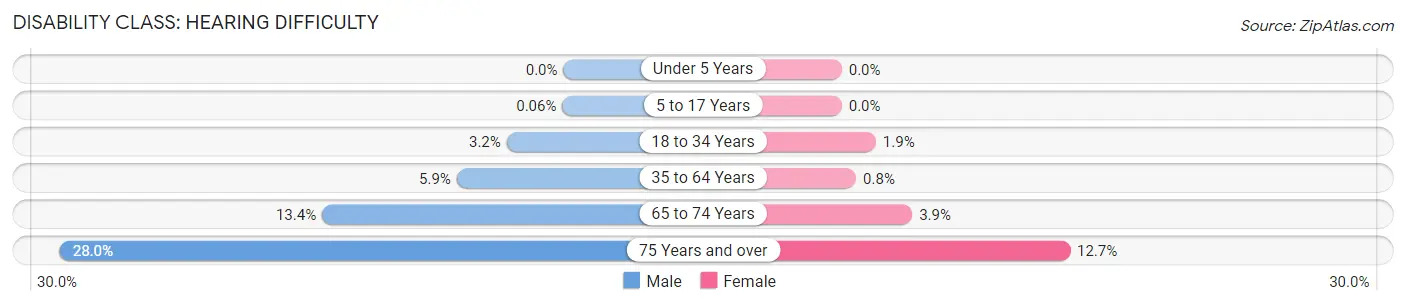
| Age Bracket | Male | Female |
| Under 5 Years | 0 (0.0%) | 0 (0.0%) |
| 5 to 17 Years | 2 (0.1%) | 0 (0.0%) |
| 18 to 34 Years | 107 (3.2%) | 49 (1.9%) |
| 35 to 64 Years | 221 (5.9%) | 31 (0.8%) |
| 65 to 74 Years | 95 (13.4%) | 39 (3.9%) |
| 75 Years and over | 212 (28.0%) | 160 (12.7%) |
Disability Class: Vision Difficulty
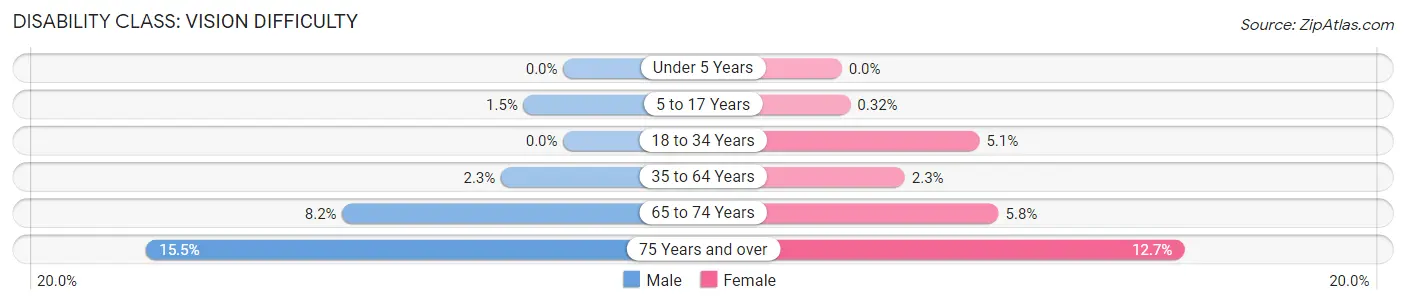
| Age Bracket | Male | Female |
| Under 5 Years | 0 (0.0%) | 0 (0.0%) |
| 5 to 17 Years | 47 (1.5%) | 8 (0.3%) |
| 18 to 34 Years | 0 (0.0%) | 132 (5.1%) |
| 35 to 64 Years | 86 (2.3%) | 90 (2.3%) |
| 65 to 74 Years | 58 (8.2%) | 58 (5.8%) |
| 75 Years and over | 117 (15.5%) | 160 (12.7%) |
Disability Class: Cognitive Difficulty
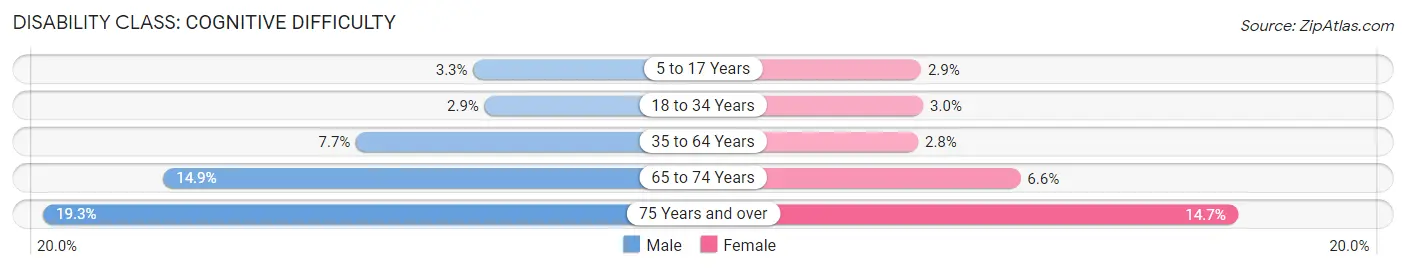
| Age Bracket | Male | Female |
| 5 to 17 Years | 107 (3.3%) | 73 (2.9%) |
| 18 to 34 Years | 99 (2.9%) | 78 (3.0%) |
| 35 to 64 Years | 286 (7.7%) | 109 (2.8%) |
| 65 to 74 Years | 105 (14.8%) | 66 (6.6%) |
| 75 Years and over | 146 (19.3%) | 185 (14.7%) |
Disability Class: Ambulatory Difficulty
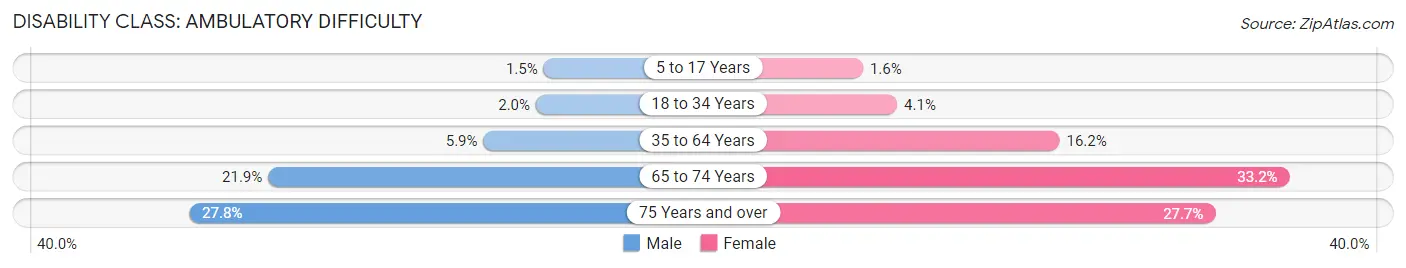
| Age Bracket | Male | Female |
| 5 to 17 Years | 47 (1.5%) | 39 (1.6%) |
| 18 to 34 Years | 69 (2.0%) | 106 (4.1%) |
| 35 to 64 Years | 221 (5.9%) | 623 (16.2%) |
| 65 to 74 Years | 155 (21.9%) | 331 (33.2%) |
| 75 Years and over | 210 (27.8%) | 349 (27.7%) |
Disability Class: Self-Care Difficulty
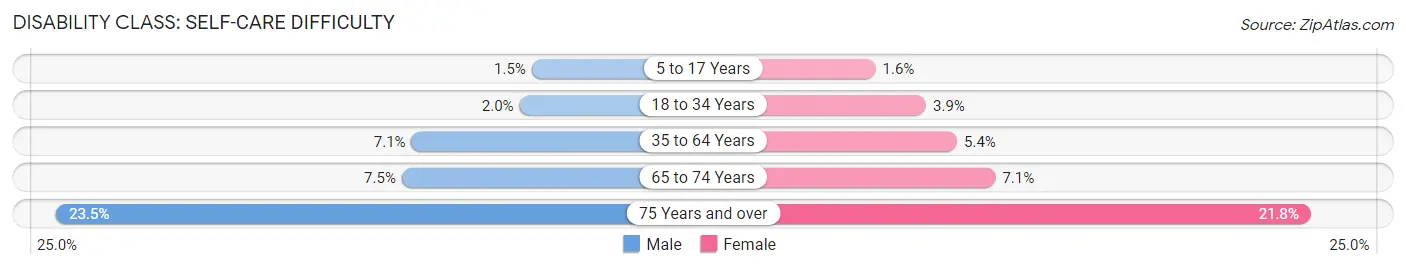
| Age Bracket | Male | Female |
| 5 to 17 Years | 47 (1.5%) | 39 (1.6%) |
| 18 to 34 Years | 69 (2.0%) | 101 (3.9%) |
| 35 to 64 Years | 262 (7.0%) | 206 (5.3%) |
| 65 to 74 Years | 53 (7.5%) | 71 (7.1%) |
| 75 Years and over | 178 (23.5%) | 274 (21.8%) |
Technology Access in San Benito
Computing Device Access in San Benito

| Device Type | # Households | % Households |
| Desktop or Laptop | 4,568 | 58.4% |
| Smartphone | 6,306 | 80.6% |
| Tablet | 3,685 | 47.1% |
| No Computing Device | 1,319 | 16.9% |
| Total | 7,822 | 100.0% |
Internet Access in San Benito
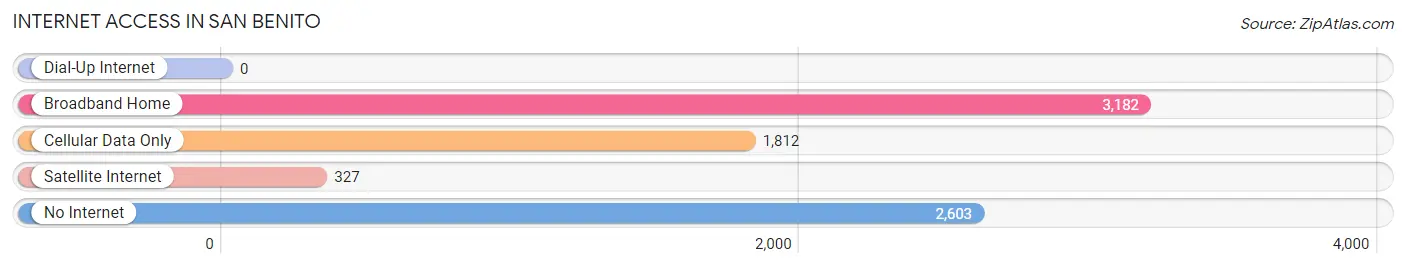
| Internet Type | # Households | % Households |
| Dial-Up Internet | 0 | 0.0% |
| Broadband Home | 3,182 | 40.7% |
| Cellular Data Only | 1,812 | 23.2% |
| Satellite Internet | 327 | 4.2% |
| No Internet | 2,603 | 33.3% |
| Total | 7,822 | 100.0% |
San Benito Summary
San Benito, Texas is a city located in Cameron County, Texas, United States. It is part of the Brownsville–Harlingen Metropolitan Statistical Area. The population was 24,250 at the 2010 census.
History
San Benito was founded in 1907 by a group of settlers from the Mexican state of Tamaulipas. The city was named after San Benito de Palermo, a Spanish saint. The settlers were attracted to the area by the fertile soil and abundant water supply.
The city was incorporated in 1911 and quickly became a center for agriculture and ranching. The city was also home to a large number of Mexican immigrants, who worked in the fields and on the ranches.
In the 1920s, San Benito began to experience a population boom as the railroad industry expanded in the area. The city was also home to a large number of oil refineries, which provided jobs for many of the city’s residents.
In the 1950s, San Benito experienced a period of rapid growth as the city’s population increased from 4,000 to over 20,000. This growth was largely due to the influx of Mexican immigrants, who were attracted to the city by the availability of jobs in the oil refineries and other industries.
Geography
San Benito is located in Cameron County, Texas, at the intersection of U.S. Highway 77 and State Highway 345. The city is situated on the banks of the Rio Grande, approximately 20 miles (32 km) north of Brownsville and 20 miles (32 km) south of Harlingen.
The city has a total area of 8.3 square miles (21.5 km2), of which 8.2 square miles (21.3 km2) is land and 0.1 square miles (0.2 km2) is water.
Economy
San Benito’s economy is largely based on agriculture and oil production. The city is home to a number of large agricultural operations, including vegetable farms, citrus groves, and cattle ranches.
The city is also home to several oil refineries, which provide jobs for many of the city’s residents. In addition, San Benito is home to a number of manufacturing plants, including a large plant that produces air conditioning units.
Demographics
As of the 2010 census, San Benito had a population of 24,250. The racial makeup of the city was 77.3% White, 0.7% African American, 0.3% Native American, 0.3% Asian, 0.1% Pacific Islander, 19.3% from other races, and 2.3% from two or more races. Hispanic or Latino of any race were 90.2% of the population.
The median income for a household in the city was $25,945, and the median income for a family was $30,945. The per capita income for the city was $13,845. About 24.3% of families and 28.2% of the population were below the poverty line, including 37.2% of those under age 18 and 20.2% of those age 65 or over.
San Benito is served by the San Benito Consolidated Independent School District. The city is also home to a number of private schools, including St. Joseph Catholic School and San Benito Christian Academy.
Common Questions
What is the Total Population of San Benito?
Total Population of San Benito is 24,766.
What is the Total Male Population of San Benito?
Total Male Population of San Benito is 12,546.
What is the Total Female Population of San Benito?
Total Female Population of San Benito is 12,220.
What is the Ratio of Males per 100 Females in San Benito?
There are 102.67 Males per 100 Females in San Benito.
What is the Ratio of Females per 100 Males in San Benito?
There are 97.40 Females per 100 Males in San Benito.
What is the Median Population Age in San Benito?
Median Population Age in San Benito is 31.5 Years.
What is the Average Family Size in San Benito
Average Family Size in San Benito is 3.8 People.
What is the Average Household Size in San Benito
Average Household Size in San Benito is 3.1 People.
What is Per Capita Income in San Benito?
Per Capita income in San Benito is $17,550.
What is the Median Family Income in San Benito?
Median Family Income in San Benito is $42,707.
What is the Median Household income in San Benito?
Median Household Income in San Benito is $38,100.
What is Income or Wage Gap in San Benito?
Income or Wage Gap in San Benito is 6.3%.
Women in San Benito earn 93.7 cents for every dollar earned by a man.
What is Family Income Deficit in San Benito?
Family Income Deficit in San Benito is $11,187.
Families that are below poverty line in San Benito earn $11,187 less on average than the poverty threshold level.
What is Inequality or Gini Index in San Benito?
Inequality or Gini Index in San Benito is 0.44.
How Large is the Labor Force in San Benito?
There are 9,057 People in the Labor Forcein in San Benito.
What is the Percentage of People in the Labor Force in San Benito?
50.3% of People are in the Labor Force in San Benito.
What is the Unemployment Rate in San Benito?
Unemployment Rate in San Benito is 5.3%.